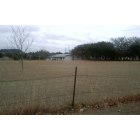
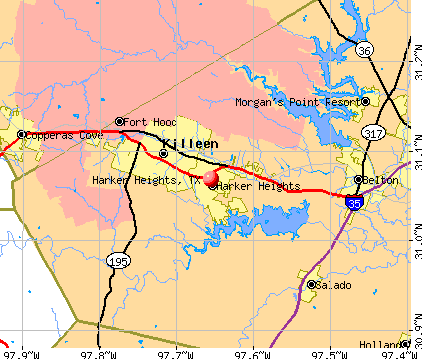
Harker Heights, Texas
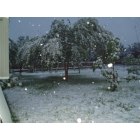
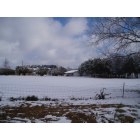
Harker Heights: Snow in Harker Heights
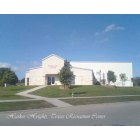
Harker Heights: City Recreation Center
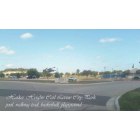
Harker Heights: Carl Levine, one of the two City Parks
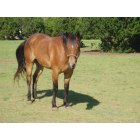
Harker Heights: Texas horse
Harker Heights: Old Texas home
Harker Heights: Old Texas home in the snow
Harker Heights: Snow in Harker Heights
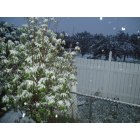
Harker Heights: Snow in Harker Heights
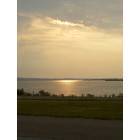
Harker Heights: Sunrise over Stillhouse Hollow Lake from Dana Peak Park.
- add
your
Submit your own pictures of this city and show them to the world
- OSM Map
- General Map
- Google Map
- MSN Map
Population change since 2000: +97.0%
| Males: 16,960 | |
| Females: 17,142 |
| Median resident age: | 35.3 years |
| Texas median age: | 35.6 years |
Zip codes: 76543, 76548, 76559.
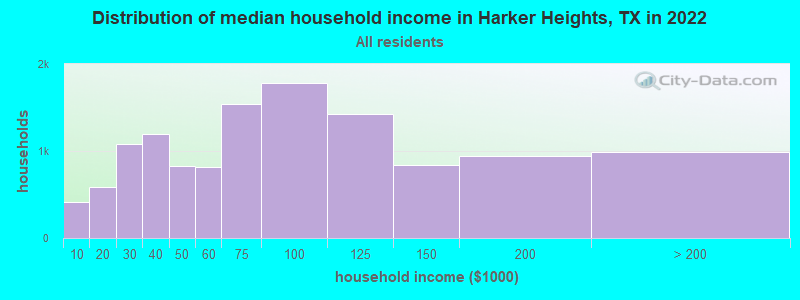
Harker Heights Zip Code Map| Harker Heights: | $71,429 |
| TX: | $72,284 |
Estimated per capita income in 2022: $35,233 (it was $20,061 in 2000)
Harker Heights city income, earnings, and wages data
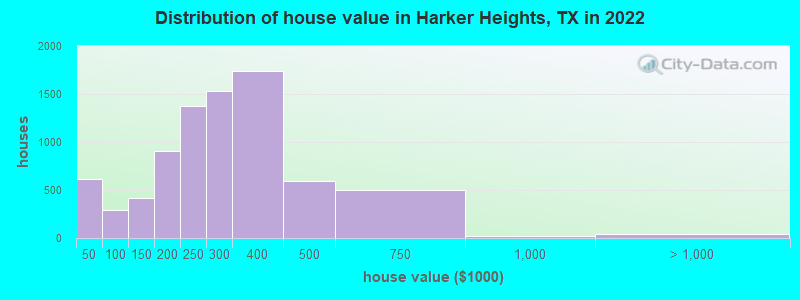
Estimated median house or condo value in 2022: $286,805 (it was $96,800 in 2000)
| Harker Heights: | $286,805 |
| TX: | $275,400 |
Mean prices in 2022: all housing units: $261,199; detached houses: $273,336; townhouses or other attached units: $193,729; in 2-unit structures: $216,220; in 3-to-4-unit structures: $80,474; in 5-or-more-unit structures: $222,824; mobile homes: $108,883; occupied boats, rvs, vans, etc.: $139,118
Median gross rent in 2022: $1,103.
Harker Heights, TX residents, houses, and apartments details
(7.7% for White Non-Hispanic residents, 17.5% for Black residents, 19.2% for Hispanic or Latino residents, 34.0% for American Indian residents, 4.1% for Native Hawaiian and other Pacific Islander residents, 29.0% for other race residents, 11.4% for two or more races residents)
Detailed information about poverty and poor residents in Harker Heights, TX


Compare current foreclosures near Harker Heights, TX:
| Photo | Address | Area | Beds / Baths | Price | Details |
|---|---|---|---|---|---|

|
#1
Llama Trl
Harker Heights, TX 76548
|
4,954 sq. feet
|
- baths - beds |
show details | |

|
#2
Wickiup Trl
Harker Heights, TX 76548
|
- sq. feet
|
- baths - beds |
show details | |

|
#3
Lancaster Dr
Belton, TX 76513
|
2,085 sq. feet
|
2 baths 3 beds |
show details | |

|
#4
Halter Dr
Copperas Cove, TX 76522
|
1,166 sq. feet
|
2 baths 3 beds |
show details | |

|
#5
Chisholm Trl
Temple, TX 76504
|
1,569 sq. feet
|
2 baths 3 beds |
show details | |

|
#6
Trail Crest Dr
Kln-Harker Heights, TX 76548
|
2,599 sq. feet
|
2 baths 4 beds |
show details | |

|
#7
N Beal St
Belton, TX 76513
|
2,824 sq. feet
|
2 baths 4 beds |
show details | |

|
#8
Pilgram Dr
Killeen, TX 76543
|
1,082 sq. feet
|
1 baths 3 beds |
show details | |

|
#9
Eagle Trl
Copperas Cove, TX 76522
|
3,474 sq. feet
|
3 baths 4 beds |
show details | |

|
#10
Rockwall Dr
Killeen, TX 76549
|
1,718 sq. feet
|
2 baths 4 beds |
show details |
| Photo | Address | Area | Beds / Baths | Price | Details |
|---|---|---|---|---|---|

|
#11
Jordan Dr
Belton, TX 76513
|
- sq. feet
|
2 baths 3 beds |
show details | |

|
#12
Starlight Dr
Temple, TX 76502
|
- sq. feet
|
2 baths 3 beds |
show details | |

|
#13
Salado Dr
Temple, TX 76502
|
- sq. feet
|
2 baths 4 beds |
show details | |

|
#14
Carmen St
Killeen, TX 76541
|
- sq. feet
|
2 baths 4 beds |
show details | |

|
#15
Prather Dr
Killeen, TX 76541
|
2,283 sq. feet
|
2 baths - beds |
show details | |

|
#16
Embers Dr
Killeen, TX 76542
|
- sq. feet
|
2 baths 4 beds |
show details | |

|
#17
Alta Mira Dr
Killeen, TX 76541
|
- sq. feet
|
2 baths 4 beds |
show details | |

|
#18
Opal Rd
Killeen, TX 76543
|
2,251 sq. feet
|
1 baths - beds |
show details | |

|
#19
Caprice Dr
Killeen, TX 76543
|
1,281 sq. feet
|
2 baths - beds |
show details | |

|
#20
Red Oak Dr
Kln-Harker Heights, TX 76548
|
1,958 sq. feet
|
2 baths - beds |
show details |
| Photo | Address | Area | Beds / Baths | Price | Details |
|---|---|---|---|---|---|

|
#21
Stratford Dr
Temple, TX 76502
|
- sq. feet
|
2 baths 3 beds |
show details | |

|
#22
W Mark Rd
Kln-Harker Heights, TX 76548
|
1,300 sq. feet
|
2 baths - beds |
show details | |

|
#23
Northern Dancer Dr
Copperas Cove, TX 76522
|
1,618 sq. feet
|
2 baths - beds |
show details | |

|
#24
Hinkle Ave
Killeen, TX 76549
|
- sq. feet
|
2 baths 2 beds |
show details | |

|
#25
Lake Charles Ave
Killeen, TX 76543
|
- sq. feet
|
2 baths 3 beds |
show details | |

|
#26
Scott Dr
Copperas Cove, TX 76522
|
2,064 sq. feet
|
2 baths - beds |
show details | |

|
#27
Ruiz Dr
Killeen, TX 76543
|
- sq. feet
|
2 baths 2 beds |
show details | |

|
#28
Goodnight Dr
Killeen, TX 76541
|
- sq. feet
|
1 baths 3 beds |
show details | |

|
#29
Double Creek Dr
Jarrell, TX 76537
|
1,700 sq. feet
|
2 baths - beds |
show details | |

|
#30
Swope Dr
Killeen, TX 76541
|
- sq. feet
|
2 baths 4 beds |
show details |
| Photo | Address | Area | Beds / Baths | Price | Details |
|---|---|---|---|---|---|

|
#31
Shiela Ct
Copperas Cove, TX 76522
|
1,766 sq. feet
|
2 baths - beds |
show details | |

|
#32
Johnson Dr
Killeen, TX 76549
|
- sq. feet
|
2 baths 3 beds |
show details | |

|
#33
Bermuda Dr
Killeen, TX 76549
|
- sq. feet
|
2 baths 3 beds |
show details | |

|
#34
Bond St
Copperas Cove, TX 76522
|
2,185 sq. feet
|
2 baths - beds |
show details | |

|
#35
Cottonwood Ln
Temple, TX 76502
|
- sq. feet
|
2 baths 5 beds |
show details | |

|
#36
Katelyn Cir
Copperas Cove, TX 76522
|
1,565 sq. feet
|
2 baths - beds |
show details | |

|
#37
Indian Camp Trl
Copperas Cove, TX 76522
|
1,708 sq. feet
|
2 baths - beds |
show details | |

|
#38
Shady Hill Dr
Temple, TX 76502
|
- sq. feet
|
2 baths 3 beds |
show details | |

|
#39
Dixon Cir
Copperas Cove, TX 76522
|
1,580 sq. feet
|
2 baths - beds |
show details | |

|
#40
N 7th St # B
Copperas Cove, TX 76522
|
2,176 sq. feet
|
3 baths - beds |
show details |
| Photo | Address | Area | Beds / Baths | Price | Details |
|---|---|---|---|---|---|

|
#41
Jeffery Ln
Copperas Cove, TX 76522
|
1,933 sq. feet
|
2 baths - beds |
show details | |

|
#42
Breaker Cir
Temple, TX 76502
|
- sq. feet
|
2 baths 3 beds |
show details | |

|
#43
Meggs Blvd
Copperas Cove, TX 76522
|
1,416 sq. feet
|
1 baths - beds |
show details | |

|
#44
Tanner Rd
Copperas Cove, TX 76522
|
1,463 sq. feet
|
2 baths - beds |
show details | |

|
#45
Williams St
Copperas Cove, TX 76522
|
1,367 sq. feet
|
1 baths - beds |
show details | |

|
#46
Merle Dr
Copperas Cove, TX 76522
|
1,832 sq. feet
|
2 baths - beds |
show details | |

|
#47
Shawn Dr
Killeen, TX 76542
|
- sq. feet
|
2 baths 3 beds |
show details | |

|
#48
Turquoise
Killeen, TX 76542
|
1,685 sq. feet
|
- baths - beds |
show details | |

|
#49
S Roy Reynolds Dr
Kln-Harker Heights, TX 76548
|
- sq. feet
|
2 baths 4 beds |
show details | |

|
Check over 1 million property listings on Foreclosure.com!
|
browse all offers | |||


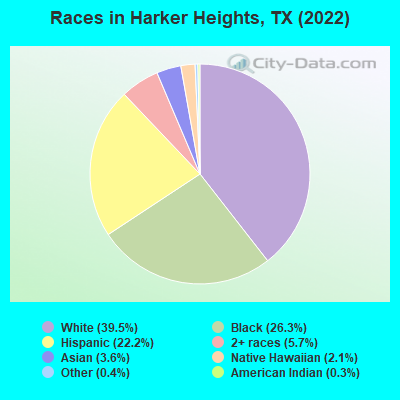
- 13,61039.5%White alone
- 9,06526.3%Black alone
- 7,63222.2%Hispanic
- 1,9645.7%Two or more races
- 1,2393.6%Asian alone
- 7132.1%Native Hawaiian and Other
Pacific Islander alone - 1470.4%Other race alone
- 870.3%American Indian alone
Races in Harker Heights detailed stats: ancestries, foreign born residents, place of birth
According to our research of Texas and other state lists, there were 52 registered sex offenders living in Harker Heights, Texas as of June 19, 2024.
The ratio of all residents to sex offenders in Harker Heights is 568 to 1.
The ratio of registered sex offenders to all residents in this city is lower than the state average.
Type |
2009 |
2010 |
2011 |
2012 |
2013 |
2014 |
2015 |
2016 |
2017 |
2018 |
2019 |
2020 |
2021 |
2022 |
|---|---|---|---|---|---|---|---|---|---|---|---|---|---|---|
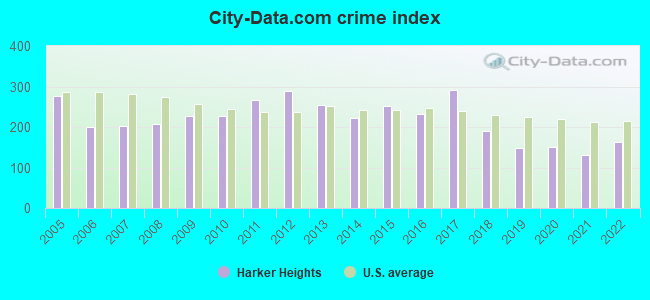
| Murders (per 100,000) | 0 (0.0) | 1 (3.7) | 0 (0.0) | 0 (0.0) | 0 (0.0) | 0 (0.0) | 2 (6.9) | 0 (0.0) | 5 (16.5) | 2 (6.3) | 0 (0.0) | 5 (15.1) | 1 (3.0) | 3 (8.8) |
| Rapes (per 100,000) | 16 (60.5) | 9 (33.7) | 9 (33.0) | 13 (47.2) | 8 (28.4) | 12 (42.1) | 23 (79.5) | 14 (47.3) | 23 (76.0) | 12 (37.8) | 14 (43.0) | 11 (33.2) | 16 (47.4) | 20 (58.8) |
| Robberies (per 100,000) | 17 (64.2) | 8 (30.0) | 19 (69.7) | 20 (72.6) | 25 (88.9) | 27 (94.8) | 17 (58.8) | 24 (81.1) | 24 (79.3) | 22 (69.4) | 17 (52.3) | 14 (42.3) | 15 (44.4) | 8 (23.5) |
| Assaults (per 100,000) | 23 (86.9) | 27 (101.1) | 43 (157.7) | 90 (326.8) | 57 (202.7) | 37 (129.9) | 37 (127.9) | 34 (114.9) | 26 (85.9) | 27 (85.1) | 34 (104.5) | 26 (78.6) | 31 (91.8) | 45 (132.3) |
| Burglaries (per 100,000) | 204 (770.7) | 248 (928.8) | 317 (1,163) | 293 (1,064) | 226 (803.6) | 158 (554.7) | 150 (518.4) | 146 (493.2) | 130 (429.7) | 86 (271.2) | 68 (209.1) | 64 (193.4) | 51 (151.1) | 68 (200.0) |
| Thefts (per 100,000) | 558 (2,108) | 607 (2,273) | 645 (2,366) | 569 (2,066) | 687 (2,443) | 618 (2,170) | 617 (2,132) | 759 (2,564) | 852 (2,816) | 620 (1,955) | 420 (1,291) | 314 (948.9) | 284 (841.4) | 342 (1,006) |
| Auto thefts (per 100,000) | 9 (34.0) | 25 (93.6) | 41 (150.4) | 25 (90.8) | 37 (131.6) | 34 (119.4) | 31 (107.1) | 39 (131.8) | 52 (171.9) | 43 (135.6) | 43 (132.2) | 54 (163.2) | 47 (139.3) | 44 (129.4) |
| Arson (per 100,000) | 0 (0.0) | 3 (11.2) | 0 (0.0) | 2 (7.3) | 1 (3.6) | 4 (14.0) | 1 (3.5) | 2 (6.8) | 4 (13.2) | 2 (6.3) | 4 (12.3) | 4 (12.1) | 3 (8.9) | 1 (2.9) |
| City-Data.com crime index | 226.0 | 227.1 | 266.9 | 289.3 | 254.4 | 223.3 | 250.8 | 232.8 | 291.4 | 188.8 | 147.9 | 149.8 | 130.9 | 162.8 |
The City-Data.com crime index weighs serious crimes and violent crimes more heavily. Higher means more crime, U.S. average is 246.1. It adjusts for the number of visitors and daily workers commuting into cities.
Crime rate in Harker Heights detailed stats: murders, rapes, robberies, assaults, burglaries, thefts, arson
Full-time law enforcement employees in 2021, including police officers: 61 (45 officers - 34 male; 11 female).
| Officers per 1,000 residents here: | 1.33 |
| Texas average: | 2.07 |
 Recent articles from our blog. Our writers, many of them Ph.D. graduates or candidates, create easy-to-read articles on a wide variety of topics.


Latest news from Harker Heights, TX collected exclusively by city-data.com from local newspapers, TV, and radio stations
Ancestries: American (15.7%), German (6.0%), Dutch (2.8%), Irish (2.2%), European (1.9%), Jamaican (1.6%).
Current Local Time: CST time zone
Elevation: 765 feet
Land area: 12.8 square miles.
Population density: 2,673 people per square mile (average).
3,486 residents are foreign born (3.7% Latin America, 2.9% Asia, 2.2% Europe).
| This city: | 10.1% |
| Texas: | 17.1% |
Median real estate property taxes paid for housing units with mortgages in 2022: $3,974 (1.3%)
Median real estate property taxes paid for housing units with no mortgage in 2022: $3,332 (1.4%)
Nearest city with pop. 50,000+: Killeen, TX  (4.9 miles , pop. 86,911).
Nearest city with pop. 200,000+: Austin, TX (53.4 miles , pop. 656,562).
Nearest city with pop. 1,000,000+: San Antonio, TX (123.0 miles , pop. 1,144,646).
Nearest cities:
), ), Latitude: 31.07 N, Longitude: 97.66 W
Daytime population change due to commuting: -7,478 (-21.7%)
Workers who live and work in this city: 3,389 (20.0%)
Area code commonly used in this area: 254

Harker Heights, Texas accommodation & food services, waste management - Economy and Business Data
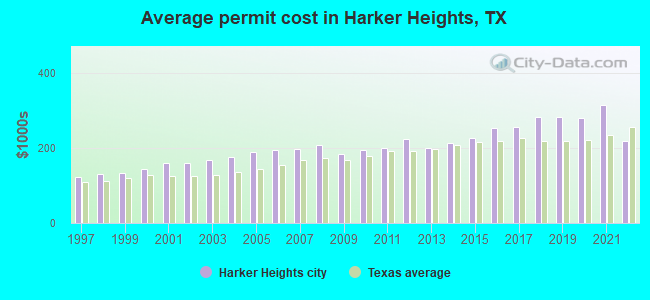
Single-family new house construction building permits:
- 2022: 97 buildings, average cost: $217,800
- 2021: 160 buildings, average cost: $315,900
- 2020: 84 buildings, average cost: $279,200
- 2019: 142 buildings, average cost: $283,200
- 2018: 158 buildings, average cost: $283,500
- 2017: 129 buildings, average cost: $255,200
- 2016: 147 buildings, average cost: $254,000
- 2015: 211 buildings, average cost: $226,700
- 2014: 203 buildings, average cost: $214,400
- 2013: 194 buildings, average cost: $199,500
- 2012: 204 buildings, average cost: $222,900
- 2011: 141 buildings, average cost: $200,800
- 2010: 176 buildings, average cost: $194,500
- 2009: 176 buildings, average cost: $183,900
- 2008: 185 buildings, average cost: $209,400
- 2007: 303 buildings, average cost: $196,800
- 2006: 389 buildings, average cost: $195,000
- 2005: 553 buildings, average cost: $189,600
- 2004: 349 buildings, average cost: $175,000
- 2003: 308 buildings, average cost: $166,500
- 2002: 193 buildings, average cost: $160,900
- 2001: 183 buildings, average cost: $161,300
- 2000: 140 buildings, average cost: $144,400
- 1999: 121 buildings, average cost: $133,400
- 1998: 99 buildings, average cost: $131,300
- 1997: 63 buildings, average cost: $122,800
| Here: | 3.8% |
| Texas: | 3.5% |
Population change in the 1990s: +4,464 (+34.8%).
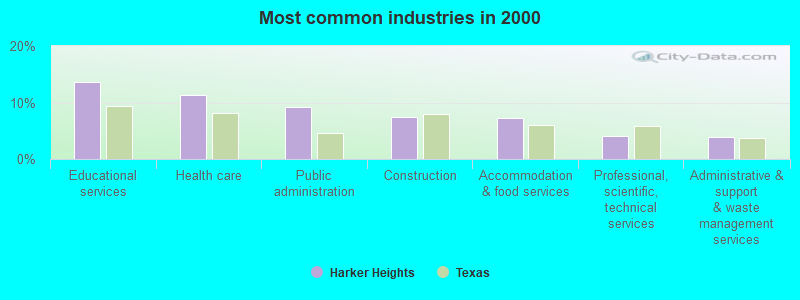
- Educational services (13.6%)
- Health care (11.3%)
- Public administration (9.2%)
- Construction (7.4%)
- Accommodation & food services (7.2%)
- Professional, scientific, technical services (4.1%)
- Administrative & support & waste management services (3.8%)
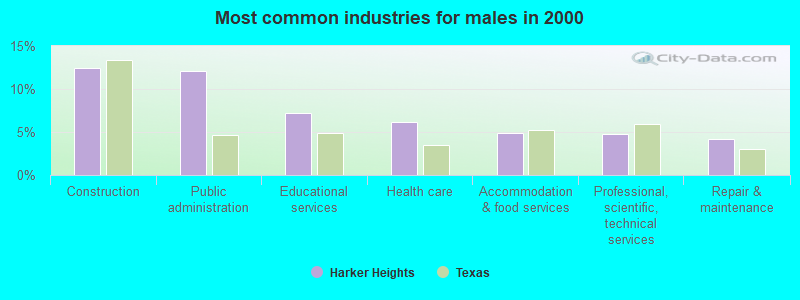
- Construction (12.4%)
- Public administration (12.1%)
- Educational services (7.2%)
- Health care (6.1%)
- Accommodation & food services (4.9%)
- Professional, scientific, technical services (4.8%)
- Repair & maintenance (4.2%)
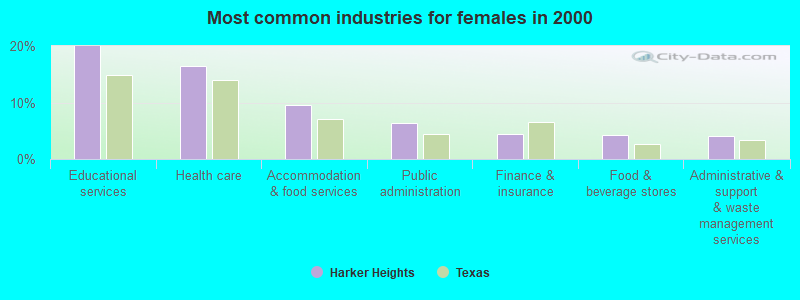
- Educational services (20.0%)
- Health care (16.5%)
- Accommodation & food services (9.5%)
- Public administration (6.4%)
- Finance & insurance (4.4%)
- Food & beverage stores (4.2%)
- Administrative & support & waste management services (4.1%)
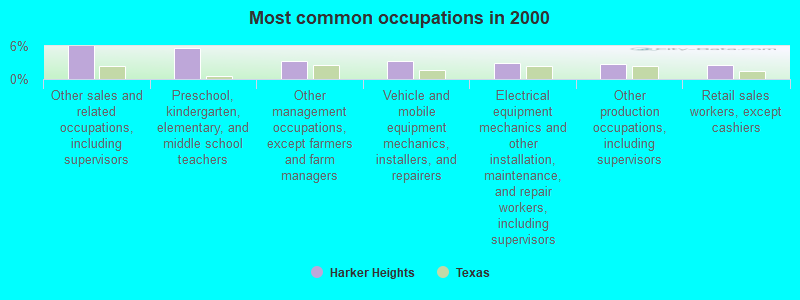
- Other sales and related occupations, including supervisors (5.9%)
- Preschool, kindergarten, elementary, and middle school teachers (5.6%)
- Other management occupations, except farmers and farm managers (3.3%)
- Vehicle and mobile equipment mechanics, installers, and repairers (3.3%)
- Electrical equipment mechanics and other installation, maintenance, and repair workers, including supervisors (2.9%)
- Other production occupations, including supervisors (2.7%)
- Retail sales workers, except cashiers (2.6%)
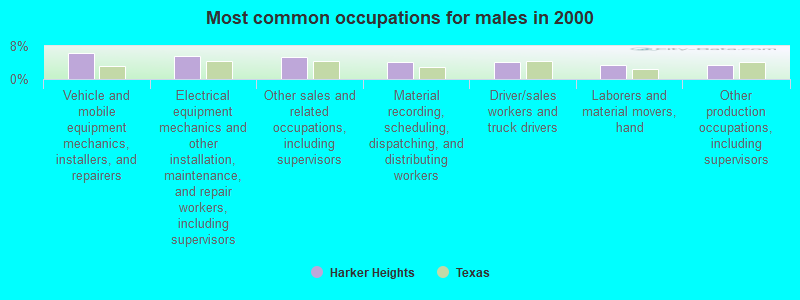
- Vehicle and mobile equipment mechanics, installers, and repairers (6.2%)
- Electrical equipment mechanics and other installation, maintenance, and repair workers, including supervisors (5.5%)
- Other sales and related occupations, including supervisors (5.3%)
- Material recording, scheduling, dispatching, and distributing workers (4.2%)
- Driver/sales workers and truck drivers (4.1%)
- Laborers and material movers, hand (3.4%)
- Other production occupations, including supervisors (3.4%)
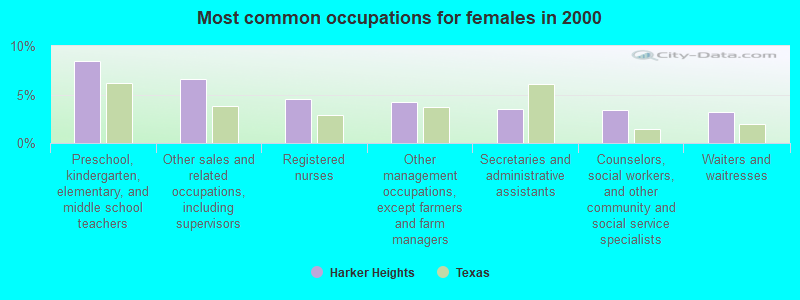
- Preschool, kindergarten, elementary, and middle school teachers (8.5%)
- Other sales and related occupations, including supervisors (6.6%)
- Registered nurses (4.5%)
- Other management occupations, except farmers and farm managers (4.2%)
- Secretaries and administrative assistants (3.5%)
- Counselors, social workers, and other community and social service specialists (3.4%)
- Waiters and waitresses (3.2%)
Average climate in Harker Heights, Texas
Based on data reported by over 4,000 weather stations


|
|


(lower is better)
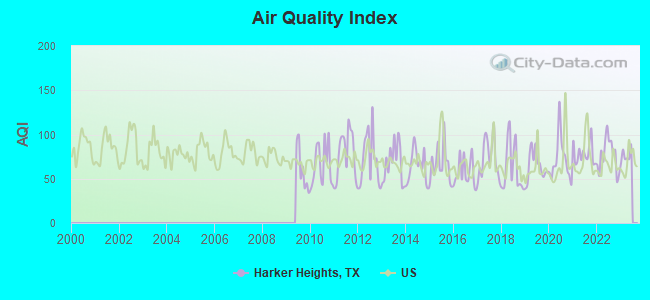
Air Quality Index (AQI) level in 2022 was 76.6. This is about average.
| City: | 76.6 |
| U.S.: | 72.6 |
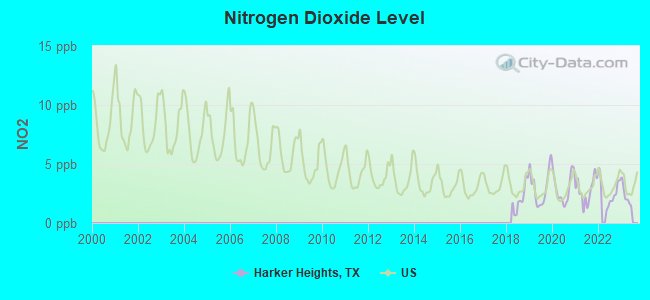
Nitrogen Dioxide (NO2) [ppb] level in 2022 was 2.64. This is significantly better than average. Closest monitor was 2.0 miles away from the city center.
| City: | 2.64 |
| U.S.: | 5.11 |
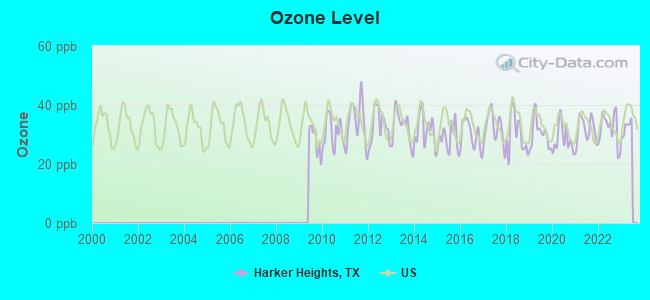
Ozone [ppb] level in 2022 was 32.0. This is about average. Closest monitor was 2.0 miles away from the city center.
| City: | 32.0 |
| U.S.: | 33.3 |
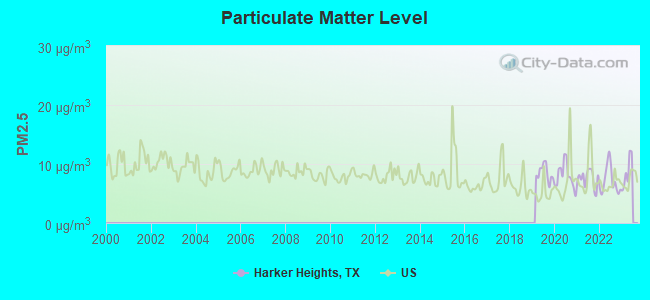
Particulate Matter (PM2.5) [µg/m3] level in 2022 was 7.20. This is about average. Closest monitor was 13.8 miles away from the city center.
| City: | 7.20 |
| U.S.: | 8.11 |
Tornado activity:
Harker Heights-area historical tornado activity is slightly above Texas state average. It is 56% greater than the overall U.S. average.
On 5/27/1997, a category F5 (max. wind speeds 261-318 mph) tornado 17.3 miles away from the Harker Heights city center killed 27 people and injured 12 people and caused $40 million in damages.
On 5/6/1973, a category F5 tornado 40.2 miles away from the city center .
Earthquake activity:
Harker Heights-area historical earthquake activity is significantly above Texas state average. It is 284% greater than the overall U.S. average.On 6/16/1978 at 11:46:54, a magnitude 5.3 (4.4 MB, 4.6 UK, 5.3 ML, Class: Moderate, Intensity: VI - VII) earthquake occurred 227.3 miles away from the city center
On 11/6/2011 at 03:53:10, a magnitude 5.7 (5.7 MW, Depth: 3.2 mi) earthquake occurred 313.0 miles away from Harker Heights center
On 10/20/2011 at 12:24:41, a magnitude 4.8 (4.8 MW, Depth: 3.1 mi, Class: Light, Intensity: IV - V) earthquake occurred 154.5 miles away from Harker Heights center
On 4/14/1995 at 00:32:56, a magnitude 5.7 (5.6 MB, 5.7 MS, 5.7 MW, Depth: 11.1 mi) earthquake occurred 344.1 miles away from Harker Heights center
On 9/3/2016 at 12:02:44, a magnitude 5.8 (5.8 MW, Depth: 3.5 mi) earthquake occurred 372.8 miles away from the city center
On 5/17/2012 at 08:12:00, a magnitude 4.8 (4.8 MW, Depth: 3.1 mi) earthquake occurred 202.7 miles away from the city center
Magnitude types: body-wave magnitude (MB), local magnitude (ML), surface-wave magnitude (MS), moment magnitude (MW)
Natural disasters:
The number of natural disasters in Bell County (17) is near the US average (15).Major Disasters (Presidential) Declared: 5
Emergencies Declared: 8
Causes of natural disasters: Fires: 7, Hurricanes: 4, Storms: 4, Floods: 3, Tornadoes: 2, Other: 2 (Note: some incidents may be assigned to more than one category).

Hospitals and medical centers in Harker Heights:
- HERITAGE CARE HOSPICE LLC (451 EAST CENTRAL TEXAS EXPRESSWAY C)
- SETON MEDICAL CENTER HARKER HEIGHTS (Proprietary, provides emergency services, 850 W CENTRAL TEXAS EXPRESSWAY)
- ABSOLUTE HOME CARE (813 S AMY LANE #104)
- FAMILY CARE HOME HEALTH (581 PAN AMERICAN DRIVE SUITE #2)
- INDIAN OAKS LIVING CENTER (415 INDIAN OAKS DR)
Heliports located in Harker Heights:
Amtrak stations near Harker Heights:
- 6 miles: KILLEEN (ARROW TRAILWAYS, 200 E. AVENUE C) - Bus Station
- 9 miles: FORT HOOD (BLDG. 108, 76 TANK BATTALION AVE.) - Bus Station
- 19 miles: TEMPLE (315 WEST AVE. B) . Services: ticket office, partially wheelchair accessible, enclosed waiting area, public restrooms, public payphones, vending machines, free short-term parking, free long-term parking, call for taxi service, intercity bus service, public transit connection.
Colleges/universities with over 2000 students nearest to Harker Heights:
- Central Texas College (about 10 miles; Killeen, TX; Full-time enrollment: 15,911)
- University of Mary Hardin-Baylor (about 12 miles; Belton, TX; FT enrollment: 2,885)
- Temple College (about 19 miles; Temple, TX; FT enrollment: 3,796)
- Baylor University (about 46 miles; Waco, TX; FT enrollment: 14,800)
- McLennan Community College (about 46 miles; Waco, TX; FT enrollment: 6,673)
- Concordia University-Texas (about 47 miles; Austin, TX; FT enrollment: 2,192)
- Austin Community College District (about 51 miles; Austin, TX; FT enrollment: 25,957)
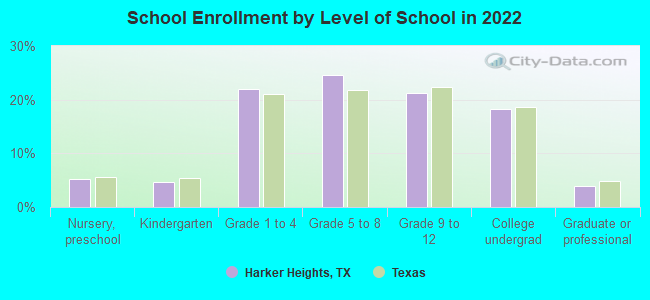
Public high school in Harker Heights:
- HARKER HEIGHTS H S (Students: 2,546, Location: 1001 FM 2410, Grades: 9-12)
Public elementary/middle schools in Harker Heights:
- SKIPCHA EL (Students: 897, Location: 515 PROSPECTOR TRL, Grades: PK-5)
- UNION GROVE MIDDLE (Students: 872, Location: 101 E IOWA DR, Grades: 6-8)
- EASTERN HILLS MIDDLE (Students: 785, Location: 300 INDIAN TRL, Grades: 6-8)
- HARKER HEIGHTS EL (Students: 770, Location: 726 S ANN BLVD, Grades: PK-5)
- MOUNTAIN VIEW EL (Students: 744, Location: 500 MOUNTAIN LION RD, Grades: PK-5)
Points of interest:
Notable locations in Harker Heights: Harker Heights Volunteer Fire Department Station 2 (A), Harker Heights Fire Department and Emergency Medical Services (B). Display/hide their locations on the map
Churches in Harker Heights include: Zion Temple Church of God in Christ (A), Mountain View Baptist Church (B), Deliverance Ministries Household of Faith Church of The Living God (C). Display/hide their locations on the map
Streams, rivers, and creeks: Hay Branch (A). Display/hide its location on the map
Parks in Harker Heights include: Kern Park (1), Cox Park (2). Display/hide their locations on the map
Drinking water stations with addresses in Harker Heights and their reported violations in the past:
CENTRAL TEXAS WSC (Population served: 0, Surface water):Past monitoring violations:
- Monthly Turbidity Exceed (Enhanced SWTR) - In AUG-2007, Contaminant: IESWTR. Follow-up actions: St Public Notif received (SEP-04-2007), St Public Notif requested (SEP-28-2007), St Violation/Reminder Notice (SEP-28-2007), St Compliance achieved (OCT-01-2007)
- Monthly Turbidity Exceed (Enhanced SWTR) - In AUG-2007, Contaminant: IESWTR. Follow-up actions: St Public Notif received (SEP-04-2007), St Public Notif requested (SEP-28-2007), St Violation/Reminder Notice (SEP-28-2007), St Compliance achieved (OCT-01-2007)
- One routine major monitoring violation
| This city: | 2.8 people |
| Texas: | 2.8 people |
| This city: | 75.2% |
| Whole state: | 69.9% |
| This city: | 5.8% |
| Whole state: | 6.0% |
Likely homosexual households (counted as self-reported same-sex unmarried-partner households)
- Lesbian couples: 0.3% of all households
- Gay men: 0.3% of all households
103 people in nursing homes in 2000
8 people in other noninstitutional group quarters in 2000
Banks with branches in Harker Heights (2011 data):
- First National Bank Texas: Harker Heights Wal Mart - Rc 880, Harker Heights Branch - Rc 121, First Community Mortgage Company, Market Heights Banking Center - Rc 1. Info updated 2006/11/03: Bank assets: $944.3 mil, Deposits: $815.9 mil, headquarters in Killeen, TX, positive income, Mortgage Lending Specialization, 250 total offices, Holding Company: First Community Bancshares, Inc.
- Union State Bank: Harker Heights Branch at 345 E. Fm 2410, branch established on 2006/10/16. Info updated 2006/11/03: Bank assets: $424.1 mil, Deposits: $368.1 mil, headquarters in Florence, TX, positive income, Commercial Lending Specialization, 8 total offices, Holding Company: Union State Bancshares, Inc.
- JPMorgan Chase Bank, National Association: Harker Heights Branch at 201 E Central Texas Expy, Unit 1800, branch established on 2009/03/31. Info updated 2011/11/10: Bank assets: $1,811,678.0 mil, Deposits: $1,190,738.0 mil, headquarters in Columbus, OH, positive income, International Specialization, 5577 total offices, Holding Company: Jpmorgan Chase & Co.
- Texas Star Bank, SSB: Harker Heights Branch at 905 E Fm 2410, branch established on 2010/12/28. Info updated 2009/11/16: Bank assets: $76.0 mil, Deposits: $61.9 mil, headquarters in Lott, TX, positive income, Mortgage Lending Specialization, 3 total offices, Holding Company: Southern Bancshares, Inc.
- Extraco Banks, National Association: Harker Heights Branch at 100 West Central Texas Expressway, branch established on 1990/12/07. Info updated 2006/11/03: Bank assets: $1,194.0 mil, Deposits: $883.6 mil, headquarters in Temple, TX, positive income, Commercial Lending Specialization, 19 total offices, Holding Company: Extraco Corporation
- Bank of America, National Association: Harker Heights Branch at 201 E Central Texas Expy, Suite 1900, branch established on 2008/12/31. Info updated 2009/11/18: Bank assets: $1,451,969.3 mil, Deposits: $1,077,176.8 mil, headquarters in Charlotte, NC, positive income, 5782 total offices, Holding Company: Bank Of America Corporation
- First State Bank Central Texas: Harker Heights Branch at 661 W Central Texas Expressway, #100, branch established on 2003/10/01. Info updated 2010/06/14: Bank assets: $1,112.8 mil, Deposits: $884.8 mil, headquarters in Austin, TX, positive income, Commercial Lending Specialization, 31 total offices, Holding Company: Central Community Corporation
For population 15 years and over in Harker Heights:
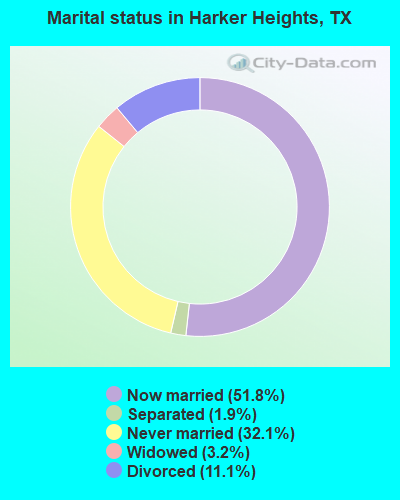
- Never married: 32.1%
- Now married: 51.8%
- Separated: 1.9%
- Widowed: 3.2%
- Divorced: 11.1%
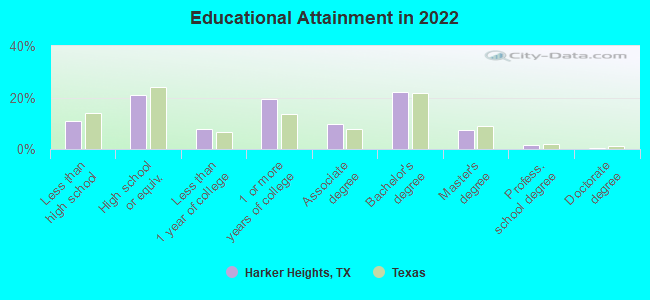
For population 25 years and over in Harker Heights:
- High school or higher: 90.7%
- Bachelor's degree or higher: 31.3%
- Graduate or professional degree: 9.7%
- Unemployed: 6.7%
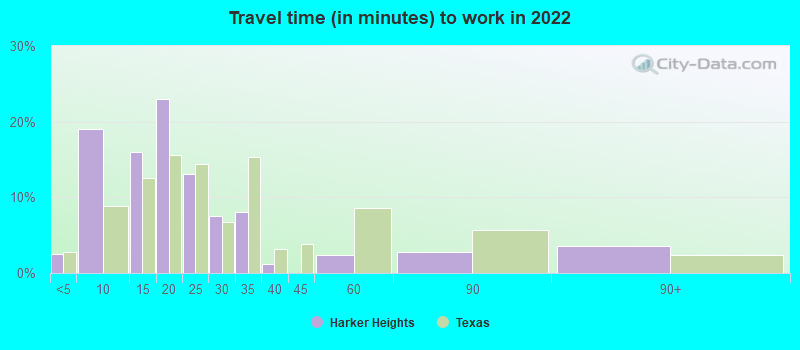
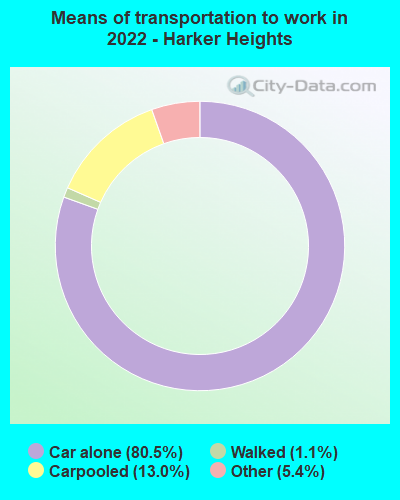
- Mean travel time to work (commute): 22.5 minutes
| Here: | 11.6 |
| Texas average: | 14.0 |
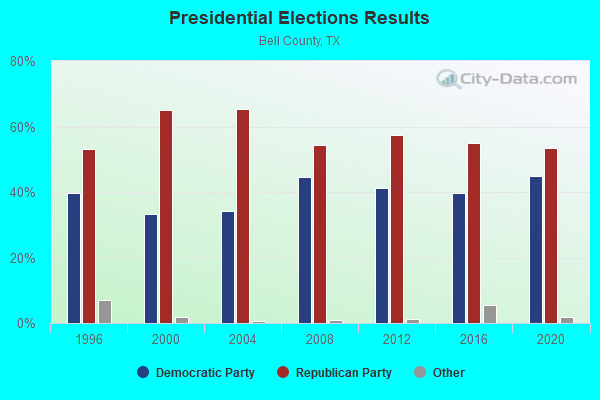
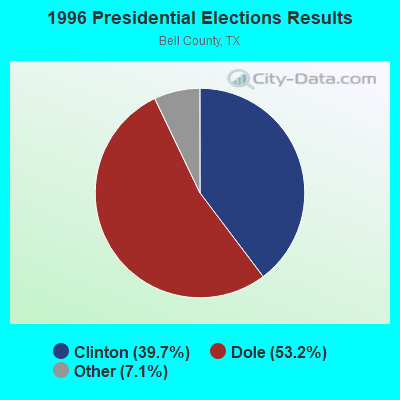
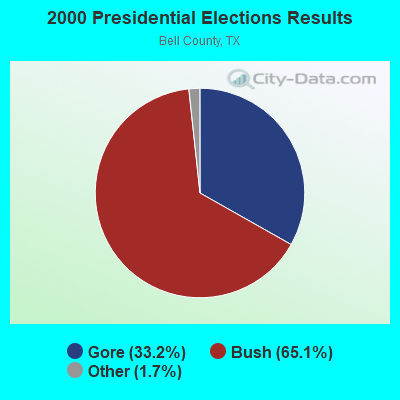
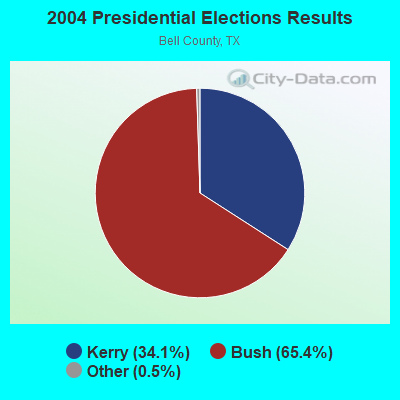
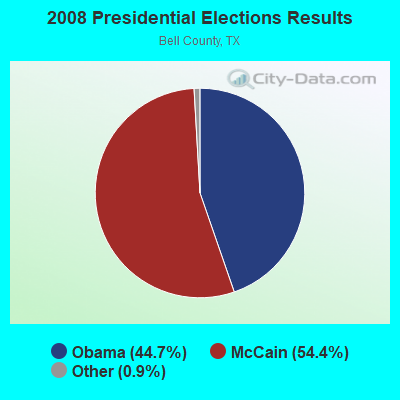
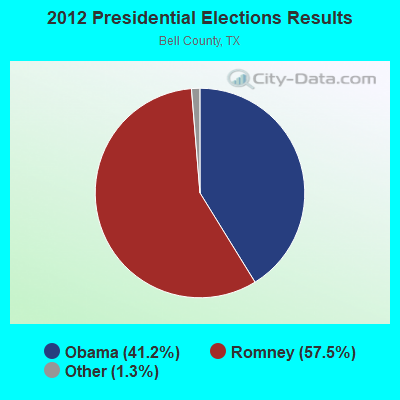

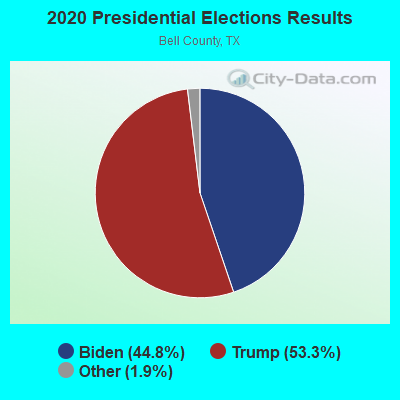
Graphs represent county-level data. Detailed 2008 Election Results
Political contributions by individuals in Harker Heights, TX
Religion statistics for Harker Heights, TX (based on Bell County data)
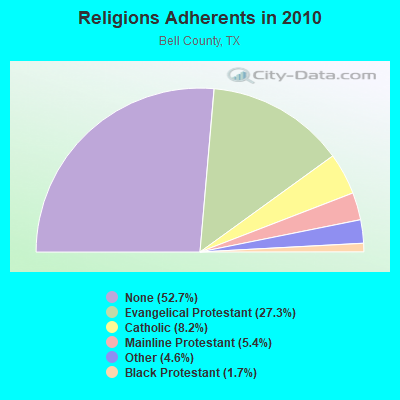
| Religion | Adherents | Congregations |
|---|---|---|
| Evangelical Protestant | 84,720 | 225 |
| Catholic | 25,366 | 9 |
| Mainline Protestant | 16,861 | 44 |
| Other | 14,386 | 19 |
| Black Protestant | 5,378 | 19 |
| None | 163,524 | - |
Food Environment Statistics:
| This county: | 0.94 / 10,000 pop. |
| State: | 1.47 / 10,000 pop. |
| This county: | 0.14 / 10,000 pop. |
| State: | 0.14 / 10,000 pop. |
| Bell County: | 1.48 / 10,000 pop. |
| Texas: | 1.11 / 10,000 pop. |
| Bell County: | 4.21 / 10,000 pop. |
| Texas: | 3.95 / 10,000 pop. |
| This county: | 5.15 / 10,000 pop. |
| State: | 6.13 / 10,000 pop. |
| Here: | 10.6% |
| Texas: | 8.9% |
| This county: | 27.5% |
| Texas: | 26.6% |
| This county: | 10.4% |
| Texas: | 15.7% |
Health and Nutrition:
| Harker Heights: | 50.1% |
| Texas: | 48.6% |
| Harker Heights: | 49.4% |
| Texas: | 47.4% |
| Here: | 28.5 |
| Texas: | 28.5 |
| Harker Heights: | 19.9% |
| Texas: | 20.6% |
| Harker Heights: | 10.2% |
| State: | 10.3% |
| Harker Heights: | 6.8 |
| Texas: | 6.8 |
| Harker Heights: | 32.8% |
| Texas: | 33.1% |
| Harker Heights: | 58.5% |
| Texas: | 56.2% |
| Harker Heights: | 82.3% |
| Texas: | 80.7% |
More about Health and Nutrition of Harker Heights, TX Residents
| Local government employment and payroll (March 2022) | |||||
| Function | Full-time employees | Monthly full-time payroll | Average yearly full-time wage | Part-time employees | Monthly part-time payroll |
|---|---|---|---|---|---|
| Police Protection - Officers | 49 | $296,524 | $72,618 | 0 | $0 |
| Firefighters | 40 | $259,550 | $77,865 | 0 | $0 |
| Parks and Recreation | 25 | $95,343 | $45,765 | 3 | $3,275 |
| Other Government Administration | 20 | $99,537 | $59,722 | 2 | $1,955 |
| Health | 12 | $50,501 | $50,501 | 2 | $1,158 |
| Police - Other | 12 | $58,426 | $58,426 | 2 | $2,726 |
| Financial Administration | 12 | $65,266 | $65,266 | 0 | $0 |
| Judicial and Legal | 10 | $31,188 | $37,426 | 0 | $0 |
| Water Supply | 10 | $36,990 | $44,388 | 0 | $0 |
| Local Libraries | 8 | $34,226 | $51,339 | 2 | $2,542 |
| Other and Unallocable | 8 | $39,182 | $58,773 | 0 | $0 |
| Fire - Other | 6 | $19,857 | $39,714 | 0 | $0 |
| Streets and Highways | 5 | $24,165 | $57,996 | 0 | $0 |
| Sewerage | 5 | $20,823 | $49,975 | 0 | $0 |
| Solid Waste Management | 2 | $7,347 | $44,082 | 0 | $0 |
| Welfare | 2 | $8,177 | $49,062 | 0 | $0 |
| Natural Resources | 2 | $8,527 | $51,162 | 0 | $0 |
| Totals for Government | 228 | $1,155,628 | $60,823 | 11 | $11,656 |
Harker Heights government finances - Expenditure in 2018 (per resident):
- Construction - Regular Highways: $6,411,000 ($187.99)
Water Utilities: $2,652,000 ($77.77)
Central Staff Services: $1,942,000 ($56.95)
Parks and Recreation: $794,000 ($23.28)
Sewerage: $675,000 ($19.79)
- Current Operations - Police Protection: $5,855,000 ($171.69)
Water Utilities: $4,047,000 ($118.67)
Local Fire Protection: $3,953,000 ($115.92)
Central Staff Services: $2,758,000 ($80.88)
Parks and Recreation: $2,165,000 ($63.49)
Solid Waste Management: $1,777,000 ($52.11)
Sewerage: $1,180,000 ($34.60)
Regular Highways: $1,079,000 ($31.64)
Judicial and Legal Services: $885,000 ($25.95)
Financial Administration: $680,000 ($19.94)
Libraries: $667,000 ($19.56)
Protective Inspection and Regulation - Other: $546,000 ($16.01)
Health - Other: $528,000 ($15.48)
General - Other: $246,000 ($7.21)
Natural Resources - Other: $202,000 ($5.92)
- General - Interest on Debt: $1,024,000 ($30.03)
- Other Capital Outlay - Central Staff Services: $179,000 ($5.25)
Parks and Recreation: $146,000 ($4.28)
Police Protection: $143,000 ($4.19)
Regular Highways: $117,000 ($3.43)
Sewerage: $107,000 ($3.14)
Water Utilities: $86,000 ($2.52)
Health - Other: $75,000 ($2.20)
Financial Administration: $49,000 ($1.44)
Local Fire Protection: $40,000 ($1.17)
Natural Resources - Other: $23,000 ($0.67)
Protective Inspection and Regulation - Other: $20,000 ($0.59)
Judicial and Legal Services: $5,000 ($0.15)
General - Other: $4,000 ($0.12)
- Total Salaries and Wages: $12,012,000 ($352.24)
- Water Utilities - Interest on Debt: $432,000 ($12.67)
Harker Heights government finances - Revenue in 2018 (per resident):
- Charges - Sewerage: $3,533,000 ($103.60)
Solid Waste Management: $2,120,000 ($62.17)
Other: $902,000 ($26.45)
Hospital Public: $696,000 ($20.41)
Parks and Recreation: $232,000 ($6.80)
- Federal Intergovernmental - Other: $4,000 ($0.12)
- Local Intergovernmental - Health and Hospitals: $9,000 ($0.26)
- Miscellaneous - Fines and Forfeits: $878,000 ($25.75)
Interest Earnings: $175,000 ($5.13)
Special Assessments: $57,000 ($1.67)
Donations From Private Sources: $29,000 ($0.85)
General Revenue - Other: $23,000 ($0.67)
Sale of Property: $22,000 ($0.65)
- Revenue - Water Utilities: $5,856,000 ($171.72)
- State Intergovernmental - Other: $251,000 ($7.36)
Highways: $205,000 ($6.01)
- Tax - Property: $11,132,000 ($326.43)
General Sales and Gross Receipts: $6,502,000 ($190.66)
Public Utilities Sales: $1,333,000 ($39.09)
Other License: $236,000 ($6.92)
Other Selective Sales: $95,000 ($2.79)
Other: $50,000 ($1.47)
Occupation and Business License - Other: $44,000 ($1.29)
Harker Heights government finances - Debt in 2018 (per resident):
- Long Term Debt - Outstanding Unspecified Public Purpose: $48,625,000 ($1425.87)
Beginning Outstanding - Unspecified Public Purpose: $45,815,000 ($1343.47)
Issue, Unspecified Public Purpose: $5,915,000 ($173.45)
Retired Unspecified Public Purpose: $3,105,000 ($91.05)
Harker Heights government finances - Cash and Securities in 2018 (per resident):
- Bond Funds - Cash and Securities: $5,640,000 ($165.39)
- Other Funds - Cash and Securities: $16,745,000 ($491.03)
- Sinking Funds - Cash and Securities: $263,000 ($7.71)
12.41% of this county's 2021 resident taxpayers lived in other counties in 2020 ($50,143 average adjusted gross income)
| Here: | 12.41% |
| Texas average: | 8.12% |
0.44% of residents moved from foreign countries ($1,758 average AGI)
Bell County: 0.44% Texas average: 0.04%
Top counties from which taxpayers relocated into this county between 2020 and 2021:
| from Williamson County, TX | |
| from Coryell County, TX | |
| from Travis County, TX |
11.01% of this county's 2020 resident taxpayers moved to other counties in 2021 ($49,879 average adjusted gross income)
| Here: | 11.01% |
| Texas average: | 7.40% |
0.27% of residents moved to foreign countries ($1,266 average AGI)
Bell County: 0.27% Texas average: 0.03%
Top counties to which taxpayers relocated from this county between 2020 and 2021:
| to Coryell County, TX | |
| to Williamson County, TX | |
| to Travis County, TX |
| Businesses in Harker Heights, TX | ||||
| Name | Count | Name | Count | |
|---|---|---|---|---|
| AT&T | 1 | McDonald's | 2 | |
| Ace Hardware | 1 | Nike | 2 | |
| AutoZone | 1 | Old Navy | 1 | |
| Barnes & Noble | 1 | Panda Express | 1 | |
| Bed Bath & Beyond | 1 | Papa John's Pizza | 1 | |
| Catherines | 1 | Payless | 1 | |
| Chick-Fil-A | 1 | Pizza Hut | 1 | |
| Chipotle | 1 | Quiznos | 1 | |
| Cracker Barrel | 1 | Rue21 | 1 | |
| Cricket Wireless | 1 | SONIC Drive-In | 1 | |
| Curves | 1 | Sprint Nextel | 1 | |
| Dairy Queen | 1 | Starbucks | 2 | |
| Discount Tire | 1 | Subway | 1 | |
| FedEx | 3 | Super 8 | 1 | |
| Firestone Complete Auto Care | 1 | T-Mobile | 1 | |
| Goodwill | 1 | Target | 1 | |
| H&R Block | 1 | UPS | 3 | |
| KFC | 1 | Walgreens | 1 | |
| Lane Bryant | 1 | Walmart | 1 | |
| Little Caesars Pizza | 1 | Wet Seal | 1 | |
| Maurices | 1 | |||
Strongest AM radio stations in Harker Heights:
- KRMY (1050 AM; 0 kW; KILLEEN, TX; Owner: MARTIN BROADCASTING, INC.)
- KTON (940 AM; 1 kW; BELTON, TX; Owner: SHELDON COMMUNICATIONS, LTD.)
- KRZX (1660 AM; 10 kW; WACO, TX; Owner: VAN D. GOODALL, JR.)
- WBAP (820 AM; 50 kW; FORT WORTH, TX; Owner: WBAP-KSCS OPERATING, LTD.)
- KTKR (760 AM; 50 kW; SAN ANTONIO, TX; Owner: CCB TEXAS LICENSES, L.P.)
- KKYX (680 AM; 50 kW; SAN ANTONIO, TX; Owner: CXR HOLDINGS, INC.)
- KBBW (1010 AM; 10 kW; WACO-MARLIN, TX; Owner: AMERICAN BROADCASTING OF TEXAS)
- WOAI (1200 AM; 50 kW; SAN ANTONIO, TX; Owner: CCB TEXAS LICENSES, L.P.)
- KTEM (1400 AM; 1 kW; TEMPLE, TX; Owner: CUMULUS LICENSING CORP.)
- KRZI (1580 AM; 10 kW; WACO, TX; Owner: VAN D. GOODALL, JR.)
- KESS (1270 AM; 50 kW; FORT WORTH, TX; Owner: KESS-AM LICENSE CORP.)
- KAHZ (1360 AM; 50 kW; HURST, TX)
- KLBJ (590 AM; 5 kW; AUSTIN, TX; Owner: EMMIS AUSTIN RADIO BROADCASTING COMPANY, L.P.)
Strongest FM radio stations in Harker Heights:
- KNCT-FM (91.3 FM; KILLEEN, TX; Owner: CENTRAL TEXAS COLLEGE)
- KLFX (107.3 FM; NOLANVILLE, TX; Owner: SHELDON BROADCASTING, LTD.)
- KIIZ-FM (92.3 FM; KILLEEN, TX; Owner: CAPSTAR TX LIMITED PARTNERSHIP)
- KVLT (88.5 FM; TEMPLE, TX; Owner: AMERICAN EDUCATIONAL BROADCASTING, INC)
- KUSJ (105.5 FM; HARKER HEIGHTS, TX; Owner: CUMULUS LICENSING CORP.)
- K221BM (92.1 FM; KILLEEN, ETC., TX; Owner: JAKE E. KING)
- KOOC (106.3 FM; BELTON, TX; Owner: CUMULUS LICENSING CORP.)
- KDHT (93.3 FM; CEDAR PARK, TX; Owner: EMMIS AUSTIN RADIO BROADCASTING COMPANY, L.P.)
- WACO-FM (99.9 FM; WACO, TX; Owner: CAPSTAR TX LIMITED PARTNERSHIP)
- KWTX-FM (97.5 FM; WACO, TX; Owner: CAPSTAR TX LIMITED PARTNERSHIP)
- KHHL (98.9 FM; LEANDER, TX; Owner: AMIGO RADIO, LTD.)
- K232BY (94.3 FM; KILLEEN, TX; Owner: J AND J BROADCASTING)
- KBGO (95.7 FM; WACO, TX; Owner: CAPSTAR TX LIMITED PARTNERSHIP)
- KSSM (103.1 FM; COPPERAS COVE, TX; Owner: CUMULUS LICENSING CORP.)
- KFMK (105.9 FM; ROUND ROCK, TX; Owner: CAPSTAR TX LIMITED PARTNERSHIP)
- KBDE (89.9 FM; TEMPLE, TX; Owner: AMERICAN FAMILY ASSOCIATION)
- KLTD (101.7 FM; TEMPLE, TX; Owner: CUMULUS LICENSING CORP.)
- KHFI-FM (96.7 FM; GEORGETOWN, TX; Owner: CCB TEXAS LICENSES, L.P.)
- KINV (107.7 FM; GEORGETOWN, TX; Owner: SIMMONS LONE STAR MEDIA, LTD.)
- KVLZ (98.3 FM; GATESVILLE, TX; Owner: EDUCATIONAL MEDIA FOUNDATION)
TV broadcast stations around Harker Heights:
- KNCT (Channel 46; BELTON, TX; Owner: CENTRAL TEXAS COLLEGE)
- KPLE-LP (Channel 31; KILLEEN, TX; Owner: KILLEEN CHRISTIAN B/CING.CORPORATION)
- KWKT (Channel 44; WACO, TX; Owner: COMCORP OF TEXAS LICENSE CORP.)
- KCEN-TV (Channel 6; TEMPLE, TX; Owner: CHANNEL 6, INC.)
- KXXV (Channel 25; WACO, TX; Owner: CENTEX TELEVISION LIMITED PARTNERSHIP)
- KWTX-TV (Channel 10; WACO, TX; Owner: KWTX-KBTX LICENSEE CORP.)
- KAKW (Channel 62; KILLEEN, TX; Owner: KAKW LICENSE PARTNERSHIP, L.P.)
- K16CY (Channel 16; KILLEEN, TX; Owner: WORD OF GOD FELLOWSHIP, INC.)
- K38FN (Channel 38; WACO, TX; Owner: NATIONAL MINORITY T.V., INC.)
- KWBU-TV (Channel 34; WACO, TX; Owner: BRAZOS VALLEY PUBLIC BROADCASTING FOUNDATION)
- National Bridge Inventory (NBI) Statistics
- 19Number of bridges
- 259ft / 79.2mTotal length
- $12,371,000Total costs
- 354,448Total average daily traffic
- 24,772Total average daily truck traffic
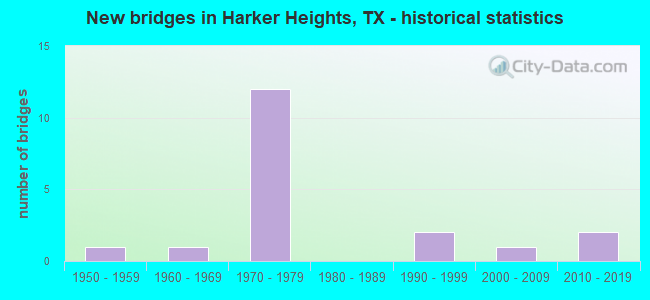
- New bridges - historical statistics
- 11950-1959
- 11960-1969
- 121970-1979
- 21990-1999
- 12000-2009
- 22010-2019
FCC Registered Broadcast Land Mobile Towers: 8 (See the full list of FCC Registered Broadcast Land Mobile Towers in Harker Heights, TX)
FCC Registered Microwave Towers: 12 (See the full list of FCC Registered Microwave Towers in this town)
FCC Registered Amateur Radio Licenses: 87 (See the full list of FCC Registered Amateur Radio Licenses in Harker Heights)
FAA Registered Aircraft: 25 (See the full list of FAA Registered Aircraft in Harker Heights)
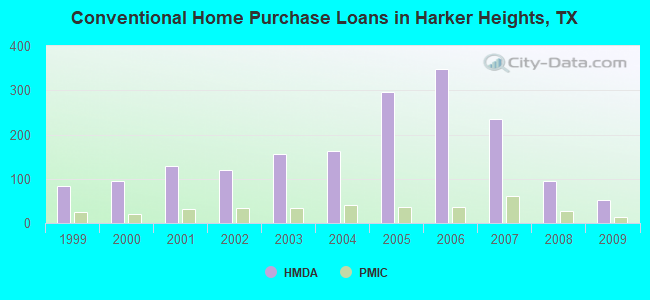
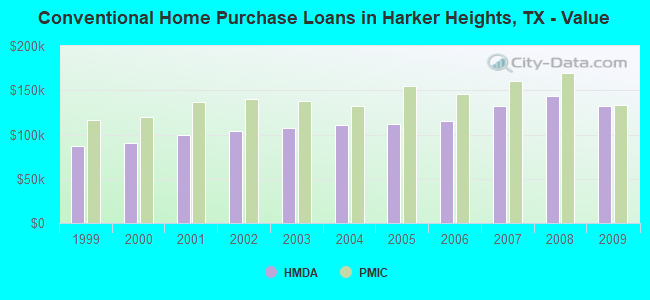
| Home Mortgage Disclosure Act Aggregated Statistics For Year 2009 (Based on 1 full and 1 partial tracts) | ||||||||||||
| A) FHA, FSA/RHS & VA Home Purchase Loans | B) Conventional Home Purchase Loans | C) Refinancings | D) Home Improvement Loans | F) Non-occupant Loans on < 5 Family Dwellings (A B C & D) | G) Loans On Manufactured Home Dwelling (A B C & D) | |||||||
|---|---|---|---|---|---|---|---|---|---|---|---|---|
| Number | Average Value | Number | Average Value | Number | Average Value | Number | Average Value | Number | Average Value | Number | Average Value | |
| LOANS ORIGINATED | 195 | $183,036 | 53 | $132,070 | 265 | $168,345 | 16 | $42,398 | 37 | $123,530 | 1 | $25,130 |
| APPLICATIONS APPROVED, NOT ACCEPTED | 11 | $176,460 | 2 | $219,850 | 25 | $178,814 | 6 | $32,462 | 1 | $261,840 | 0 | $0 |
| APPLICATIONS DENIED | 21 | $167,896 | 6 | $109,347 | 75 | $156,229 | 23 | $26,814 | 11 | $98,646 | 4 | $72,598 |
| APPLICATIONS WITHDRAWN | 19 | $182,699 | 7 | $145,464 | 86 | $158,863 | 6 | $53,897 | 10 | $112,824 | 1 | $62,150 |
| FILES CLOSED FOR INCOMPLETENESS | 2 | $178,855 | 2 | $227,215 | 16 | $138,490 | 1 | $155,380 | 2 | $53,320 | 0 | $0 |
Detailed HMDA statistics for the following Tracts: 0219.01 , 0219.02
| Private Mortgage Insurance Companies Aggregated Statistics For Year 2009 (Based on 1 full and 1 partial tracts) | ||||||
| A) Conventional Home Purchase Loans | B) Refinancings | C) Non-occupant Loans on < 5 Family Dwellings (A & B) | ||||
|---|---|---|---|---|---|---|
| Number | Average Value | Number | Average Value | Number | Average Value | |
| LOANS ORIGINATED | 14 | $133,684 | 9 | $169,193 | 1 | $153,400 |
| APPLICATIONS APPROVED, NOT ACCEPTED | 0 | $0 | 1 | $144,800 | 0 | $0 |
| APPLICATIONS DENIED | 0 | $0 | 1 | $229,440 | 0 | $0 |
| APPLICATIONS WITHDRAWN | 2 | $112,375 | 1 | $95,870 | 0 | $0 |
| FILES CLOSED FOR INCOMPLETENESS | 1 | $75,380 | 0 | $0 | 0 | $0 |
Detailed PMIC statistics for the following Tracts: 0219.01 , 0219.02
2002 - 2018 National Fire Incident Reporting System (NFIRS) incidents
- Fire incident types reported to NFIRS in Harker Heights, TX
- 80447.8%Outside Fires
- 58634.8%Structure Fires
- 21712.9%Mobile Property/Vehicle Fires
- 764.5%Other
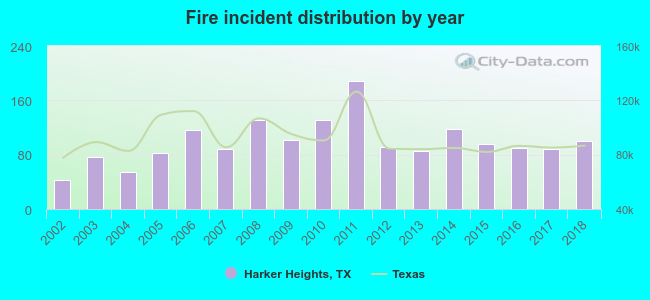 Based on the data from the years 2002 - 2018 the average number of fires per year is 99. The highest number of reported fire incidents - 188 took place in 2011, and the least - 43 in 2002. The data has a growing trend.
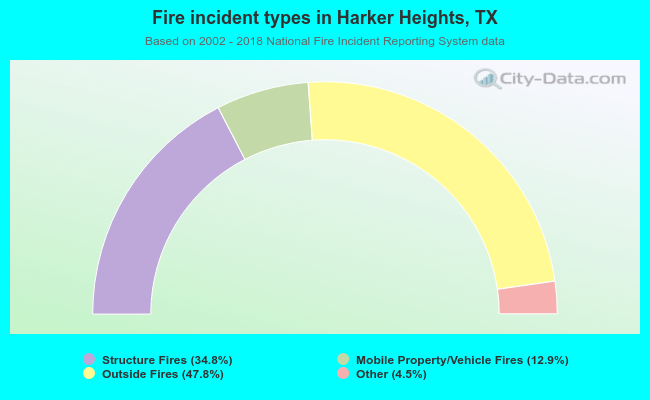 When looking into fire subcategories, the most reports belonged to: Outside Fires (47.8%), and Structure Fires (34.8%).
Fire-safe hotels and motels in Harker Heights, Texas:
- Best Western Harker Heights, 511 Pan American Dr, Harker Heights, Texas 76548 , Phone: (254) 432-5106, Fax: (254) 432-5257
- Super 8 Harker Heights, 540 E Central Texas Expy, Harker Heights, Texas 76548 , Phone: (254) 698-6900, Fax: (254) 698-3900
- Super 8, 540 E Central tx Expy, Harker Heights, Texas 76548 , Phone: (254) 698-6900, Fax: (254) 698-3900
- BEST WESTERN HOTEL, 511 PAN AMERICAN Dr, Harker heights, Texas 76548 , Phone: (254) 432-5106, Fax: (254) 432-5257
| Most common first names in Harker Heights, TX among deceased individuals | ||
| Name | Count | Lived (average) |
|---|---|---|
| John | 25 | 73.3 years |
| James | 23 | 71.6 years |
| Robert | 19 | 71.2 years |
| Mary | 18 | 79.3 years |
| Charles | 14 | 71.4 years |
| William | 14 | 71.8 years |
| Harold | 13 | 76.2 years |
| Edward | 11 | 71.4 years |
| Richard | 9 | 71.8 years |
| Donald | 9 | 70.0 years |
| Most common last names in Harker Heights, TX among deceased individuals | ||
| Last name | Count | Lived (average) |
|---|---|---|
| Smith | 16 | 70.8 years |
| Johnson | 9 | 60.2 years |
| Miller | 7 | 68.1 years |
| Williams | 6 | 70.0 years |
| Thomas | 6 | 77.5 years |
| Davis | 6 | 69.8 years |
| Jones | 5 | 78.8 years |
| Moore | 5 | 72.4 years |
| Brown | 5 | 72.4 years |
| Young | 5 | 78.2 years |
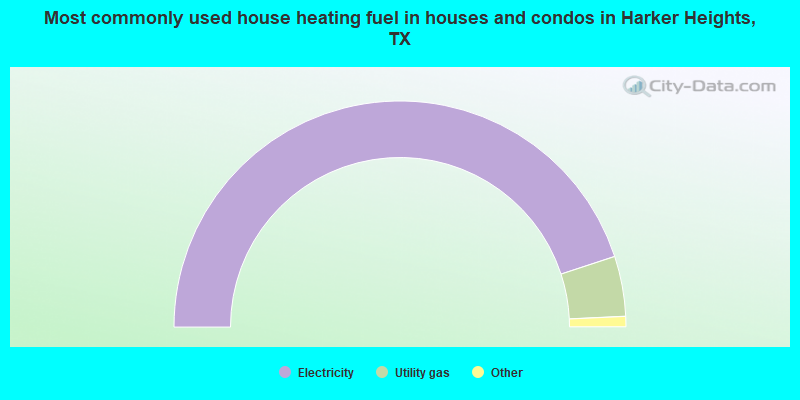
- 90.0%Electricity
- 8.6%Utility gas
- 0.9%No fuel used
- 0.4%Solar energy
- 0.2%Bottled, tank, or LP gas
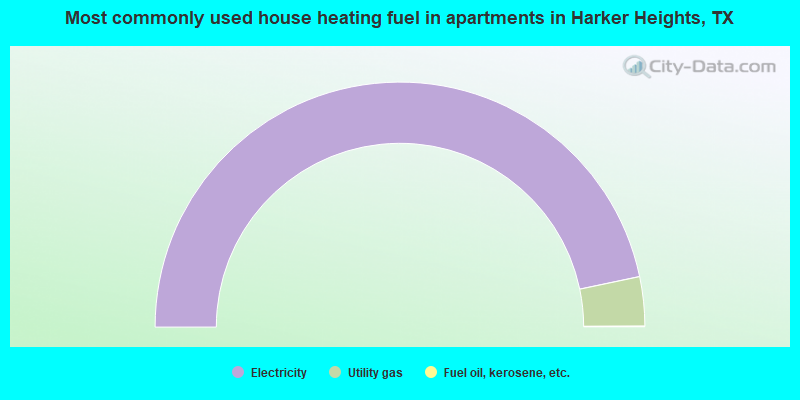
- 93.4%Electricity
- 6.5%Utility gas
- 0.1%Fuel oil, kerosene, etc.
Harker Heights compared to Texas state average:
- Unemployed percentage below state average.
- Black race population percentage significantly above state average.
- Length of stay since moving in significantly above state average.
- House age below state average.
- Number of college students above state average.

|
|
Total of 40 patent applications in 2008-2024.