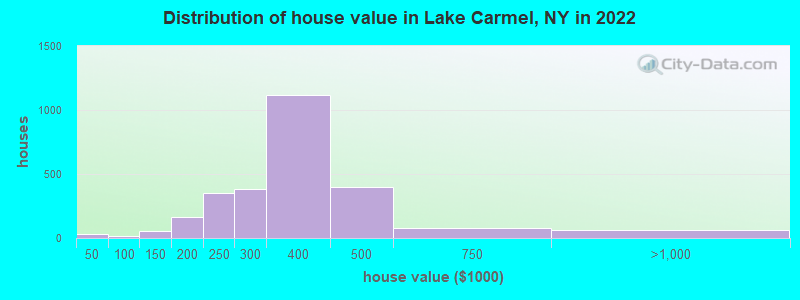
Estimated median house or condo value in 2022: $338,189 (it was $149,300 in 2000)
Lake Carmel:
$338,189
NY:
$400,400
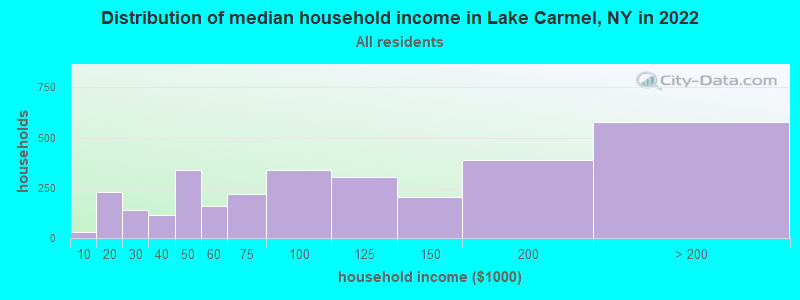
Mean prices in 2022:all housing units: $511,003; detached houses: $544,773; townhouses or other attached units: $394,159; in 2-unit structures: $469,697; in 3-to-4-unit structures: $440,923; in 5-or-more-unit structures: $358,923; mobile homes: $103,512
Median gross rent in 2022: $1,618.
March 2022 cost of living index in Lake Carmel: 142.7 (very high, U.S. average is 100)
Percentage of residents living in poverty in 2022: 7.5%
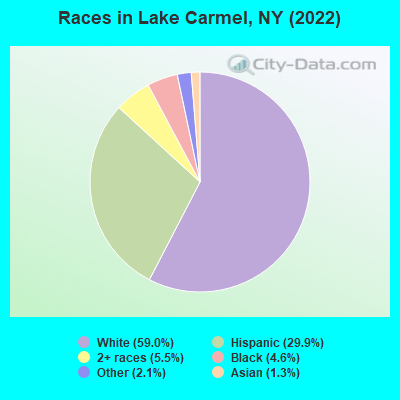
(5.3% for White Non-Hispanic residents, 3.8% for Black residents, 15.8% for Hispanic or Latino residents, 10.7% for other race residents, 6.0% for two or more races residents)
Latest news from Lake Carmel, NY collected exclusively by city-data.com from local newspapers, TV, and radio stations
Ancestries: Italian (18.8%), Irish (10.7%), American (6.2%), German (4.8%), African (3.8%), English (1.5%).
Current Local Time: EST time zone
Land area: 5.16 square miles.
Population density: 1,604 people per square mile (low).
1,451 residents are foreign born (12.1% Latin America, 3.5% Europe).
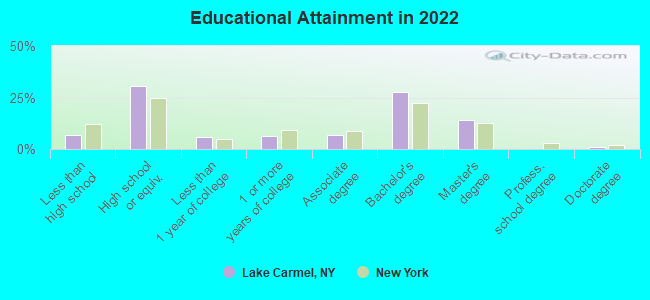
This place:
17.9%
New York:
22.6%
Median real estate property taxes paid for housing units with mortgages in 2022: $9,378 (2.7%) Median real estate property taxes paid for housing units with no mortgage in 2022: $6,826 (2.2%)
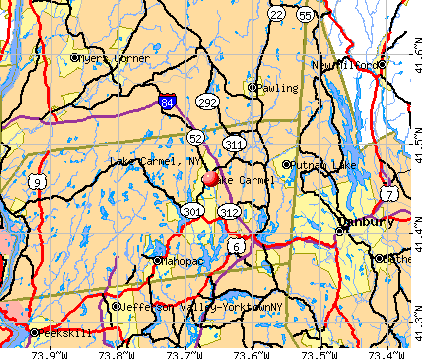
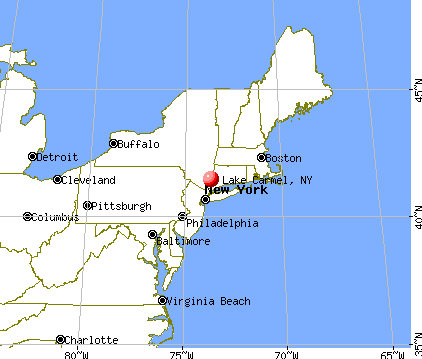
Nearest city with pop. 50,000+: Danbury, CT (11.1 miles , pop. 74,848).
Nearest city with pop. 200,000+: Bronx, NY (43.8 miles , pop. 1,332,650).
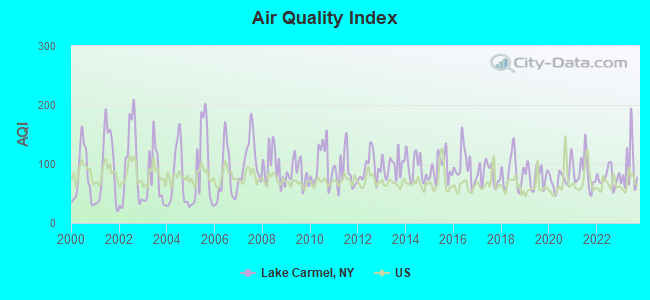
Air Quality Index (AQI) level in 2023 was 93.4. This is worse than average.
City:
93.4
U.S.:
72.6
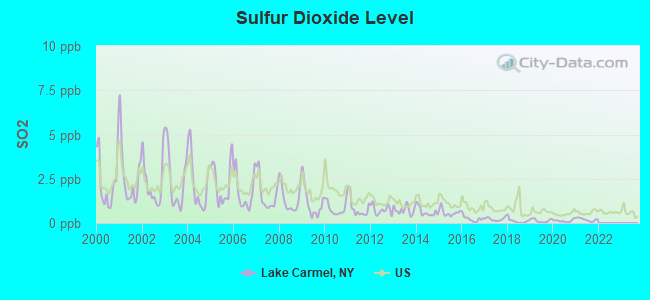
Sulfur Dioxide (SO2) [ppb] level in 2021 was 0.194. This is significantly better than average.Closest monitor was 2.5 miles away from the city center.
City:
0.194
U.S.:
1.515
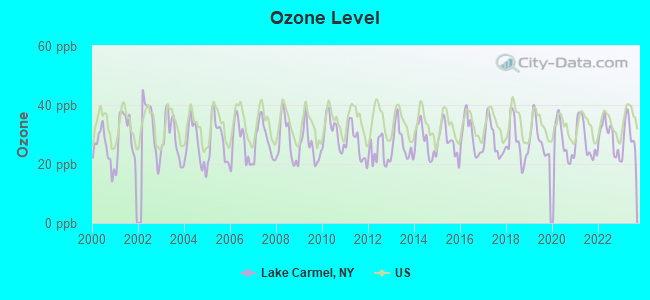
Ozone [ppb] level in 2023 was 29.7. This is about average.Closest monitor was 2.5 miles away from the city center.
City:
29.7
U.S.:
33.3
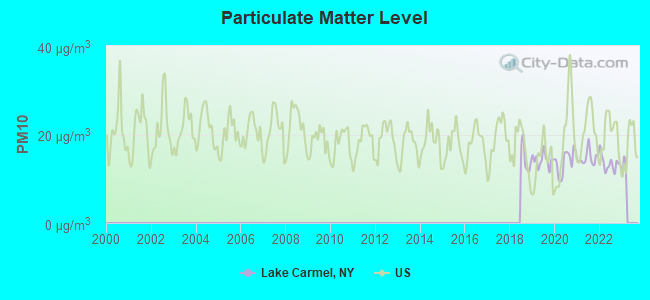
Particulate Matter (PM10) [µg/m3] level in 2022 was 13.5. This is significantly better than average.Closest monitor was 2.5 miles away from the city center.
City:
13.5
U.S.:
19.2
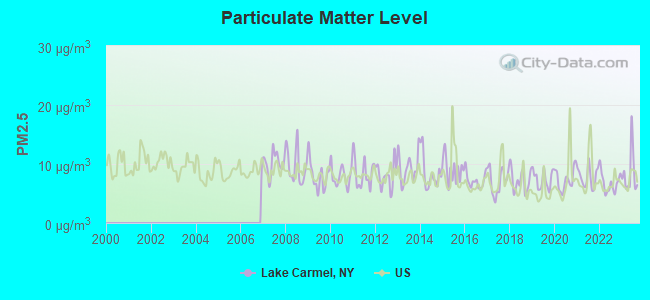
Particulate Matter (PM2.5) [µg/m3] level in 2023 was 8.41. This is about average.Closest monitor was 12.1 miles away from the city center.
City:
8.41
U.S.:
8.11
Tornado activity:
Lake Carmel-area historical tornado activity is above New York state average. It is 30% smaller than the overall U.S. average.
On 7/10/1989, a category F4 (max. wind speeds 207-260 mph) tornado 39.7 miles away from the Lake Carmel place center injured 40 peopleand causedbetween $50,000,000 and $500,000,000 in damages.
On 5/24/1962, a category F3 (max. wind speeds 158-206 mph) tornado 28.7 miles away from the place center killed one personand injured 50 peopleand causedbetween $500,000 and $5,000,000 in damages.
Earthquake activity:
Lake Carmel-area historical earthquake activity is significantly above New York state average. It is 69% smaller than the overall U.S. average.
On 10/7/1983 at 10:18:46, a magnitude 5.3 (5.1 MB, 5.3 LG, 5.1 ML, Class: Moderate, Intensity: VI - VII) earthquake occurred 175.8 miles away from the city center On 4/20/2002 at 10:50:47, a magnitude 5.3 (5.3 ML, Depth: 3.0 mi) earthquake occurred 211.1 miles away from Lake Carmel center On 4/20/2002 at 10:50:47, a magnitude 5.2 (5.2 MB, 4.2 MS, 5.2 MW, 5.0 MW) earthquake occurred 209.4 miles away from Lake Carmel center On 8/23/2011 at 17:51:04, a magnitude 5.8 (5.8 MW, Depth: 3.7 mi) earthquake occurred 334.7 miles away from the city center On 1/16/1994 at 01:49:16, a magnitude 4.6 (4.6 MB, 4.6 LG, Depth: 3.1 mi, Class: Light, Intensity: IV - V) earthquake occurred 146.7 miles away from the city center On 1/19/1982 at 00:14:42, a magnitude 4.7 (4.5 MB, 4.7 MD, 4.5 LG) earthquake occurred 176.0 miles away from the city center Magnitude types: regional Lg-wave magnitude (LG), body-wave magnitude (MB), duration magnitude (MD), local magnitude (ML), surface-wave magnitude (MS), moment magnitude (MW)
Natural disasters:
The number of natural disasters in Putnam County (22) is greater than the US average (15). Major Disasters (Presidential) Declared: 13 Emergencies Declared: 8
Causes of natural disasters: Hurricanes: 7, Floods: 5, Storms: 5, Blizzards: 2, Heavy Rain: 1, Landslide: 1, Power Outage: 1, Snowstorm: 1, Tropical Storm: 1, Water Shortage: 1, Winter Storm: 1, Other: 3 (Note: some incidents may be assigned to more than one category).
Hospitals and medical centers near Lake Carmel:
PUTNAM CO DOH NURSNG SVCS CHHA (Home Health Center, about 3 miles away; BREWSTER, NY)
PUTNAM NURSING AND REHABILITATION (Nursing Home, about 4 miles away; HOLMES, NY)
CELIA DILL DIALYSIS CENTER (Dialysis Facility, about 6 miles away; CARMEL, NY)
PUTNAM HOSPITAL CENTER Acute Care Hospitals (about 7 miles away; CARMEL, NY)
UCPA OF PUTNAM AND SOUTHERN DUTCHESS COUNTIES (Hospital, about 7 miles away; MAHOPAC, NY)
DUTCHESS CENTER FOR REHAB AND HEALTHCARE (Nursing Home, about 9 miles away; PAWLING, NY)
OPENGATE, INC (Hospital, about 9 miles away; SOMERS, NY)
Colleges/universities with over 2000 students nearest to Lake Carmel:
Western Connecticut State University (about 13 miles; Danbury, CT; Full-time enrollment: 5,345)
United States Military Academy (about 17 miles; West Point, NY; FT enrollment: 5,651)
Mount Saint Mary College (about 19 miles; Newburgh, NY; FT enrollment: 2,166)
Vassar College (about 20 miles; Poughkeepsie, NY; FT enrollment: 2,469)
Dutchess Community College (about 23 miles; Poughkeepsie, NY; FT enrollment: 6,554)
Marist College (about 23 miles; Poughkeepsie, NY; FT enrollment: 5,536)
Culinary Institute of America (about 25 miles; Hyde Park, NY; FT enrollment: 3,869)
Putnam County has a predicted average indoor radon screening level greater than 4 pCi/L (pico curies per liter) - Highest Potential
Drinking water stations with addresses in Lake Carmel and their reported violations in the past:
HOLLYWOOD MOTEL (Address: 20 CHAUNCEY RD , Population served: 25, Groundwater):
Past health violations:
MCL, Monthly (TCR) - Between APR-2011 and JUN-2011, Contaminant: Coliform. Follow-up actions: St Public Notif requested (JUN-17-2011), St Compliance achieved (JUN-17-2011), St Boil Water Order (JUN-17-2011)
Average household size:
This place:
2.7 people
New York:
2.6 people
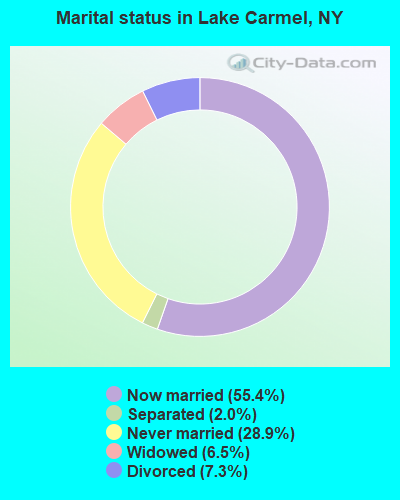
Percentage of family households:
This place:
76.1%
Whole state:
63.5%
Percentage of households with unmarried partners:
This place:
5.7%
Whole state:
6.8%
Likely homosexual households (counted as self-reported same-sex unmarried-partner households)
Lesbian couples: 0.5% of all households
Gay men: 0.4% of all households
13 people in group homes intended for adults in 2010
8 people in homes for the mentally retarded in 2000
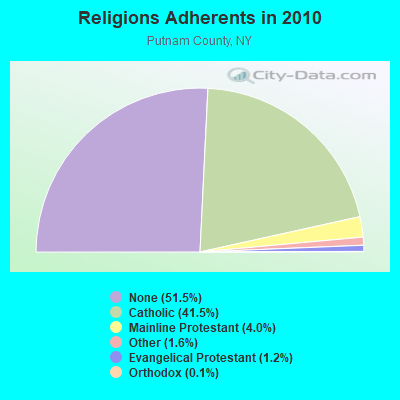
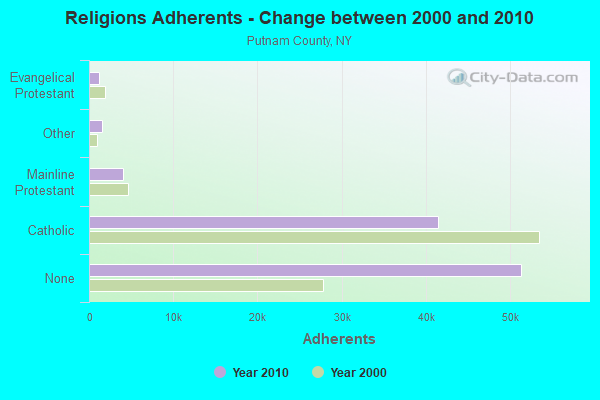
Religion statistics for Lake Carmel, NY (based on Putnam County data)
Religion
Adherents
Congregations
Catholic
41,420
9
Mainline Protestant
4,017
23
Other
1,588
7
Evangelical Protestant
1,208
14
Orthodox
145
2
None
51,332
-
Source: Clifford Grammich, Kirk Hadaway, Richard Houseal, Dale E.Jones, Alexei Krindatch, Richie Stanley and Richard H.Taylor. 2012. 2010 U.S.Religion Census: Religious Congregations & Membership Study. Association of Statisticians of American Religious Bodies. Jones, Dale E., et al. 2002. Congregations and Membership in the United States 2000. Nashville, TN: Glenmary Research Center. Graphs represent county-level data
1.5 Mi North Junction 52 & 311 On 52 (Lat: 41.487028 Lon: -73.677083), Call Sign: WXB895, Assigned Frequencies: 157.485 MHz, Grant Date: 03/13/1998, Expiration Date: 05/05/2003, Cancellation Date: 12/04/2001, Registrant: Ronald Calkins, Route 52, Lake Carmel, NY 10512
FCC Registered Amateur Radio Licenses:
4
Call Sign: KB2JKT, Licensee ID: L00224890, Grant Date: 04/05/2000, Expiration Date: 06/05/2010, Cancellation Date: 06/06/2012, Registrant: Onelio E Galletti, 35 Oneonta Rd, Lake Carmel, NY 10512
Call Sign: KB2SMY, Licensee ID: L00946616, Grant Date: 11/30/2004, Expiration Date: 11/21/2014, Cancellation Date: 11/22/2016, Certifier: Bernard C Cullen, Registrant: Bernard C Cullen, 19 Roslyn Road, Lake Carmel, NY 10512
Call Sign: N2CSX, Grant Date: 09/10/1997, Expiration Date: 09/10/2007, Cancellation Date: 09/11/2009, Registrant: Janet A Lindquist, Rosedale Dr Rfd 4, Lake Carmel, NY 10512
Call Sign: W2ENT, Licensee ID: L01172955, Grant Date: 07/14/2016, Expiration Date: 07/30/2026, Registrant: George S Peters Jr, 1 Beacon Rd, Lake Carmel, NY 10512
Home Mortgage Disclosure Act Aggregated Statistics For Year 2009 (Based on 2 full tracts)
A) FHA, FSA/RHS & VA Home Purchase Loans
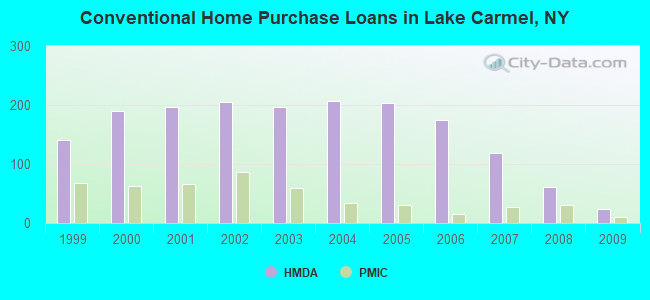
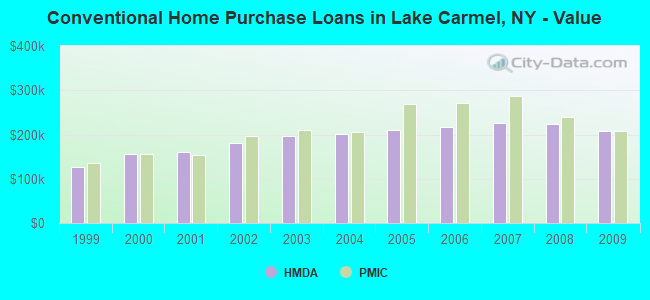
B) Conventional Home Purchase Loans
C) Refinancings
D) Home Improvement Loans
E) Loans on Dwellings For 5+ Families
F) Non-occupant Loans on < 5 Family Dwellings (A B C & D)
G) Loans On Manufactured Home Dwelling (A B C & D)
Number
Average Value
Number
Average Value
Number
Average Value
Number
Average Value
Number
Average Value
Number
Average Value
Number
Average Value
LOANS ORIGINATED
22
$267,455
24
$207,875
104
$206,038
11
$106,727
2
$358,500
5
$220,400
0
$0
APPLICATIONS APPROVED, NOT ACCEPTED
4
$172,500
8
$208,625
16
$203,312
3
$11,667
0
$0
1
$400,000
0
$0
APPLICATIONS DENIED
5
$176,600
8
$198,875
88
$257,148
12
$81,083
0
$0
3
$128,000
1
$215,000
APPLICATIONS WITHDRAWN
3
$238,000
8
$176,875
39
$224,744
2
$215,000
0
$0
1
$100,000
0
$0
FILES CLOSED FOR INCOMPLETENESS
2
$196,500
0
$0
16
$235,188
0
$0
0
$0
0
$0
0
$0
Aggregated Statistics For Year 2008 (Based on 2 full tracts)
A) FHA, FSA/RHS & VA Home Purchase Loans
B) Conventional Home Purchase Loans
C) Refinancings
D) Home Improvement Loans
F) Non-occupant Loans on < 5 Family Dwellings (A B C & D)
G) Loans On Manufactured Home Dwelling (A B C & D)
Number
Average Value
Number
Average Value
Number
Average Value
Number
Average Value
Number
Average Value
Number
Average Value
LOANS ORIGINATED
11
$258,545
61
$223,295
73
$214,466
16
$81,812
8
$177,500
1
$10,000
APPLICATIONS APPROVED, NOT ACCEPTED
4
$326,500
13
$263,000
19
$224,474
1
$20,000
2
$335,000
0
$0
APPLICATIONS DENIED
4
$246,750
25
$233,400
101
$260,614
17
$68,529
6
$245,167
0
$0
APPLICATIONS WITHDRAWN
3
$251,333
5
$237,000
44
$258,386
6
$137,000
2
$200,000
0
$0
FILES CLOSED FOR INCOMPLETENESS
1
$226,000
2
$160,000
13
$249,000
1
$240,000
0
$0
0
$0
Aggregated Statistics For Year 2007 (Based on 2 full tracts)
A) FHA, FSA/RHS & VA Home Purchase Loans
B) Conventional Home Purchase Loans
C) Refinancings
D) Home Improvement Loans
F) Non-occupant Loans on < 5 Family Dwellings (A B C & D)
G) Loans On Manufactured Home Dwelling (A B C & D)
Number
Average Value
Number
Average Value
Number
Average Value
Number
Average Value
Number
Average Value
Number
Average Value
LOANS ORIGINATED
6
$265,000
119
$225,261
162
$203,957
27
$95,593
15
$249,867
2
$35,500
APPLICATIONS APPROVED, NOT ACCEPTED
0
$0
15
$236,733
53
$212,453
5
$176,400
2
$303,000
0
$0
APPLICATIONS DENIED
1
$333,000
28
$232,036
199
$235,487
40
$89,975
11
$216,091
1
$116,000
APPLICATIONS WITHDRAWN
1
$157,000
12
$198,667
91
$221,769
13
$156,000
2
$150,000
0
$0
FILES CLOSED FOR INCOMPLETENESS
0
$0
6
$219,333
44
$264,250
1
$150,000
1
$267,000
0
$0
Aggregated Statistics For Year 2006 (Based on 2 full tracts)
A) FHA, FSA/RHS & VA Home Purchase Loans
B) Conventional Home Purchase Loans
C) Refinancings
D) Home Improvement Loans
F) Non-occupant Loans on < 5 Family Dwellings (A B C & D)
G) Loans On Manufactured Home Dwelling (A B C & D)
Number
Average Value
Number
Average Value
Number
Average Value
Number
Average Value
Number
Average Value
Number
Average Value
LOANS ORIGINATED
4
$255,250
175
$216,503
252
$198,131
41
$93,854
9
$241,000
0
$0
APPLICATIONS APPROVED, NOT ACCEPTED
0
$0
28
$268,071
57
$182,123
13
$63,538
6
$207,667
0
$0
APPLICATIONS DENIED
0
$0
36
$192,583
183
$233,781
41
$103,634
6
$230,500
0
$0
APPLICATIONS WITHDRAWN
1
$345,000
32
$204,969
131
$200,580
17
$78,941
3
$154,333
0
$0
FILES CLOSED FOR INCOMPLETENESS
0
$0
9
$257,111
25
$226,080
3
$36,667
0
$0
1
$133,000
Aggregated Statistics For Year 2005 (Based on 2 full tracts)
A) FHA, FSA/RHS & VA Home Purchase Loans
B) Conventional Home Purchase Loans
C) Refinancings
D) Home Improvement Loans
F) Non-occupant Loans on < 5 Family Dwellings (A B C & D)
G) Loans On Manufactured Home Dwelling (A B C & D)
Number
Average Value
Number
Average Value
Number
Average Value
Number
Average Value
Number
Average Value
Number
Average Value
LOANS ORIGINATED
2
$216,000
204
$211,225
319
$203,803
47
$102,340
16
$178,312
0
$0
APPLICATIONS APPROVED, NOT ACCEPTED
0
$0
26
$207,462
75
$184,813
8
$83,000
2
$222,500
0
$0
APPLICATIONS DENIED
1
$225,000
44
$211,591
170
$210,200
30
$95,567
1
$146,000
1
$250,000
APPLICATIONS WITHDRAWN
1
$177,000
43
$227,093
175
$200,526
18
$163,222
8
$268,500
0
$0
FILES CLOSED FOR INCOMPLETENESS
0
$0
6
$172,333
47
$239,064
3
$134,000
0
$0
0
$0
Aggregated Statistics For Year 2004 (Based on 2 full tracts)
A) FHA, FSA/RHS & VA Home Purchase Loans
B) Conventional Home Purchase Loans
C) Refinancings
D) Home Improvement Loans
E) Loans on Dwellings For 5+ Families
F) Non-occupant Loans on < 5 Family Dwellings (A B C & D)
Number
Average Value
Number
Average Value
Number
Average Value
Number
Average Value
Number
Average Value
Number
Average Value
LOANS ORIGINATED
4
$221,750
207
$201,464
344
$178,052
43
$115,372
0
$0
27
$170,074
APPLICATIONS APPROVED, NOT ACCEPTED
1
$237,000
23
$212,522
67
$164,463
7
$100,143
0
$0
4
$191,000
APPLICATIONS DENIED
2
$248,000
21
$211,810
171
$184,298
39
$77,769
1
$200,000
3
$134,667
APPLICATIONS WITHDRAWN
2
$239,000
30
$214,800
182
$170,885
21
$97,571
1
$100,000
6
$127,167
FILES CLOSED FOR INCOMPLETENESS
0
$0
9
$235,889
34
$212,912
5
$50,600
0
$0
2
$168,500
Aggregated Statistics For Year 2003 (Based on 2 full tracts)
A) FHA, FSA/RHS & VA Home Purchase Loans
B) Conventional Home Purchase Loans
C) Refinancings
D) Home Improvement Loans
F) Non-occupant Loans on < 5 Family Dwellings (A B C & D)
Number
Average Value
Number
Average Value
Number
Average Value
Number
Average Value
Number
Average Value
LOANS ORIGINATED
5
$199,800
196
$196,301
630
$155,100
21
$52,333
22
$156,455
APPLICATIONS APPROVED, NOT ACCEPTED
3
$187,333
29
$198,517
124
$149,435
6
$48,333
2
$156,500
APPLICATIONS DENIED
2
$237,000
33
$174,818
225
$160,022
30
$40,267
8
$152,375
APPLICATIONS WITHDRAWN
1
$188,000
27
$178,037
187
$159,556
12
$25,083
4
$141,750
FILES CLOSED FOR INCOMPLETENESS
0
$0
5
$191,600
39
$142,051
3
$40,333
4
$145,500
Aggregated Statistics For Year 2002 (Based on 2 full tracts)
A) FHA, FSA/RHS & VA Home Purchase Loans
B) Conventional Home Purchase Loans
C) Refinancings
D) Home Improvement Loans
E) Loans on Dwellings For 5+ Families
F) Non-occupant Loans on < 5 Family Dwellings (A B C & D)
Number
Average Value
Number
Average Value
Number
Average Value
Number
Average Value
Number
Average Value
Number
Average Value
LOANS ORIGINATED
15
$180,600
205
$180,927
366
$137,415
25
$44,680
1
$220,000
22
$129,364
APPLICATIONS APPROVED, NOT ACCEPTED
2
$210,000
24
$181,083
95
$132,516
17
$32,824
0
$0
4
$56,750
APPLICATIONS DENIED
3
$156,000
33
$185,091
145
$137,814
27
$34,593
1
$350,000
4
$180,000
APPLICATIONS WITHDRAWN
1
$169,000
20
$181,800
148
$135,101
21
$39,381
0
$0
2
$107,500
FILES CLOSED FOR INCOMPLETENESS
0
$0
7
$162,571
47
$134,255
2
$23,500
0
$0
1
$210,000
Aggregated Statistics For Year 2001 (Based on 2 full tracts)
A) FHA, FSA/RHS & VA Home Purchase Loans
B) Conventional Home Purchase Loans
C) Refinancings
D) Home Improvement Loans
E) Loans on Dwellings For 5+ Families
F) Non-occupant Loans on < 5 Family Dwellings (A B C & D)
Number
Average Value
Number
Average Value
Number
Average Value
Number
Average Value
Number
Average Value
Number
Average Value
LOANS ORIGINATED
24
$154,542
197
$160,249
271
$130,277
34
$33,912
1
$250,000
14
$105,786
APPLICATIONS APPROVED, NOT ACCEPTED
6
$143,667
22
$169,136
69
$110,333
15
$35,933
0
$0
4
$156,750
APPLICATIONS DENIED
3
$141,000
26
$122,654
133
$118,880
41
$28,634
0
$0
3
$87,667
APPLICATIONS WITHDRAWN
4
$177,000
21
$178,810
136
$113,081
23
$32,522
0
$0
4
$173,250
FILES CLOSED FOR INCOMPLETENESS
0
$0
5
$241,400
33
$141,273
6
$63,500
0
$0
0
$0
Aggregated Statistics For Year 2000 (Based on 2 full tracts)
A) FHA, FSA/RHS & VA Home Purchase Loans
B) Conventional Home Purchase Loans
C) Refinancings
D) Home Improvement Loans
E) Loans on Dwellings For 5+ Families
F) Non-occupant Loans on < 5 Family Dwellings (A B C & D)
Number
Average Value
Number
Average Value
Number
Average Value
Number
Average Value
Number
Average Value
Number
Average Value
LOANS ORIGINATED
37
$129,351
190
$155,411
84
$95,071
31
$28,871
1
$13,000
10
$104,200
APPLICATIONS APPROVED, NOT ACCEPTED
2
$129,500
25
$186,320
27
$93,852
12
$30,000
0
$0
1
$10,000
APPLICATIONS DENIED
4
$131,500
41
$127,122
86
$88,221
31
$30,323
0
$0
3
$98,333
APPLICATIONS WITHDRAWN
1
$122,000
19
$129,526
80
$68,338
8
$19,250
0
$0
1
$95,000
FILES CLOSED FOR INCOMPLETENESS
0
$0
8
$177,750
27
$136,815
1
$55,000
0
$0
0
$0
Aggregated Statistics For Year 1999 (Based on 2 full tracts)
A) FHA, FSA/RHS & VA Home Purchase Loans
B) Conventional Home Purchase Loans
C) Refinancings
D) Home Improvement Loans
F) Non-occupant Loans on < 5 Family Dwellings (A B C & D)
#33 on the list of "Top 101 cities that people commute from (largest negative percentage daily daytime population change due to commuting) (population 5,000+)"
#69 on the list of "Top 101 cities with the most people living the same house as 1 year ago (population 5,000+))"
#50 on the list of "Top 101 counties with the highest surface withdrawal of fresh water for public supply"
#51 on the list of "Top 101 counties with the lowest Ozone (1-hour) air pollution readings in 2012 (ppm)"
#72 on the list of "Top 101 counties with the highest total withdrawal of fresh water for public supply"
#89 on the list of "Top 101 counties with the lowest Sulfur Oxides Annual air pollution readings in 2012 (µg/m3)"


 Recent articles from our blog. Our writers, many of them Ph.D. graduates or candidates, create easy-to-read articles on a wide variety of topics.

 (11.1 miles