Lake Orion, Michigan Submit your own pictures of this village and show them to the world
OSM Map
General Map
Google Map
MSN Map
OSM Map
General Map
Google Map
MSN Map
OSM Map
General Map
Google Map
MSN Map
OSM Map
General Map
Google Map
MSN Map
Please wait while loading the map...
Population in 2022: 2,877 (100% urban, 0% rural). Population change since 2000: +6.0%Males: 1,322 Females: 1,555
March 2022 cost of living index in Lake Orion: 95.8 (near average, U.S. average is 100) Percentage of residents living in poverty in 2022: 7.3%
Profiles of local businesses
Business Search - 14 Million verified businesses
Data:
Median household income ($)
Median household income (% change since 2000)
Household income diversity
Ratio of average income to average house value (%)
Ratio of average income to average rent
Median household income ($) - White
Median household income ($) - Black or African American
Median household income ($) - Asian
Median household income ($) - Hispanic or Latino
Median household income ($) - American Indian and Alaska Native
Median household income ($) - Multirace
Median household income ($) - Other Race
Median household income for houses/condos with a mortgage ($)
Median household income for apartments without a mortgage ($)
Races - White alone (%)
Races - White alone (% change since 2000)
Races - Black alone (%)
Races - Black alone (% change since 2000)
Races - American Indian alone (%)
Races - American Indian alone (% change since 2000)
Races - Asian alone (%)
Races - Asian alone (% change since 2000)
Races - Hispanic (%)
Races - Hispanic (% change since 2000)
Races - Native Hawaiian and Other Pacific Islander alone (%)
Races - Native Hawaiian and Other Pacific Islander alone (% change since 2000)
Races - Two or more races (%)
Races - Two or more races (% change since 2000)
Races - Other race alone (%)
Races - Other race alone (% change since 2000)
Racial diversity
Unemployment (%)
Unemployment (% change since 2000)
Unemployment (%) - White
Unemployment (%) - Black or African American
Unemployment (%) - Asian
Unemployment (%) - Hispanic or Latino
Unemployment (%) - American Indian and Alaska Native
Unemployment (%) - Multirace
Unemployment (%) - Other Race
Population density (people per square mile)
Population - Males (%)
Population - Females (%)
Population - Males (%) - White
Population - Males (%) - Black or African American
Population - Males (%) - Asian
Population - Males (%) - Hispanic or Latino
Population - Males (%) - American Indian and Alaska Native
Population - Males (%) - Multirace
Population - Males (%) - Other Race
Population - Females (%) - White
Population - Females (%) - Black or African American
Population - Females (%) - Asian
Population - Females (%) - Hispanic or Latino
Population - Females (%) - American Indian and Alaska Native
Population - Females (%) - Multirace
Population - Females (%) - Other Race
Coronavirus confirmed cases (Jun 19, 2024)
Deaths caused by coronavirus (Jun 19, 2024)
Coronavirus confirmed cases (per 100k population) (Jun 19, 2024)
Deaths caused by coronavirus (per 100k population) (Jun 19, 2024)
Daily increase in number of cases (Jun 19, 2024)
Weekly increase in number of cases (Jun 19, 2024)
Cases doubled (in days) (Jun 19, 2024)
Hospitalized patients (Apr 18, 2022)
Negative test results (Apr 18, 2022)
Total test results (Apr 18, 2022)
COVID Vaccine doses distributed (per 100k population) (Sep 19, 2023)
COVID Vaccine doses administered (per 100k population) (Sep 19, 2023)
COVID Vaccine doses distributed (Sep 19, 2023)
COVID Vaccine doses administered (Sep 19, 2023)
Likely homosexual households (%)
Likely homosexual households (% change since 2000)
Likely homosexual households - Lesbian couples (%)
Likely homosexual households - Lesbian couples (% change since 2000)
Likely homosexual households - Gay men (%)
Likely homosexual households - Gay men (% change since 2000)
Cost of living index
Median gross rent ($)
Median contract rent ($)
Median monthly housing costs ($)
Median house or condo value ($)
Median house or condo value ($ change since 2000)
Mean house or condo value by units in structure - 1, detached ($)
Mean house or condo value by units in structure - 1, attached ($)
Mean house or condo value by units in structure - 2 ($)
Mean house or condo value by units in structure by units in structure - 3 or 4 ($)
Mean house or condo value by units in structure - 5 or more ($)
Mean house or condo value by units in structure - Boat, RV, van, etc. ($)
Mean house or condo value by units in structure - Mobile home ($)
Median house or condo value ($) - White
Median house or condo value ($) - Black or African American
Median house or condo value ($) - Asian
Median house or condo value ($) - Hispanic or Latino
Median house or condo value ($) - American Indian and Alaska Native
Median house or condo value ($) - Multirace
Median house or condo value ($) - Other Race
Median resident age
Resident age diversity
Median resident age - Males
Median resident age - Females
Median resident age - White
Median resident age - Black or African American
Median resident age - Asian
Median resident age - Hispanic or Latino
Median resident age - American Indian and Alaska Native
Median resident age - Multirace
Median resident age - Other Race
Median resident age - Males - White
Median resident age - Males - Black or African American
Median resident age - Males - Asian
Median resident age - Males - Hispanic or Latino
Median resident age - Males - American Indian and Alaska Native
Median resident age - Males - Multirace
Median resident age - Males - Other Race
Median resident age - Females - White
Median resident age - Females - Black or African American
Median resident age - Females - Asian
Median resident age - Females - Hispanic or Latino
Median resident age - Females - American Indian and Alaska Native
Median resident age - Females - Multirace
Median resident age - Females - Other Race
Commute - mean travel time to work (minutes)
Travel time to work - Less than 5 minutes (%)
Travel time to work - Less than 5 minutes (% change since 2000)
Travel time to work - 5 to 9 minutes (%)
Travel time to work - 5 to 9 minutes (% change since 2000)
Travel time to work - 10 to 19 minutes (%)
Travel time to work - 10 to 19 minutes (% change since 2000)
Travel time to work - 20 to 29 minutes (%)
Travel time to work - 20 to 29 minutes (% change since 2000)
Travel time to work - 30 to 39 minutes (%)
Travel time to work - 30 to 39 minutes (% change since 2000)
Travel time to work - 40 to 59 minutes (%)
Travel time to work - 40 to 59 minutes (% change since 2000)
Travel time to work - 60 to 89 minutes (%)
Travel time to work - 60 to 89 minutes (% change since 2000)
Travel time to work - 90 or more minutes (%)
Travel time to work - 90 or more minutes (% change since 2000)
Marital status - Never married (%)
Marital status - Now married (%)
Marital status - Separated (%)
Marital status - Widowed (%)
Marital status - Divorced (%)
Median family income ($)
Median family income (% change since 2000)
Median non-family income ($)
Median non-family income (% change since 2000)
Median per capita income ($)
Median per capita income (% change since 2000)
Median family income ($) - White
Median family income ($) - Black or African American
Median family income ($) - Asian
Median family income ($) - Hispanic or Latino
Median family income ($) - American Indian and Alaska Native
Median family income ($) - Multirace
Median family income ($) - Other Race
Median year house/condo built
Median year apartment built
Year house built - Built 2005 or later (%)
Year house built - Built 2000 to 2004 (%)
Year house built - Built 1990 to 1999 (%)
Year house built - Built 1980 to 1989 (%)
Year house built - Built 1970 to 1979 (%)
Year house built - Built 1960 to 1969 (%)
Year house built - Built 1950 to 1959 (%)
Year house built - Built 1940 to 1949 (%)
Year house built - Built 1939 or earlier (%)
Average household size
Household density (households per square mile)
Average household size - White
Average household size - Black or African American
Average household size - Asian
Average household size - Hispanic or Latino
Average household size - American Indian and Alaska Native
Average household size - Multirace
Average household size - Other Race
Occupied housing units (%)
Vacant housing units (%)
Owner occupied housing units (%)
Renter occupied housing units (%)
Vacancy status - For rent (%)
Vacancy status - For sale only (%)
Vacancy status - Rented or sold, not occupied (%)
Vacancy status - For seasonal, recreational, or occasional use (%)
Vacancy status - For migrant workers (%)
Vacancy status - Other vacant (%)
Residents with income below the poverty level (%)
Residents with income below 50% of the poverty level (%)
Children below poverty level (%)
Poor families by family type - Married-couple family (%)
Poor families by family type - Male, no wife present (%)
Poor families by family type - Female, no husband present (%)
Poverty status for native-born residents (%)
Poverty status for foreign-born residents (%)
Poverty among high school graduates not in families (%)
Poverty among people who did not graduate high school not in families (%)
Residents with income below the poverty level (%) - White
Residents with income below the poverty level (%) - Black or African American
Residents with income below the poverty level (%) - Asian
Residents with income below the poverty level (%) - Hispanic or Latino
Residents with income below the poverty level (%) - American Indian and Alaska Native
Residents with income below the poverty level (%) - Multirace
Residents with income below the poverty level (%) - Other Race
Air pollution - Air Quality Index (AQI)
Air pollution - CO
Air pollution - NO2
Air pollution - SO2
Air pollution - Ozone
Air pollution - PM10
Air pollution - PM25
Air pollution - Pb
Crime - Murders per 100,000 population
Crime - Rapes per 100,000 population
Crime - Robberies per 100,000 population
Crime - Assaults per 100,000 population
Crime - Burglaries per 100,000 population
Crime - Thefts per 100,000 population
Crime - Auto thefts per 100,000 population
Crime - Arson per 100,000 population
Crime - City-data.com crime index
Crime - Violent crime index
Crime - Property crime index
Crime - Murders per 100,000 population (5 year average)
Crime - Rapes per 100,000 population (5 year average)
Crime - Robberies per 100,000 population (5 year average)
Crime - Assaults per 100,000 population (5 year average)
Crime - Burglaries per 100,000 population (5 year average)
Crime - Thefts per 100,000 population (5 year average)
Crime - Auto thefts per 100,000 population (5 year average)
Crime - Arson per 100,000 population (5 year average)
Crime - City-data.com crime index (5 year average)
Crime - Violent crime index (5 year average)
Crime - Property crime index (5 year average)
1996 Presidential Elections Results (%) - Democratic Party (Clinton)
1996 Presidential Elections Results (%) - Republican Party (Dole)
1996 Presidential Elections Results (%) - Other
2000 Presidential Elections Results (%) - Democratic Party (Gore)
2000 Presidential Elections Results (%) - Republican Party (Bush)
2000 Presidential Elections Results (%) - Other
2004 Presidential Elections Results (%) - Democratic Party (Kerry)
2004 Presidential Elections Results (%) - Republican Party (Bush)
2004 Presidential Elections Results (%) - Other
2008 Presidential Elections Results (%) - Democratic Party (Obama)
2008 Presidential Elections Results (%) - Republican Party (McCain)
2008 Presidential Elections Results (%) - Other
2012 Presidential Elections Results (%) - Democratic Party (Obama)
2012 Presidential Elections Results (%) - Republican Party (Romney)
2012 Presidential Elections Results (%) - Other
2016 Presidential Elections Results (%) - Democratic Party (Clinton)
2016 Presidential Elections Results (%) - Republican Party (Trump)
2016 Presidential Elections Results (%) - Other
2020 Presidential Elections Results (%) - Democratic Party (Biden)
2020 Presidential Elections Results (%) - Republican Party (Trump)
2020 Presidential Elections Results (%) - Other
Ancestries Reported - Arab (%)
Ancestries Reported - Czech (%)
Ancestries Reported - Danish (%)
Ancestries Reported - Dutch (%)
Ancestries Reported - English (%)
Ancestries Reported - French (%)
Ancestries Reported - French Canadian (%)
Ancestries Reported - German (%)
Ancestries Reported - Greek (%)
Ancestries Reported - Hungarian (%)
Ancestries Reported - Irish (%)
Ancestries Reported - Italian (%)
Ancestries Reported - Lithuanian (%)
Ancestries Reported - Norwegian (%)
Ancestries Reported - Polish (%)
Ancestries Reported - Portuguese (%)
Ancestries Reported - Russian (%)
Ancestries Reported - Scotch-Irish (%)
Ancestries Reported - Scottish (%)
Ancestries Reported - Slovak (%)
Ancestries Reported - Subsaharan African (%)
Ancestries Reported - Swedish (%)
Ancestries Reported - Swiss (%)
Ancestries Reported - Ukrainian (%)
Ancestries Reported - United States (%)
Ancestries Reported - Welsh (%)
Ancestries Reported - West Indian (%)
Ancestries Reported - Other (%)
Educational Attainment - No schooling completed (%)
Educational Attainment - Less than high school (%)
Educational Attainment - High school or equivalent (%)
Educational Attainment - Less than 1 year of college (%)
Educational Attainment - 1 or more years of college (%)
Educational Attainment - Associate degree (%)
Educational Attainment - Bachelor's degree (%)
Educational Attainment - Master's degree (%)
Educational Attainment - Professional school degree (%)
Educational Attainment - Doctorate degree (%)
School Enrollment - Nursery, preschool (%)
School Enrollment - Kindergarten (%)
School Enrollment - Grade 1 to 4 (%)
School Enrollment - Grade 5 to 8 (%)
School Enrollment - Grade 9 to 12 (%)
School Enrollment - College undergrad (%)
School Enrollment - Graduate or professional (%)
School Enrollment - Not enrolled in school (%)
School enrollment - Public schools (%)
School enrollment - Private schools (%)
School enrollment - Not enrolled (%)
Median number of rooms in houses and condos
Median number of rooms in apartments
Housing units lacking complete plumbing facilities (%)
Housing units lacking complete kitchen facilities (%)
Density of houses
Urban houses (%)
Rural houses (%)
Households with people 60 years and over (%)
Households with people 65 years and over (%)
Households with people 75 years and over (%)
Households with one or more nonrelatives (%)
Households with no nonrelatives (%)
Population in households (%)
Family households (%)
Nonfamily households (%)
Population in families (%)
Family households with own children (%)
Median number of bedrooms in owner occupied houses
Mean number of bedrooms in owner occupied houses
Median number of bedrooms in renter occupied houses
Mean number of bedrooms in renter occupied houses
Median number of vehichles in owner occupied houses
Mean number of vehichles in owner occupied houses
Median number of vehichles in renter occupied houses
Mean number of vehichles in renter occupied houses
Mortgage status - with mortgage (%)
Mortgage status - with second mortgage (%)
Mortgage status - with home equity loan (%)
Mortgage status - with both second mortgage and home equity loan (%)
Mortgage status - without a mortgage (%)
Average family size
Average family size - White
Average family size - Black or African American
Average family size - Asian
Average family size - Hispanic or Latino
Average family size - American Indian and Alaska Native
Average family size - Multirace
Average family size - Other Race
Geographical mobility - Same house 1 year ago (%)
Geographical mobility - Moved within same county (%)
Geographical mobility - Moved from different county within same state (%)
Geographical mobility - Moved from different state (%)
Geographical mobility - Moved from abroad (%)
Place of birth - Born in state of residence (%)
Place of birth - Born in other state (%)
Place of birth - Native, outside of US (%)
Place of birth - Foreign born (%)
Housing units in structures - 1, detached (%)
Housing units in structures - 1, attached (%)
Housing units in structures - 2 (%)
Housing units in structures - 3 or 4 (%)
Housing units in structures - 5 to 9 (%)
Housing units in structures - 10 to 19 (%)
Housing units in structures - 20 to 49 (%)
Housing units in structures - 50 or more (%)
Housing units in structures - Mobile home (%)
Housing units in structures - Boat, RV, van, etc. (%)
House/condo owner moved in on average (years ago)
Renter moved in on average (years ago)
Year householder moved into unit - Moved in 1999 to March 2000 (%)
Year householder moved into unit - Moved in 1995 to 1998 (%)
Year householder moved into unit - Moved in 1990 to 1994 (%)
Year householder moved into unit - Moved in 1980 to 1989 (%)
Year householder moved into unit - Moved in 1970 to 1979 (%)
Year householder moved into unit - Moved in 1969 or earlier (%)
Means of transportation to work - Drove car alone (%)
Means of transportation to work - Carpooled (%)
Means of transportation to work - Public transportation (%)
Means of transportation to work - Bus or trolley bus (%)
Means of transportation to work - Streetcar or trolley car (%)
Means of transportation to work - Subway or elevated (%)
Means of transportation to work - Railroad (%)
Means of transportation to work - Ferryboat (%)
Means of transportation to work - Taxicab (%)
Means of transportation to work - Motorcycle (%)
Means of transportation to work - Bicycle (%)
Means of transportation to work - Walked (%)
Means of transportation to work - Other means (%)
Working at home (%)
Industry diversity
Most Common Industries - Agriculture, forestry, fishing and hunting, and mining (%)
Most Common Industries - Agriculture, forestry, fishing and hunting (%)
Most Common Industries - Mining, quarrying, and oil and gas extraction (%)
Most Common Industries - Construction (%)
Most Common Industries - Manufacturing (%)
Most Common Industries - Wholesale trade (%)
Most Common Industries - Retail trade (%)
Most Common Industries - Transportation and warehousing, and utilities (%)
Most Common Industries - Transportation and warehousing (%)
Most Common Industries - Utilities (%)
Most Common Industries - Information (%)
Most Common Industries - Finance and insurance, and real estate and rental and leasing (%)
Most Common Industries - Finance and insurance (%)
Most Common Industries - Real estate and rental and leasing (%)
Most Common Industries - Professional, scientific, and management, and administrative and waste management services (%)
Most Common Industries - Professional, scientific, and technical services (%)
Most Common Industries - Management of companies and enterprises (%)
Most Common Industries - Administrative and support and waste management services (%)
Most Common Industries - Educational services, and health care and social assistance (%)
Most Common Industries - Educational services (%)
Most Common Industries - Health care and social assistance (%)
Most Common Industries - Arts, entertainment, and recreation, and accommodation and food services (%)
Most Common Industries - Arts, entertainment, and recreation (%)
Most Common Industries - Accommodation and food services (%)
Most Common Industries - Other services, except public administration (%)
Most Common Industries - Public administration (%)
Occupation diversity
Most Common Occupations - Management, business, science, and arts occupations (%)
Most Common Occupations - Management, business, and financial occupations (%)
Most Common Occupations - Management occupations (%)
Most Common Occupations - Business and financial operations occupations (%)
Most Common Occupations - Computer, engineering, and science occupations (%)
Most Common Occupations - Computer and mathematical occupations (%)
Most Common Occupations - Architecture and engineering occupations (%)
Most Common Occupations - Life, physical, and social science occupations (%)
Most Common Occupations - Education, legal, community service, arts, and media occupations (%)
Most Common Occupations - Community and social service occupations (%)
Most Common Occupations - Legal occupations (%)
Most Common Occupations - Education, training, and library occupations (%)
Most Common Occupations - Arts, design, entertainment, sports, and media occupations (%)
Most Common Occupations - Healthcare practitioners and technical occupations (%)
Most Common Occupations - Health diagnosing and treating practitioners and other technical occupations (%)
Most Common Occupations - Health technologists and technicians (%)
Most Common Occupations - Service occupations (%)
Most Common Occupations - Healthcare support occupations (%)
Most Common Occupations - Protective service occupations (%)
Most Common Occupations - Fire fighting and prevention, and other protective service workers including supervisors (%)
Most Common Occupations - Law enforcement workers including supervisors (%)
Most Common Occupations - Food preparation and serving related occupations (%)
Most Common Occupations - Building and grounds cleaning and maintenance occupations (%)
Most Common Occupations - Personal care and service occupations (%)
Most Common Occupations - Sales and office occupations (%)
Most Common Occupations - Sales and related occupations (%)
Most Common Occupations - Office and administrative support occupations (%)
Most Common Occupations - Natural resources, construction, and maintenance occupations (%)
Most Common Occupations - Farming, fishing, and forestry occupations (%)
Most Common Occupations - Construction and extraction occupations (%)
Most Common Occupations - Installation, maintenance, and repair occupations (%)
Most Common Occupations - Production, transportation, and material moving occupations (%)
Most Common Occupations - Production occupations (%)
Most Common Occupations - Transportation occupations (%)
Most Common Occupations - Material moving occupations (%)
People in Group quarters - Institutionalized population (%)
People in Group quarters - Correctional institutions (%)
People in Group quarters - Federal prisons and detention centers (%)
People in Group quarters - Halfway houses (%)
People in Group quarters - Local jails and other confinement facilities (including police lockups) (%)
People in Group quarters - Military disciplinary barracks (%)
People in Group quarters - State prisons (%)
People in Group quarters - Other types of correctional institutions (%)
People in Group quarters - Nursing homes (%)
People in Group quarters - Hospitals/wards, hospices, and schools for the handicapped (%)
People in Group quarters - Hospitals/wards and hospices for chronically ill (%)
People in Group quarters - Hospices or homes for chronically ill (%)
People in Group quarters - Military hospitals or wards for chronically ill (%)
People in Group quarters - Other hospitals or wards for chronically ill (%)
People in Group quarters - Hospitals or wards for drug/alcohol abuse (%)
People in Group quarters - Mental (Psychiatric) hospitals or wards (%)
People in Group quarters - Schools, hospitals, or wards for the mentally retarded (%)
People in Group quarters - Schools, hospitals, or wards for the physically handicapped (%)
People in Group quarters - Institutions for the deaf (%)
People in Group quarters - Institutions for the blind (%)
People in Group quarters - Orthopedic wards and institutions for the physically handicapped (%)
People in Group quarters - Wards in general hospitals for patients who have no usual home elsewhere (%)
People in Group quarters - Wards in military hospitals for patients who have no usual home elsewhere (%)
People in Group quarters - Juvenile institutions (%)
People in Group quarters - Long-term care (%)
People in Group quarters - Homes for abused, dependent, and neglected children (%)
People in Group quarters - Residential treatment centers for emotionally disturbed children (%)
People in Group quarters - Training schools for juvenile delinquents (%)
People in Group quarters - Short-term care, detention or diagnostic centers for delinquent children (%)
People in Group quarters - Type of juvenile institution unknown (%)
People in Group quarters - Noninstitutionalized population (%)
People in Group quarters - College dormitories (includes college quarters off campus) (%)
People in Group quarters - Military quarters (%)
People in Group quarters - On base (%)
People in Group quarters - Barracks, unaccompanied personnel housing (UPH), (Enlisted/Officer), ;and similar group living quarters for military personnel (%)
People in Group quarters - Transient quarters for temporary residents (%)
People in Group quarters - Military ships (%)
People in Group quarters - Group homes (%)
People in Group quarters - Homes or halfway houses for drug/alcohol abuse (%)
People in Group quarters - Homes for the mentally ill (%)
People in Group quarters - Homes for the mentally retarded (%)
People in Group quarters - Homes for the physically handicapped (%)
People in Group quarters - Other group homes (%)
People in Group quarters - Religious group quarters (%)
People in Group quarters - Dormitories (%)
People in Group quarters - Agriculture workers' dormitories on farms (%)
People in Group quarters - Job Corps and vocational training facilities (%)
People in Group quarters - Other workers' dormitories (%)
People in Group quarters - Crews of maritime vessels (%)
People in Group quarters - Other nonhousehold living situations (%)
People in Group quarters - Other noninstitutional group quarters (%)
Residents speaking English at home (%)
Residents speaking English at home - Born in the United States (%)
Residents speaking English at home - Native, born elsewhere (%)
Residents speaking English at home - Foreign born (%)
Residents speaking Spanish at home (%)
Residents speaking Spanish at home - Born in the United States (%)
Residents speaking Spanish at home - Native, born elsewhere (%)
Residents speaking Spanish at home - Foreign born (%)
Residents speaking other language at home (%)
Residents speaking other language at home - Born in the United States (%)
Residents speaking other language at home - Native, born elsewhere (%)
Residents speaking other language at home - Foreign born (%)
Class of Workers - Employee of private company (%)
Class of Workers - Self-employed in own incorporated business (%)
Class of Workers - Private not-for-profit wage and salary workers (%)
Class of Workers - Local government workers (%)
Class of Workers - State government workers (%)
Class of Workers - Federal government workers (%)
Class of Workers - Self-employed workers in own not incorporated business and Unpaid family workers (%)
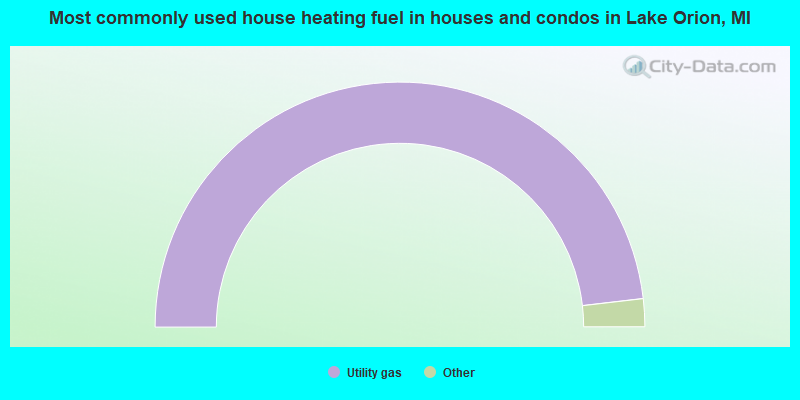
House heating fuel used in houses and condos - Utility gas (%)
House heating fuel used in houses and condos - Bottled, tank, or LP gas (%)
House heating fuel used in houses and condos - Electricity (%)
House heating fuel used in houses and condos - Fuel oil, kerosene, etc. (%)
House heating fuel used in houses and condos - Coal or coke (%)
House heating fuel used in houses and condos - Wood (%)
House heating fuel used in houses and condos - Solar energy (%)
House heating fuel used in houses and condos - Other fuel (%)
House heating fuel used in houses and condos - No fuel used (%)
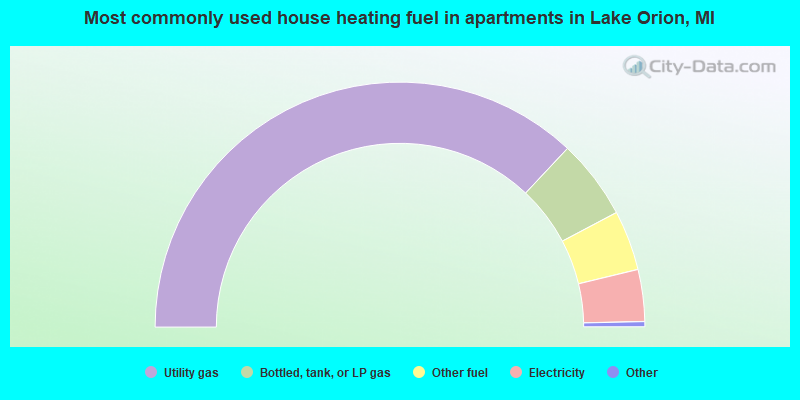
House heating fuel used in apartments - Utility gas (%)
House heating fuel used in apartments - Bottled, tank, or LP gas (%)
House heating fuel used in apartments - Electricity (%)
House heating fuel used in apartments - Fuel oil, kerosene, etc. (%)
House heating fuel used in apartments - Coal or coke (%)
House heating fuel used in apartments - Wood (%)
House heating fuel used in apartments - Solar energy (%)
House heating fuel used in apartments - Other fuel (%)
House heating fuel used in apartments - No fuel used (%)
Armed forces status - In Armed Forces (%)
Armed forces status - Civilian (%)
Armed forces status - Civilian - Veteran (%)
Armed forces status - Civilian - Nonveteran (%)
Fatal accidents locations in years 2005-2021
Fatal accidents locations in 2005
Fatal accidents locations in 2006
Fatal accidents locations in 2007
Fatal accidents locations in 2008
Fatal accidents locations in 2009
Fatal accidents locations in 2010
Fatal accidents locations in 2011
Fatal accidents locations in 2012
Fatal accidents locations in 2013
Fatal accidents locations in 2014
Fatal accidents locations in 2015
Fatal accidents locations in 2016
Fatal accidents locations in 2017
Fatal accidents locations in 2018
Fatal accidents locations in 2019
Fatal accidents locations in 2020
Fatal accidents locations in 2021
Alcohol use - People drinking some alcohol every month (%)
Alcohol use - People not drinking at all (%)
Alcohol use - Average days/month drinking alcohol
Alcohol use - Average drinks/week
Alcohol use - Average days/year people drink much
Audiometry - Average condition of hearing (%)
Audiometry - People that can hear a whisper from across a quiet room (%)
Audiometry - People that can hear normal voice from across a quiet room (%)
Audiometry - Ears ringing, roaring, buzzing (%)
Audiometry - Had a job exposure to loud noise (%)
Audiometry - Had off-work exposure to loud noise (%)
Blood Pressure & Cholesterol - Has high blood pressure (%)
Blood Pressure & Cholesterol - Checking blood pressure at home (%)
Blood Pressure & Cholesterol - Frequently checking blood cholesterol (%)
Blood Pressure & Cholesterol - Has high cholesterol level (%)
Consumer Behavior - Money monthly spent on food at supermarket/grocery store
Consumer Behavior - Money monthly spent on food at other stores
Consumer Behavior - Money monthly spent on eating out
Consumer Behavior - Money monthly spent on carryout/delivered foods
Consumer Behavior - Income spent on food at supermarket/grocery store (%)
Consumer Behavior - Income spent on food at other stores (%)
Consumer Behavior - Income spent on eating out (%)
Consumer Behavior - Income spent on carryout/delivered foods (%)
Current Health Status - General health condition (%)
Current Health Status - Blood donors (%)
Current Health Status - Has blood ever tested for HIV virus (%)
Current Health Status - Left-handed people (%)
Dermatology - People using sunscreen (%)
Diabetes - Diabetics (%)
Diabetes - Had a blood test for high blood sugar (%)
Diabetes - People taking insulin (%)
Diet Behavior & Nutrition - Diet health (%)
Diet Behavior & Nutrition - Milk product consumption (# of products/month)
Diet Behavior & Nutrition - Meals not home prepared (#/week)
Diet Behavior & Nutrition - Meals from fast food or pizza place (#/week)
Diet Behavior & Nutrition - Ready-to-eat foods (#/month)
Diet Behavior & Nutrition - Frozen meals/pizza (#/month)
Drug Use - People that ever used marijuana or hashish (%)
Drug Use - Ever used hard drugs (%)
Drug Use - Ever used any form of cocaine (%)
Drug Use - Ever used heroin (%)
Drug Use - Ever used methamphetamine (%)
Health Insurance - People covered by health insurance (%)
Kidney Conditions-Urology - Avg. # of times urinating at night
Medical Conditions - People with asthma (%)
Medical Conditions - People with anemia (%)
Medical Conditions - People with psoriasis (%)
Medical Conditions - People with overweight (%)
Medical Conditions - Elderly people having difficulties in thinking or remembering (%)
Medical Conditions - People who ever received blood transfusion (%)
Medical Conditions - People having trouble seeing even with glass/contacts (%)
Medical Conditions - People with arthritis (%)
Medical Conditions - People with gout (%)
Medical Conditions - People with congestive heart failure (%)
Medical Conditions - People with coronary heart disease (%)
Medical Conditions - People with angina pectoris (%)
Medical Conditions - People who ever had heart attack (%)
Medical Conditions - People who ever had stroke (%)
Medical Conditions - People with emphysema (%)
Medical Conditions - People with thyroid problem (%)
Medical Conditions - People with chronic bronchitis (%)
Medical Conditions - People with any liver condition (%)
Medical Conditions - People who ever had cancer or malignancy (%)
Mental Health - People who have little interest in doing things (%)
Mental Health - People feeling down, depressed, or hopeless (%)
Mental Health - People who have trouble sleeping or sleeping too much (%)
Mental Health - People feeling tired or having little energy (%)
Mental Health - People with poor appetite or overeating (%)
Mental Health - People feeling bad about themself (%)
Mental Health - People who have trouble concentrating on things (%)
Mental Health - People moving or speaking slowly or too fast (%)
Mental Health - People having thoughts they would be better off dead (%)
Oral Health - Average years since last visit a dentist
Oral Health - People embarrassed because of mouth (%)
Oral Health - People with gum disease (%)
Oral Health - General health of teeth and gums (%)
Oral Health - Average days a week using dental floss/device
Oral Health - Average days a week using mouthwash for dental problem
Oral Health - Average number of teeth
Pesticide Use - Households using pesticides to control insects (%)
Pesticide Use - Households using pesticides to kill weeds (%)
Physical Activity - People doing vigorous-intensity work activities (%)
Physical Activity - People doing moderate-intensity work activities (%)
Physical Activity - People walking or bicycling (%)
Physical Activity - People doing vigorous-intensity recreational activities (%)
Physical Activity - People doing moderate-intensity recreational activities (%)
Physical Activity - Average hours a day doing sedentary activities
Physical Activity - Average hours a day watching TV or videos
Physical Activity - Average hours a day using computer
Physical Functioning - People having limitations keeping them from working (%)
Physical Functioning - People limited in amount of work they can do (%)
Physical Functioning - People that need special equipment to walk (%)
Physical Functioning - People experiencing confusion/memory problems (%)
Physical Functioning - People requiring special healthcare equipment (%)
Prescription Medications - Average number of prescription medicines taking
Preventive Aspirin Use - Adults 40+ taking low-dose aspirin (%)
Reproductive Health - Vaginal deliveries (%)
Reproductive Health - Cesarean deliveries (%)
Reproductive Health - Deliveries resulted in a live birth (%)
Reproductive Health - Pregnancies resulted in a delivery (%)
Reproductive Health - Women breastfeeding newborns (%)
Reproductive Health - Women that had a hysterectomy (%)
Reproductive Health - Women that had both ovaries removed (%)
Reproductive Health - Women that have ever taken birth control pills (%)
Reproductive Health - Women taking birth control pills (%)
Reproductive Health - Women that have ever used Depo-Provera or injectables (%)
Reproductive Health - Women that have ever used female hormones (%)
Sexual Behavior - People 18+ that ever had sex (vaginal, anal, or oral) (%)
Sexual Behavior - Males 18+ that ever had vaginal sex with a woman (%)
Sexual Behavior - Males 18+ that ever performed oral sex on a woman (%)
Sexual Behavior - Males 18+ that ever had anal sex with a woman (%)
Sexual Behavior - Males 18+ that ever had any sex with a man (%)
Sexual Behavior - Females 18+ that ever had vaginal sex with a man (%)
Sexual Behavior - Females 18+ that ever performed oral sex on a man (%)
Sexual Behavior - Females 18+ that ever had anal sex with a man (%)
Sexual Behavior - Females 18+ that ever had any kind of sex with a woman (%)
Sexual Behavior - Average age people first had sex
Sexual Behavior - Average number of female sex partners in lifetime (males 18+)
Sexual Behavior - Average number of female vaginal sex partners in lifetime (males 18+)
Sexual Behavior - Average age people first performed oral sex on a woman (18+)
Sexual Behavior - Average number of woman performed oral sex on in lifetime (18+)
Sexual Behavior - Average number of male sex partners in lifetime (males 18+)
Sexual Behavior - Average number of male anal sex partners in lifetime (males 18+)
Sexual Behavior - Average age people first performed oral sex on a man (18+)
Sexual Behavior - Average number of male oral sex partners in lifetime (18+)
Sexual Behavior - People using protection when performing oral sex (%)
Sexual Behavior - Average number of times people have vaginal or anal sex a year
Sexual Behavior - People having sex without condom (%)
Sexual Behavior - Average number of male sex partners in lifetime (females 18+)
Sexual Behavior - Average number of male vaginal sex partners in lifetime (females 18+)
Sexual Behavior - Average number of female sex partners in lifetime (females 18+)
Sexual Behavior - Circumcised males 18+ (%)
Sleep Disorders - Average hours sleeping at night
Sleep Disorders - People that has trouble sleeping (%)
Smoking-Cigarette Use - People smoking cigarettes (%)
Taste & Smell - People 40+ having problems with smell (%)
Taste & Smell - People 40+ having problems with taste (%)
Taste & Smell - People 40+ that ever had wisdom teeth removed (%)
Taste & Smell - People 40+ that ever had tonsils teeth removed (%)
Taste & Smell - People 40+ that ever had a loss of consciousness because of a head injury (%)
Taste & Smell - People 40+ that ever had a broken nose or other serious injury to face or skull (%)
Taste & Smell - People 40+ that ever had two or more sinus infections (%)
Weight - Average height (inches)
Weight - Average weight (pounds)
Weight - Average BMI
Weight - People that are obese (%)
Weight - People that ever were obese (%)
Weight - People trying to lose weight (%)
Officers per 1,000 residents here:
1.25Michigan average:
1.86
Latest news from Lake Orion, MI collected exclusively by city-data.com from local newspapers, TV, and radio stations
Ancestries: German (21.6%), American (17.8%), Irish (11.1%), English (7.5%), European (7.2%), Polish (5.6%).
Current Local Time:
Land area: 0.76 square miles.
Population density: 3,789 people per square mile (average).
166 residents are foreign born (2.5% Asia , 1.6% Latin America , 0.7% Europe ).
This village:
5.7%Michigan:
6.9%
Median real estate property taxes paid for housing units with mortgages in 2022: $6,316 (1.5%)Median real estate property taxes paid for housing units with no mortgage in 2022: $3,981 (1.5%)
Nearest city with pop. 50,000+: Rochester Hills, MI
Nearest city with pop. 200,000+: Detroit, MI
Nearest city with pop. 1,000,000+: Chicago, IL
Nearest cities:
Latitude: 42.78 N, Longitude: 83.25 W
Single-family new house construction building permits:
2021: 2 buildings , average cost: $275,0002019: 1 building , cost: $278,1002018: 5 buildings , average cost: $278,1002017: 5 buildings , average cost: $283,0002016: 2 buildings , average cost: $177,5002015: 4 buildings , average cost: $288,4002014: 4 buildings , average cost: $242,6002013: 2 buildings , average cost: $250,0002012: 6 buildings , average cost: $151,5002011: 11 buildings , average cost: $158,2002010: 6 buildings , average cost: $108,000Unemployment in December 2023:
Most common occupations in Lake Orion, MI (%)
Both Males Females
Preschool, kindergarten, elementary, and middle school teachers (7.0%)
Other management occupations, except farmers and farm managers (5.6%)
Building and grounds cleaning and maintenance occupations (5.0%)
Engineers (4.2%)
Sales representatives, services, wholesale and manufacturing (4.1%)
Metal workers and plastic workers (3.8%)
Waiters and waitresses (3.7%)
Engineers (7.0%)
Other management occupations, except farmers and farm managers (6.8%)
Metal workers and plastic workers (6.8%)
Driver/sales workers and truck drivers (6.3%)
Building and grounds cleaning and maintenance occupations (5.8%)
Sales representatives, services, wholesale and manufacturing (4.6%)
Other production occupations, including supervisors (4.1%)
Preschool, kindergarten, elementary, and middle school teachers (11.9%)
Waiters and waitresses (8.5%)
Other office and administrative support workers, including supervisors (5.2%)
Other management occupations, except farmers and farm managers (4.1%)
Cashiers (4.1%)
Building and grounds cleaning and maintenance occupations (4.0%)
Bookkeeping, accounting, and auditing clerks (3.7%)
Tornado activity:
Lake Orion-area historical tornado activity is slightly above Michigan state average. It is 33% greater than the overall U.S. average.
On 6/8/1953, a category F5 (max. wind speeds 261-318 mph) tornado 28.1 miles away from the Lake Orion village center killed 116 people and injured 844 people and caused between $5,000,000 and $50,000,000 in damages.
On 3/20/1976, a category F4 (max. wind speeds 207-260 mph) tornado 16.8 miles away from the village center killed one person and injured 55 people and caused between $5,000,000 and $50,000,000 in damages.
Earthquake activity:
Lake Orion-area historical earthquake activity is significantly above Michigan state average. It is 50% smaller than the overall U.S. average. On 9/25/1998 at 19:52:52, a magnitude 5.2 (4.8 MB, 4.3 MS, 5.2 LG, 4.5 MW, Depth: 3.1 mi, Class: Moderate, Intensity: VI - VII) earthquake occurred 171.3 miles away from the city center On 1/31/1986 at 16:46:43, a magnitude 5.0 (5.0 MB) earthquake occurred 134.6 miles away from the city center On 7/12/1986 at 08:19:37, a magnitude 4.5 (4.5 MB, Class: Light, Intensity: IV - V) earthquake occurred 166.0 miles away from Lake Orion center On 5/2/2015 at 16:23:07, a magnitude 4.2 (4.2 MW, Depth: 2.8 mi) earthquake occurred 117.6 miles away from Lake Orion center On 7/27/1980 at 18:52:21, a magnitude 5.2 (5.1 MB, 4.7 MS, 5.0 UK, 5.2 UK) earthquake occurred 318.9 miles away from Lake Orion center On 8/23/2011 at 17:51:04, a magnitude 5.8 (5.8 MW, Depth: 3.7 mi) earthquake occurred 438.0 miles away from the city center Magnitude types: regional Lg-wave magnitude (LG), body-wave magnitude (MB), surface-wave magnitude (MS), moment magnitude (MW) Natural disasters: The number of natural disasters in Oakland County (12) is smaller than the US average (15).Major Disasters (Presidential) Declared: 6Emergencies Declared: 5Storms: 6, Floods: 5, Tornadoes: 3, Winter Storms: 2, Blizzard: 1, Hurricane: 1, Power Outage: 1, Snowstorm: 1, Wind: 1, Other: 1 (Note: some incidents may be assigned to more than one category). Hospitals and medical centers in Lake Orion: BALD MOUNTAIN SURGICAL CENTER (1375 S LAPEER ROAD, SUITE 100) LAKE ORION NURSING CENTER (585 EAST FLINT STREET)
Other hospitals and medical centers near Lake Orion: BORTZ HEALTH CARE OF OAKLAND (Nursing Home, about 5 miles away; ORION, MI)
CLARKSTON SPECIALTY HEALTHCARE CENTER (Nursing Home, about 8 miles away; CLARKSTON, MI)
HOME HEALTH OUTREACH (Home Health Center, about 8 miles away; AUBURN HILLS, MI)
BEAUMONT HOSPITAL - ROCHESTER HILLS (Dialysis Facility, about 9 miles away; ROCHESTER HILLS, MI)
MEDILODGE OF ROCHESTER HILLS, INC (Nursing Home, about 9 miles away; ROCHESTER HILLS, MI)
HAVENWYCK HOSPITAL (Hospital, about 9 miles away; AUBURN HILLS, MI)
CRITTENTON HOSPITAL MEDICAL CENTER (about 9 miles away; ROCHESTER, MI)
Amtrak stations near Lake Orion: 11 miles: PONTIAC (1600 WIDE TRACK DR.) Services: partially wheelchair accessible, enclosed waiting area, public payphones, vending machines, free short-term parking, free long-term parking, call for taxi service, intercity bus service, public transit connection.
17 miles: BIRMINGHAM (449 S. ETON ST.) Services: public payphones, free short-term parking, free long-term parking, call for taxi service, public transit connection.
19 miles: LAPEER (73 HOWARD ST.) Services: fully wheelchair accessible, enclosed waiting area, public restrooms, public payphones, free short-term parking, free long-term parking, call for taxi service.
Colleges/universities with over 2000 students nearest to Lake Orion:
Oakland University (about 8 miles; Rochester Hills, MI ; Full-time enrollment: 16,449)
Baker College of Auburn Hills (about 9 miles; Auburn Hills, MI ; FT enrollment: 2,284)
Oakland Community College (about 15 miles; Bloomfield Hills, MI ; FT enrollment: 18,956)
Lawrence Technological University (about 22 miles; Southfield, MI ; FT enrollment: 2,430)
Baker College of Clinton Township (about 24 miles; Clinton Township, MI ; FT enrollment: 3,413)
Macomb Community College (about 24 miles; Warren, MI ; FT enrollment: 15,669)
University of Detroit Mercy (about 26 miles; Detroit, MI ; FT enrollment: 3,406)
Public high schools in Lake Orion:
Private high school in Lake Orion: LAKE ORION BAPTIST SCHOOL Students: 104, Location: 255 E SCRIPPS RD, Grades: KG-12)
Public elementary/middle schools in Lake Orion: SCRIPPS MIDDLE SCHOOL Students: 659, Location: 385 EAST SCRIPPS RD, Grades: 6-8)ORION OAKS ELEMENTARY SCHOOL Students: 615, Location: 1255 JOSLYN RD, Grades: PK-5)WALDON MIDDLE SCHOOL Students: 602, Location: 2509 WALDON RD, Grades: 6-8)PAINT CREEK ELEMENTARY SCHOOL Students: 567, Location: 2800 INDIANWOOD RD, Grades: PK-5)WEBBER SCHOOL Students: 495, Location: 3191 WEST CLARKSTON RD, Grades: PK-5)STADIUM DRIVE ELEMENTARY SCHOOL Students: 485, Location: 244 STADIUM DR, Grades: KG-5)CARPENTER YEAR ROUND ELEM. SCHOOL Students: 457, Location: 2290 FLINTRIDGE ST, Grades: KG-5)PINE TREE ELEMENTARY SCHOOL Students: 455, Location: 590 PINE TREE RD, Grades: KG-5)BLANCHE SIMS ELEMENTARY SCHOOL Students: 410, Location: 465 EAST JACKSON ST, Grades: KG-5)Private elementary/middle schools in Lake Orion: ST JOSEPH SCHOOL Students: 384, Location: 703 N LAPEER RD, Grades: PK-8)
GOOD SHEPHERD LUTHERAN SCHOOL Students: 88, Location: 1950 S BALDWIN RD, Grades: PK-8)
DIVINE GRACE LUTHERAN SCHOOL Students: 60, Location: 3000 S LAPEER RD, Grades: PK-8)
OAK HOLLOW CHRISTIAN SCHOOL Students: 9, Location: 120 MANITOU LN, Grades: KG-8)
See full list of schools located in Lake Orion Library in Lake Orion: ORION TOWNSHIP PUBLIC LIBRARY Operating income: $2,907,029; Location: 825 JOSLYN ROAD; 162,256 books ; 9,177 audio materials ; 10,628 video materials ; 25 local licensed databases ; 16 other licensed databases ; 482 print serial subscriptions )
User-submitted facts and corrections:
Please add the following church to your listing for Lake Orion, Mi. King of Kings Lutheran Church 1715 S. Lapeer Rd. Lake Orion, MI 48360 P: 248 693 1676 www.kofklo.org
Oakview Middle School; 917 Lake George Road; grades 06-08
Birthplace of: Cynthia Watros - Actor, Raymond Plouhar - Marine, Troy Milam - Ice hockey player, Jamie Milam - Ice hockey player.
Oakland County has a predicted average indoor radon screening level between 2 and 4 pCi/L (pico curies per liter) - Moderate Potential Drinking water stations with addresses in Lake Orion and their reported violations in the past:
KNIGHTS OF COLUMBUS (Population served: 200, Groundwater):
Past health violations:
MCL, Monthly (TCR) - In SEP-2007, Contaminant: Coliform. Follow-up actions: St Violation/Reminder Notice (SEP-11-2007), St Public Notif requested (SEP-11-2007), St Site Visit (enforcement) (SEP-12-2007), St Public Notif received (SEP-12-2007), St Compliance achieved (SEP-19-2007)
MCL, Monthly (TCR) - In AUG-2005, Contaminant: Coliform. Follow-up actions: St Violation/Reminder Notice (AUG-23-2005), St Public Notif requested (AUG-23-2005), St Compliance achieved (SEP-02-2005), St Public Notif received (SEP-21-2005)
Population served: 150, Groundwater):
Past monitoring violations:
One regular monitoring violation
Population served: 150, Groundwater):
Past health violations:
MCL, Acute (TCR) - In SEP-2011, Contaminant: Coliform. Follow-up actions: St Public Notif requested (OCT-03-2011), St Violation/Reminder Notice (OCT-03-2011), St Public Notif received (OCT-03-2011), St Site Visit (enforcement) (OCT-03-2011), St Compliance achieved (NOV-01-2011)
MCL, Acute (TCR) - In JUN-2011, Contaminant: Coliform. Follow-up actions: St Public Notif received (JUN-14-2011), St Violation/Reminder Notice (JUN-14-2011), St Site Visit (enforcement) (JUN-14-2011), St Public Notif requested (JUN-14-2011), St Compliance achieved (JUL-21-2011)
MCL, Monthly (TCR) - In JUN-2010, Contaminant: Coliform. Follow-up actions: St Public Notif received (JUN-16-2010), St Public Notif requested (JUN-16-2010), St Site Visit (enforcement) (JUN-16-2010), St Violation/Reminder Notice (JUN-16-2010), St Compliance achieved (JUL-06-2010)
MCL, Monthly (TCR) - In SEP-2009, Contaminant: Coliform. Follow-up actions: St Site Visit (enforcement) (SEP-10-2009), St Violation/Reminder Notice (SEP-10-2009), St Public Notif requested (SEP-10-2009), St Compliance achieved (SEP-23-2009)
MCL, Monthly (TCR) - In SEP-2006, Contaminant: Coliform. Follow-up actions: St Public Notif received (SEP-12-2006), St Public Notif requested (SEP-12-2006), St Site Visit (enforcement) (SEP-12-2006), St Violation/Reminder Notice (SEP-12-2006), St Compliance achieved (SEP-20-2006)
MCL, Monthly (TCR) - In SEP-2005, Contaminant: Coliform. Follow-up actions: St Violation/Reminder Notice (SEP-07-2005), St Public Notif requested (SEP-07-2005), St Compliance achieved (SEP-28-2005), St Public Notif received (SEP-28-2005)
Population served: 150, Groundwater):
Past health violations:
MCL, Monthly (TCR) - In NOV-2006, Contaminant: Coliform. Follow-up actions: St Public Notif requested (NOV-21-2006), St Violation/Reminder Notice (NOV-21-2006), St Public Notif received (NOV-22-2006), St Site Visit (enforcement) (NOV-22-2006), St Compliance achieved (DEC-06-2006)
MCL, Monthly (TCR) - In SEP-2005, Contaminant: Coliform. Follow-up actions: St Violation/Reminder Notice (SEP-15-2005), St Public Notif requested (SEP-15-2005), St Compliance achieved (SEP-20-2005), St Public Notif received (SEP-21-2005)
Population served: 100, Groundwater):
Past monitoring violations:
One routine major monitoring violation
Population served: 100, Groundwater):
Past health violations:
MCL, Monthly (TCR) - In AUG-2007, Contaminant: Coliform. Follow-up actions: St Public Notif received (AUG-24-2007), St Violation/Reminder Notice (AUG-24-2007), St Public Notif requested (AUG-24-2007), St Site Visit (enforcement) (AUG-24-2007), St Intentional no-action (DEC-10-2007), St Compliance achieved (MAY-13-2008)
Past monitoring violations:
One routine major monitoring violation
Population served: 100, Groundwater):
Past health violations:
MCL, Monthly (TCR) - In SEP-2008, Contaminant: Coliform. Follow-up actions: St Site Visit (enforcement) (SEP-04-2008), St Violation/Reminder Notice (SEP-04-2008), St Public Notif received (SEP-04-2008), St Public Notif requested (SEP-04-2008), St Compliance achieved (SEP-26-2008)
Population served: 100, Groundwater):
Past health violations:
MCL, Monthly (TCR) - In MAR-2007, Contaminant: Coliform. Follow-up actions: St Public Notif requested (MAR-07-2007), St Violation/Reminder Notice (MAR-07-2007), St Site Visit (enforcement) (MAR-08-2007), St Public Notif received (MAR-08-2007), St Compliance achieved (MAR-14-2007)
Drinking water stations with addresses in Lake Orion that have no violations reported:
INDIANWOOD GOLF & COUNTRY CLUB (Population served: 300, Primary Water Source Type: Groundwater)
LIONS BEAR LAKE CAMP (Population served: 130, Primary Water Source Type: Groundwater)
MDNR BALD MOUNTAIN-SHOOTING RNG (Population served: 75, Primary Water Source Type: Groundwater)
Average household size: This village:
2.2 peopleMichigan:
2.5 people
Percentage of family households: This village:
54.4%Whole state:
66.0%
Percentage of households with unmarried partners: This village:
7.2%Whole state:
6.4%
Likely homosexual households (counted as self-reported same-sex unmarried-partner households)
Lesbian couples: 0.2% of all households Gay men: 0.1% of all households
116 people in nursing facilities/skilled-nursing facilities in 2010people in other noninstitutional facilities in 2010people in nursing homes in 2000
Banks with most branches in Lake Orion (2011 data):
Citizens Community Federal: Lake Orion Branch at 688 S Lapeer Rd., branch established on 1992/02/04; Lake Orion High School Branch at 495 East Scripps Road, branch established on 1997/01/15. Info updated 2011/07/21: Bank assets: $530.8 mil, Deposits: $444.7 mil, headquarters in Eau Claire, WI, positive income , Mortgage Lending Specialization, 28 total offices
Bank of America, National Association: Lake Orion Branch at 1391 South Lapeer Road, branch established on 1990/11/07; Orion Township Branch at 831 Brown Road, branch established on 2005/11/21. Info updated 2009/11/18: Bank assets: $1,451,969.3 mil, Deposits: $1,077,176.8 mil, headquarters in Charlotte, NC, positive income , 5782 total offices , Holding Company: Bank Of America Corporation
Oxford Bank: Lake Orion Branch at 1115 South Lapeer Road, branch established on 1973/05/21; Commercial Banking Center Branch at 720 North Lapeer Road, Suite 201, branch established on 2007/07/01. Info updated 2009/10/07: Bank assets: $264.3 mil, Deposits: $250.5 mil, headquarters in Oxford, MI, positive income , Commercial Lending Specialization, 11 total offices , Holding Company: Oxford Bank Corporation
Independent Bank: Lake Orion Loan Production Office at 400 South Broadway, branch established on 2003/03/15. Info updated 2010/10/20: Bank assets: $2,304.7 mil, Deposits: $2,092.2 mil, headquarters in Ionia, MI, negative income in the last year , Commercial Lending Specialization, 107 total offices , Holding Company: Independent Bank Corporation
JPMorgan Chase Bank, National Association: Baldwin Maybee Banking Center Branch at 3515 South Baldwin Road, branch established on 2004/07/14. Info updated 2011/11/10: Bank assets: $1,811,678.0 mil, Deposits: $1,190,738.0 mil, headquarters in Columbus, OH, positive income , International Specialization, 5577 total offices , Holding Company: Jpmorgan Chase & Co.
Comerica Bank: Lake Orion Branch at 1237 South Lapeer Road, branch established on 2002/09/17. Info updated 2011/07/29: Bank assets: $60,970.5 mil, Deposits: $48,300.9 mil, headquarters in Dallas, TX, positive income , Commercial Lending Specialization, 497 total offices , Holding Company: Comerica Incorporated
PNC Bank, National Association: Lake Orion Branch at 88 West Flint Street, branch established on 1957/10/01. Info updated 2012/03/20: Bank assets: $263,309.6 mil, Deposits: $197,343.0 mil, headquarters in Wilmington, DE, positive income , Commercial Lending Specialization, 3085 total offices , Holding Company: Pnc Financial Services Group, Inc., The
TCF National Bank: Lake Orion Branch at 471 South Broadway, branch established on 1934/01/01. Info updated 2009/11/23: Bank assets: $19,007.0 mil, Deposits: $12,377.0 mil, headquarters in Sioux Falls, SD, positive income , Commercial Lending Specialization, 441 total offices , Holding Company: Tcf Financial Corporation
Citizens Bank: Brown/Baldwin Branch at 4983 Baldwin Road, branch established on 2005/01/01. Info updated 2011/08/01: Bank assets: $9,212.3 mil, Deposits: $7,452.0 mil, headquarters in Flint, MI, positive income , Commercial Lending Specialization, 220 total offices , Holding Company: Citizens Republic Bancorp, Inc.
For population 15 years and over in Lake Orion:
Never married: 25.4%Now married: 52.5%Separated: 0.3%Widowed: 9.4%Divorced: 12.3% For population 25 years and over in Lake Orion:
High school or higher: 94.4%Bachelor's degree or higher: 43.4%Graduate or professional degree: 16.3%Unemployed: 4.6%Mean travel time to work (commute): 21.5 minutes
Education Gini index (Inequality in education) Here:
9.6Michigan average:
11.0
Religion statistics for Lake Orion, MI (based on Oakland County data)
Religion Adherents Congregations Catholic 289,116 64 Evangelical Protestant 155,826 319 Mainline Protestant 73,373 159 Other 58,590 117 Black Protestant 16,826 35 Orthodox 13,844 23 None 594,787 -
Source: Clifford Grammich, Kirk Hadaway, Richard Houseal, Dale E.Jones, Alexei Krindatch, Richie Stanley and Richard H.Taylor. 2012. 2010 U.S.Religion Census: Religious Congregations & Membership Study. Association of Statisticians of American Religious Bodies. Jones, Dale E., et al. 2002. Congregations and Membership in the United States 2000. Nashville, TN: Glenmary Research Center. Graphs represent county-level data
Food Environment Statistics: Number of grocery stores : 293Oakland County :
2.44 / 10,000 pop.State :
2.34 / 10,000 pop.
Number of supercenters and club stores : 22Oakland County :
0.18 / 10,000 pop.Michigan :
0.18 / 10,000 pop.
Number of convenience stores (no gas) : 162This county :
1.35 / 10,000 pop.Michigan :
1.52 / 10,000 pop.
Number of convenience stores (with gas) : 292Oakland County :
2.43 / 10,000 pop.Michigan :
2.99 / 10,000 pop.
Number of full-service restaurants : 983This county :
8.18 / 10,000 pop.Michigan :
6.80 / 10,000 pop.
Adult diabetes rate : Oakland County :
8.8%State :
9.7%
Adult obesity rate : Oakland County :
25.6%Michigan :
29.7%
Low-income preschool obesity rate : Oakland County :
13.0%State :
13.4%
Health and Nutrition:
Average overall health of teeth and gums : This city:
58.4%Michigan:
47.9%
Average BMI : Lake Orion:
27.9Michigan:
28.7
People feeling badly about themselves : This city:
18.8%Michigan:
20.6%
People not drinking alcohol at all : This city:
6.5%Michigan:
10.4%
Average hours sleeping at night : Lake Orion:
7.0Michigan:
6.8
Overweight people : Lake Orion:
34.0%Michigan:
34.1%
General health condition : Lake Orion:
64.0%State:
57.0%
Average condition of hearing : Lake Orion:
81.9%Michigan:
79.6%
More about Health and Nutrition of Lake Orion, MI Residents
Local government employment and payroll (March 2022)
Function
Full-time employees
Monthly full-time payroll
Average yearly full-time wage
Part-time employees
Monthly part-time payroll
Streets and Highways
7 $24,505 $42,009 0 $0 Other Government Administration
4 $20,019 $60,057 20 $12,995 Police Protection - Officers
4 $21,262 $63,786 7 $8,235 Financial Administration
1 $4,156 $49,872 2 $3,392 Police - Other
1 $3,603 $43,236 2 $950
Totals for Government
17 $73,545 $51,914 31 $25,572
Lake Orion government finances - Expenditure in 2018 (per resident):
Current Operations - Regular Highways: $732,000 ($254.43)
Police Protection: $725,000 ($252.00)General - Other: $516,000 ($179.35)Water Utilities: $496,000 ($172.40)Sewerage: $310,000 ($107.75)General Public Buildings: $308,000 ($107.06)Central Staff Services: $246,000 ($85.51)Solid Waste Management: $164,000 ($57.00)Financial Administration: $85,000 ($29.54)Parks and Recreation: $74,000 ($25.72)General - Interest on Debt: $2,000 ($0.70)
Intergovernmental to Local - Other - Sewerage: $693,000 ($240.88)
Other - General - Other: $414,000 ($143.90)Other Capital Outlay - General - Other: $243,000 ($84.46)
Police Protection: $23,000 ($7.99)Total Salaries and Wages: $1,054,000 ($366.35)
Water Utilities - Interest on Debt: $20,000 ($6.95)
Lake Orion government finances - Revenue in 2018 (per resident):
Charges - Sewerage: $655,000 ($227.67)
Other: $445,000 ($154.68)Miscellaneous - General Revenue - Other: $194,000 ($67.43)
Fines and Forfeits: $70,000 ($24.33)Interest Earnings: $34,000 ($11.82)Revenue - Water Utilities: $1,051,000 ($365.31)
State Intergovernmental - General Local Government Support: $308,000 ($107.06)
Highways: $272,000 ($94.54)Other: $129,000 ($44.84)Tax - Property: $1,975,000 ($686.48)
Lake Orion government finances - Debt in 2018 (per resident):
Long Term Debt - Outstanding Unspecified Public Purpose: $1,153,000 ($400.76)
Beginning Outstanding - Unspecified Public Purpose: $982,000 ($341.33)Issue, Unspecified Public Purpose: $248,000 ($86.20)Retired Unspecified Public Purpose: $77,000 ($26.76)
Lake Orion government finances - Cash and Securities in 2018 (per resident):
Other Funds - Cash and Securities: $3,605,000 ($1253.04)
5.91% of this county's 2021 resident taxpayers lived in other counties in 2020 ($79,655 average adjusted gross income )
Here:
5.91%Michigan average:
5.83%
0.01% of residents moved from foreign countries ($78 average AGI )Oakland County:
0.01%Michigan average:
0.00%
Top counties from which taxpayers relocated into this county between 2020 and 2021:
6.21% of this county's 2020 resident taxpayers moved to other counties in 2021 ($89,748 average adjusted gross income )
Here:
6.21%Michigan average:
5.95%
0.01% of residents moved to foreign countries ($55 average AGI )Oakland County:
0.01%Michigan average:
0.00%
Top counties to which taxpayers relocated from this county between 2020 and 2021:
Businesses in Lake Orion, MI
Name Count Name Count
Advance Auto Parts 1 KFC 1 Applebee's 1 Kmart 1 Arby's 1 Kohl's 1 AutoZone 1 Kroger 2 Best Western 1 Little Caesars Pizza 2 Buffalo Wild Wings 1 McDonald's 1 Burger King 1 Nike 1 CVS 1 RadioShack 1 Chevrolet 1 Sprint Nextel 1 Curves 1 Starbucks 1 Dairy Queen 1 T-Mobile 1 Famous Footwear 1 Taco Bell 2 FedEx 3 Tim Hortons 1 Ford 1 U-Haul 5 GNC 1 UPS 2 Goodwill 2 Vans 1 H&R Block 1 Verizon Wireless 1 Home Depot 1 Walgreens 2 Jones New York 1 Wendy's 1
Strongest AM radio stations in Lake Orion:
WWJ (950 AM; 50 kW; DETROIT, MI; Owner: INFINITY BROADCASTING OPERATIONS, INC.)
WXYT (1270 AM; 50 kW; DETROIT, MI; Owner: INFINITY BROADCASTING CORP. OF DETROIT)
WJR (760 AM; 50 kW; DETROIT, MI; Owner: ABC, INC.)
WCHB (1200 AM; 50 kW; TAYLOR, MI; Owner: RADIO ONE OF DETROIT, LLC)
WFDF (910 AM; 50 kW; FLINT, MI; Owner: ABC, INC.)
WDFN (1130 AM; 50 kW; DETROIT, MI; Owner: AMFM RADIO LICENSES, L.L.C.)
WOAP (1080 AM; 50 kW; OWOSSO, MI)
WLSP (1530 AM; daytime; 5 kW; LAPEER, MI; Owner: REGENT BROADCASTING OF FLINT INC.)
WUFL (1030 AM; daytime; 5 kW; STERLING HEIGHTS, MI; Owner: FAMILY LIFE BROADCASTING SYSTEM)
WTRX (1330 AM; 5 kW; FLINT, MI; Owner: CITADEL BROADCASTING COMPANY)
WFNT (1470 AM; 5 kW; FLINT, MI)
WDEO (990 AM; 9 kW; YPSILANTI, MI; Owner: WORD BROADCASTERS, INC.)
WTKA (1050 AM; 10 kW; ANN ARBOR, MI; Owner: CAPSTAR TX LIMITED PARTNERSHIP)
Strongest FM radio stations in Lake Orion:
WXOU (88.3 FM; AUBURN HILLS, MI; Owner: OAKLAND UNIVERSITY)
WRIF (101.1 FM; DETROIT, MI; Owner: GREATER BOSTON RADIO, INC.)
WKRK-FM (97.1 FM; DETROIT, MI; Owner: INFINITY BROADCASTING OPERATIONS, INC.)
WFUM-FM (91.1 FM; FLINT, MI; Owner: THE REGENTS OF THE UNIV. OF MICHIGAN)
WMGC-FM (105.1 FM; DETROIT, MI; Owner: GREATER BOSTON RADIO, INC.)
WCSX (94.7 FM; BIRMINGHAM, MI; Owner: GREATER BOSTON RADIO, INC.)
WYCD (99.5 FM; DETROIT, MI; Owner: INFINITY BROADCASTING CORPORATION OF MICHIGAN)
WDTJ (105.9 FM; DETROIT, MI; Owner: RADIO ONE OF DETROIT, LLC)
WDVD (96.3 FM; DETROIT, MI; Owner: ABC, INC.)
WDRQ (93.1 FM; DETROIT, MI; Owner: ABC, INC.)
WDMK (102.7 FM; MOUNT CLEMENS, MI; Owner: RADIO ONE OF DETROIT, LLC)
WMXD (92.3 FM; DETROIT, MI; Owner: AMFM RADIO LICENSES, L.L.C.)
WNIC (100.3 FM; DEARBORN, MI; Owner: AMFM RADIO LICENSES, L.L.C.)
WKQI (95.5 FM; DETROIT, MI; Owner: AMFM RADIO LICENSES, L.L.C.)
WDTW (106.7 FM; DETROIT, MI; Owner: AMFM RADIO LICENSES, L.L.C.)
WJLB (97.9 FM; DETROIT, MI; Owner: AMFM RADIO LICENSES, L.L.C.)
WDTR-FM (90.9 FM; DETROIT, MI; Owner: BOARD OF EDUCATION, CITY OF DETROIT)
WFBE (95.1 FM; FLINT, MI; Owner: CITADEL BROADCASTING COMPANY)
WAHS (89.5 FM; AUBURN HEIGHTS, MI; Owner: AVONDALE SCHOOL DISTRICT)
WHYT (89.1 FM; IMLAY CITY, MI; Owner: MICHIGAN COMMUNITY RADIO)
TV broadcast stations around Lake Orion:
WFUM (Channel 28; FLINT, MI; Owner: UNIVERSITY OF MICHIGAN)
WXYZ-TV (Channel 7; DETROIT, MI; Owner: CHANNEL 7 OF DETROIT, INC.)
WJBK (Channel 2; DETROIT, MI; Owner: FOX TELEVISION STATIONS, INC.)
WDIV-TV (Channel 4; DETROIT, MI; Owner: POST-NEWSWEEK STATIONS, MICHIGAN, INC.)
WKBD (Channel 50; DETROIT, MI; Owner: VIACOM STATIONS GROUP OF DETROIT INC.)
WWJ-TV (Channel 62; DETROIT, MI; Owner: CBS BROADCASTING INC.)
WDWB (Channel 20; DETROIT, MI; Owner: WXON LICENSE, INC.)
WTVS (Channel 56; DETROIT, MI; Owner: DETROIT EDUC. TV FOUNDATION)
WBXD-CA (Channel 5; DETROIT, MI; Owner: THE BOX WORLDWIDE LLC)
WEYI-TV (Channel 25; SAGINAW, MI; Owner: WEYI BROADCASTING, LLC)
WADL (Channel 38; MOUNT CLEMENS, MI; Owner: ADELL BROADCASTING CORPORATION)
W52CU (Channel 52; PINCONNING, MI; Owner: NTN/SAGINAW, INC.)
Lake Orion fatal accident statistics for 1975 - 2021
Lake Orion fatal accident list:
Sep 29, 2013 08:37 PM, Sr-24 S Broadway, Lat: 42.778369, Lon: -83.239375, Vehicles: 1, Persons: 2, Pedestrians: 1, Fatalities: 1Lat: 42.784644, Lon: -83.242147, Vehicles: 1, Persons: 1, Pedestrians: 1, Fatalities: 1Vehicles: 2, Persons: 3, Fatalities: 1Vehicles: 3, Persons: 4, Fatalities: 1Vehicles: 2, Persons: 3, Fatalities: 1Vehicles: 2, Persons: 3, Fatalities: 1
National Bridge Inventory (NBI) Statistics 7 Number of bridges33ft / 10.0m Total length65,392 Total average daily traffic7,586 Total average daily truck traffic72,484 Total future (year 1991) average daily traffic
Home Mortgage Disclosure Act Aggregated Statistics For Year 2009(Based on 1 full tract) A) FHA, FSA/RHS & VA B) Conventional C) Refinancings D) Home Improvement Loans E) Loans on Dwellings For 5+ Families F) Non-occupant Loans on Number Average Value Number Average Value Number Average Value Number Average Value Number Average Value Number Average Value
LOANS ORIGINATED 8 $131,625 10 $154,300 46 $196,587 2 $3,000 1 $900,000 9 $111,556 APPLICATIONS APPROVED, NOT ACCEPTED 1 $62,000 0 $0 8 $243,125 1 $6,000 0 $0 1 $175,000 APPLICATIONS DENIED 2 $123,000 3 $41,667 29 $192,897 2 $32,500 0 $0 4 $109,500 APPLICATIONS WITHDRAWN 2 $168,500 1 $173,000 12 $173,833 1 $10,000 0 $0 1 $85,000 FILES CLOSED FOR INCOMPLETENESS 0 $0 0 $0 2 $192,500 0 $0 0 $0 0 $0
Aggregated Statistics For Year 2008(Based on 1 full tract) A) FHA, FSA/RHS & VA B) Conventional C) Refinancings D) Home Improvement Loans F) Non-occupant Loans on G) Loans On Manufactured Number Average Value Number Average Value Number Average Value Number Average Value Number Average Value Number Average Value
LOANS ORIGINATED 15 $187,133 15 $227,667 40 $212,325 5 $127,000 8 $162,500 0 $0 APPLICATIONS APPROVED, NOT ACCEPTED 2 $192,500 4 $188,500 7 $185,571 2 $5,500 3 $123,333 0 $0 APPLICATIONS DENIED 2 $95,500 9 $63,667 19 $225,526 4 $74,500 6 $86,500 2 $40,000 APPLICATIONS WITHDRAWN 0 $0 2 $267,500 8 $235,125 2 $417,000 1 $235,000 0 $0 FILES CLOSED FOR INCOMPLETENESS 0 $0 4 $99,500 2 $316,000 0 $0 3 $110,667 0 $0
Aggregated Statistics For Year 2007(Based on 1 full tract) A) FHA, FSA/RHS & VA B) Conventional C) Refinancings D) Home Improvement Loans F) Non-occupant Loans on G) Loans On Manufactured Number Average Value Number Average Value Number Average Value Number Average Value Number Average Value Number Average Value
LOANS ORIGINATED 1 $159,000 35 $188,286 58 $166,121 5 $72,200 5 $157,600 1 $26,000 APPLICATIONS APPROVED, NOT ACCEPTED 0 $0 5 $124,400 17 $168,882 2 $13,500 1 $3,000 1 $14,000 APPLICATIONS DENIED 1 $181,000 11 $172,091 47 $202,957 10 $67,100 4 $156,250 2 $17,000 APPLICATIONS WITHDRAWN 0 $0 2 $105,500 18 $138,889 1 $10,000 0 $0 0 $0 FILES CLOSED FOR INCOMPLETENESS 0 $0 2 $191,000 5 $169,200 0 $0 0 $0 0 $0
Aggregated Statistics For Year 2006(Based on 1 full tract) A) FHA, FSA/RHS & VA B) Conventional C) Refinancings D) Home Improvement Loans E) Loans on Dwellings For 5+ Families F) Non-occupant Loans on G) Loans On Manufactured Number Average Value Number Average Value Number Average Value Number Average Value Number Average Value Number Average Value Number Average Value
LOANS ORIGINATED 2 $147,000 91 $150,198 91 $162,560 11 $81,818 1 $550,000 16 $169,312 0 $0 APPLICATIONS APPROVED, NOT ACCEPTED 0 $0 14 $204,500 14 $129,071 2 $23,500 0 $0 3 $181,667 0 $0 APPLICATIONS DENIED 2 $217,500 18 $102,056 77 $202,416 6 $169,167 0 $0 4 $139,250 1 $32,000 APPLICATIONS WITHDRAWN 2 $218,500 8 $96,625 30 $200,400 3 $68,333 0 $0 3 $160,333 0 $0 FILES CLOSED FOR INCOMPLETENESS 0 $0 2 $241,500 4 $159,000 0 $0 0 $0 1 $171,000 0 $0
Aggregated Statistics For Year 2005(Based on 1 full tract) A) FHA, FSA/RHS & VA B) Conventional C) Refinancings D) Home Improvement Loans E) Loans on Dwellings For 5+ Families F) Non-occupant Loans on G) Loans On Manufactured Number Average Value Number Average Value Number Average Value Number Average Value Number Average Value Number Average Value Number Average Value
LOANS ORIGINATED 2 $156,500 78 $151,295 126 $179,000 8 $65,625 1 $533,000 26 $184,269 0 $0 APPLICATIONS APPROVED, NOT ACCEPTED 0 $0 20 $138,100 21 $179,524 2 $16,000 0 $0 5 $153,000 1 $46,000 APPLICATIONS DENIED 0 $0 28 $189,286 71 $199,493 8 $95,500 0 $0 14 $263,286 2 $11,500 APPLICATIONS WITHDRAWN 0 $0 13 $132,385 18 $168,333 3 $206,333 0 $0 2 $238,500 0 $0 FILES CLOSED FOR INCOMPLETENESS 0 $0 4 $136,750 19 $191,421 0 $0 0 $0 1 $139,000 0 $0
Aggregated Statistics For Year 2004(Based on 1 full tract) A) FHA, FSA/RHS & VA B) Conventional C) Refinancings D) Home Improvement Loans F) Non-occupant Loans on G) Loans On Manufactured Number Average Value Number Average Value Number Average Value Number Average Value Number Average Value Number Average Value
LOANS ORIGINATED 2 $106,500 101 $166,693 127 $174,661 5 $80,200 22 $140,500 0 $0 APPLICATIONS APPROVED, NOT ACCEPTED 1 $158,000 14 $191,643 28 $168,821 2 $256,000 2 $165,500 0 $0 APPLICATIONS DENIED 1 $122,000 22 $167,500 37 $183,784 5 $83,000 5 $170,400 1 $33,000 APPLICATIONS WITHDRAWN 0 $0 6 $245,167 25 $203,000 2 $37,500 1 $147,000 0 $0 FILES CLOSED FOR INCOMPLETENESS 0 $0 6 $143,167 11 $227,727 1 $34,000 1 $209,000 0 $0
Aggregated Statistics For Year 2002(Based on 1 full tract) A) FHA, FSA/RHS & VA B) Conventional C) Refinancings D) Home Improvement Loans E) Loans on Dwellings For 5+ Families F) Non-occupant Loans on Number Average Value Number Average Value Number Average Value Number Average Value Number Average Value Number Average Value
LOANS ORIGINATED 7 $151,286 49 $181,551 218 $182,885 14 $48,286 1 $92,000 20 $149,400 APPLICATIONS APPROVED, NOT ACCEPTED 1 $137,000 3 $446,000 27 $172,111 4 $8,500 0 $0 1 $137,000 APPLICATIONS DENIED 1 $131,000 5 $163,200 28 $164,750 5 $6,400 0 $0 2 $79,500 APPLICATIONS WITHDRAWN 1 $141,000 5 $189,200 22 $198,500 0 $0 0 $0 1 $128,000 FILES CLOSED FOR INCOMPLETENESS 0 $0 0 $0 13 $126,923 0 $0 0 $0 0 $0
Aggregated Statistics For Year 2001(Based on 1 full tract) A) FHA, FSA/RHS & VA B) Conventional C) Refinancings D) Home Improvement Loans F) Non-occupant Loans on Number Average Value Number Average Value Number Average Value Number Average Value Number Average Value
LOANS ORIGINATED 7 $146,000 71 $164,676 196 $154,367 10 $24,500 19 $135,474 APPLICATIONS APPROVED, NOT ACCEPTED 0 $0 7 $113,714 19 $220,526 5 $60,200 1 $154,000 APPLICATIONS DENIED 0 $0 5 $148,400 30 $163,533 4 $22,750 6 $186,833 APPLICATIONS WITHDRAWN 1 $45,000 1 $235,000 20 $155,550 0 $0 2 $200,500 FILES CLOSED FOR INCOMPLETENESS 0 $0 1 $20,000 9 $172,000 0 $0 0 $0
Aggregated Statistics For Year 2000(Based on 1 full tract) A) FHA, FSA/RHS & VA B) Conventional C) Refinancings D) Home Improvement Loans F) Non-occupant Loans on Number Average Value Number Average Value Number Average Value Number Average Value Number Average Value
LOANS ORIGINATED 6 $147,167 59 $170,525 58 $134,448 18 $18,500 7 $114,286 APPLICATIONS APPROVED, NOT ACCEPTED 0 $0 8 $107,875 8 $156,875 3 $27,000 1 $141,000 APPLICATIONS DENIED 0 $0 18 $79,611 18 $113,556 5 $9,400 0 $0 APPLICATIONS WITHDRAWN 1 $134,000 4 $210,500 12 $139,667 0 $0 0 $0 FILES CLOSED FOR INCOMPLETENESS 0 $0 0 $0 3 $120,333 0 $0 0 $0
Aggregated Statistics For Year 1999(Based on 1 full tract) A) FHA, FSA/RHS & VA B) Conventional C) Refinancings D) Home Improvement Loans F) Non-occupant Loans on Number Average Value Number Average Value Number Average Value Number Average Value Number Average Value
LOANS ORIGINATED 10 $128,188 54 $168,409 95 $120,513 7 $48,011 13 $99,292 APPLICATIONS APPROVED, NOT ACCEPTED 1 $138,800 5 $85,656 12 $173,164 4 $36,930 0 $0 APPLICATIONS DENIED 0 $0 26 $67,835 18 $116,159 4 $10,162 1 $116,990 APPLICATIONS WITHDRAWN 1 $129,870 5 $123,926 24 $111,615 4 $82,535 1 $112,030 FILES CLOSED FOR INCOMPLETENESS 0 $0 1 $105,090 8 $135,202 0 $0 0 $0
Detailed HMDA statistics for the following Tracts:
1290.00
Private Mortgage Insurance Companies Aggregated Statistics For Year 2009(Based on 1 full tract) B) Refinancings Number Average Value
LOANS ORIGINATED 0 $0 APPLICATIONS APPROVED, NOT ACCEPTED 1 $145,000 APPLICATIONS DENIED 0 $0 APPLICATIONS WITHDRAWN 0 $0 FILES CLOSED FOR INCOMPLETENESS 0 $0
Aggregated Statistics For Year 2008(Based on 1 full tract) A) Conventional B) Refinancings Number Average Value Number Average Value
LOANS ORIGINATED 6 $179,167 4 $250,500 APPLICATIONS APPROVED, NOT ACCEPTED 2 $114,000 2 $282,500 APPLICATIONS DENIED 0 $0 0 $0 APPLICATIONS WITHDRAWN 1 $66,000 0 $0 FILES CLOSED FOR INCOMPLETENESS 0 $0 0 $0
Aggregated Statistics For Year 2007(Based on 1 full tract) A) Conventional B) Refinancings Number Average Value Number Average Value
LOANS ORIGINATED 14 $187,929 6 $176,500 APPLICATIONS APPROVED, NOT ACCEPTED 1 $162,000 1 $211,000 APPLICATIONS DENIED 1 $157,000 0 $0 APPLICATIONS WITHDRAWN 1 $157,000 0 $0 FILES CLOSED FOR INCOMPLETENESS 0 $0 0 $0
Aggregated Statistics For Year 2006(Based on 1 full tract) A) Conventional B) Refinancings C) Non-occupant Loans on Number Average Value Number Average Value Number Average Value
LOANS ORIGINATED 11 $196,455 3 $157,000 1 $137,000 APPLICATIONS APPROVED, NOT ACCEPTED 2 $163,000 2 $174,000 0 $0 APPLICATIONS DENIED 0 $0 1 $239,000 0 $0 APPLICATIONS WITHDRAWN 0 $0 0 $0 0 $0 FILES CLOSED FOR INCOMPLETENESS 0 $0 0 $0 0 $0
Aggregated Statistics For Year 2005(Based on 1 full tract) A) Conventional B) Refinancings C) Non-occupant Loans on Number Average Value Number Average Value Number Average Value
LOANS ORIGINATED 2 $203,500 4 $205,000 1 $163,000 APPLICATIONS APPROVED, NOT ACCEPTED 6 $176,667 0 $0 2 $144,500 APPLICATIONS DENIED 0 $0 0 $0 0 $0 APPLICATIONS WITHDRAWN 1 $232,000 0 $0 1 $232,000 FILES CLOSED FOR INCOMPLETENESS 0 $0 0 $0 0 $0
Aggregated Statistics For Year 2004(Based on 1 full tract) A) Conventional B) Refinancings C) Non-occupant Loans on Number Average Value Number Average Value Number Average Value
LOANS ORIGINATED 24 $178,167 5 $203,800 4 $169,000 APPLICATIONS APPROVED, NOT ACCEPTED 3 $176,000 3 $146,333 0 $0 APPLICATIONS DENIED 1 $239,000 1 $170,000 1 $239,000 APPLICATIONS WITHDRAWN 2 $245,500 0 $0 0 $0 FILES CLOSED FOR INCOMPLETENESS 0 $0 0 $0 0 $0
Aggregated Statistics For Year 2003(Based on 1 full tract) A) Conventional B) Refinancings C) Non-occupant Loans on Number Average Value Number Average Value Number Average Value
LOANS ORIGINATED 15 $190,800 13 $166,154 3 $309,000 APPLICATIONS APPROVED, NOT ACCEPTED 5 $276,600 4 $154,500 2 $113,000 APPLICATIONS DENIED 0 $0 0 $0 0 $0 APPLICATIONS WITHDRAWN 2 $122,000 3 $182,667 1 $123,000 FILES CLOSED FOR INCOMPLETENESS 0 $0 0 $0 0 $0
Aggregated Statistics For Year 2002(Based on 1 full tract) A) Conventional B) Refinancings C) Non-occupant Loans on Number Average Value Number Average Value Number Average Value
LOANS ORIGINATED 17 $166,059 14 $198,571 1 $275,000 APPLICATIONS APPROVED, NOT ACCEPTED 5 $167,000 5 $169,800 1 $134,000 APPLICATIONS DENIED 0 $0 0 $0 0 $0 APPLICATIONS WITHDRAWN 0 $0 6 $179,333 1 $157,000 FILES CLOSED FOR INCOMPLETENESS 0 $0 0 $0 0 $0
Aggregated Statistics For Year 2001(Based on 1 full tract) A) Conventional B) Refinancings C) Non-occupant Loans on Number Average Value Number Average Value Number Average Value
LOANS ORIGINATED 25 $180,320 18 $199,111 6 $188,167 APPLICATIONS APPROVED, NOT ACCEPTED 3 $153,000 7 $223,714 0 $0 APPLICATIONS DENIED 0 $0 0 $0 0 $0 APPLICATIONS WITHDRAWN 2 $193,500 0 $0 1 $217,000 FILES CLOSED FOR INCOMPLETENESS 0 $0 0 $0 0 $0
Aggregated Statistics For Year 2000(Based on 1 full tract) A) Conventional B) Refinancings C) Non-occupant Loans on Number Average Value Number Average Value Number Average Value
LOANS ORIGINATED 17 $149,882 4 $144,500 4 $123,000 APPLICATIONS APPROVED, NOT ACCEPTED 3 $221,667 0 $0 0 $0 APPLICATIONS DENIED 0 $0 0 $0 0 $0 APPLICATIONS WITHDRAWN 0 $0 0 $0 0 $0 FILES CLOSED FOR INCOMPLETENESS 0 $0 0 $0 0 $0
Aggregated Statistics For Year 1999(Based on 1 full tract) A) Conventional B) Refinancings C) Non-occupant Loans on Number Average Value Number Average Value Number Average Value
LOANS ORIGINATED 19 $148,188 4 $150,692 1 $111,040 APPLICATIONS APPROVED, NOT ACCEPTED 1 $110,050 5 $108,062 2 $96,165 APPLICATIONS DENIED 1 $116,990 1 $233,970 1 $116,990 APPLICATIONS WITHDRAWN 0 $0 0 $0 0 $0 FILES CLOSED FOR INCOMPLETENESS 0 $0 0 $0 0 $0
Detailed PMIC statistics for the following Tracts:
1290.00
Most common first names in Lake Orion, MI among deceased individuals Name Count Lived (average)
Mary 51 79.2 years William 51 75.3 years James 49 71.8 years Robert 46 73.5 years Dorothy 44 80.2 years John 37 73.0 years George 28 77.0 years Margaret 27 79.8 years Helen 27 82.3 years Edward 24 74.8 years
Most common last names in Lake Orion, MI among deceased individuals Last name Count Lived (average)
Smith 27 74.0 years Williams 13 76.3 years Taylor 10 73.8 years Brown 10 75.7 years Johnson 10 78.7 years Anderson 9 81.1 years Miller 9 74.4 years Hill 9 71.7 years Jones 8 79.3 years Ward 8 76.7 years
Lake Orion compared to Michigan state average:
Median house value above state average. Unemployed percentage significantly below state average. Black race population percentage significantly below state average. Length of stay since moving in significantly above state average. Institutionalized population percentage above state average. Percentage of population with a bachelor's degree or higher above state average. Lake Orion on our top lists :
#99 on the list of "Top 101 cities with the most residents born in Other Australian and New Zealand Subregion (population 500+)"
#6 on the list of "Top 101 counties with the highest percentage of residents that visited a dentist within the past year"
#12 on the list of "Top 101 counties with the most Orthodox congregations"
#14 on the list of "Top 101 counties with the most Orthodox adherents"
#38 on the list of "Top 101 counties with the most Mainline Protestant adherents"
#39 on the list of "Top 101 counties with the most Catholic adherents"
Top Patent Applicants
Robert S. Mcalpine (29)
Richard J. Skurkis (29)
Michael Wittelsbuerger (19)
Douglas M. Gould (18)
Carl Mather (16)
Gerald S. Locke (15)
John C. Hibbler (13)
Ronald H. Haag (13)
John Anthony Demarco (11)
Joseph P. Wieczorek (10)
Total of 933 patent applications in 2008-2024.


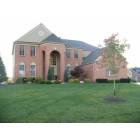
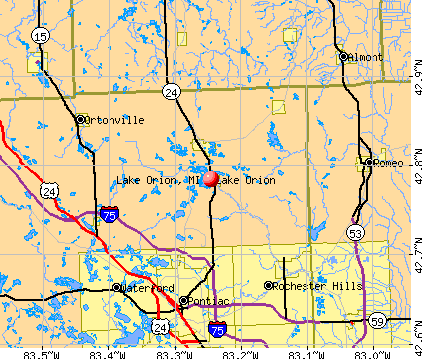


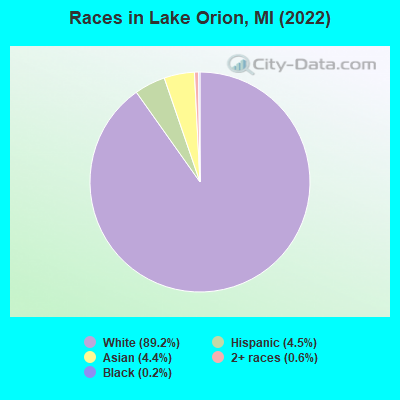
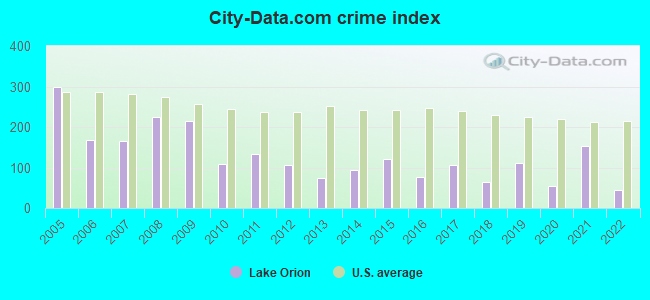
 Recent articles from our blog. Our writers, many of them Ph.D. graduates or candidates, create easy-to-read articles on a wide variety of topics.

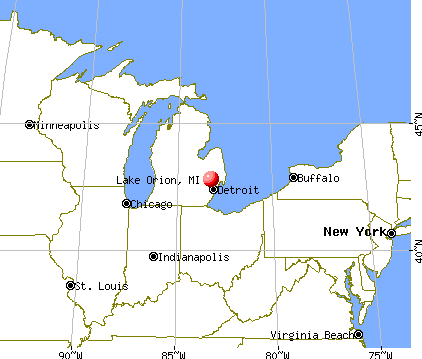
 (9.3 miles
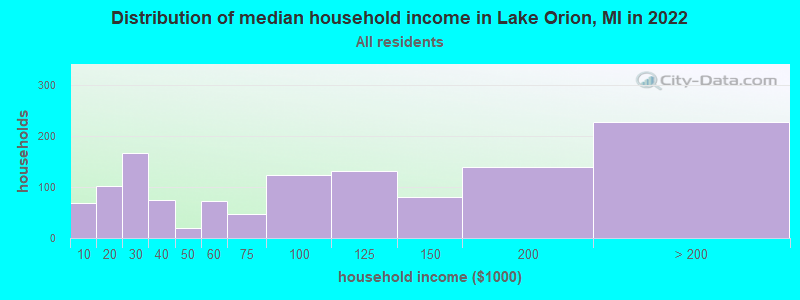
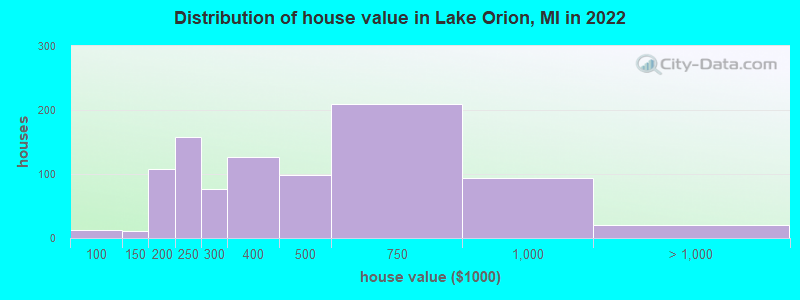

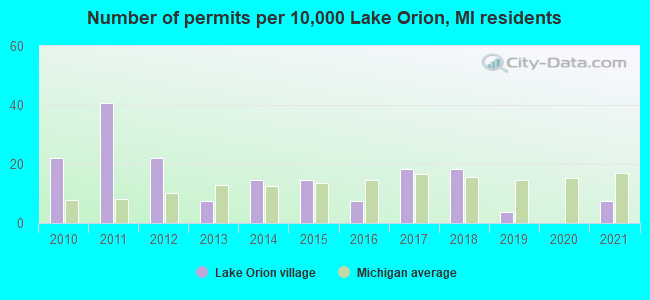
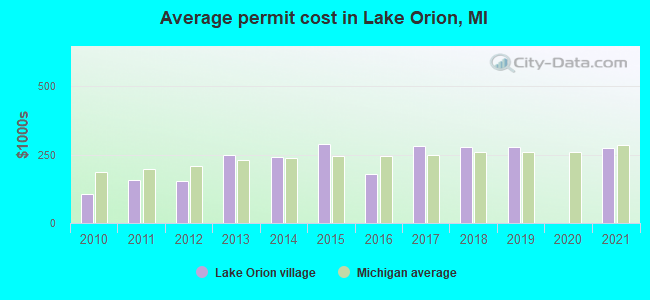
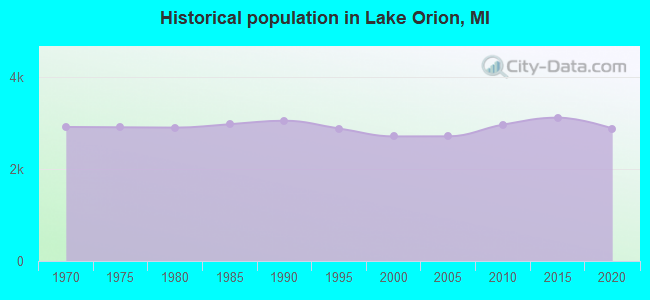
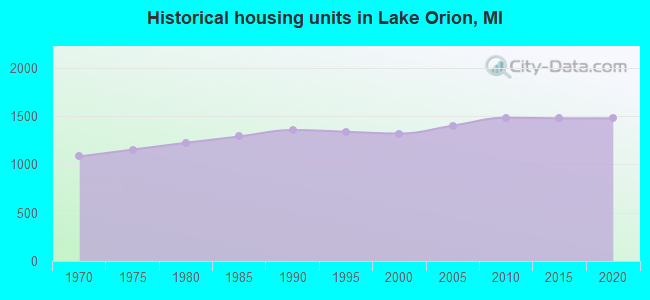
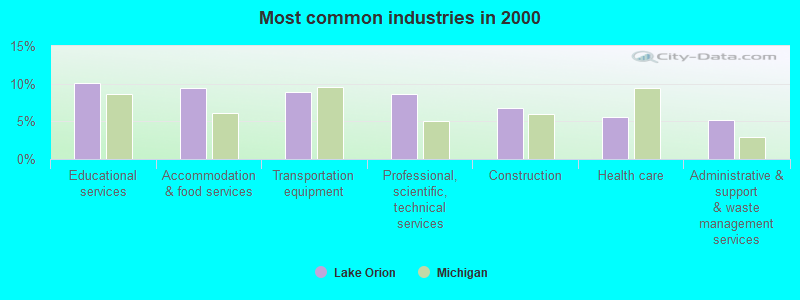
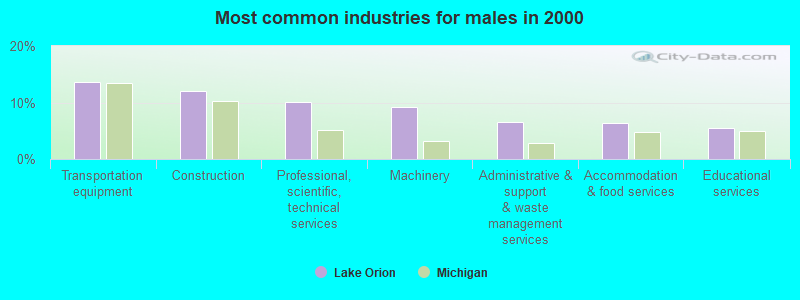
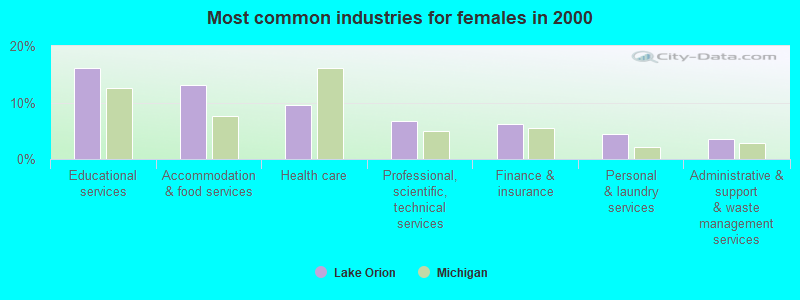
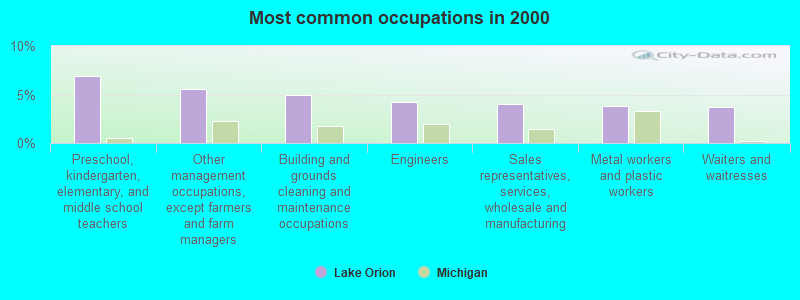
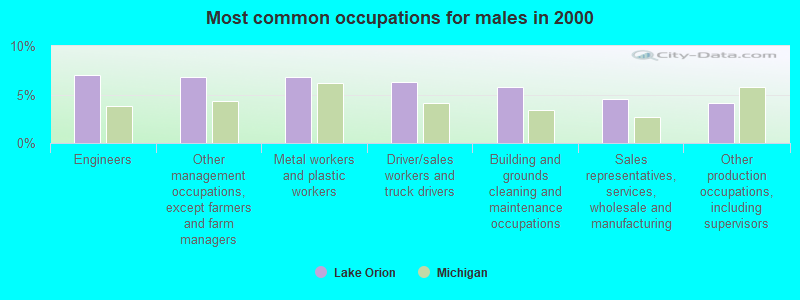
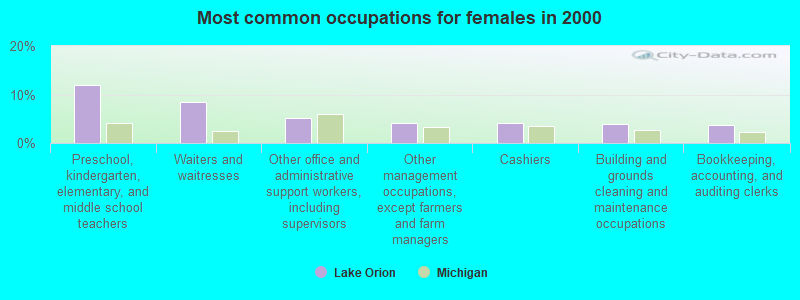


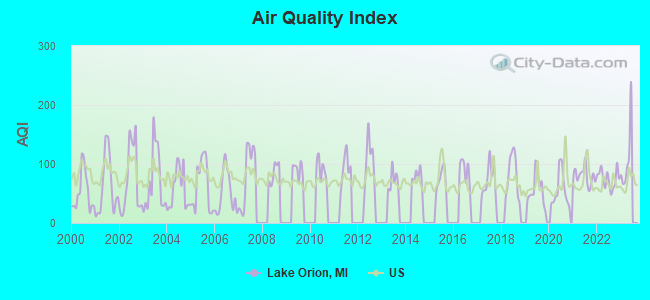
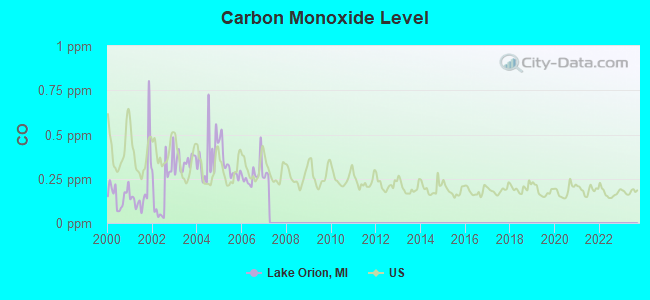
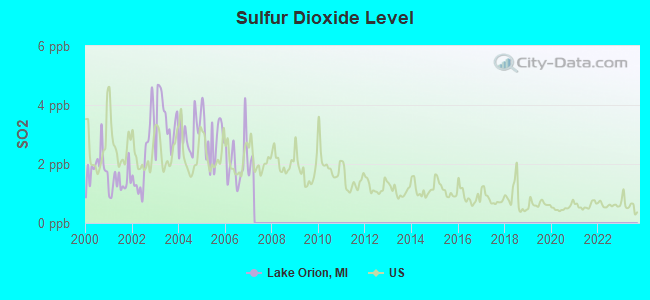
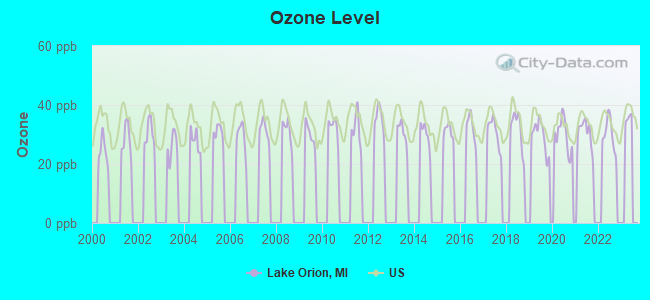
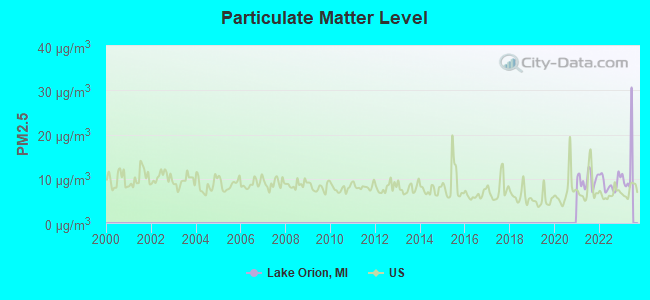
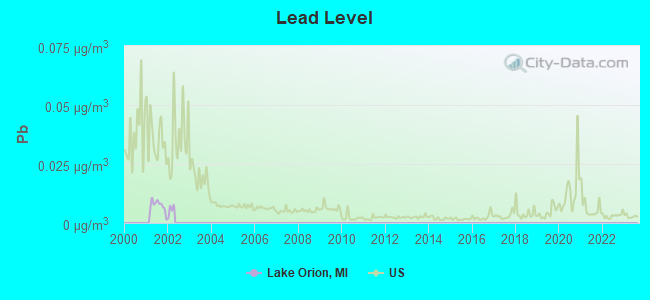

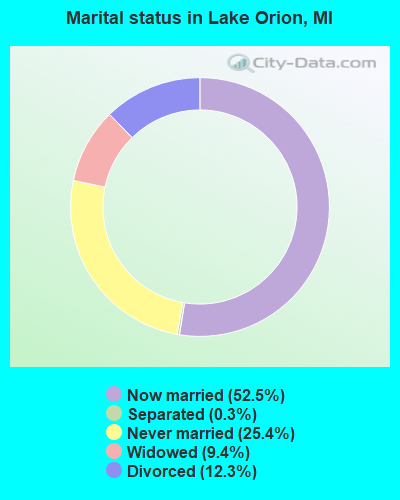
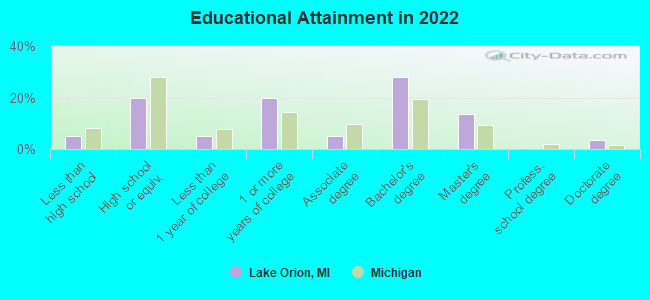
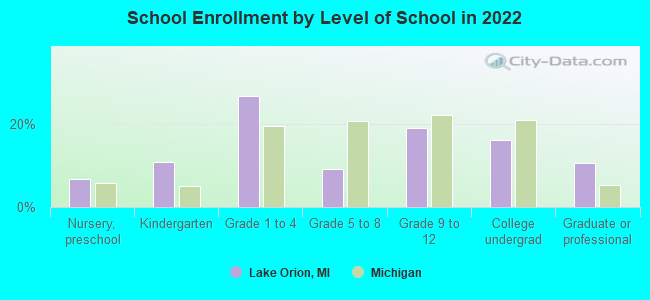
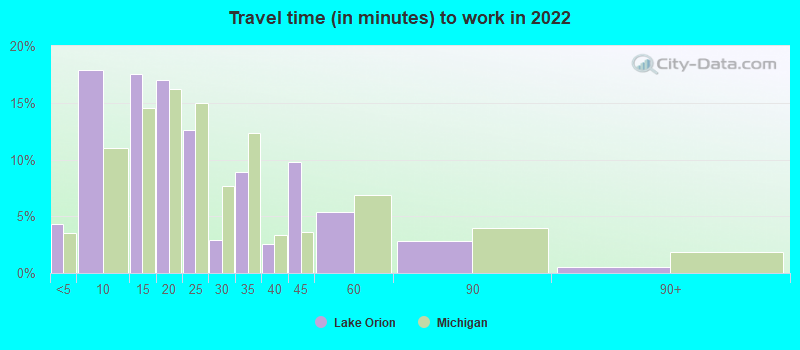
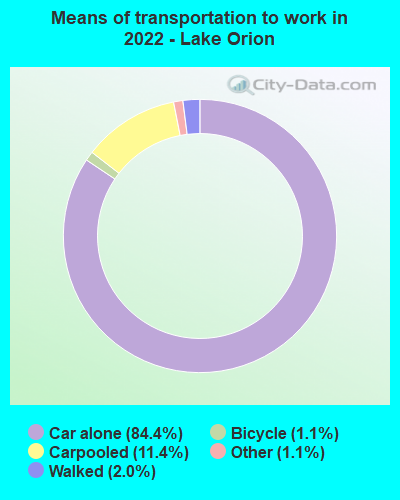
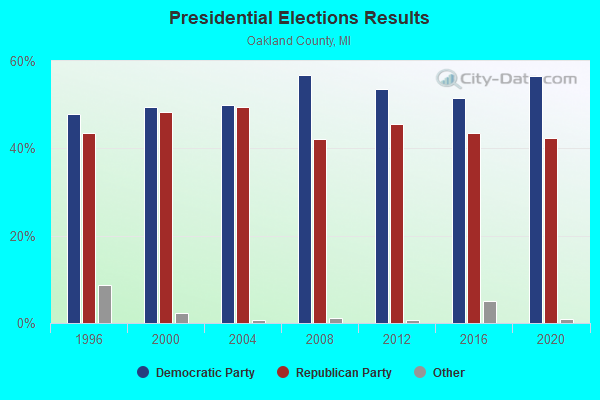
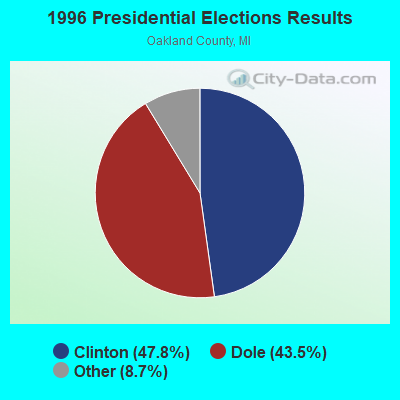
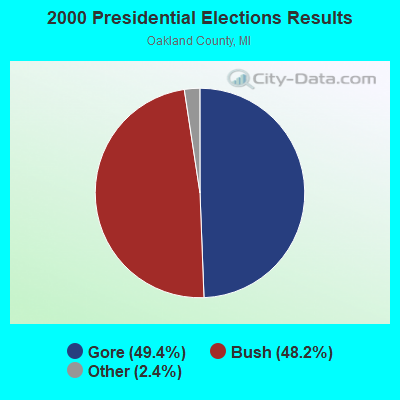
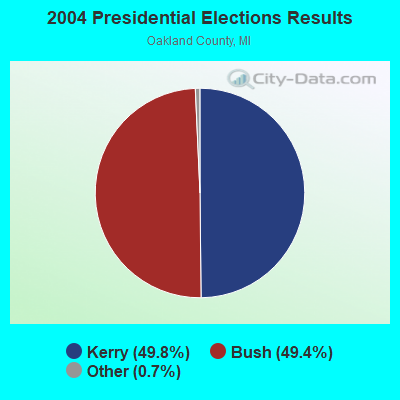
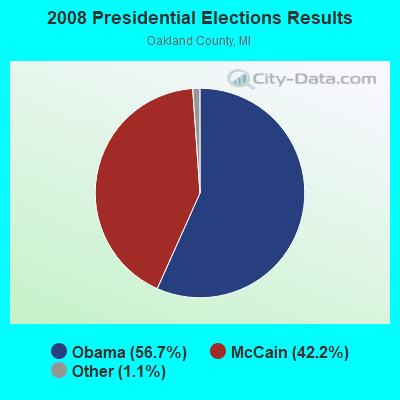
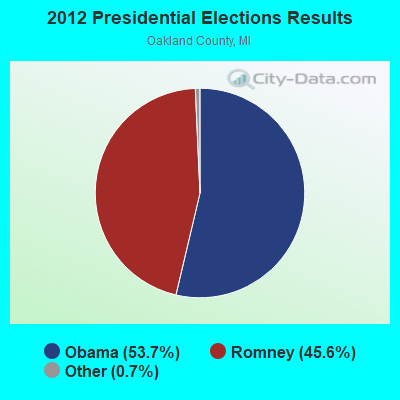
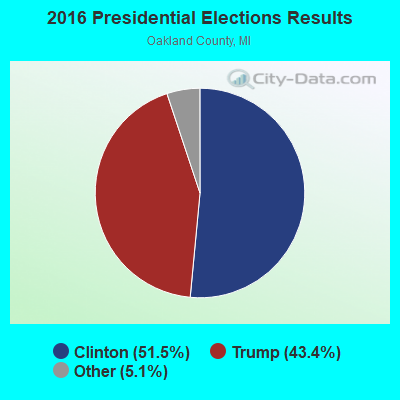
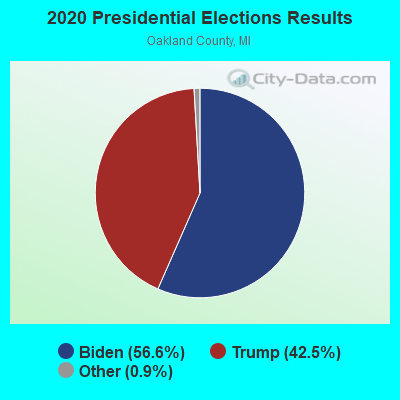
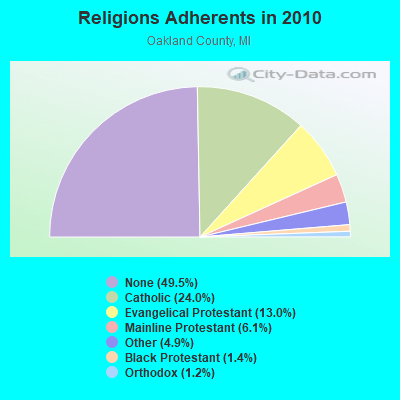
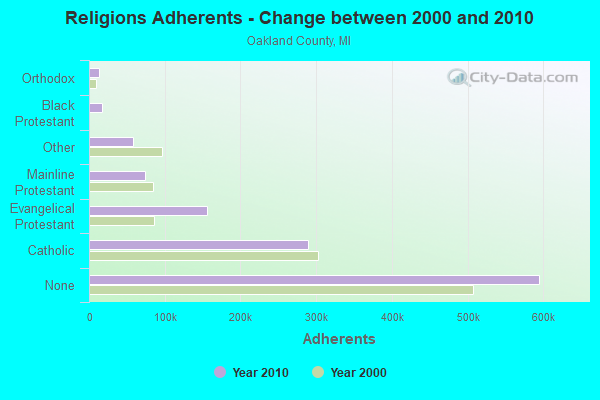
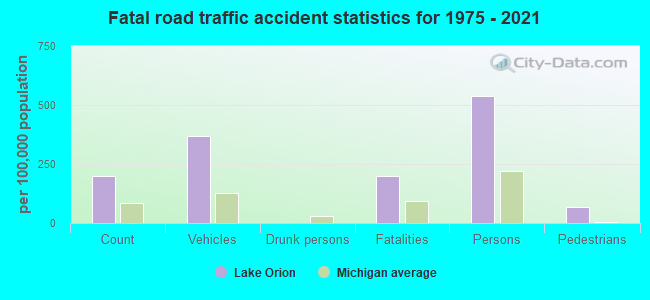
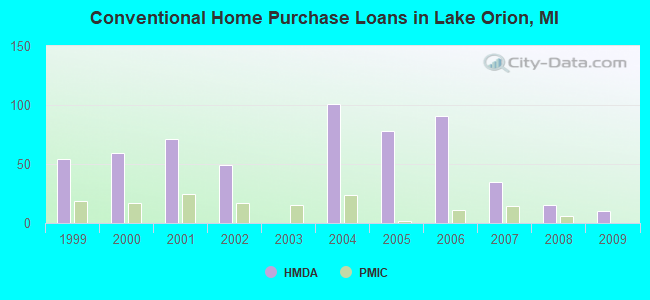
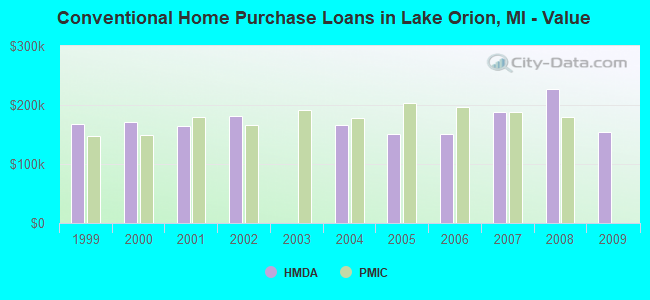
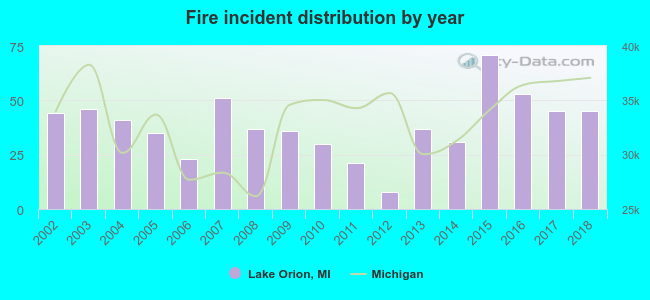 According to the data from the years 2002 - 2018 the average number of fires per year is 38. The highest number of fires - 71 took place in 2015, and the least - 8 in 2012. The data has an increasing trend.
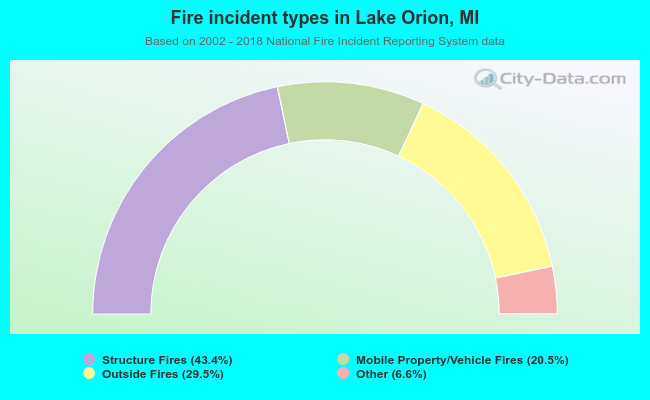 When looking into fire subcategories, the most reports belonged to: Structure Fires (43.4%), and Outside Fires (29.5%).