Mission Bend, Texas Submit your own pictures of this place and show them to the world
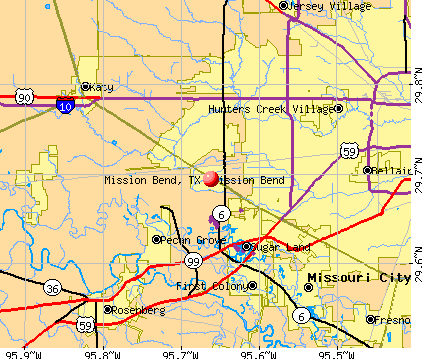
OSM Map
General Map
Google Map
MSN Map
OSM Map
General Map
Google Map
MSN Map
OSM Map
General Map
Google Map
MSN Map
OSM Map
General Map
Google Map
MSN Map
Please wait while loading the map...
Population in 2010: 36,501. Population change since 2000: +18.4%Males: 17,148 Females: 19,353
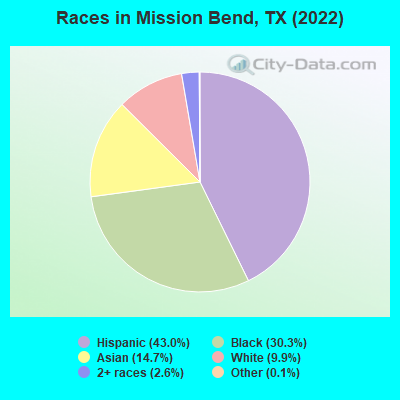
March 2022 cost of living index in Mission Bend: 96.5 (near average, U.S. average is 100) Percentage of residents living in poverty in 2022: 12.5%for White Non-Hispanic residents , 17.0% for Black residents , 12.3% for Hispanic or Latino residents , 28.8% for other race residents , 8.9% for two or more races residents )
Profiles of local businesses
Business Search - 14 Million verified businesses
Data:
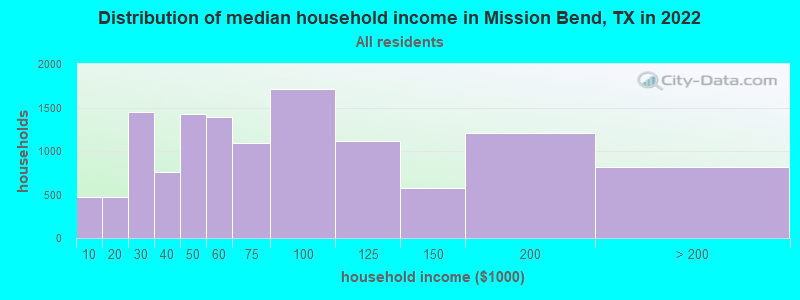
Median household income ($)
Median household income (% change since 2000)
Household income diversity
Ratio of average income to average house value (%)
Ratio of average income to average rent
Median household income ($) - White
Median household income ($) - Black or African American
Median household income ($) - Asian
Median household income ($) - Hispanic or Latino
Median household income ($) - American Indian and Alaska Native
Median household income ($) - Multirace
Median household income ($) - Other Race
Median household income for houses/condos with a mortgage ($)
Median household income for apartments without a mortgage ($)
Races - White alone (%)
Races - White alone (% change since 2000)
Races - Black alone (%)
Races - Black alone (% change since 2000)
Races - American Indian alone (%)
Races - American Indian alone (% change since 2000)
Races - Asian alone (%)
Races - Asian alone (% change since 2000)
Races - Hispanic (%)
Races - Hispanic (% change since 2000)
Races - Native Hawaiian and Other Pacific Islander alone (%)
Races - Native Hawaiian and Other Pacific Islander alone (% change since 2000)
Races - Two or more races (%)
Races - Two or more races (% change since 2000)
Races - Other race alone (%)
Races - Other race alone (% change since 2000)
Racial diversity
Unemployment (%)
Unemployment (% change since 2000)
Unemployment (%) - White
Unemployment (%) - Black or African American
Unemployment (%) - Asian
Unemployment (%) - Hispanic or Latino
Unemployment (%) - American Indian and Alaska Native
Unemployment (%) - Multirace
Unemployment (%) - Other Race
Population density (people per square mile)
Population - Males (%)
Population - Females (%)
Population - Males (%) - White
Population - Males (%) - Black or African American
Population - Males (%) - Asian
Population - Males (%) - Hispanic or Latino
Population - Males (%) - American Indian and Alaska Native
Population - Males (%) - Multirace
Population - Males (%) - Other Race
Population - Females (%) - White
Population - Females (%) - Black or African American
Population - Females (%) - Asian
Population - Females (%) - Hispanic or Latino
Population - Females (%) - American Indian and Alaska Native
Population - Females (%) - Multirace
Population - Females (%) - Other Race
Coronavirus confirmed cases (Jun 19, 2024)
Deaths caused by coronavirus (Jun 19, 2024)
Coronavirus confirmed cases (per 100k population) (Jun 19, 2024)
Deaths caused by coronavirus (per 100k population) (Jun 19, 2024)
Daily increase in number of cases (Jun 19, 2024)
Weekly increase in number of cases (Jun 19, 2024)
Cases doubled (in days) (Jun 19, 2024)
Hospitalized patients (Apr 18, 2022)
Negative test results (Apr 18, 2022)
Total test results (Apr 18, 2022)
COVID Vaccine doses distributed (per 100k population) (Sep 19, 2023)
COVID Vaccine doses administered (per 100k population) (Sep 19, 2023)
COVID Vaccine doses distributed (Sep 19, 2023)
COVID Vaccine doses administered (Sep 19, 2023)
Likely homosexual households (%)
Likely homosexual households (% change since 2000)
Likely homosexual households - Lesbian couples (%)
Likely homosexual households - Lesbian couples (% change since 2000)
Likely homosexual households - Gay men (%)
Likely homosexual households - Gay men (% change since 2000)
Cost of living index
Median gross rent ($)
Median contract rent ($)
Median monthly housing costs ($)
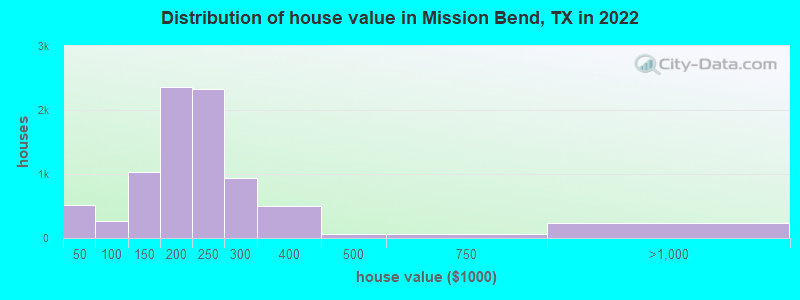
Median house or condo value ($)
Median house or condo value ($ change since 2000)
Mean house or condo value by units in structure - 1, detached ($)
Mean house or condo value by units in structure - 1, attached ($)
Mean house or condo value by units in structure - 2 ($)
Mean house or condo value by units in structure by units in structure - 3 or 4 ($)
Mean house or condo value by units in structure - 5 or more ($)
Mean house or condo value by units in structure - Boat, RV, van, etc. ($)
Mean house or condo value by units in structure - Mobile home ($)
Median house or condo value ($) - White
Median house or condo value ($) - Black or African American
Median house or condo value ($) - Asian
Median house or condo value ($) - Hispanic or Latino
Median house or condo value ($) - American Indian and Alaska Native
Median house or condo value ($) - Multirace
Median house or condo value ($) - Other Race
Median resident age
Resident age diversity
Median resident age - Males
Median resident age - Females
Median resident age - White
Median resident age - Black or African American
Median resident age - Asian
Median resident age - Hispanic or Latino
Median resident age - American Indian and Alaska Native
Median resident age - Multirace
Median resident age - Other Race
Median resident age - Males - White
Median resident age - Males - Black or African American
Median resident age - Males - Asian
Median resident age - Males - Hispanic or Latino
Median resident age - Males - American Indian and Alaska Native
Median resident age - Males - Multirace
Median resident age - Males - Other Race
Median resident age - Females - White
Median resident age - Females - Black or African American
Median resident age - Females - Asian
Median resident age - Females - Hispanic or Latino
Median resident age - Females - American Indian and Alaska Native
Median resident age - Females - Multirace
Median resident age - Females - Other Race
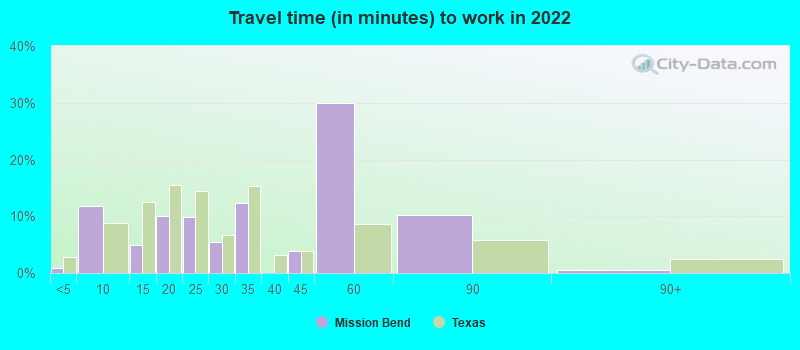
Commute - mean travel time to work (minutes)
Travel time to work - Less than 5 minutes (%)
Travel time to work - Less than 5 minutes (% change since 2000)
Travel time to work - 5 to 9 minutes (%)
Travel time to work - 5 to 9 minutes (% change since 2000)
Travel time to work - 10 to 19 minutes (%)
Travel time to work - 10 to 19 minutes (% change since 2000)
Travel time to work - 20 to 29 minutes (%)
Travel time to work - 20 to 29 minutes (% change since 2000)
Travel time to work - 30 to 39 minutes (%)
Travel time to work - 30 to 39 minutes (% change since 2000)
Travel time to work - 40 to 59 minutes (%)
Travel time to work - 40 to 59 minutes (% change since 2000)
Travel time to work - 60 to 89 minutes (%)
Travel time to work - 60 to 89 minutes (% change since 2000)
Travel time to work - 90 or more minutes (%)
Travel time to work - 90 or more minutes (% change since 2000)
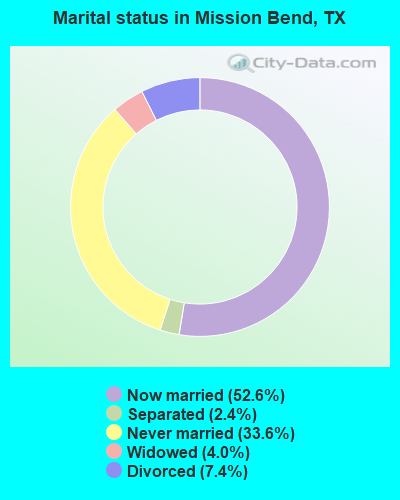
Marital status - Never married (%)
Marital status - Now married (%)
Marital status - Separated (%)
Marital status - Widowed (%)
Marital status - Divorced (%)
Median family income ($)
Median family income (% change since 2000)
Median non-family income ($)
Median non-family income (% change since 2000)
Median per capita income ($)
Median per capita income (% change since 2000)
Median family income ($) - White
Median family income ($) - Black or African American
Median family income ($) - Asian
Median family income ($) - Hispanic or Latino
Median family income ($) - American Indian and Alaska Native
Median family income ($) - Multirace
Median family income ($) - Other Race
Median year house/condo built
Median year apartment built
Year house built - Built 2005 or later (%)
Year house built - Built 2000 to 2004 (%)
Year house built - Built 1990 to 1999 (%)
Year house built - Built 1980 to 1989 (%)
Year house built - Built 1970 to 1979 (%)
Year house built - Built 1960 to 1969 (%)
Year house built - Built 1950 to 1959 (%)
Year house built - Built 1940 to 1949 (%)
Year house built - Built 1939 or earlier (%)
Average household size
Household density (households per square mile)
Average household size - White
Average household size - Black or African American
Average household size - Asian
Average household size - Hispanic or Latino
Average household size - American Indian and Alaska Native
Average household size - Multirace
Average household size - Other Race
Occupied housing units (%)
Vacant housing units (%)
Owner occupied housing units (%)
Renter occupied housing units (%)
Vacancy status - For rent (%)
Vacancy status - For sale only (%)
Vacancy status - Rented or sold, not occupied (%)
Vacancy status - For seasonal, recreational, or occasional use (%)
Vacancy status - For migrant workers (%)
Vacancy status - Other vacant (%)
Residents with income below the poverty level (%)
Residents with income below 50% of the poverty level (%)
Children below poverty level (%)
Poor families by family type - Married-couple family (%)
Poor families by family type - Male, no wife present (%)
Poor families by family type - Female, no husband present (%)
Poverty status for native-born residents (%)
Poverty status for foreign-born residents (%)
Poverty among high school graduates not in families (%)
Poverty among people who did not graduate high school not in families (%)
Residents with income below the poverty level (%) - White
Residents with income below the poverty level (%) - Black or African American
Residents with income below the poverty level (%) - Asian
Residents with income below the poverty level (%) - Hispanic or Latino
Residents with income below the poverty level (%) - American Indian and Alaska Native
Residents with income below the poverty level (%) - Multirace
Residents with income below the poverty level (%) - Other Race
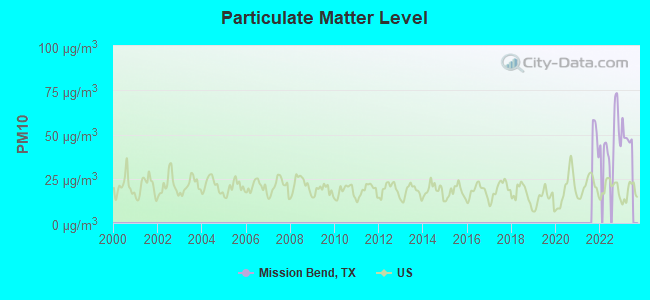
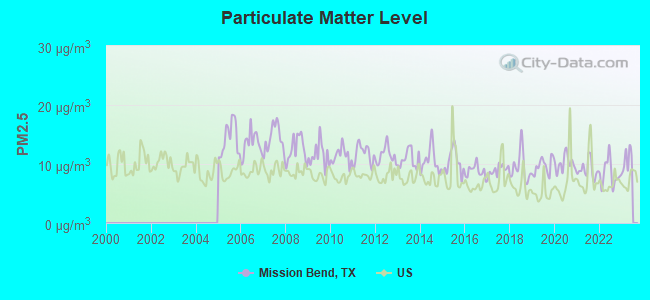
Air pollution - Air Quality Index (AQI)
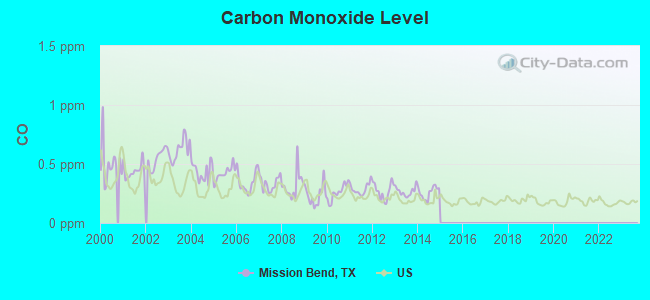
Air pollution - CO
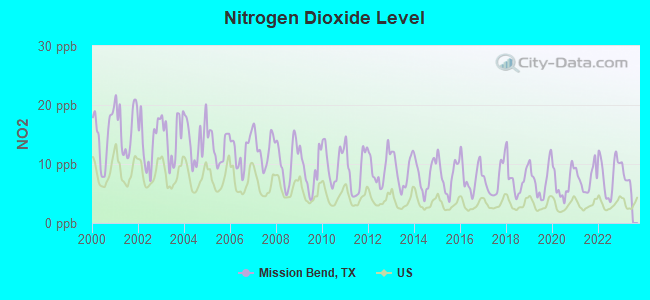
Air pollution - NO2
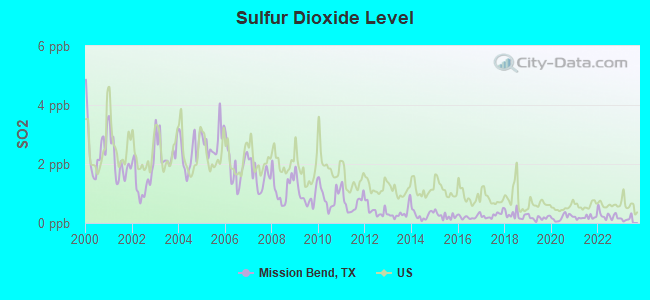
Air pollution - SO2
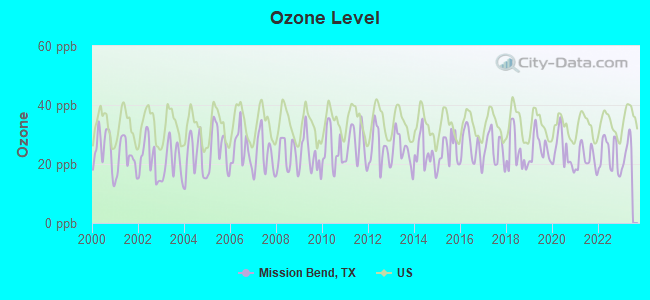
Air pollution - Ozone
Air pollution - PM10
Air pollution - PM25
Air pollution - Pb
Crime - Murders per 100,000 population
Crime - Rapes per 100,000 population
Crime - Robberies per 100,000 population
Crime - Assaults per 100,000 population
Crime - Burglaries per 100,000 population
Crime - Thefts per 100,000 population
Crime - Auto thefts per 100,000 population
Crime - Arson per 100,000 population
Crime - City-data.com crime index
Crime - Violent crime index
Crime - Property crime index
Crime - Murders per 100,000 population (5 year average)
Crime - Rapes per 100,000 population (5 year average)
Crime - Robberies per 100,000 population (5 year average)
Crime - Assaults per 100,000 population (5 year average)
Crime - Burglaries per 100,000 population (5 year average)
Crime - Thefts per 100,000 population (5 year average)
Crime - Auto thefts per 100,000 population (5 year average)
Crime - Arson per 100,000 population (5 year average)
Crime - City-data.com crime index (5 year average)
Crime - Violent crime index (5 year average)
Crime - Property crime index (5 year average)
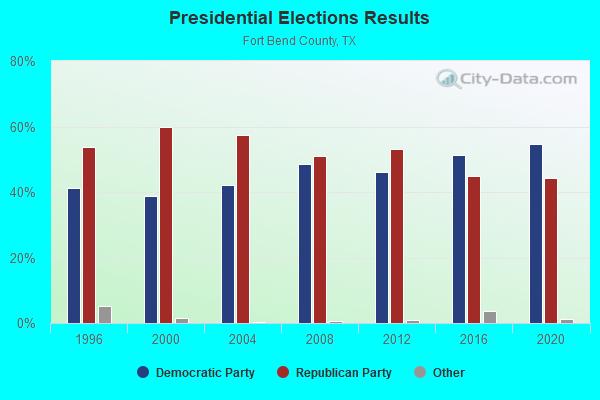
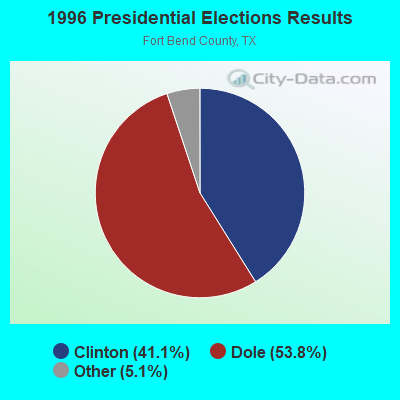
1996 Presidential Elections Results (%) - Democratic Party (Clinton)
1996 Presidential Elections Results (%) - Republican Party (Dole)
1996 Presidential Elections Results (%) - Other
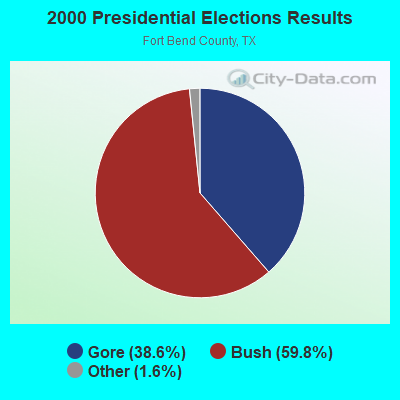
2000 Presidential Elections Results (%) - Democratic Party (Gore)
2000 Presidential Elections Results (%) - Republican Party (Bush)
2000 Presidential Elections Results (%) - Other
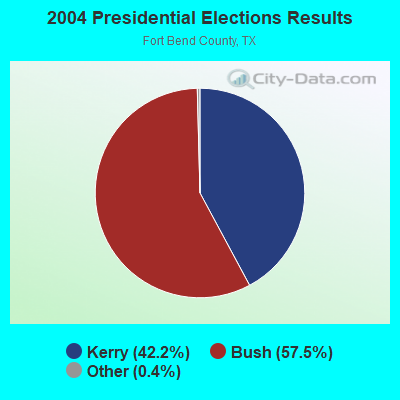
2004 Presidential Elections Results (%) - Democratic Party (Kerry)
2004 Presidential Elections Results (%) - Republican Party (Bush)
2004 Presidential Elections Results (%) - Other
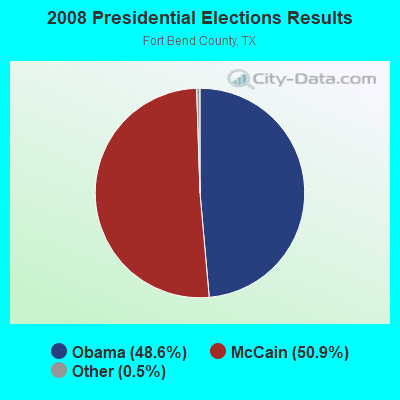
2008 Presidential Elections Results (%) - Democratic Party (Obama)
2008 Presidential Elections Results (%) - Republican Party (McCain)
2008 Presidential Elections Results (%) - Other
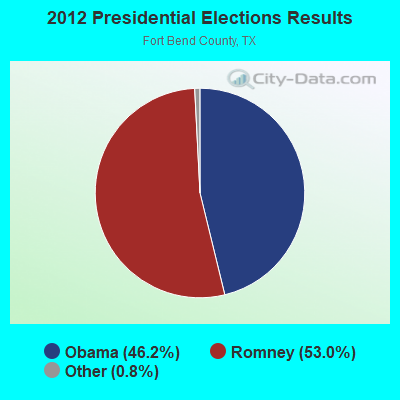
2012 Presidential Elections Results (%) - Democratic Party (Obama)
2012 Presidential Elections Results (%) - Republican Party (Romney)
2012 Presidential Elections Results (%) - Other
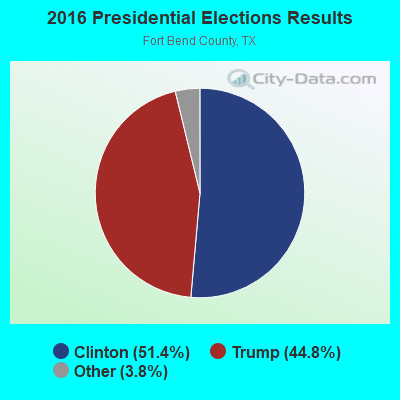
2016 Presidential Elections Results (%) - Democratic Party (Clinton)
2016 Presidential Elections Results (%) - Republican Party (Trump)
2016 Presidential Elections Results (%) - Other
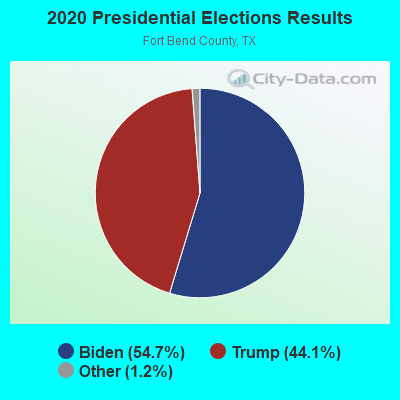
2020 Presidential Elections Results (%) - Democratic Party (Biden)
2020 Presidential Elections Results (%) - Republican Party (Trump)
2020 Presidential Elections Results (%) - Other
Ancestries Reported - Arab (%)
Ancestries Reported - Czech (%)
Ancestries Reported - Danish (%)
Ancestries Reported - Dutch (%)
Ancestries Reported - English (%)
Ancestries Reported - French (%)
Ancestries Reported - French Canadian (%)
Ancestries Reported - German (%)
Ancestries Reported - Greek (%)
Ancestries Reported - Hungarian (%)
Ancestries Reported - Irish (%)
Ancestries Reported - Italian (%)
Ancestries Reported - Lithuanian (%)
Ancestries Reported - Norwegian (%)
Ancestries Reported - Polish (%)
Ancestries Reported - Portuguese (%)
Ancestries Reported - Russian (%)
Ancestries Reported - Scotch-Irish (%)
Ancestries Reported - Scottish (%)
Ancestries Reported - Slovak (%)
Ancestries Reported - Subsaharan African (%)
Ancestries Reported - Swedish (%)
Ancestries Reported - Swiss (%)
Ancestries Reported - Ukrainian (%)
Ancestries Reported - United States (%)
Ancestries Reported - Welsh (%)
Ancestries Reported - West Indian (%)
Ancestries Reported - Other (%)
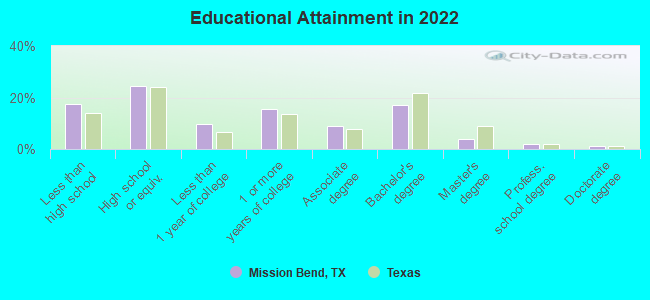
Educational Attainment - No schooling completed (%)
Educational Attainment - Less than high school (%)
Educational Attainment - High school or equivalent (%)
Educational Attainment - Less than 1 year of college (%)
Educational Attainment - 1 or more years of college (%)
Educational Attainment - Associate degree (%)
Educational Attainment - Bachelor's degree (%)
Educational Attainment - Master's degree (%)
Educational Attainment - Professional school degree (%)
Educational Attainment - Doctorate degree (%)
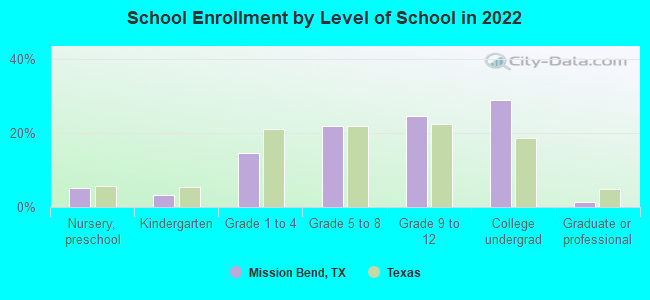
School Enrollment - Nursery, preschool (%)
School Enrollment - Kindergarten (%)
School Enrollment - Grade 1 to 4 (%)
School Enrollment - Grade 5 to 8 (%)
School Enrollment - Grade 9 to 12 (%)
School Enrollment - College undergrad (%)
School Enrollment - Graduate or professional (%)
School Enrollment - Not enrolled in school (%)
School enrollment - Public schools (%)
School enrollment - Private schools (%)
School enrollment - Not enrolled (%)
Median number of rooms in houses and condos
Median number of rooms in apartments
Housing units lacking complete plumbing facilities (%)
Housing units lacking complete kitchen facilities (%)
Density of houses
Urban houses (%)
Rural houses (%)
Households with people 60 years and over (%)
Households with people 65 years and over (%)
Households with people 75 years and over (%)
Households with one or more nonrelatives (%)
Households with no nonrelatives (%)
Population in households (%)
Family households (%)
Nonfamily households (%)
Population in families (%)
Family households with own children (%)
Median number of bedrooms in owner occupied houses
Mean number of bedrooms in owner occupied houses
Median number of bedrooms in renter occupied houses
Mean number of bedrooms in renter occupied houses
Median number of vehichles in owner occupied houses
Mean number of vehichles in owner occupied houses
Median number of vehichles in renter occupied houses
Mean number of vehichles in renter occupied houses
Mortgage status - with mortgage (%)
Mortgage status - with second mortgage (%)
Mortgage status - with home equity loan (%)
Mortgage status - with both second mortgage and home equity loan (%)
Mortgage status - without a mortgage (%)
Average family size
Average family size - White
Average family size - Black or African American
Average family size - Asian
Average family size - Hispanic or Latino
Average family size - American Indian and Alaska Native
Average family size - Multirace
Average family size - Other Race
Geographical mobility - Same house 1 year ago (%)
Geographical mobility - Moved within same county (%)
Geographical mobility - Moved from different county within same state (%)
Geographical mobility - Moved from different state (%)
Geographical mobility - Moved from abroad (%)
Place of birth - Born in state of residence (%)
Place of birth - Born in other state (%)
Place of birth - Native, outside of US (%)
Place of birth - Foreign born (%)
Housing units in structures - 1, detached (%)
Housing units in structures - 1, attached (%)
Housing units in structures - 2 (%)
Housing units in structures - 3 or 4 (%)
Housing units in structures - 5 to 9 (%)
Housing units in structures - 10 to 19 (%)
Housing units in structures - 20 to 49 (%)
Housing units in structures - 50 or more (%)
Housing units in structures - Mobile home (%)
Housing units in structures - Boat, RV, van, etc. (%)
House/condo owner moved in on average (years ago)
Renter moved in on average (years ago)
Year householder moved into unit - Moved in 1999 to March 2000 (%)
Year householder moved into unit - Moved in 1995 to 1998 (%)
Year householder moved into unit - Moved in 1990 to 1994 (%)
Year householder moved into unit - Moved in 1980 to 1989 (%)
Year householder moved into unit - Moved in 1970 to 1979 (%)
Year householder moved into unit - Moved in 1969 or earlier (%)
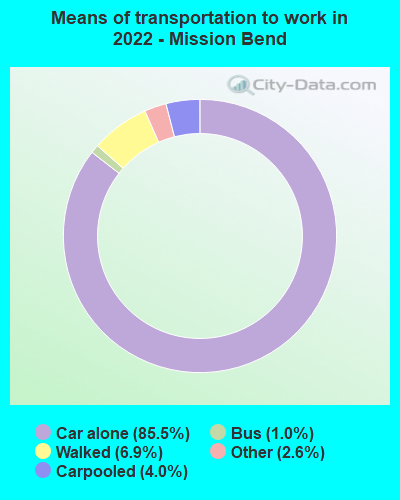
Means of transportation to work - Drove car alone (%)
Means of transportation to work - Carpooled (%)
Means of transportation to work - Public transportation (%)
Means of transportation to work - Bus or trolley bus (%)
Means of transportation to work - Streetcar or trolley car (%)
Means of transportation to work - Subway or elevated (%)
Means of transportation to work - Railroad (%)
Means of transportation to work - Ferryboat (%)
Means of transportation to work - Taxicab (%)
Means of transportation to work - Motorcycle (%)
Means of transportation to work - Bicycle (%)
Means of transportation to work - Walked (%)
Means of transportation to work - Other means (%)
Working at home (%)
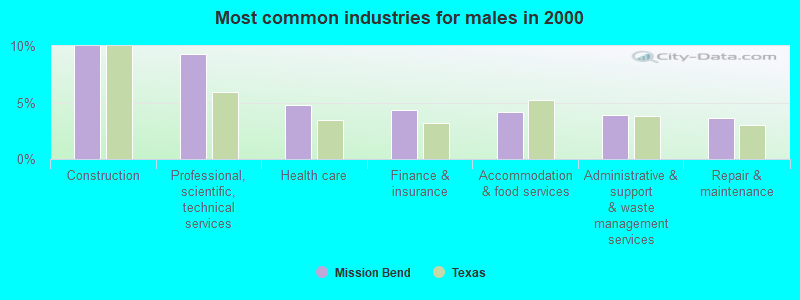
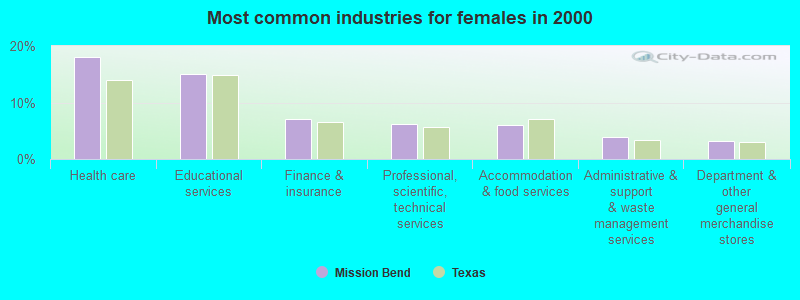
Industry diversity
Most Common Industries - Agriculture, forestry, fishing and hunting, and mining (%)
Most Common Industries - Agriculture, forestry, fishing and hunting (%)
Most Common Industries - Mining, quarrying, and oil and gas extraction (%)
Most Common Industries - Construction (%)
Most Common Industries - Manufacturing (%)
Most Common Industries - Wholesale trade (%)
Most Common Industries - Retail trade (%)
Most Common Industries - Transportation and warehousing, and utilities (%)
Most Common Industries - Transportation and warehousing (%)
Most Common Industries - Utilities (%)
Most Common Industries - Information (%)
Most Common Industries - Finance and insurance, and real estate and rental and leasing (%)
Most Common Industries - Finance and insurance (%)
Most Common Industries - Real estate and rental and leasing (%)
Most Common Industries - Professional, scientific, and management, and administrative and waste management services (%)
Most Common Industries - Professional, scientific, and technical services (%)
Most Common Industries - Management of companies and enterprises (%)
Most Common Industries - Administrative and support and waste management services (%)
Most Common Industries - Educational services, and health care and social assistance (%)
Most Common Industries - Educational services (%)
Most Common Industries - Health care and social assistance (%)
Most Common Industries - Arts, entertainment, and recreation, and accommodation and food services (%)
Most Common Industries - Arts, entertainment, and recreation (%)
Most Common Industries - Accommodation and food services (%)
Most Common Industries - Other services, except public administration (%)
Most Common Industries - Public administration (%)
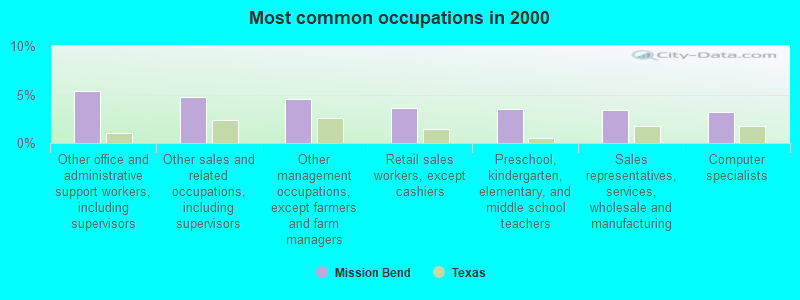
Occupation diversity
Most Common Occupations - Management, business, science, and arts occupations (%)
Most Common Occupations - Management, business, and financial occupations (%)
Most Common Occupations - Management occupations (%)
Most Common Occupations - Business and financial operations occupations (%)
Most Common Occupations - Computer, engineering, and science occupations (%)
Most Common Occupations - Computer and mathematical occupations (%)
Most Common Occupations - Architecture and engineering occupations (%)
Most Common Occupations - Life, physical, and social science occupations (%)
Most Common Occupations - Education, legal, community service, arts, and media occupations (%)
Most Common Occupations - Community and social service occupations (%)
Most Common Occupations - Legal occupations (%)
Most Common Occupations - Education, training, and library occupations (%)
Most Common Occupations - Arts, design, entertainment, sports, and media occupations (%)
Most Common Occupations - Healthcare practitioners and technical occupations (%)
Most Common Occupations - Health diagnosing and treating practitioners and other technical occupations (%)
Most Common Occupations - Health technologists and technicians (%)
Most Common Occupations - Service occupations (%)
Most Common Occupations - Healthcare support occupations (%)
Most Common Occupations - Protective service occupations (%)
Most Common Occupations - Fire fighting and prevention, and other protective service workers including supervisors (%)
Most Common Occupations - Law enforcement workers including supervisors (%)
Most Common Occupations - Food preparation and serving related occupations (%)
Most Common Occupations - Building and grounds cleaning and maintenance occupations (%)
Most Common Occupations - Personal care and service occupations (%)
Most Common Occupations - Sales and office occupations (%)
Most Common Occupations - Sales and related occupations (%)
Most Common Occupations - Office and administrative support occupations (%)
Most Common Occupations - Natural resources, construction, and maintenance occupations (%)
Most Common Occupations - Farming, fishing, and forestry occupations (%)
Most Common Occupations - Construction and extraction occupations (%)
Most Common Occupations - Installation, maintenance, and repair occupations (%)
Most Common Occupations - Production, transportation, and material moving occupations (%)
Most Common Occupations - Production occupations (%)
Most Common Occupations - Transportation occupations (%)
Most Common Occupations - Material moving occupations (%)
People in Group quarters - Institutionalized population (%)
People in Group quarters - Correctional institutions (%)
People in Group quarters - Federal prisons and detention centers (%)
People in Group quarters - Halfway houses (%)
People in Group quarters - Local jails and other confinement facilities (including police lockups) (%)
People in Group quarters - Military disciplinary barracks (%)
People in Group quarters - State prisons (%)
People in Group quarters - Other types of correctional institutions (%)
People in Group quarters - Nursing homes (%)
People in Group quarters - Hospitals/wards, hospices, and schools for the handicapped (%)
People in Group quarters - Hospitals/wards and hospices for chronically ill (%)
People in Group quarters - Hospices or homes for chronically ill (%)
People in Group quarters - Military hospitals or wards for chronically ill (%)
People in Group quarters - Other hospitals or wards for chronically ill (%)
People in Group quarters - Hospitals or wards for drug/alcohol abuse (%)
People in Group quarters - Mental (Psychiatric) hospitals or wards (%)
People in Group quarters - Schools, hospitals, or wards for the mentally retarded (%)
People in Group quarters - Schools, hospitals, or wards for the physically handicapped (%)
People in Group quarters - Institutions for the deaf (%)
People in Group quarters - Institutions for the blind (%)
People in Group quarters - Orthopedic wards and institutions for the physically handicapped (%)
People in Group quarters - Wards in general hospitals for patients who have no usual home elsewhere (%)
People in Group quarters - Wards in military hospitals for patients who have no usual home elsewhere (%)
People in Group quarters - Juvenile institutions (%)
People in Group quarters - Long-term care (%)
People in Group quarters - Homes for abused, dependent, and neglected children (%)
People in Group quarters - Residential treatment centers for emotionally disturbed children (%)
People in Group quarters - Training schools for juvenile delinquents (%)
People in Group quarters - Short-term care, detention or diagnostic centers for delinquent children (%)
People in Group quarters - Type of juvenile institution unknown (%)
People in Group quarters - Noninstitutionalized population (%)
People in Group quarters - College dormitories (includes college quarters off campus) (%)
People in Group quarters - Military quarters (%)
People in Group quarters - On base (%)
People in Group quarters - Barracks, unaccompanied personnel housing (UPH), (Enlisted/Officer), ;and similar group living quarters for military personnel (%)
People in Group quarters - Transient quarters for temporary residents (%)
People in Group quarters - Military ships (%)
People in Group quarters - Group homes (%)
People in Group quarters - Homes or halfway houses for drug/alcohol abuse (%)
People in Group quarters - Homes for the mentally ill (%)
People in Group quarters - Homes for the mentally retarded (%)
People in Group quarters - Homes for the physically handicapped (%)
People in Group quarters - Other group homes (%)
People in Group quarters - Religious group quarters (%)
People in Group quarters - Dormitories (%)
People in Group quarters - Agriculture workers' dormitories on farms (%)
People in Group quarters - Job Corps and vocational training facilities (%)
People in Group quarters - Other workers' dormitories (%)
People in Group quarters - Crews of maritime vessels (%)
People in Group quarters - Other nonhousehold living situations (%)
People in Group quarters - Other noninstitutional group quarters (%)
Residents speaking English at home (%)
Residents speaking English at home - Born in the United States (%)
Residents speaking English at home - Native, born elsewhere (%)
Residents speaking English at home - Foreign born (%)
Residents speaking Spanish at home (%)
Residents speaking Spanish at home - Born in the United States (%)
Residents speaking Spanish at home - Native, born elsewhere (%)
Residents speaking Spanish at home - Foreign born (%)
Residents speaking other language at home (%)
Residents speaking other language at home - Born in the United States (%)
Residents speaking other language at home - Native, born elsewhere (%)
Residents speaking other language at home - Foreign born (%)
Class of Workers - Employee of private company (%)
Class of Workers - Self-employed in own incorporated business (%)
Class of Workers - Private not-for-profit wage and salary workers (%)
Class of Workers - Local government workers (%)
Class of Workers - State government workers (%)
Class of Workers - Federal government workers (%)
Class of Workers - Self-employed workers in own not incorporated business and Unpaid family workers (%)
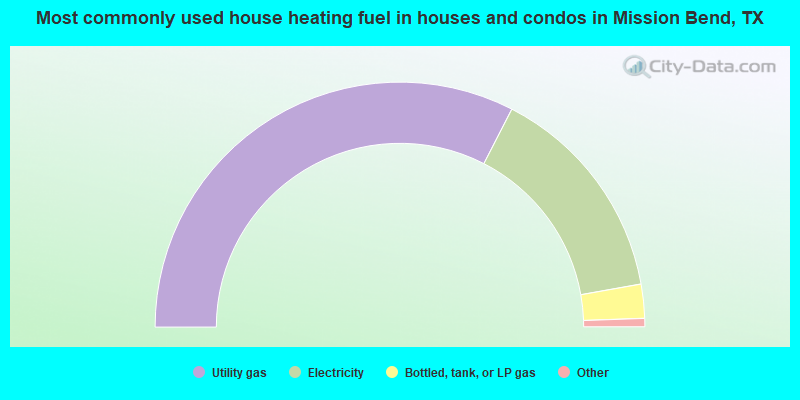
House heating fuel used in houses and condos - Utility gas (%)
House heating fuel used in houses and condos - Bottled, tank, or LP gas (%)
House heating fuel used in houses and condos - Electricity (%)
House heating fuel used in houses and condos - Fuel oil, kerosene, etc. (%)
House heating fuel used in houses and condos - Coal or coke (%)
House heating fuel used in houses and condos - Wood (%)
House heating fuel used in houses and condos - Solar energy (%)
House heating fuel used in houses and condos - Other fuel (%)
House heating fuel used in houses and condos - No fuel used (%)
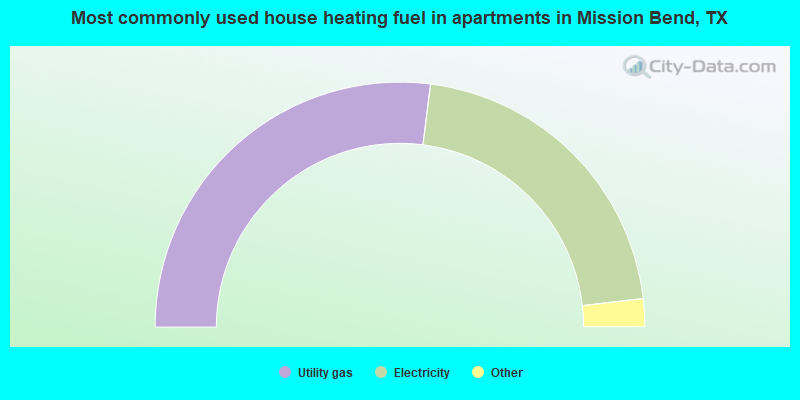
House heating fuel used in apartments - Utility gas (%)
House heating fuel used in apartments - Bottled, tank, or LP gas (%)
House heating fuel used in apartments - Electricity (%)
House heating fuel used in apartments - Fuel oil, kerosene, etc. (%)
House heating fuel used in apartments - Coal or coke (%)
House heating fuel used in apartments - Wood (%)
House heating fuel used in apartments - Solar energy (%)
House heating fuel used in apartments - Other fuel (%)
House heating fuel used in apartments - No fuel used (%)
Armed forces status - In Armed Forces (%)
Armed forces status - Civilian (%)
Armed forces status - Civilian - Veteran (%)
Armed forces status - Civilian - Nonveteran (%)
Fatal accidents locations in years 2005-2021
Fatal accidents locations in 2005
Fatal accidents locations in 2006
Fatal accidents locations in 2007
Fatal accidents locations in 2008
Fatal accidents locations in 2009
Fatal accidents locations in 2010
Fatal accidents locations in 2011
Fatal accidents locations in 2012
Fatal accidents locations in 2013
Fatal accidents locations in 2014
Fatal accidents locations in 2015
Fatal accidents locations in 2016
Fatal accidents locations in 2017
Fatal accidents locations in 2018
Fatal accidents locations in 2019
Fatal accidents locations in 2020
Fatal accidents locations in 2021
Alcohol use - People drinking some alcohol every month (%)
Alcohol use - People not drinking at all (%)
Alcohol use - Average days/month drinking alcohol
Alcohol use - Average drinks/week
Alcohol use - Average days/year people drink much
Audiometry - Average condition of hearing (%)
Audiometry - People that can hear a whisper from across a quiet room (%)
Audiometry - People that can hear normal voice from across a quiet room (%)
Audiometry - Ears ringing, roaring, buzzing (%)
Audiometry - Had a job exposure to loud noise (%)
Audiometry - Had off-work exposure to loud noise (%)
Blood Pressure & Cholesterol - Has high blood pressure (%)
Blood Pressure & Cholesterol - Checking blood pressure at home (%)
Blood Pressure & Cholesterol - Frequently checking blood cholesterol (%)
Blood Pressure & Cholesterol - Has high cholesterol level (%)
Consumer Behavior - Money monthly spent on food at supermarket/grocery store
Consumer Behavior - Money monthly spent on food at other stores
Consumer Behavior - Money monthly spent on eating out
Consumer Behavior - Money monthly spent on carryout/delivered foods
Consumer Behavior - Income spent on food at supermarket/grocery store (%)
Consumer Behavior - Income spent on food at other stores (%)
Consumer Behavior - Income spent on eating out (%)
Consumer Behavior - Income spent on carryout/delivered foods (%)
Current Health Status - General health condition (%)
Current Health Status - Blood donors (%)
Current Health Status - Has blood ever tested for HIV virus (%)
Current Health Status - Left-handed people (%)
Dermatology - People using sunscreen (%)
Diabetes - Diabetics (%)
Diabetes - Had a blood test for high blood sugar (%)
Diabetes - People taking insulin (%)
Diet Behavior & Nutrition - Diet health (%)
Diet Behavior & Nutrition - Milk product consumption (# of products/month)
Diet Behavior & Nutrition - Meals not home prepared (#/week)
Diet Behavior & Nutrition - Meals from fast food or pizza place (#/week)
Diet Behavior & Nutrition - Ready-to-eat foods (#/month)
Diet Behavior & Nutrition - Frozen meals/pizza (#/month)
Drug Use - People that ever used marijuana or hashish (%)
Drug Use - Ever used hard drugs (%)
Drug Use - Ever used any form of cocaine (%)
Drug Use - Ever used heroin (%)
Drug Use - Ever used methamphetamine (%)
Health Insurance - People covered by health insurance (%)
Kidney Conditions-Urology - Avg. # of times urinating at night
Medical Conditions - People with asthma (%)
Medical Conditions - People with anemia (%)
Medical Conditions - People with psoriasis (%)
Medical Conditions - People with overweight (%)
Medical Conditions - Elderly people having difficulties in thinking or remembering (%)
Medical Conditions - People who ever received blood transfusion (%)
Medical Conditions - People having trouble seeing even with glass/contacts (%)
Medical Conditions - People with arthritis (%)
Medical Conditions - People with gout (%)
Medical Conditions - People with congestive heart failure (%)
Medical Conditions - People with coronary heart disease (%)
Medical Conditions - People with angina pectoris (%)
Medical Conditions - People who ever had heart attack (%)
Medical Conditions - People who ever had stroke (%)
Medical Conditions - People with emphysema (%)
Medical Conditions - People with thyroid problem (%)
Medical Conditions - People with chronic bronchitis (%)
Medical Conditions - People with any liver condition (%)
Medical Conditions - People who ever had cancer or malignancy (%)
Mental Health - People who have little interest in doing things (%)
Mental Health - People feeling down, depressed, or hopeless (%)
Mental Health - People who have trouble sleeping or sleeping too much (%)
Mental Health - People feeling tired or having little energy (%)
Mental Health - People with poor appetite or overeating (%)
Mental Health - People feeling bad about themself (%)
Mental Health - People who have trouble concentrating on things (%)
Mental Health - People moving or speaking slowly or too fast (%)
Mental Health - People having thoughts they would be better off dead (%)
Oral Health - Average years since last visit a dentist
Oral Health - People embarrassed because of mouth (%)
Oral Health - People with gum disease (%)
Oral Health - General health of teeth and gums (%)
Oral Health - Average days a week using dental floss/device
Oral Health - Average days a week using mouthwash for dental problem
Oral Health - Average number of teeth
Pesticide Use - Households using pesticides to control insects (%)
Pesticide Use - Households using pesticides to kill weeds (%)
Physical Activity - People doing vigorous-intensity work activities (%)
Physical Activity - People doing moderate-intensity work activities (%)
Physical Activity - People walking or bicycling (%)
Physical Activity - People doing vigorous-intensity recreational activities (%)
Physical Activity - People doing moderate-intensity recreational activities (%)
Physical Activity - Average hours a day doing sedentary activities
Physical Activity - Average hours a day watching TV or videos
Physical Activity - Average hours a day using computer
Physical Functioning - People having limitations keeping them from working (%)
Physical Functioning - People limited in amount of work they can do (%)
Physical Functioning - People that need special equipment to walk (%)
Physical Functioning - People experiencing confusion/memory problems (%)
Physical Functioning - People requiring special healthcare equipment (%)
Prescription Medications - Average number of prescription medicines taking
Preventive Aspirin Use - Adults 40+ taking low-dose aspirin (%)
Reproductive Health - Vaginal deliveries (%)
Reproductive Health - Cesarean deliveries (%)
Reproductive Health - Deliveries resulted in a live birth (%)
Reproductive Health - Pregnancies resulted in a delivery (%)
Reproductive Health - Women breastfeeding newborns (%)
Reproductive Health - Women that had a hysterectomy (%)
Reproductive Health - Women that had both ovaries removed (%)
Reproductive Health - Women that have ever taken birth control pills (%)
Reproductive Health - Women taking birth control pills (%)
Reproductive Health - Women that have ever used Depo-Provera or injectables (%)
Reproductive Health - Women that have ever used female hormones (%)
Sexual Behavior - People 18+ that ever had sex (vaginal, anal, or oral) (%)
Sexual Behavior - Males 18+ that ever had vaginal sex with a woman (%)
Sexual Behavior - Males 18+ that ever performed oral sex on a woman (%)
Sexual Behavior - Males 18+ that ever had anal sex with a woman (%)
Sexual Behavior - Males 18+ that ever had any sex with a man (%)
Sexual Behavior - Females 18+ that ever had vaginal sex with a man (%)
Sexual Behavior - Females 18+ that ever performed oral sex on a man (%)
Sexual Behavior - Females 18+ that ever had anal sex with a man (%)
Sexual Behavior - Females 18+ that ever had any kind of sex with a woman (%)
Sexual Behavior - Average age people first had sex
Sexual Behavior - Average number of female sex partners in lifetime (males 18+)
Sexual Behavior - Average number of female vaginal sex partners in lifetime (males 18+)
Sexual Behavior - Average age people first performed oral sex on a woman (18+)
Sexual Behavior - Average number of woman performed oral sex on in lifetime (18+)
Sexual Behavior - Average number of male sex partners in lifetime (males 18+)
Sexual Behavior - Average number of male anal sex partners in lifetime (males 18+)
Sexual Behavior - Average age people first performed oral sex on a man (18+)
Sexual Behavior - Average number of male oral sex partners in lifetime (18+)
Sexual Behavior - People using protection when performing oral sex (%)
Sexual Behavior - Average number of times people have vaginal or anal sex a year
Sexual Behavior - People having sex without condom (%)
Sexual Behavior - Average number of male sex partners in lifetime (females 18+)
Sexual Behavior - Average number of male vaginal sex partners in lifetime (females 18+)
Sexual Behavior - Average number of female sex partners in lifetime (females 18+)
Sexual Behavior - Circumcised males 18+ (%)
Sleep Disorders - Average hours sleeping at night
Sleep Disorders - People that has trouble sleeping (%)
Smoking-Cigarette Use - People smoking cigarettes (%)
Taste & Smell - People 40+ having problems with smell (%)
Taste & Smell - People 40+ having problems with taste (%)
Taste & Smell - People 40+ that ever had wisdom teeth removed (%)
Taste & Smell - People 40+ that ever had tonsils teeth removed (%)
Taste & Smell - People 40+ that ever had a loss of consciousness because of a head injury (%)
Taste & Smell - People 40+ that ever had a broken nose or other serious injury to face or skull (%)
Taste & Smell - People 40+ that ever had two or more sinus infections (%)
Weight - Average height (inches)
Weight - Average weight (pounds)
Weight - Average BMI
Weight - People that are obese (%)
Weight - People that ever were obese (%)
Weight - People trying to lose weight (%)
Latest news from Mission Bend, TX collected exclusively by city-data.com from local newspapers, TV, and radio stations
Ancestries: Nigerian (6.2%), American (4.6%), African (3.5%), German (1.7%).
Current Local Time:
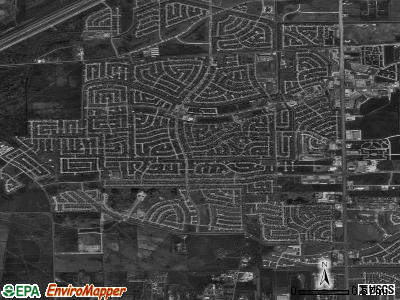
Land area: 5.23 square miles.
Population density: 6,985 people per square mile (high).
14,804 residents are foreign born (19.7% Latin America , 10.6% Asia , 6.6% Africa ).
This place:
36.6%Texas:
17.1%
Median real estate property taxes paid for housing units with mortgages in 2022: $3,535 (1.7%)Median real estate property taxes paid for housing units with no mortgage in 2022: $3,029 (1.4%)
Nearest city with pop. 50,000+: Sugar Land, TX
Nearest city with pop. 200,000+: Houston, TX
Nearest cities:
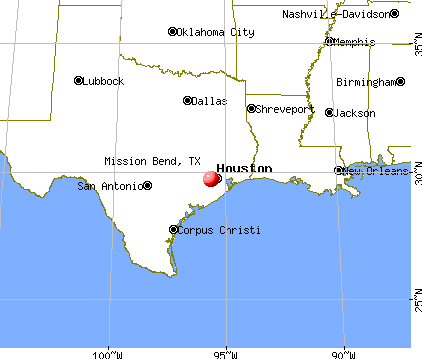
Latitude: 29.69 N, Longitude: 95.66 W
Daytime population change due to commuting: -15,353 (-38.0%)Workers who live and work in this place: 2,407 (12.6%)
Property values in Mission Bend, TX
Unemployment in December 2023:
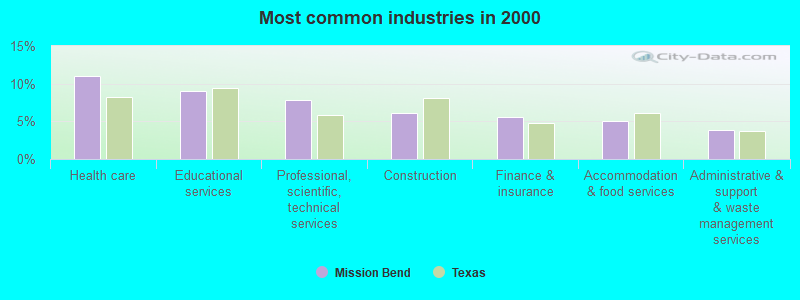
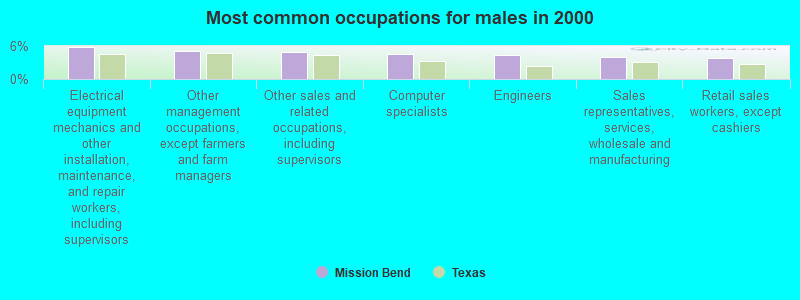
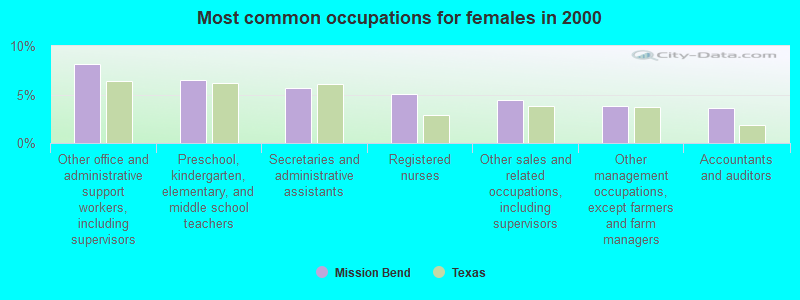
Most common occupations in Mission Bend, TX (%)
Both Males Females
Other office and administrative support workers, including supervisors (5.4%)
Other sales and related occupations, including supervisors (4.7%)
Other management occupations, except farmers and farm managers (4.5%)
Retail sales workers, except cashiers (3.6%)
Preschool, kindergarten, elementary, and middle school teachers (3.6%)
Sales representatives, services, wholesale and manufacturing (3.4%)
Computer specialists (3.2%)
Electrical equipment mechanics and other installation, maintenance, and repair workers, including supervisors (5.8%)
Other management occupations, except farmers and farm managers (5.1%)
Other sales and related occupations, including supervisors (5.0%)
Computer specialists (4.6%)
Engineers (4.3%)
Sales representatives, services, wholesale and manufacturing (3.9%)
Retail sales workers, except cashiers (3.9%)
Other office and administrative support workers, including supervisors (8.2%)
Preschool, kindergarten, elementary, and middle school teachers (6.5%)
Secretaries and administrative assistants (5.7%)
Registered nurses (5.1%)
Other sales and related occupations, including supervisors (4.4%)
Other management occupations, except farmers and farm managers (3.8%)
Accountants and auditors (3.6%)
Tornado activity:
Mission Bend-area historical tornado activity is slightly above Texas state average. It is 79% greater than the overall U.S. average.
On 11/21/1992, a category F4 (max. wind speeds 207-260 mph) tornado 23.1 miles away from the Mission Bend place center injured 16 people and caused between $50,000,000 and $500,000,000 in damages.
On 9/13/1974, a category F3 (max. wind speeds 158-206 mph) tornado 6.2 miles away from the place center injured 2 people .
Earthquake activity:
Mission Bend-area historical earthquake activity is significantly above Texas state average. It is 36% smaller than the overall U.S. average. On 10/20/2011 at 12:24:41, a magnitude 4.8 (4.8 MW, Depth: 3.1 mi, Class: Light, Intensity: IV - V) earthquake occurred 156.7 miles away from the city center On 5/17/2012 at 08:12:00, a magnitude 4.8 (4.8 MW, Depth: 3.1 mi) earthquake occurred 172.4 miles away from Mission Bend center On 4/9/1993 at 12:29:19, a magnitude 4.3 (4.1 MB, 4.3 LG, Depth: 3.1 mi) earthquake occurred 160.6 miles away from the city center On 9/2/2013 at 23:51:15, a magnitude 4.3 (4.3 MW, Depth: 2.9 mi) earthquake occurred 169.9 miles away from Mission Bend center On 9/2/2013 at 21:52:38, a magnitude 4.2 (4.2 MW, Depth: 3.0 mi) earthquake occurred 171.0 miles away from the city center On 6/16/1978 at 11:46:54, a magnitude 5.3 (4.4 MB, 4.6 UK, 5.3 ML, Class: Moderate, Intensity: VI - VII) earthquake occurred 379.6 miles away from the city center Magnitude types: regional Lg-wave magnitude (LG), body-wave magnitude (MB), local magnitude (ML), moment magnitude (MW) Natural disasters: The number of natural disasters in Fort Bend County (20) is greater than the US average (15).Major Disasters (Presidential) Declared: 11Emergencies Declared: 6Hurricanes: 9, Storms: 8, Floods: 7, Tornadoes: 3, Fires: 2, Wind: 1, Other: 1 (Note: some incidents may be assigned to more than one category). Hospitals and medical centers near Mission Bend: THE TREND HEALTHCARE SERVICES (Home Health Center, about 1 miles away; HOUSTON, TX)
SUGARLAND TRINITY HOME HEALTH CARE LLC (Home Health Center, about 1 miles away; HOUSTON, TX)
FAMCARE HOME HEALTH SERVICES (Home Health Center, about 1 miles away; HOUSTON, TX)
JMM HOME HEALTH INC (Home Health Center, about 1 miles away; HOUSTON, TX)
UNIQUE HOME HEALTH SERVICES INC (Home Health Center, about 1 miles away; HOUSTON, TX)
COSMEC HEALTH CARE RESOURCE INC (Home Health Center, about 1 miles away; HOUSTON, TX)
BESTIN MEDICAL GROUP INC (Home Health Center, about 1 miles away; HOUSTON, TX)
Amtrak station near Mission Bend: 19 miles: HOUSTON (902 WASHINGTON AVE.) Services: ticket office, fully wheelchair accessible, enclosed waiting area, public restrooms, public payphones, vending machines, free short-term parking, free long-term parking, taxi stand, public transit connection.
Colleges/universities with over 2000 students nearest to Mission Bend:
Houston Baptist University (about 9 miles; Houston, TX ; Full-time enrollment: 2,340)
The Art Institute of Houston (about 14 miles; Houston, TX ; FT enrollment: 2,429)
The University of Texas Health Science Center at Houston (about 16 miles; Houston, TX ; FT enrollment: 3,023)
Rice University (about 16 miles; Houston, TX ; FT enrollment: 6,713)
University of St Thomas (about 17 miles; Houston, TX ; FT enrollment: 2,747)
Houston Community College (about 18 miles; Houston, TX ; FT enrollment: 38,303)
Texas Southern University (about 19 miles; Houston, TX ; FT enrollment: 7,053)
Notable locations in Mission Bend: (A) , Community Volunteer Fire Department Training Center (B) . Display/hide their locations on the map
Shopping Center: (1) . Display/hide its location on the map
Churches in Mission Bend include: (A) , Grace United Pentecostal Church (B) , Mission Bend Baptist Church (C) , West Oaks Baptist Church (D) , Alief Church of the Nazarene (E) , Providence Baptist Church (F) , Southwest Calvary Baptist Church Spanish Ministry (G) . Display/hide their locations on the map
Fort Bend County has a predicted average indoor radon screening level less than 2 pCi/L (pico curies per liter) - Low Potential Average household size: This place:
3.5 peopleTexas:
2.8 people
Percentage of family households: This place:
85.8%Whole state:
69.9%
Percentage of households with unmarried partners: This place:
4.9%Whole state:
6.0%
Likely homosexual households (counted as self-reported same-sex unmarried-partner households)
Lesbian couples: 0.4% of all households Gay men: 0.2% of all households
6 people in nursing facilities/skilled-nursing facilities in 2010people in other noninstitutional group quarters in 2000
For population 15 years and over in Mission Bend:
Never married: 33.6%Now married: 52.6%Separated: 2.4%Widowed: 4.0%Divorced: 7.4% For population 25 years and over in Mission Bend:
High school or higher: 82.7%Bachelor's degree or higher: 22.5%Graduate or professional degree: 6.8%Unemployed: 4.8%Mean travel time to work (commute): 26.9 minutes
Education Gini index (Inequality in education) Here:
14.9Texas average:
14.0
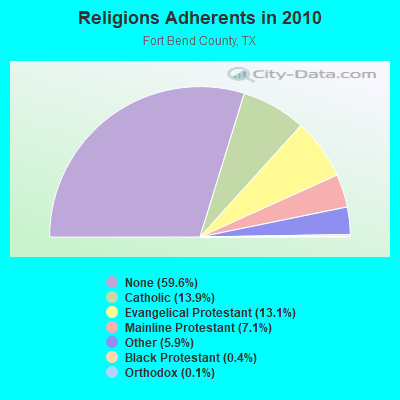
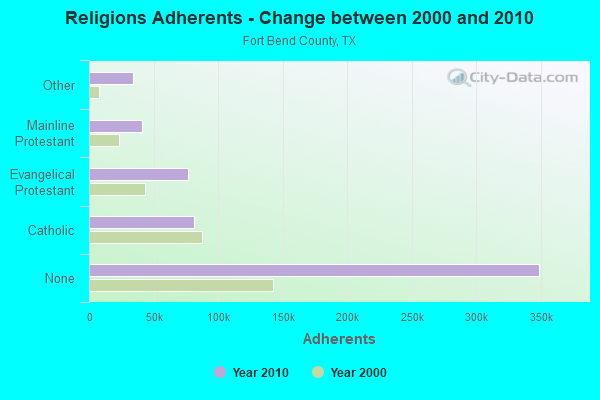
Religion statistics for Mission Bend, TX (based on Fort Bend County data)
Religion Adherents Congregations Catholic 81,096 12 Evangelical Protestant 76,590 240 Mainline Protestant 41,419 39 Other 34,339 42 Black Protestant 2,103 11 Orthodox 865 3 None 348,963 -
Source: Clifford Grammich, Kirk Hadaway, Richard Houseal, Dale E.Jones, Alexei Krindatch, Richie Stanley and Richard H.Taylor. 2012. 2010 U.S.Religion Census: Religious Congregations & Membership Study. Association of Statisticians of American Religious Bodies. Jones, Dale E., et al. 2002. Congregations and Membership in the United States 2000. Nashville, TN: Glenmary Research Center. Graphs represent county-level data
Food Environment Statistics: Number of grocery stores : 66Fort Bend County :
1.30 / 10,000 pop.Texas :
1.47 / 10,000 pop.
Number of supercenters and club stores : 8Here :
0.16 / 10,000 pop.Texas :
0.14 / 10,000 pop.
Number of convenience stores (no gas) : 56Here :
1.10 / 10,000 pop.Texas :
1.11 / 10,000 pop.
Number of convenience stores (with gas) : 153Fort Bend County :
3.01 / 10,000 pop.Texas :
3.95 / 10,000 pop.
Number of full-service restaurants : 232Fort Bend County :
4.57 / 10,000 pop.Texas :
6.13 / 10,000 pop.
Adult diabetes rate : Fort Bend County :
8.8%Texas :
8.9%
Adult obesity rate : Fort Bend County :
25.8%Texas :
26.6%
Low-income preschool obesity rate : This county :
16.2%Texas :
15.7%
Health and Nutrition: Healthy diet rate : Mission Bend:
49.1%State:
48.6%
Average overall health of teeth and gums : Mission Bend:
47.3%State:
47.4%
Average BMI : Mission Bend:
28.4State:
28.5
People feeling badly about themselves : This city:
20.8%Texas:
20.6%
People not drinking alcohol at all : Mission Bend:
13.0%Texas:
10.3%
Average hours sleeping at night : Overweight people : Mission Bend:
31.9%State:
33.1%
General health condition : Mission Bend:
55.7%Texas:
56.2%
Average condition of hearing : Mission Bend:
82.6%Texas:
80.7%
More about Health and Nutrition of Mission Bend, TX Residents
9.87% of this county's 2021 resident taxpayers lived in other counties in 2020 ($76,996 average adjusted gross income )
Here:
9.87%Texas average:
8.12%
0.01% of residents moved from foreign countries ($59 average AGI )Fort Bend County:
0.01%Texas average:
0.04%
Top counties from which taxpayers relocated into this county between 2020 and 2021:
7.39% of this county's 2020 resident taxpayers moved to other counties in 2021 ($84,563 average adjusted gross income )
Here:
7.39%Texas average:
7.40%
0.01% of residents moved to foreign countries ($83 average AGI )Fort Bend County:
0.01%Texas average:
0.03%
Top counties to which taxpayers relocated from this county between 2020 and 2021: Strongest AM radio stations in Mission Bend:
KEYH (850 AM; 10 kW; HOUSTON, TX; Owner: LIBERMAN BROADCASTING OF HOUSTON LICENSE CORP.)
KILE (1560 AM; 50 kW; BELLAIRE, TX; Owner: THE RAFTT CORPORATION)
KRTX (980 AM; 5 kW; ROSENBURG/RICHMOND, TX)
KGOL (1180 AM; 50 kW; HUMBLE, TX; Owner: ENTRAVISION HOLDINGS, LLC)
KTRH (740 AM; 50 kW; HOUSTON, TX; Owner: AMFM TEXAS LICENSES LIMITED PARTNERSHIP)
KILT (610 AM; 5 kW; HOUSTON, TX; Owner: TEXAS INFINITY BROADCASTING L.P.)
KSEV (700 AM; 15 kW; TOMBALL, TX; Owner: LIBERMAN BROADCASTING OF HOUSTON LICENSE CORP.)
KKHT (1070 AM; 10 kW; HOUSTON, TX; Owner: SOUTH TEXAS BROADCASTING, INC.)
KBME (790 AM; 5 kW; HOUSTON, TX; Owner: AMFM TEXAS LICENSES LTD. PARTNERSHIP)
KLAT (1010 AM; 10 kW; HOUSTON, TX; Owner: TICHENOR LICENSE CORPORATION ("TLC"))
KMIC (1590 AM; 5 kW; HOUSTON, TX; Owner: ABC, INC)
KPRC (950 AM; 5 kW; HOUSTON, TX; Owner: CCB TEXAS LICENSES, L.P.)
KREH (900 AM; 5 kW; PECAN GROVE, TX)
Strongest FM radio stations in Mission Bend:
KBXX (97.9 FM; HOUSTON, TX; Owner: RADIO ONE LICENSES, LLC)
KHJZ-FM (95.7 FM; HOUSTON, TX; Owner: TEXAS INFINITY BROADCASTING L.P.)
KHMX (96.5 FM; HOUSTON, TX; Owner: CITICASTERS LICENSES, L.P.)
KILT-FM (100.3 FM; HOUSTON, TX; Owner: TEXAS INFINITY BROADCASTING L.P.)
KKBQ-FM (92.9 FM; PASADENA, TX; Owner: CXR HOLDINGS, INC.)
KLOL (101.1 FM; HOUSTON, TX; Owner: AMFM TEXAS LICENSES LIMITED PARTNERSHIP)
KODA (99.1 FM; HOUSTON, TX; Owner: AMFM TEXAS LICENSES LIMITED PARTNERSHIP)
KTBZ-FM (94.5 FM; HOUSTON, TX; Owner: AMFM TEXAS LICENSES LIMITED PARTNERSHIP)
KRBE (104.1 FM; HOUSTON, TX; Owner: KRBE LICO, INC.)
KKRW (93.7 FM; HOUSTON, TX; Owner: CAPSTAR TX LIMITED PARTNERSHIP)
KMJQ (102.1 FM; HOUSTON, TX; Owner: RADIO ONE LICENSES, LLC)
KHCB-FM (105.7 FM; HOUSTON, TX; Owner: HOUSTON CHRISTIAN BROADCASTERS, INC.)
KUHF (88.7 FM; HOUSTON, TX; Owner: UNIVERSITY OF HOUSTON SYSTEM)
K259AB (99.7 FM; SUGAR LAND, TX; Owner: THE KSBJ EDUCATIONAL FOUNDATION)
KPTY (104.9 FM; MISSOURI CITY, TX; Owner: TICHENOR LICENSE CORPORATION ("TLC"))
KPFT (90.1 FM; HOUSTON, TX; Owner: PACIFICA FOUNDATION, INC.)
KLTN (102.9 FM; HOUSTON, TX; Owner: HBC HOUSTON LICENSE CORPORATION)
KLDE (107.5 FM; LAKE JACKSON, TX; Owner: CXR HOLDINGS, INC.)
KHPT (106.9 FM; CONROE, TX; Owner: CXR HOLDINGS, INC.)
KOVE-FM (106.5 FM; GALVESTON, TX; Owner: HBC LICENSE CORPORATION)
TV broadcast stations around Mission Bend:
KPRC-TV (Channel 2; HOUSTON, TX; Owner: POST-NEWSWEEK STATIONS, HOUSTON, LP)
KHOU-TV (Channel 11; HOUSTON, TX; Owner: KHOU-TV, L.P.)
KPXB (Channel 49; CONROE, TX; Owner: PAXSON HOUSTON LICENSE, INC.)
KFTH (Channel 67; ALVIN, TX; Owner: TELEFUTURA HOUSTON LLC)
KTBU (Channel 55; CONROE, TX; Owner: HUMANITY INTERESTED MEDIA, INC.)
KTXH (Channel 20; HOUSTON, TX; Owner: FOX TELEVISION STATIONS, INC.)
KRIV (Channel 26; HOUSTON, TX; Owner: FOX TELEVISION STATIONS, INC.)
KHWB (Channel 39; HOUSTON, TX; Owner: KHWB, INC.)
KTRK-TV (Channel 13; HOUSTON, TX; Owner: KTRK TELEVISION, INC.)
KNWS-TV (Channel 51; KATY, TX; Owner: JOHNSON BROADCASTING, INC.)
KVDO-LP (Channel 69; CLEAR LAKE, TX; Owner: FAR EASTERN TELECASTERS)
KUHT (Channel 8; HOUSTON, TX; Owner: UNIVERSITY OF HOUSTON SYSTEM)
KXLN-TV (Channel 45; ROSENBERG, TX; Owner: KXLN LICENSE PARTNERSHIP, L.P.)
KBPX-LP (Channel 33; HOUSTON, TX; Owner: PAXSON COMMUNICATIONS LPTV, INC.)
KZJL (Channel 61; HOUSTON, TX; Owner: KZJL LICENSE CORP.)
KETH (Channel 14; HOUSTON, TX; Owner: COMMUNITY EDUCATIONAL TV, INC.)
KHMV-LP (Channel 28; HOUSTON, TX; Owner: PAPPAS TELECASTING OF THE GULF COAST, A CALIFORNIA LP)
KVIT-LP (Channel 28; VICTORIA, TX; Owner: CLUB COMMUNICATIONS)
KJIB-LP (Channel 5; CLEAR LAKE CITY, TX; Owner: FAR EASTERN TELECASTERS)
KVVV-LP (Channel 53; HOUSTON, TX; Owner: KAZH LICENSE, LLC)
KTMD (Channel 48; GALVESTON, TX; Owner: TELEMUNDO OF TEXAS PARTNERSHIP, LP)
K30CV (Channel 30; HOUSTON, TX; Owner: BROADCASTING SYSTEMS, INC.)
KLTJ (Channel 22; GALVESTON, TX; Owner: WORD OF GOD FELLOWSHIP, INC.)
KAZH (Channel 57; BAYTOWN, TX; Owner: KAZH LICENSE, LLC)
KVQT-LP (Channel 24; HOUSTON, TX; Owner: C. DOWEN JOHNSON)
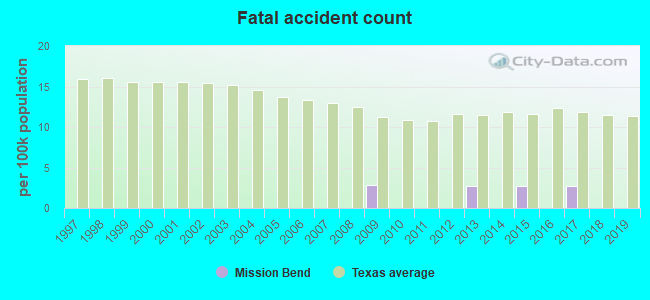
Mission Bend fatal accident list:
Oct 15, 2021 02:20 PM, Beechnut St, Addicks Clodine Rd, Lat: 29.688822, Lon: -95.663403, Vehicles: 2, Persons: 2, Fatalities: 1Lat: 29.680378, Lon: -95.643592, Vehicles: 1, Persons: 1, Pedestrians: 1, Fatalities: 1Lat: 29.681303, Lon: -95.643472, Vehicles: 1, Persons: 3, Fatalities: 1Lat: 29.703236, Lon: -95.688050, Vehicles: 2, Persons: 2, Fatalities: 1Lat: 29.682128, Lon: -95.643594, Vehicles: 1, Persons: 1, Pedestrians: 1, Fatalities: 1Lat: 29.688831, Lon: -95.663233, Vehicles: 1, Persons: 1, Pedestrians: 1, Fatalities: 1Lat: 29.680600, Lon: -95.643625, Vehicles: 1, Persons: 2, Fatalities: 2
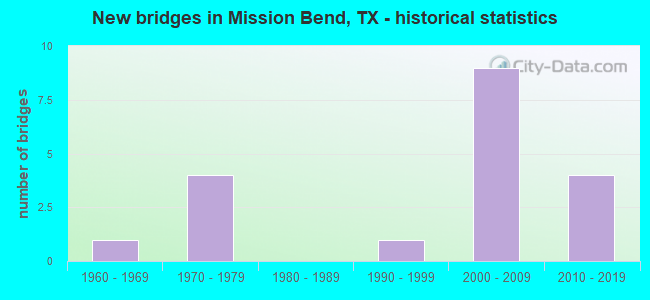
National Bridge Inventory (NBI) Statistics 19 Number of bridges335ft / 102m Total length $12,000 Total costs148,070 Total average daily traffic5,806 Total average daily truck traffic
New bridges - historical statistics
1 1960-1969 4 1970-1979 1 1990-1999 9 2000-2009 4 2010-2019
See full National Bridge Inventory statistics for Mission Bend, TX
FCC Registered Microwave Towers: 3
HOU0702, 15619 1/2 Alief Clodine Road (Lat: 29.708889 Lon: -95.663056), Type: Pole, Structure height: 27.5 m, Overall height: 28 m, Call Sign: WQFR837, Licensee ID: L01728370, Assigned Frequencies: 10915.0 MHz, Grant Date: 09/19/2006, Expiration Date: 09/19/2016, Cancellation Date: 09/17/2013, Certifier: Joseph M Sandri Jr., Registrant: Fibertower Network Services, Corp., Debtor-In-Possession, 1875 Eye Street, Nw, 5th Floor, Room 505, Washington, DC 20006, Phone: (202) 223-1028, Email:
TX-HOU5967B, 7324 Clodine Reddick Road (Lat: 29.692417 Lon: -95.687111), Type: Pole, Structure height: 36.6 m, Call Sign: WQLK973, Assigned Frequencies: 23025.0 MHz, 23025.0 MHz, 23025.0 MHz, 23025.0 MHz, 23025.0 MHz, 23025.0 MHz, 23125.0 MHz, 23125.0 MHz, 23125.0 MHz, 23125.0 MHz... (+6 more), Grant Date: 04/21/2020, Expiration Date: 02/26/2030, Cancellation Date: 09/10/2021, Certifier: Nadja S Sodos-Wallace, Registrant: T-Mobile Usa, Inc., 12920 Se 38th Street, Bellevue, WA 98006, Phone: (425) 383-8402, Fax: (425) 383-4840, Email:
HO60XC967, 7324 Clodine-Reddick (Lat: 29.692417 Lon: -95.687139), Type: Mtower, Structure height: 36.6 m, Call Sign: WQRS369, Assigned Frequencies: 17765.0 MHz, 18015.0 MHz, 17765.0 MHz, 18015.0 MHz, 17765.0 MHz, 18015.0 MHz, 17765.0 MHz, 18015.0 MHz, 17765.0 MHz, 18015.0 MHz... (+30 more), Grant Date: 07/17/2013, Expiration Date: 07/17/2023, Cancellation Date: 05/01/2023, Certifier: Jenny Knopf, Registrant: T-Mobile Usa, Inc., 12920 Se 38th Street, Bellevue, WA 98006, Phone: (425) 383-8401, Email:
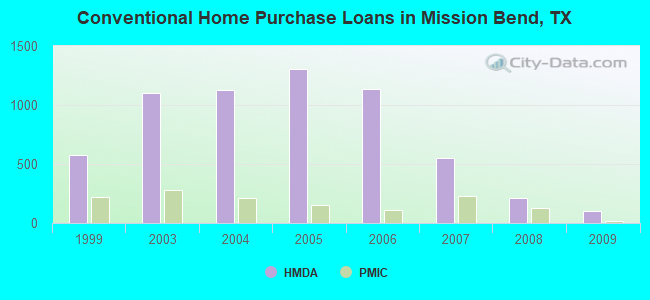
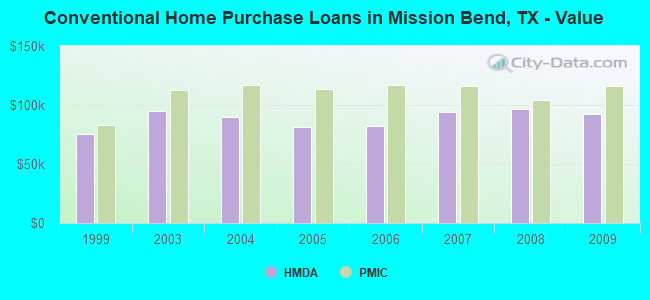
Home Mortgage Disclosure Act Aggregated Statistics For Year 2009(Based on 5 full tracts) A) FHA, FSA/RHS & VA B) Conventional C) Refinancings D) Home Improvement Loans F) Non-occupant Loans on G) Loans On Manufactured Number Average Value Number Average Value Number Average Value Number Average Value Number Average Value Number Average Value
LOANS ORIGINATED 179 $110,876 100 $91,993 161 $104,000 25 $23,051 47 $70,439 0 $0 APPLICATIONS APPROVED, NOT ACCEPTED 8 $125,285 10 $98,781 36 $106,738 4 $33,412 5 $79,162 0 $0 APPLICATIONS DENIED 45 $115,127 48 $100,958 220 $103,495 59 $27,717 29 $68,734 1 $61,000 APPLICATIONS WITHDRAWN 29 $118,794 25 $103,267 102 $113,851 14 $61,058 13 $76,786 0 $0 FILES CLOSED FOR INCOMPLETENESS 12 $103,418 4 $86,500 32 $104,801 1 $20,000 3 $61,873 0 $0
Aggregated Statistics For Year 2008(Based on 5 full tracts) A) FHA, FSA/RHS & VA B) Conventional C) Refinancings D) Home Improvement Loans F) Non-occupant Loans on G) Loans On Manufactured Number Average Value Number Average Value Number Average Value Number Average Value Number Average Value Number Average Value
LOANS ORIGINATED 129 $115,768 209 $96,740 191 $95,609 32 $42,411 94 $82,692 0 $0 APPLICATIONS APPROVED, NOT ACCEPTED 8 $121,750 32 $99,105 45 $89,959 11 $31,786 12 $75,596 1 $101,150 APPLICATIONS DENIED 51 $109,973 120 $103,697 355 $104,040 101 $38,254 54 $80,222 2 $21,500 APPLICATIONS WITHDRAWN 28 $120,560 35 $107,073 104 $100,942 8 $69,479 11 $93,231 0 $0 FILES CLOSED FOR INCOMPLETENESS 8 $123,626 25 $102,299 27 $112,827 3 $66,620 4 $67,458 0 $0
Aggregated Statistics For Year 2007(Based on 5 full tracts) A) FHA, FSA/RHS & VA B) Conventional C) Refinancings D) Home Improvement Loans F) Non-occupant Loans on G) Loans On Manufactured Number Average Value Number Average Value Number Average Value Number Average Value Number Average Value Number Average Value
LOANS ORIGINATED 30 $127,103 554 $93,839 382 $99,831 57 $32,600 138 $82,582 1 $22,000 APPLICATIONS APPROVED, NOT ACCEPTED 3 $130,667 101 $90,528 141 $101,333 14 $26,427 25 $86,879 2 $54,935 APPLICATIONS DENIED 17 $130,848 280 $99,664 634 $108,191 162 $29,553 111 $85,306 2 $71,500 APPLICATIONS WITHDRAWN 4 $136,360 97 $100,227 240 $103,715 21 $47,180 17 $100,010 0 $0 FILES CLOSED FOR INCOMPLETENESS 1 $131,590 58 $104,476 91 $103,836 5 $37,318 11 $81,965 0 $0
Aggregated Statistics For Year 2006(Based on 5 full tracts) A) FHA, FSA/RHS & VA B) Conventional C) Refinancings D) Home Improvement Loans F) Non-occupant Loans on G) Loans On Manufactured Number Average Value Number Average Value Number Average Value Number Average Value Number Average Value Number Average Value
LOANS ORIGINATED 49 $128,223 1,133 $81,977 415 $97,892 67 $36,524 156 $80,333 1 $25,000 APPLICATIONS APPROVED, NOT ACCEPTED 4 $108,935 304 $83,738 162 $99,014 24 $34,070 55 $77,481 4 $42,348 APPLICATIONS DENIED 14 $147,135 484 $85,634 682 $105,096 140 $33,085 87 $94,996 0 $0 APPLICATIONS WITHDRAWN 13 $120,107 258 $92,130 390 $108,147 19 $53,100 45 $86,665 0 $0 FILES CLOSED FOR INCOMPLETENESS 1 $118,820 74 $91,132 122 $104,456 0 $0 8 $79,620 0 $0
Aggregated Statistics For Year 2005(Based on 5 full tracts) A) FHA, FSA/RHS & VA B) Conventional C) Refinancings D) Home Improvement Loans F) Non-occupant Loans on G) Loans On Manufactured Number Average Value Number Average Value Number Average Value Number Average Value Number Average Value Number Average Value
LOANS ORIGINATED 44 $127,438 1,306 $80,960 640 $93,102 69 $74,632 151 $81,049 0 $0 APPLICATIONS APPROVED, NOT ACCEPTED 5 $135,170 329 $76,158 146 $97,180 14 $43,610 33 $83,679 2 $42,000 APPLICATIONS DENIED 8 $128,658 618 $87,385 957 $99,069 168 $35,494 98 $74,357 4 $37,785 APPLICATIONS WITHDRAWN 7 $120,394 290 $92,496 419 $113,177 69 $175,646 48 $94,797 0 $0 FILES CLOSED FOR INCOMPLETENESS 0 $0 78 $96,508 326 $111,142 2 $67,620 5 $90,946 0 $0
Aggregated Statistics For Year 2004(Based on 5 full tracts) A) FHA, FSA/RHS & VA B) Conventional C) Refinancings D) Home Improvement Loans E) Loans on Dwellings For 5+ Families F) Non-occupant Loans on G) Loans On Manufactured Number Average Value Number Average Value Number Average Value Number Average Value Number Average Value Number Average Value Number Average Value
LOANS ORIGINATED 64 $123,315 1,128 $89,627 935 $86,281 66 $53,841 0 $0 117 $81,022 1 $84,450 APPLICATIONS APPROVED, NOT ACCEPTED 5 $117,120 354 $86,234 241 $91,193 26 $34,758 0 $0 24 $93,436 2 $14,000 APPLICATIONS DENIED 20 $141,256 449 $93,077 957 $95,320 133 $37,168 0 $0 51 $82,680 7 $29,424 APPLICATIONS WITHDRAWN 13 $118,064 207 $95,914 444 $94,072 22 $50,065 1 $92,000 15 $108,179 0 $0 FILES CLOSED FOR INCOMPLETENESS 3 $132,293 54 $104,745 339 $100,216 6 $57,500 0 $0 7 $103,663 0 $0
Aggregated Statistics For Year 2003(Based on 5 full tracts) A) FHA, FSA/RHS & VA B) Conventional C) Refinancings D) Home Improvement Loans F) Non-occupant Loans on Number Average Value Number Average Value Number Average Value Number Average Value Number Average Value
LOANS ORIGINATED 164 $120,292 1,103 $94,882 1,495 $82,825 49 $25,626 97 $73,009 APPLICATIONS APPROVED, NOT ACCEPTED 5 $122,372 203 $94,037 304 $81,145 25 $39,791 27 $88,173 APPLICATIONS DENIED 44 $121,057 322 $90,887 1,295 $86,264 117 $28,028 54 $75,620 APPLICATIONS WITHDRAWN 49 $125,159 265 $101,370 468 $88,190 9 $17,840 14 $83,559 FILES CLOSED FOR INCOMPLETENESS 13 $127,466 126 $100,639 122 $84,752 5 $47,020 7 $70,431
Aggregated Statistics For Year 1999(Based on 3 full tracts) A) FHA, FSA/RHS & VA B) Conventional C) Refinancings D) Home Improvement Loans F) Non-occupant Loans on Number Average Value Number Average Value Number Average Value Number Average Value Number Average Value
LOANS ORIGINATED 218 $88,017 578 $75,090 356 $64,817 71 $17,805 48 $54,111 APPLICATIONS APPROVED, NOT ACCEPTED 13 $77,904 87 $69,420 83 $65,307 35 $110,239 12 $76,904 APPLICATIONS DENIED 30 $100,366 183 $70,802 185 $60,114 99 $12,133 21 $63,962 APPLICATIONS WITHDRAWN 12 $89,271 81 $86,420 118 $65,477 11 $13,000 3 $37,360 FILES CLOSED FOR INCOMPLETENESS 4 $100,802 37 $78,039 97 $72,672 2 $13,050 2 $62,110
Detailed HMDA statistics for the following Tracts:
4540.00
, 4541.00 , 4542.00 , 6725.00 , 6726.00
Private Mortgage Insurance Companies Aggregated Statistics For Year 2009(Based on 5 full tracts) A) Conventional B) Refinancings C) Non-occupant Loans on Number Average Value Number Average Value Number Average Value
LOANS ORIGINATED 15 $116,367 10 $139,855 0 $0 APPLICATIONS APPROVED, NOT ACCEPTED 11 $108,354 12 $111,872 2 $81,495 APPLICATIONS DENIED 4 $98,478 1 $114,890 0 $0 APPLICATIONS WITHDRAWN 1 $80,520 0 $0 0 $0 FILES CLOSED FOR INCOMPLETENESS 0 $0 0 $0 0 $0
Aggregated Statistics For Year 2008(Based on 5 full tracts) A) Conventional B) Refinancings C) Non-occupant Loans on Number Average Value Number Average Value Number Average Value
LOANS ORIGINATED 129 $104,408 28 $113,691 29 $83,577 APPLICATIONS APPROVED, NOT ACCEPTED 45 $108,808 20 $122,460 11 $81,870 APPLICATIONS DENIED 16 $119,478 5 $112,304 9 $102,991 APPLICATIONS WITHDRAWN 7 $123,000 0 $0 0 $0 FILES CLOSED FOR INCOMPLETENESS 7 $112,759 0 $0 1 $103,110
Aggregated Statistics For Year 2007(Based on 5 full tracts) A) Conventional B) Refinancings C) Non-occupant Loans on Number Average Value Number Average Value Number Average Value
LOANS ORIGINATED 230 $116,144 58 $124,238 38 $90,769 APPLICATIONS APPROVED, NOT ACCEPTED 39 $117,720 23 $121,960 6 $95,663 APPLICATIONS DENIED 5 $115,638 8 $129,792 5 $112,174 APPLICATIONS WITHDRAWN 9 $108,917 6 $136,932 4 $88,250 FILES CLOSED FOR INCOMPLETENESS 3 $107,673 1 $112,000 1 $86,000
Aggregated Statistics For Year 2006(Based on 5 full tracts) A) Conventional B) Refinancings C) Non-occupant Loans on Number Average Value Number Average Value Number Average Value
LOANS ORIGINATED 113 $117,062 21 $125,156 13 $111,148 APPLICATIONS APPROVED, NOT ACCEPTED 26 $113,341 10 $123,416 1 $37,320 APPLICATIONS DENIED 2 $98,725 0 $0 0 $0 APPLICATIONS WITHDRAWN 8 $117,020 3 $119,400 0 $0 FILES CLOSED FOR INCOMPLETENESS 0 $0 0 $0 0 $0
Aggregated Statistics For Year 2005(Based on 5 full tracts) A) Conventional B) Refinancings C) Non-occupant Loans on Number Average Value Number Average Value Number Average Value
LOANS ORIGINATED 153 $113,336 34 $114,541 8 $100,532 APPLICATIONS APPROVED, NOT ACCEPTED 24 $106,234 19 $124,462 6 $104,598 APPLICATIONS DENIED 0 $0 0 $0 0 $0 APPLICATIONS WITHDRAWN 10 $105,477 3 $124,600 3 $113,133 FILES CLOSED FOR INCOMPLETENESS 2 $126,185 0 $0 0 $0
Aggregated Statistics For Year 2004(Based on 5 full tracts) A) Conventional B) Refinancings C) Non-occupant Loans on Number Average Value Number Average Value Number Average Value
LOANS ORIGINATED 214 $117,253 51 $107,575 17 $102,853 APPLICATIONS APPROVED, NOT ACCEPTED 52 $118,783 27 $113,126 4 $95,498 APPLICATIONS DENIED 7 $117,764 2 $76,595 2 $111,895 APPLICATIONS WITHDRAWN 18 $120,168 5 $95,666 3 $108,457 FILES CLOSED FOR INCOMPLETENESS 2 $113,965 0 $0 1 $115,000
Aggregated Statistics For Year 2003(Based on 5 full tracts) A) Conventional B) Refinancings C) Non-occupant Loans on Number Average Value Number Average Value Number Average Value
LOANS ORIGINATED 283 $112,814 113 $112,766 3 $69,010 APPLICATIONS APPROVED, NOT ACCEPTED 55 $115,056 46 $118,236 2 $94,335 APPLICATIONS DENIED 6 $117,337 2 $103,500 1 $79,000 APPLICATIONS WITHDRAWN 16 $114,496 9 $102,850 2 $115,230 FILES CLOSED FOR INCOMPLETENESS 3 $106,757 2 $131,420 0 $0
Aggregated Statistics For Year 1999(Based on 3 full tracts) A) Conventional B) Refinancings C) Non-occupant Loans on Number Average Value Number Average Value Number Average Value
LOANS ORIGINATED 222 $83,233 63 $78,600 7 $53,539 APPLICATIONS APPROVED, NOT ACCEPTED 15 $80,045 12 $72,806 0 $0 APPLICATIONS DENIED 25 $86,724 4 $95,545 0 $0 APPLICATIONS WITHDRAWN 9 $63,762 1 $66,060 1 $50,280 FILES CLOSED FOR INCOMPLETENESS 4 $57,162 2 $83,485 0 $0
Detailed PMIC statistics for the following Tracts:
4540.00
, 4541.00 , 4542.00 , 6725.00 , 6726.00 Mission Bend compared to Texas state average:
Unemployed percentage significantly below state average. Black race population percentage significantly above state average. Foreign-born population percentage significantly above state average. Renting percentage below state average. Length of stay since moving in significantly above state average. Mission Bend on our top lists :
#27 on the list of "Top 101 cities with the smallest racial income disparities between White and Black householders (with at least 200 householders)"
#28 on the list of "Top 101 cities with the most residents born in Nigeria (population 500+)"
#70 on the list of "Top 101 cities with the most residents born in Western Africa (population 500+)"
#90 on the list of "Top 101 cities with the least people driving a car to work alone (population 5,000+)"
#82 (77083) on the list of "Top 101 zip codes with the largest percentage of Subsaharan African first ancestries"
#13 on the list of "Top 101 counties with the largest number of children under 18 without health insurance coverage in 2000 (pop. 50,000+)"
#17 on the list of "Top 101 counties with the lowest percentage of residents that smoked 100+ cigarettes in their lives"
#32 on the list of "Top 101 counties with the highest percentage of residents that drank alcohol in the past 30 days"
#41 on the list of "Top 101 counties with the lowest number of deaths per 1000 residents 2007-2013"
#42 on the list of "Top 101 counties with the largest number of people moving in compared to moving out (pop. 50,000+)"


 Recent articles from our blog. Our writers, many of them Ph.D. graduates or candidates, create easy-to-read articles on a wide variety of topics.

 (7.1 miles