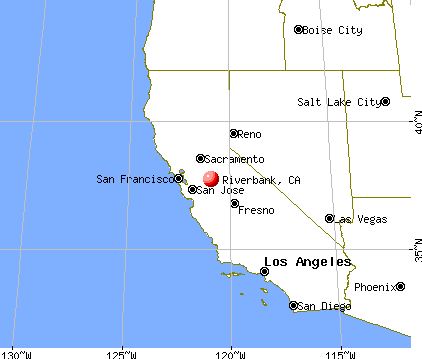
Riverbank, California

Riverbank: Sirenita and her first baby girl...Pearl...2013
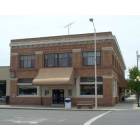
Riverbank: Chamber of Commerce Office (former Delta Bank Building)
- add
your
Submit your own pictures of this city and show them to the world
- OSM Map
- General Map
- Google Map
- MSN Map
Population change since 2000: +56.9%
| Males: 12,197 | |
| Females: 12,629 |
| Median resident age: | 33.9 years |
| California median age: | 37.9 years |
Zip codes: 95367.
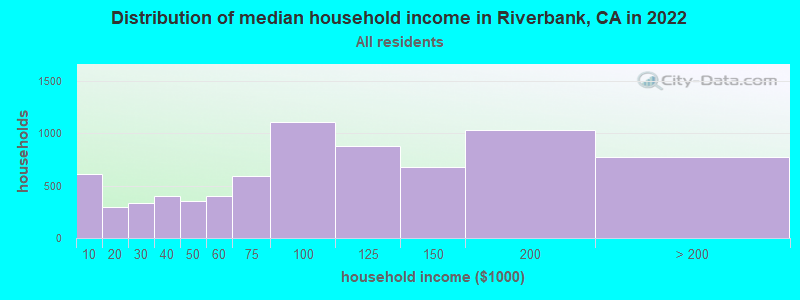
| Riverbank: | $90,716 |
| CA: | $91,551 |
Estimated per capita income in 2022: $33,517 (it was $14,972 in 2000)
Riverbank city income, earnings, and wages data
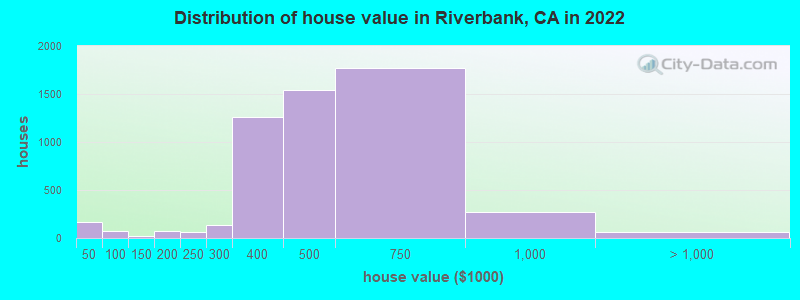
Estimated median house or condo value in 2022: $471,327 (it was $115,000 in 2000)
| Riverbank: | $471,327 |
| CA: | $715,900 |
Mean prices in 2022: all housing units: $370,110; detached houses: $377,139; townhouses or other attached units: $301,123; mobile homes: $70,649
Median gross rent in 2022: $1,429.
(10.4% for White Non-Hispanic residents, 14.2% for Black residents, 16.3% for Hispanic or Latino residents, 3.6% for American Indian residents, 16.9% for other race residents, 16.1% for two or more races residents)
Detailed information about poverty and poor residents in Riverbank, CA

Compare current foreclosures in Riverbank, CA:
| Photo | Address | Area | Beds / Baths | Price | Details |
|---|---|---|---|---|---|

|
#1
Lenay Way
Riverbank, CA 95367
|
1,773 sq. feet
|
2 baths 3 beds |
show details | |

|
#2
Corgi Way
Riverbank, CA 95367
|
2,110 sq. feet
|
3 baths 4 beds |
show details | |

|
#3
Van Dusen Ave
Riverbank, CA 95367
|
1,507 sq. feet
|
2 baths 3 beds |
show details | |

|
#4
Arizona Ave
Riverbank, CA 95367
|
1,290 sq. feet
|
2 baths 3 beds |
show details | |

|
#5
Dunbar Ln
Riverbank, CA 95367
|
1,377 sq. feet
|
2 baths 3 beds |
show details | |

|
#6
Allegiance Ln
Riverbank, CA 95367
|
2,476 sq. feet
|
3 baths 5 beds |
show details | |

|
#7
Secretariat Ct
Riverbank, CA 95367
|
1,174 sq. feet
|
2 baths 3 beds |
show details | |

|
#8
Clock Tower Ct
Riverbank, CA 95367
|
2,647 sq. feet
|
3 baths 5 beds |
show details | |

|
#9
Colony Manor Dr
Riverbank, CA 95367
|
2,340 sq. feet
|
2 baths 4 beds |
show details | |

|
#10
Dunbar Ln
Riverbank, CA 95367
|
2,213 sq. feet
|
2 baths 4 beds |
show details |
| Photo | Address | Area | Beds / Baths | Price | Details |
|---|---|---|---|---|---|

|
#11
Stanislaus St
Riverbank, CA 95367
|
1,320 sq. feet
|
2 baths 3 beds |
show details | |

|
#12
Saxon Way
Riverbank, CA 95367
|
3,205 sq. feet
|
3 baths 5 beds |
show details | |

|
#13
Kansas Ave
Riverbank, CA 95367
|
1,326 sq. feet
|
3 baths 6 beds |
show details | |

|
#14
Carnwood Dr
Riverbank, CA 95367
|
1,259 sq. feet
|
2 baths 3 beds |
show details | |

|
#15
Topeka St
Riverbank, CA 95367
|
940 sq. feet
|
1 baths 2 beds |
show details | |

|
#16
Clydesdale Ln
Riverbank, CA 95367
|
1,755 sq. feet
|
2 baths 3 beds |
show details | |

|
#17
Kentucky Ave
Riverbank, CA 95367
|
840 sq. feet
|
1 baths 2 beds |
show details | |

|
#18
River Cove Dr
Riverbank, CA 95367
|
1,377 sq. feet
|
2 baths 3 beds |
show details | |

|
#19
Hull Ct
Riverbank, CA 95367
|
2,038 sq. feet
|
2 baths 4 beds |
show details | |

|
#20
Bordona Dr
Riverbank, CA 95367
|
1,143 sq. feet
|
2 baths 3 beds |
show details |
| Photo | Address | Area | Beds / Baths | Price | Details |
|---|---|---|---|---|---|

|
#21
Turpin Ave
Riverbank, CA 95367
|
1,100 sq. feet
|
2 baths 3 beds |
show details | |

|
#22
Estelle Ave
Riverbank, CA 95367
|
1,828 sq. feet
|
2 baths 3 beds |
show details | |

|
#23
Santa Fe St
Riverbank, CA 95367
|
864 sq. feet
|
1 baths 3 beds |
show details | |

|
#24
Preakness Dr
Riverbank, CA 95367
|
1,086 sq. feet
|
2 baths 3 beds |
show details | |

|
#25
Nickels Ct
Riverbank, CA 95367
|
1,314 sq. feet
|
2 baths 3 beds |
show details | |

|
#26
Stretch Dr
Riverbank, CA 95367
|
- sq. feet
|
4 baths 6 beds |
show details | |

|
#27
Kentucky Ave
Riverbank, CA 95367
|
- sq. feet
|
- baths - beds |
show details | |

|
#28
Stanislaus St Apt A
Riverbank, CA 95367
|
- sq. feet
|
- baths - beds |
show details | |

|
#29
Riverside Dr
Riverbank, CA 95367
|
- sq. feet
|
- baths - beds |
show details | |

|
#30
Newbrook Cir Spc 138
Riverbank, CA 95367
|
- sq. feet
|
- baths - beds |
show details |
| Photo | Address | Area | Beds / Baths | Price | Details |
|---|---|---|---|---|---|

|
#31
California Ave
Riverbank, CA 95367
|
- sq. feet
|
- baths - beds |
show details | |

|
Check over 1 million property listings on Foreclosure.com!
|
browse all offers | |||


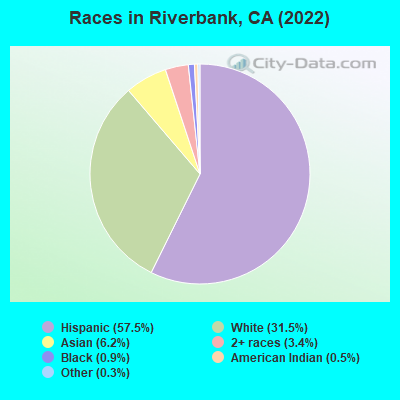
- 14,23757.5%Hispanic
- 7,79531.5%White alone
- 1,5366.2%Asian alone
- 8463.4%Two or more races
- 2340.9%Black alone
- 1220.5%American Indian alone
- 660.3%Other race alone
- 240.10%Native Hawaiian and Other
Pacific Islander alone
According to our research of California and other state lists, there were 30 registered sex offenders living in Riverbank, California as of June 16, 2024.
The ratio of all residents to sex offenders in Riverbank is 808 to 1.
The ratio of registered sex offenders to all residents in this city is near the state average.
Type |
2009 |
2010 |
2011 |
2012 |
2013 |
2014 |
2015 |
2016 |
2017 |
2018 |
2019 |
2020 |
2022 |
|---|---|---|---|---|---|---|---|---|---|---|---|---|---|
| Murders (per 100,000) | 3 (14.1) | 1 (4.4) | 0 (0.0) | 0 (0.0) | 0 (0.0) | 1 (4.2) | 1 (4.2) | 1 (4.1) | 0 (0.0) | 0 (0.0) | 1 (4.0) | 0 (0.0) | 1 (4.0) |
| Rapes (per 100,000) | 1 (4.7) | 1 (4.4) | 2 (8.7) | 5 (21.7) | 1 (4.3) | 1 (4.2) | 3 (12.5) | 3 (12.3) | 1 (4.1) | 0 (0.0) | 3 (12.0) | 1 (4.0) | 2 (8.1) |
| Robberies (per 100,000) | 11 (51.8) | 9 (39.7) | 14 (61.0) | 19 (82.4) | 13 (55.4) | 9 (38.0) | 16 (66.5) | 26 (106.6) | 21 (85.1) | 13 (51.9) | 7 (27.9) | 5 (19.9) | 21 (84.6) |
| Assaults (per 100,000) | 42 (197.9) | 25 (110.2) | 46 (200.5) | 33 (143.0) | 23 (98.0) | 17 (71.8) | 15 (62.3) | 25 (102.5) | 18 (73.0) | 11 (43.9) | 13 (51.9) | 22 (87.6) | 26 (104.7) |
| Burglaries (per 100,000) | 172 (810.3) | 218 (961.3) | 244 (1,063) | 252 (1,092) | 208 (886.1) | 216 (911.8) | 130 (540.3) | 83 (340.1) | 73 (295.9) | 67 (267.6) | 49 (195.6) | 41 (163.2) | 56 (225.5) |
| Thefts (per 100,000) | 332 (1,564) | 348 (1,535) | 288 (1,255) | 389 (1,686) | 400 (1,704) | 406 (1,714) | 443 (1,841) | 437 (1,791) | 431 (1,747) | 326 (1,302) | 273 (1,090) | 224 (891.4) | 268 (1,079) |
| Auto thefts (per 100,000) | 73 (343.9) | 78 (343.9) | 78 (339.9) | 120 (520.2) | 77 (328.0) | 66 (278.6) | 43 (178.7) | 95 (389.3) | 58 (235.1) | 54 (215.7) | 53 (211.6) | 34 (135.3) | 32 (128.9) |
| Arson (per 100,000) | 4 (18.8) | 4 (17.6) | 2 (8.7) | 1 (4.3) | 1 (4.3) | 0 (0.0) | 0 (0.0) | 1 (4.1) | 2 (8.1) | 0 (0.0) | 3 (12.0) | 1 (4.0) | 4 (16.1) |
| City-Data.com crime index | 234.0 | 202.5 | 217.2 | 256.2 | 196.0 | 192.2 | 176.5 | 197.1 | 152.8 | 112.4 | 110.6 | 84.6 | 130.1 |
The City-Data.com crime index weighs serious crimes and violent crimes more heavily. Higher means more crime, U.S. average is 246.1. It adjusts for the number of visitors and daily workers commuting into cities.
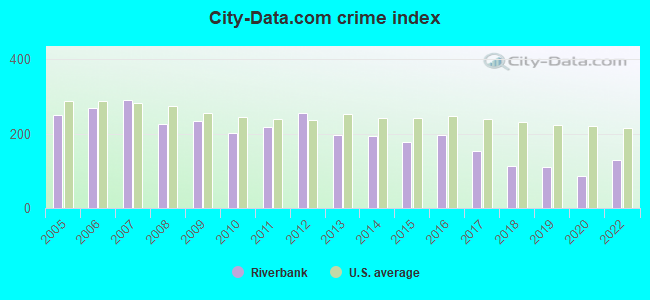
Crime rate in Riverbank detailed stats: murders, rapes, robberies, assaults, burglaries, thefts, arson
Full-time law enforcement employees in 2015, including police officers: 1 (1 officers - 1 male; 0 female).
| Officers per 1,000 residents here: | 0.04 |
| California average: | 1.98 |
 Recent articles from our blog. Our writers, many of them Ph.D. graduates or candidates, create easy-to-read articles on a wide variety of topics.

 | Denver to Modesto area (39 replies) |
| How would you rank these Central Valley cities (24 replies) |
| Stockton, Modesto - dangerous? (14 replies) |
| Moving to Modesto, CA from Bakersfield, CA (12 replies) |
| Modesto and surrounding burbs - best areas to consider (6 replies) |
| Possibly moving to Modesto, need advice! (26 replies) |
Latest news from Riverbank, CA collected exclusively by city-data.com from local newspapers, TV, and radio stations
Ancestries: American (8.9%), German (2.7%), Italian (1.9%), Portuguese (1.7%), English (1.4%), Irish (1.1%).
Current Local Time: PST time zone
Elevation: 140 feet
Land area: 3.11 square miles.
Population density: 7,987 people per square mile (high).
5,424 residents are foreign born (16.7% Latin America, 4.6% Asia).
| This city: | 21.9% |
| California: | 26.5% |
Median real estate property taxes paid for housing units with mortgages in 2022: $3,687 (0.8%)
Median real estate property taxes paid for housing units with no mortgage in 2022: $3,829 (0.9%)
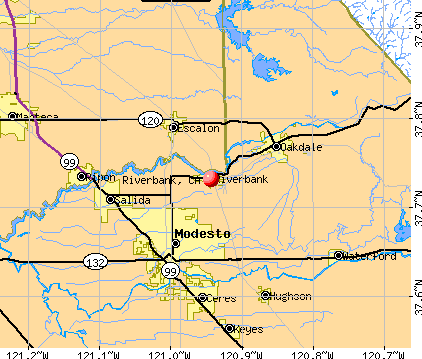
Nearest city with pop. 50,000+: Modesto, CA  (5.6 miles , pop. 188,856).
Nearest city with pop. 200,000+: Stockton, CA (25.8 miles , pop. 243,771).
Nearest city with pop. 1,000,000+: Los Angeles, CA (290.2 miles , pop. 3,694,820).
Nearest cities:
), ), ), )Latitude: 37.73 N, Longitude: 120.94 W
Daytime population change due to commuting: -6,054 (-24.4%)
Workers who live and work in this city: 1,800 (16.7%)
Area code: 209

Riverbank, California accommodation & food services, waste management - Economy and Business Data
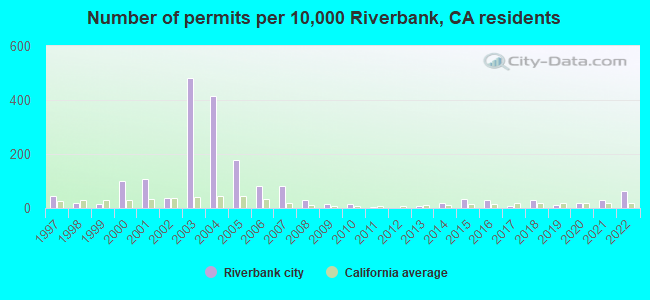
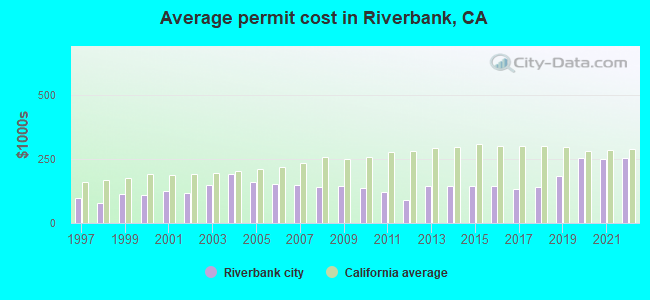
Single-family new house construction building permits:
- 2022: 99 buildings, average cost: $254,800
- 2021: 49 buildings, average cost: $251,700
- 2020: 30 buildings, average cost: $255,500
- 2019: 16 buildings, average cost: $184,200
- 2018: 47 buildings, average cost: $140,900
- 2017: 13 buildings, average cost: $132,900
- 2016: 47 buildings, average cost: $145,200
- 2015: 53 buildings, average cost: $143,200
- 2014: 32 buildings, average cost: $146,300
- 2013: 11 buildings, average cost: $145,400
- 2012: 1 building, cost: $89,600
- 2011: 5 buildings, average cost: $123,200
- 2010: 20 buildings, average cost: $136,800
- 2009: 21 buildings, average cost: $144,300
- 2008: 46 buildings, average cost: $141,400
- 2007: 129 buildings, average cost: $150,300
- 2006: 129 buildings, average cost: $150,900
- 2005: 280 buildings, average cost: $159,000
- 2004: 653 buildings, average cost: $190,600
- 2003: 762 buildings, average cost: $147,000
- 2002: 58 buildings, average cost: $116,200
- 2001: 167 buildings, average cost: $123,500
- 2000: 157 buildings, average cost: $109,900
- 1999: 26 buildings, average cost: $113,400
- 1998: 30 buildings, average cost: $79,600
- 1997: 72 buildings, average cost: $96,500
| Here: | 6.9% |
| California: | 5.1% |
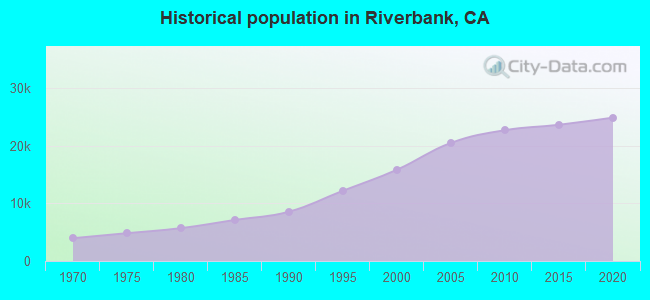
Population change in the 1990s: +6,628 (+72.1%).
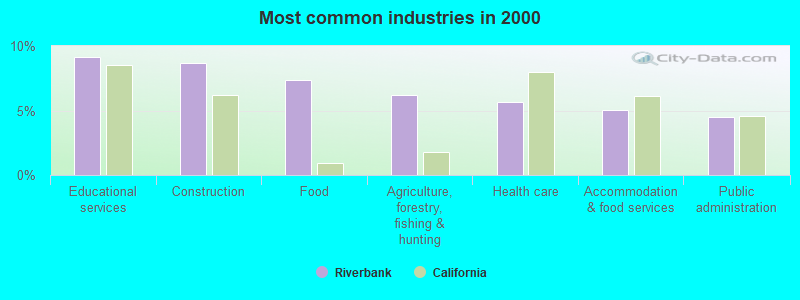
- Educational services (9.1%)
- Construction (8.7%)
- Food (7.3%)
- Agriculture, forestry, fishing & hunting (6.2%)
- Health care (5.7%)
- Accommodation & food services (5.0%)
- Public administration (4.5%)
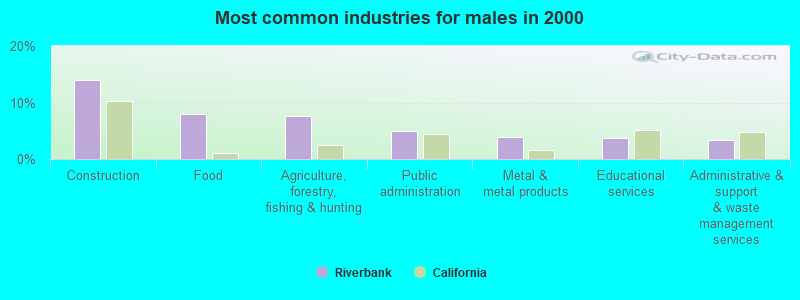
- Construction (14.0%)
- Food (7.9%)
- Agriculture, forestry, fishing & hunting (7.6%)
- Public administration (4.9%)
- Metal & metal products (3.9%)
- Educational services (3.8%)
- Administrative & support & waste management services (3.4%)
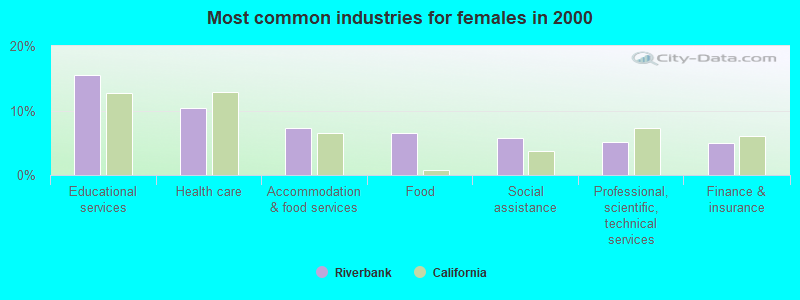
- Educational services (15.6%)
- Health care (10.4%)
- Accommodation & food services (7.3%)
- Food (6.6%)
- Social assistance (5.8%)
- Professional, scientific, technical services (5.1%)
- Finance & insurance (4.9%)
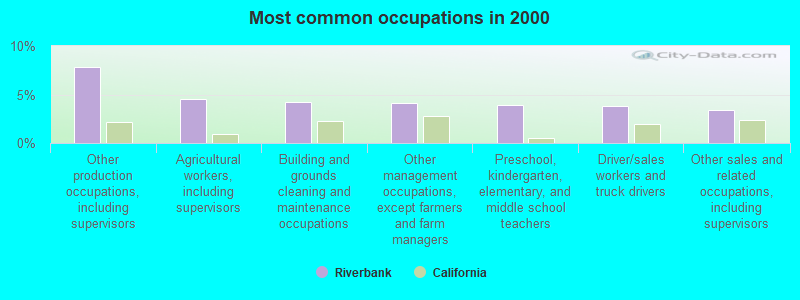
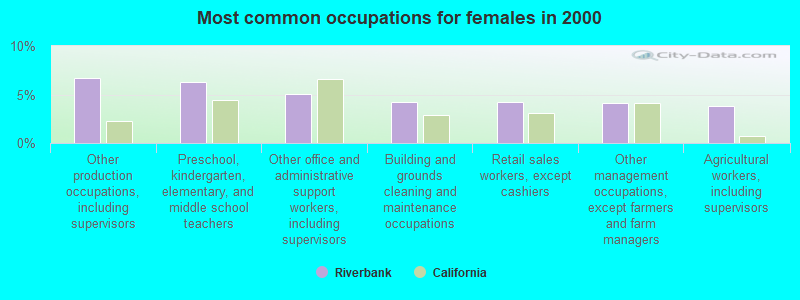
- Other production occupations, including supervisors (7.9%)
- Agricultural workers, including supervisors (4.5%)
- Building and grounds cleaning and maintenance occupations (4.2%)
- Other management occupations, except farmers and farm managers (4.1%)
- Preschool, kindergarten, elementary, and middle school teachers (3.9%)
- Driver/sales workers and truck drivers (3.8%)
- Other sales and related occupations, including supervisors (3.4%)
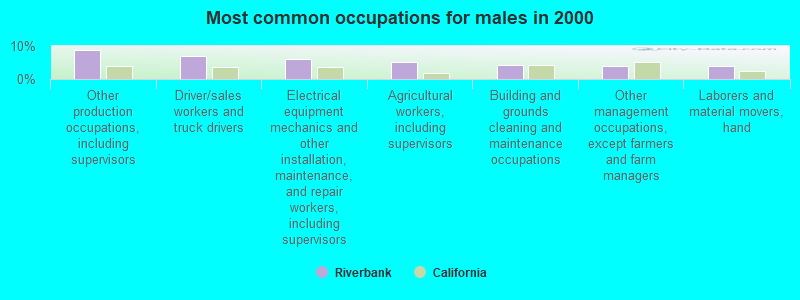
- Other production occupations, including supervisors (8.8%)
- Driver/sales workers and truck drivers (7.0%)
- Electrical equipment mechanics and other installation, maintenance, and repair workers, including supervisors (6.0%)
- Agricultural workers, including supervisors (5.1%)
- Building and grounds cleaning and maintenance occupations (4.2%)
- Other management occupations, except farmers and farm managers (4.0%)
- Laborers and material movers, hand (4.0%)
- Other production occupations, including supervisors (6.7%)
- Preschool, kindergarten, elementary, and middle school teachers (6.3%)
- Other office and administrative support workers, including supervisors (5.1%)
- Building and grounds cleaning and maintenance occupations (4.3%)
- Retail sales workers, except cashiers (4.2%)
- Other management occupations, except farmers and farm managers (4.1%)
- Agricultural workers, including supervisors (3.8%)
Average climate in Riverbank, California
Based on data reported by over 4,000 weather stations


|
|


(lower is better)
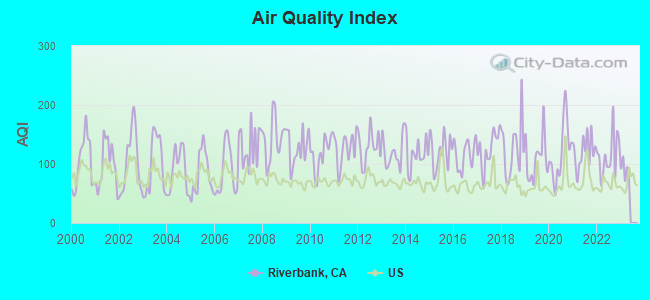
Air Quality Index (AQI) level in 2022 was 114. This is significantly worse than average.
| City: | 114 |
| U.S.: | 73 |
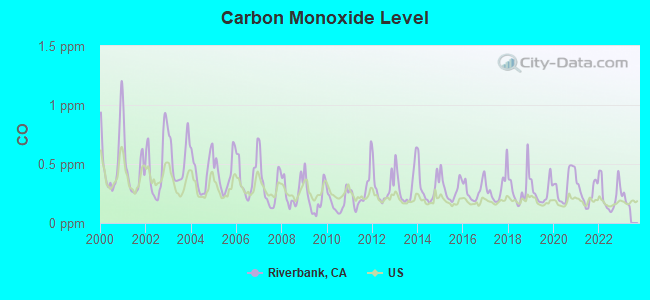
Carbon Monoxide (CO) [ppm] level in 2022 was 0.237. This is about average. Closest monitor was 6.8 miles away from the city center.
| City: | 0.237 |
| U.S.: | 0.251 |
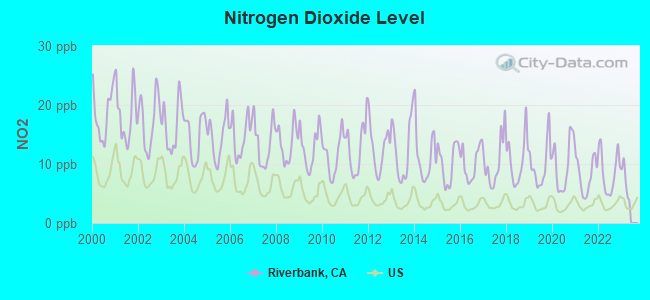
Nitrogen Dioxide (NO2) [ppb] level in 2022 was 8.63. This is significantly worse than average. Closest monitor was 6.8 miles away from the city center.
| City: | 8.63 |
| U.S.: | 5.11 |
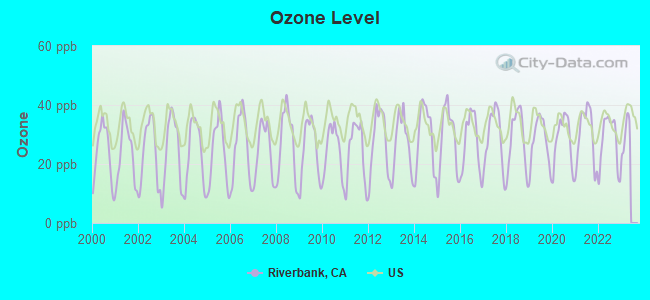
Ozone [ppb] level in 2022 was 27.7. This is better than average. Closest monitor was 6.8 miles away from the city center.
| City: | 27.7 |
| U.S.: | 33.3 |

Particulate Matter (PM10) [µg/m3] level in 2022 was 31.1. This is significantly worse than average. Closest monitor was 6.4 miles away from the city center.
| City: | 31.1 |
| U.S.: | 19.2 |
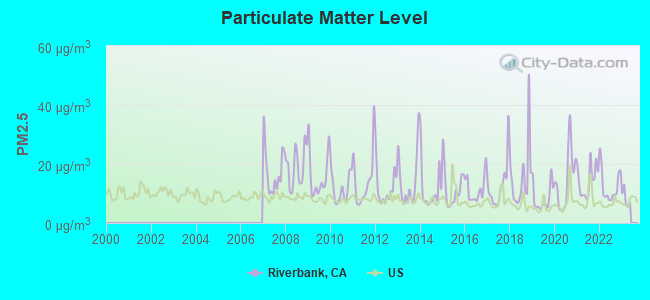
Particulate Matter (PM2.5) [µg/m3] level in 2022 was 12.6. This is significantly worse than average. Closest monitor was 6.8 miles away from the city center.
| City: | 12.6 |
| U.S.: | 8.1 |
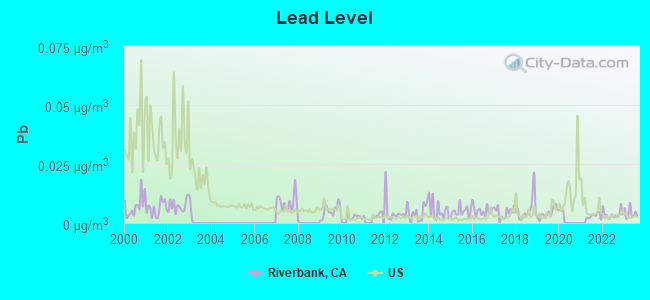
Lead (Pb) [µg/m3] level in 2023 was 0.00414. This is significantly better than average. Closest monitor was 6.4 miles away from the city center.
| City: | 0.00414 |
| U.S.: | 0.00931 |
Earthquake activity:
Riverbank-area historical earthquake activity is significantly above California state average. It is 8121% greater than the overall U.S. average.On 4/18/1906 at 13:12:21, a magnitude 7.9 (7.9 UK, Class: Major, Intensity: VIII - XII) earthquake occurred 113.8 miles away from the city center, causing $524,000,000 total damage
On 10/18/1989 at 00:04:15, a magnitude 7.1 (6.5 MB, 7.1 MS, 6.9 MW, 7.0 ML) earthquake occurred 62.5 miles away from the city center, causing 62 deaths (62 shaking deaths) and 3757 injuries, causing $1,305,032,704 total damage
On 7/21/1952 at 11:52:14, a magnitude 7.7 (7.7 UK) earthquake occurred 217.7 miles away from the city center, causing $50,000,000 total damage
On 11/4/1927 at 13:51:53, a magnitude 7.5 (7.5 UK) earthquake occurred 194.9 miles away from the city center
On 12/21/1932 at 06:10:09, a magnitude 7.2 (7.2 UK) earthquake occurred 164.7 miles away from the city center
On 10/3/1915 at 06:52:48, a magnitude 7.6 (7.6 UK) earthquake occurred 266.1 miles away from Riverbank center
Magnitude types: body-wave magnitude (MB), local magnitude (ML), surface-wave magnitude (MS), moment magnitude (MW)
Natural disasters:
The number of natural disasters in Stanislaus County (13) is near the US average (15).Major Disasters (Presidential) Declared: 8
Emergencies Declared: 2
Causes of natural disasters: Floods: 8, Storms: 4, Winter Storms: 3, Landslides: 2, Mudslides: 2, Drought: 1, Fire: 1, Freeze: 1, Heavy Rain: 1, Hurricane: 1, Tornado: 1, Other: 1 (Note: some incidents may be assigned to more than one category).

Hospitals and medical centers in Riverbank:
Other hospitals and medical centers near Riverbank:
- SATELLITE DIALYSIS MODESTO (Dialysis Facility, about 4 miles away; MODESTO, CA)
- EDSON CONVALESCENT HOSPITAL (Nursing Home, about 5 miles away; MODESTO, CA)
- CRESTWOOD MANOR - 112 (Nursing Home, about 5 miles away; MODESTO, CA)
- VNA OF THE CENTRAL VALLEY (Home Health Center, about 5 miles away; MODESTO, CA)
- HY-LOND HEALTH CARE CENTER - MODESTO (Nursing Home, about 5 miles away; MODESTO, CA)
- STANISLAUS SURGICAL HOSPITAL Acute Care Hospitals (about 5 miles away; MODESTO, CA)
- MEMORIAL MEDICAL CENTER Acute Care Hospitals (about 5 miles away; MODESTO, CA)
Amtrak stations near Riverbank:
- 5 miles: MODESTO (1700 HELD DRIVE) . Services: ticket office, fully wheelchair accessible, enclosed waiting area, public restrooms, public payphones, vending machines, free short-term parking, free long-term parking, call for car rental service, call for taxi service, public transit connection.
- 17 miles: TURLOCK-DENAIR (DENAIR, SANTA FE ST. AT ELM ST.) . Services: fully wheelchair accessible, public payphones, vending machines, free short-term parking, free long-term parking, call for taxi service.
Colleges/universities with over 2000 students nearest to Riverbank:
- Modesto Junior College (about 7 miles; Modesto, CA; Full-time enrollment: 10,635)
- California State University-Stanislaus (about 16 miles; Turlock, CA; FT enrollment: 7,054)
- University of the Pacific (about 27 miles; Stockton, CA; FT enrollment: 4,999)
- San Joaquin Delta College (about 28 miles; Stockton, CA; FT enrollment: 12,167)
- Merced College (about 38 miles; Merced, CA; FT enrollment: 6,973)
- University of California-Merced (about 39 miles; Merced, CA; FT enrollment: 5,981)
- Las Positas College (about 48 miles; Livermore, CA; FT enrollment: 5,112)
Public high schools in Riverbank:
- RIVERBANK HIGH (Students: 515, Location: 6200 CLAUS RD., Grades: 9-12)
- ADELANTE HIGH (Location: 6801 SEVENTH ST., Grades: 10-12)
Public elementary/middle schools in Riverbank:
- CARDOZO MIDDLE (Students: 556, Location: 3525 SANTA FE ST., Grades: 6-8)
- CROSSROADS ELEMENTARY (Students: 491, Location: 5800 SAXON WAY, Grades: KG-5)
- CALIFORNIA AVENUE ELEMENTARY (Students: 380, Location: 3800 CALIFORNIA AVE., Grades: KG-5)
- RIVERBANK LANGUAGE ACADEMY (Students: 168, Location: 2400 STANISLAUS ST., Grades: KG-8, Charter school)
User-submitted facts and corrections:
- The Population in Riverbank Ca is 17,004 people.
added by Beans
Points of interest:
Notable locations in Riverbank: Riverbank City Hall (A), Stanislaus Consolidated Fire Protection District Station 36 (B). Display/hide their locations on the map
Parks in Riverbank include: California Avenue Park (1), Hutcheson Park (2). Display/hide their locations on the map
Drinking water stations with addresses in Riverbank and their reported violations in the past:
CENTURY MOBILE HOME PARK (Population served: 50, Groundwater):Past health violations:MCHENRY GOLF CENTER (Population served: 25, Groundwater):
- MCL, Average - Between JAN-2014 and MAR-2014, Contaminant: Arsenic. Follow-up actions: St BCA signed (JUL-01-2012)
- MCL, Average - Between OCT-2013 and DEC-2013, Contaminant: Arsenic. Follow-up actions: St BCA signed (JUL-01-2012)
- MCL, Average - Between JUL-2013 and SEP-2013, Contaminant: Arsenic. Follow-up actions: St BCA signed (JUL-01-2012)
- MCL, Average - Between APR-2013 and JUN-2013, Contaminant: Arsenic. Follow-up actions: St BCA signed (JUL-01-2012)
- MCL, Average - Between JAN-2013 and MAR-2013, Contaminant: Arsenic. Follow-up actions: St BCA signed (JUL-01-2012)
- MCL, Average - Between OCT-2012 and DEC-2012, Contaminant: Arsenic. Follow-up actions: St BCA signed (JUL-01-2012)
- 15 other older health violations
Past health violations:
- MCL, Monthly (TCR) - In APR-2010, Contaminant: Coliform. Follow-up actions: St Violation/Reminder Notice (APR-27-2010), St Tech Assistance Visit (APR-27-2010)
- MCL, Monthly (TCR) - In MAR-2010, Contaminant: Coliform. Follow-up actions: St Violation/Reminder Notice (MAR-12-2010), St Public Notif requested (MAR-12-2010)
- MCL, Monthly (TCR) - In JUL-2008, Contaminant: Coliform. Follow-up actions: St Violation/Reminder Notice (JUL-24-2008)
- MCL, Monthly (TCR) - In JUL-2008, Contaminant: Coliform. Follow-up actions: St Violation/Reminder Notice (JUL-24-2008)
| This city: | 3.4 people |
| California: | 2.9 people |
| This city: | 81.6% |
| Whole state: | 68.7% |
| This city: | 6.9% |
| Whole state: | 7.2% |
Likely homosexual households (counted as self-reported same-sex unmarried-partner households)
- Lesbian couples: 0.4% of all households
- Gay men: 0.2% of all households
People in group quarters in Riverbank in 2010:
- 72 people in nursing facilities/skilled-nursing facilities
- 51 people in residential treatment centers for adults
- 25 people in group homes intended for adults
- 20 people in workers' group living quarters and job corps centers
People in group quarters in Riverbank in 2000:
- 65 people in nursing homes
- 31 people in other noninstitutional group quarters
- 19 people in homes for the mentally ill
- 16 people in homes for the mentally retarded
- 4 people in religious group quarters
Banks with branches in Riverbank (2011 data):
- Delta Bank, National Association: Riverbank Branch at 2401 Patterson Road, branch established on 1977/05/02. Info updated 2007/09/06: Bank assets: $100.5 mil, Deposits: $90.4 mil, headquarters in Manteca, CA, negative income in the last year, Commercial Lending Specialization, 8 total offices, Holding Company: Delta National Bancorp
- Wells Fargo Bank, National Association: Riverbank Branch at 2213 Claribel Road, branch established on 2006/05/01. Info updated 2011/04/05: Bank assets: $1,161,490.0 mil, Deposits: $905,653.0 mil, headquarters in Sioux Falls, SD, positive income, 6395 total offices, Holding Company: Wells Fargo & Company
- Westamerica Bank: Riverbank Branch at 2251 Claribel Road, branch established on 2006/06/05. Info updated 2011/06/21: Bank assets: $4,998.1 mil, Deposits: $4,253.2 mil, headquarters in San Rafael, CA, positive income, Commercial Lending Specialization, 98 total offices, Holding Company: Westamerica Bancorporation
- JPMorgan Chase Bank, National Association: Claribel Rd And Oakdale Rd Savemart at 2237 Claribel Rd, branch established on 2010/11/02. Info updated 2011/11/10: Bank assets: $1,811,678.0 mil, Deposits: $1,190,738.0 mil, headquarters in Columbus, OH, positive income, International Specialization, 5577 total offices, Holding Company: Jpmorgan Chase & Co.
For population 15 years and over in Riverbank:
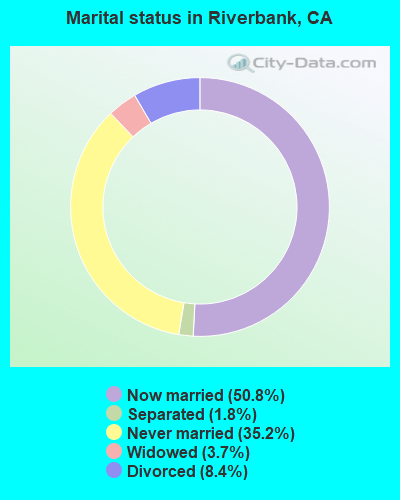
- Never married: 35.2%
- Now married: 50.8%
- Separated: 1.8%
- Widowed: 3.7%
- Divorced: 8.4%
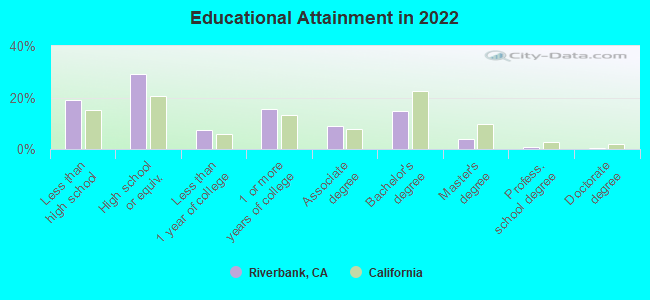
For population 25 years and over in Riverbank:
- High school or higher: 80.9%
- Bachelor's degree or higher: 18.7%
- Graduate or professional degree: 4.9%
- Unemployed: 17.1%
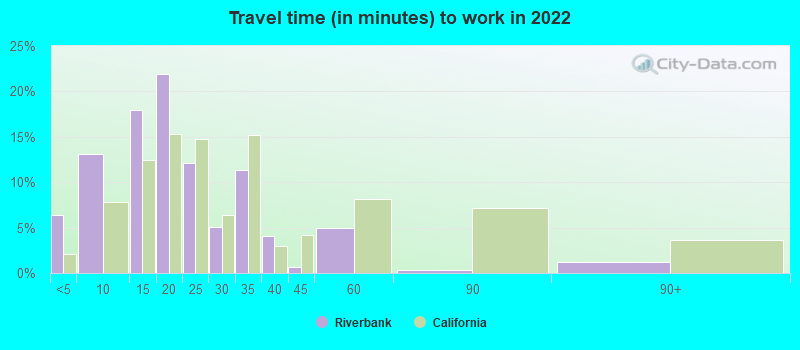
- Mean travel time to work (commute): 26.4 minutes
| Here: | 16.5 |
| California average: | 15.5 |
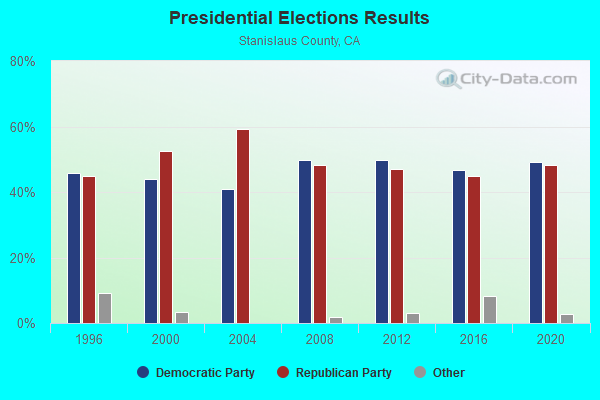
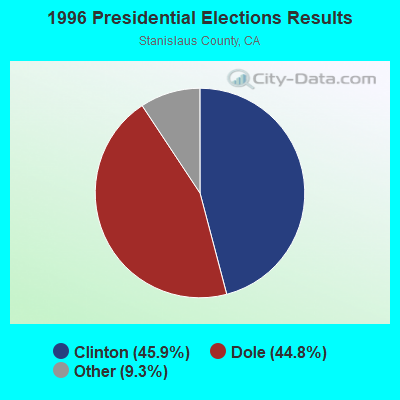
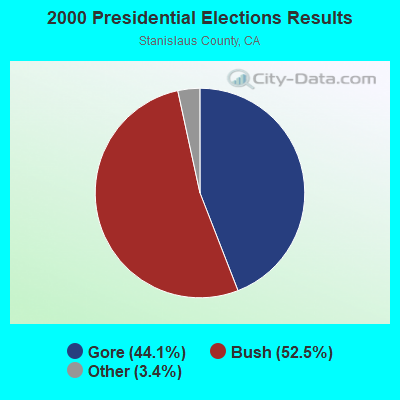
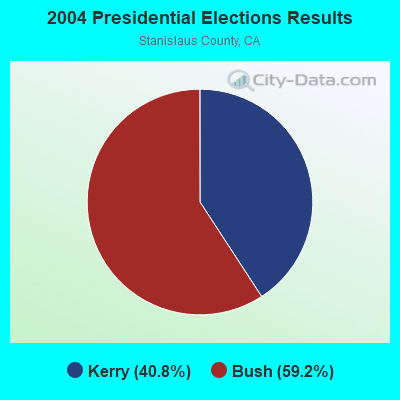
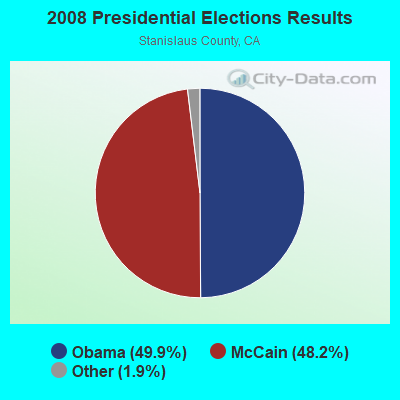
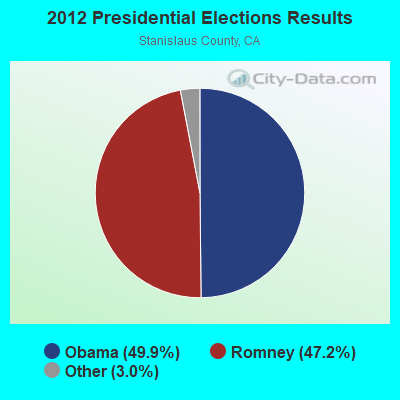

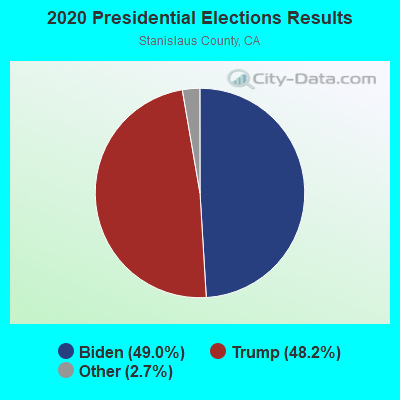
Graphs represent county-level data. Detailed 2008 Election Results
Religion statistics for Riverbank, CA (based on Stanislaus County data)
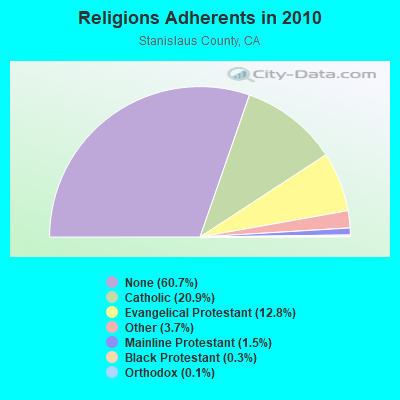
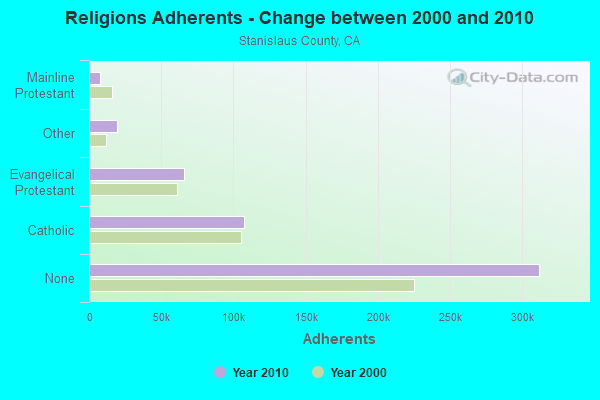
| Religion | Adherents | Congregations |
|---|---|---|
| Catholic | 107,529 | 18 |
| Evangelical Protestant | 65,976 | 268 |
| Other | 19,198 | 59 |
| Mainline Protestant | 7,730 | 34 |
| Black Protestant | 1,312 | 8 |
| Orthodox | 625 | 2 |
| None | 312,083 | - |
Food Environment Statistics:
| This county: | 2.61 / 10,000 pop. |
| State: | 2.14 / 10,000 pop. |
| Stanislaus County: | 0.04 / 10,000 pop. |
| State: | 0.04 / 10,000 pop. |
| Stanislaus County: | 0.65 / 10,000 pop. |
| California: | 0.62 / 10,000 pop. |
| Stanislaus County: | 2.22 / 10,000 pop. |
| California: | 1.49 / 10,000 pop. |
| Stanislaus County: | 5.54 / 10,000 pop. |
| California: | 7.42 / 10,000 pop. |
| Stanislaus County: | 8.9% |
| State: | 7.3% |
| Stanislaus County: | 28.0% |
| California: | 21.3% |
| Stanislaus County: | 17.1% |
| California: | 17.9% |
Health and Nutrition:
| This city: | 46.2% |
| California: | 49.4% |
| Riverbank: | 44.2% |
| California: | 48.0% |
| Riverbank: | 28.6 |
| State: | 28.1 |
| Here: | 24.0% |
| California: | 20.2% |
| Riverbank: | 10.1% |
| State: | 11.2% |
| Riverbank: | 6.7 |
| California: | 6.8 |
| Riverbank: | 31.9% |
| State: | 31.5% |
| Riverbank: | 53.6% |
| California: | 56.4% |
| Here: | 80.3% |
| California: | 80.9% |
More about Health and Nutrition of Riverbank, CA Residents
| Local government employment and payroll (March 2022) | |||||
| Function | Full-time employees | Monthly full-time payroll | Average yearly full-time wage | Part-time employees | Monthly part-time payroll |
|---|---|---|---|---|---|
| Other Government Administration | 10 | $39,952 | $47,942 | 1 | $6,864 |
| Financial Administration | 10 | $69,653 | $83,584 | 0 | $0 |
| Streets and Highways | 8 | $44,470 | $66,705 | 0 | $0 |
| Other and Unallocable | 7 | $40,628 | $69,648 | 1 | $1,019 |
| Water Supply | 7 | $47,536 | $81,490 | 0 | $0 |
| Parks and Recreation | 4 | $27,059 | $81,177 | 15 | $10,914 |
| Housing and Community Development (Local) | 3 | $23,161 | $92,644 | 0 | $0 |
| Sewerage | 3 | $21,627 | $86,508 | 0 | $0 |
| Totals for Government | 52 | $314,085 | $72,481 | 17 | $18,797 |
Riverbank government finances - Expenditure in 2017 (per resident):
- Construction - Regular Highways: $2,346,000 ($94.50)
Housing and Community Development: $397,000 ($15.99)
Water Utilities: $278,000 ($11.20)
Parks and Recreation: $244,000 ($9.83)
Sewerage: $205,000 ($8.26)
- Current Operations - Police Protection: $3,581,000 ($144.24)
Central Staff Services: $2,889,000 ($116.37)
Regular Highways: $2,454,000 ($98.85)
Parks and Recreation: $1,339,000 ($53.94)
Water Utilities: $1,315,000 ($52.97)
Sewerage: $1,005,000 ($40.48)
Protective Inspection and Regulation - Other: $422,000 ($17.00)
Health - Other: $250,000 ($10.07)
Housing and Community Development: $24,000 ($0.97)
- General - Interest on Debt: $349,000 ($14.06)
- Intergovernmental to Local - Other - Police Protection: $3,438,000 ($138.48)
- Other Capital Outlay - Water Utilities: $253,000 ($10.19)
Housing and Community Development: $47,000 ($1.89)
Parks and Recreation: $11,000 ($0.44)
Riverbank government finances - Revenue in 2017 (per resident):
- Charges - Sewerage: $3,335,000 ($134.33)
Other: $711,000 ($28.64)
Parks and Recreation: $202,000 ($8.14)
Regular Highways: $74,000 ($2.98)
- Federal Intergovernmental - Other: $129,000 ($5.20)
Housing and Community Development: $40,000 ($1.61)
- Miscellaneous - General Revenue - Other: $566,000 ($22.80)
Fines and Forfeits: $167,000 ($6.73)
Rents: $99,000 ($3.99)
Interest Earnings: $84,000 ($3.38)
Special Assessments: $62,000 ($2.50)
Donations From Private Sources: $3,000 ($0.12)
- Revenue - Water Utilities: $2,114,000 ($85.15)
- State Intergovernmental - Other: $623,000 ($25.09)
Highways: $456,000 ($18.37)
General Local Government Support: $15,000 ($0.60)
- Tax - General Sales and Gross Receipts: $3,333,000 ($134.25)
Property: $3,020,000 ($121.65)
Public Utilities Sales: $615,000 ($24.77)
Other License: $138,000 ($5.56)
Documentary and Stock Transfer: $79,000 ($3.18)
Occupation and Business License - Other: $64,000 ($2.58)
Other: $61,000 ($2.46)
Riverbank government finances - Debt in 2017 (per resident):
- Long Term Debt - Beginning Outstanding - Unspecified Public Purpose: $8,725,000 ($351.45)
Outstanding Unspecified Public Purpose: $7,938,000 ($319.75)
Retired Unspecified Public Purpose: $786,000 ($31.66)
Riverbank government finances - Cash and Securities in 2017 (per resident):
- Bond Funds - Cash and Securities: $9,875,000 ($397.77)
- Other Funds - Cash and Securities: $27,947,000 ($1125.71)
5.00% of this county's 2021 resident taxpayers lived in other counties in 2020 ($56,165 average adjusted gross income)
| Here: | 5.00% |
| California average: | 5.19% |
0.01% of residents moved from foreign countries ($94 average AGI)
Stanislaus County: 0.01% California average: 0.03%
Top counties from which taxpayers relocated into this county between 2020 and 2021:
| from San Joaquin County, CA | |
| from Alameda County, CA | |
| from Santa Clara County, CA |
5.39% of this county's 2020 resident taxpayers moved to other counties in 2021 ($61,321 average adjusted gross income)
| Here: | 5.39% |
| California average: | 6.14% |
0.01% of residents moved to foreign countries ($87 average AGI)
Stanislaus County: 0.01% California average: 0.02%
Top counties to which taxpayers relocated from this county between 2020 and 2021:
| to San Joaquin County, CA | |
| to Merced County, CA | |
| to Sacramento County, CA |
| Businesses in Riverbank, CA | ||||
| Name | Count | Name | Count | |
|---|---|---|---|---|
| Applebee's | 1 | KFC | 1 | |
| AutoZone | 1 | Kohl's | 1 | |
| Baskin-Robbins | 1 | Little Caesars Pizza | 1 | |
| Burger King | 1 | McDonald's | 1 | |
| CVS | 1 | Men's Wearhouse | 1 | |
| Cold Stone Creamery | 1 | Nike | 2 | |
| Cricket Wireless | 1 | Payless | 1 | |
| Curves | 1 | RadioShack | 1 | |
| DHL | 1 | Red Robin | 1 | |
| Famous Footwear | 1 | Staples | 1 | |
| FedEx | 3 | Starbucks | 3 | |
| GNC | 1 | Subway | 2 | |
| GameStop | 1 | T-Mobile | 1 | |
| Goodwill | 3 | Taco Bell | 1 | |
| H&R Block | 1 | Target | 1 | |
| Home Depot | 1 | U-Haul | 1 | |
| Jack In The Box | 1 | UPS | 3 | |
| Justice | 1 | |||
Strongest AM radio stations in Riverbank:
- KCBC (770 AM; 50 kW; RIVERBANK, CA; Owner: KIERTRON, INC.)
- KFIV (1360 AM; 4 kW; MODESTO, CA; Owner: CAPSTAR TX LIMITED PARTNERSHIP)
- KESP (970 AM; 1 kW; MODESTO, CA; Owner: CITADEL BROADCASTING COMPANY)
- KHTK (1140 AM; 50 kW; SACRAMENTO, CA; Owner: INFINITY RADIO SUBSIDIARY OPERATIONS INC.)
- KVIN (920 AM; 2 kW; CERES, CA; Owner: THRESHOLD COMMUNICATIONS)
- KGO (810 AM; 50 kW; SAN FRANCISCO, CA; Owner: KGO-AM RADIO, INC.)
- KLOK (1170 AM; 50 kW; SAN JOSE, CA; Owner: ENTRAVISION HOLDINGS, LLC)
- KNBR (680 AM; 50 kW; SAN FRANCISCO, CA; Owner: KNBR LICO, INC.)
- KSTE (650 AM; 25 kW; RANCHO CORDOVA, CA; Owner: AMFM RADIO LICENSES, L.L.C.)
- KTCT (1050 AM; 50 kW; SAN MATEO, CA; Owner: SUSQUEHANNA RADIO CORP.)
- KFAX (1100 AM; 50 kW; SAN FRANCISCO, CA; Owner: GOLDEN GATE BROADCASTING CO, INC.)
- KTRB (860 AM; 50 kW; MODESTO, CA; Owner: PAPPAS RADIO OF CALIFORNIA, A CALIFORNIA LIMITED PARTNERSHIP)
- KLOC (1390 AM; 5 kW; TURLOCK, CA)
Strongest FM radio stations in Riverbank:
- KOSO (93.1 FM; PATTERSON, CA; Owner: CAPSTAR TX LIMITED PARTNERSHIP)
- KJSN (102.3 FM; MODESTO, CA; Owner: CAPSTAR TX LIMITED PARTNERSHIP)
- K238AC (95.5 FM; SALIDA, CA; Owner: FAMILY STATIONS, INC.)
- KEJC (93.9 FM; MODESTO, CA; Owner: MODESTO COMMUNICATIONS CORPORATION)
- KHOP (95.1 FM; OAKDALE, CA; Owner: CITADEL BROADCASTING COMPANY)
- KJOY (99.3 FM; STOCKTON, CA; Owner: CITADEL BROADCASTING COMPANY)
- KUOP (91.3 FM; STOCKTON, CA; Owner: UNIVERSITY OF THE PACIFIC)
- KKSF-FM1 (103.7 FM; PLEASANTON, ETC., CA; Owner: AMFM RADIO LICENSES, L.L.C.)
- KFRC-FM3 (99.7 FM; WALNUT CREEK, CA; Owner: INFINITY KFRC-FM, INC.)
- KZBR-FM1 (95.7 FM; WALNUT CREEK, CA; Owner: BONNEVILLE HOLDING COMPANY)
- KBLX-FM2 (102.9 FM; PLEASANTON, CA; Owner: ICBC BROADCAST HOLDINGS -CA, INC.)
- KSOL-FM3 (98.9 FM; PLEASANTON, CA; Owner: TMS LICENSE CALIFORNIA, INC)
- KWNN (98.3 FM; TURLOCK, CA; Owner: SILVERADO BROADCASTING COMPANY)
- KRVR (105.5 FM; COPPEROPOLIS, CA; Owner: THRESHOLD COMMUNICATIONS)
- KISQ-FM3 (98.1 FM; CONCORD, CA; Owner: AMFM RADIO LICENSES, L.L.C.)
- KMRQ (96.7 FM; MANTECA, CA; Owner: CAPSTAR TX LIMITED PARTNERSHIP)
- KMEL-FM1 (106.1 FM; CONCORD, CA; Owner: AMFM RADIO LICENSES, L.L.C.)
- KHTN (104.7 FM; LOS BANOS, CA; Owner: BUCKLEY COMMUNICATIONS, INC.)
- KKBN (93.5 FM; TWAIN HARTE, CA; Owner: CLARKE BROADCASTING CORPORATION)
- K258AB (99.5 FM; MODESTO, CA; Owner: EDUCATIONAL MEDIA FOUNDATION)
TV broadcast stations around Riverbank:
- KBSV (Channel 23; CERES, CA; Owner: BET-NAHRAIN, INC.)
- KACA-LP (Channel 61; MODESTO, CA; Owner: WORD OF GOD FELLOWSHIP, INC.)
- KOVR (Channel 13; STOCKTON, CA; Owner: SCI - SACRAMENTO LICENSEE, LLC)
- KXTV (Channel 10; SACRAMENTO, CA; Owner: KXTV, INC.)
- KUVS (Channel 19; MODESTO, CA; Owner: KUVS LICENSE PARTNERSHIP, G.P.)
- KCRA-TV (Channel 3; SACRAMENTO, CA; Owner: KCRA HEARST-ARGYLE TELEVISION, INC.)
- KSPX (Channel 29; SACRAMENTO, CA; Owner: PAXSON SACRAMENTO LICENSE, INC.)
- KQCA (Channel 58; STOCKTON, CA; Owner: KCRA HEARST-ARGYLE TELEVISION, INC.)
- KTXL (Channel 40; SACRAMENTO, CA; Owner: CHANNEL 40, INC.)
- KMAX-TV (Channel 31; SACRAMENTO, CA; Owner: UPN STATIONS GROUP INC.)
- KVIE (Channel 6; SACRAMENTO, CA; Owner: KVIE, INC.)
- KMMK-LP (Channel 14; SACRAMENTO, CA; Owner: CABALLERO TELEVISION TEXAS, L.L.C.)
- KDTS-CA (Channel 52; STOCKTON, CA; Owner: WORD OF GOD FELLOWSHIP, INC.)
- National Bridge Inventory (NBI) Statistics
- 14Number of bridges
- 174ft / 53.5mTotal length
- 121,029Total average daily traffic
- 11,156Total average daily truck traffic
- 178,407Total future (year 2037) average daily traffic
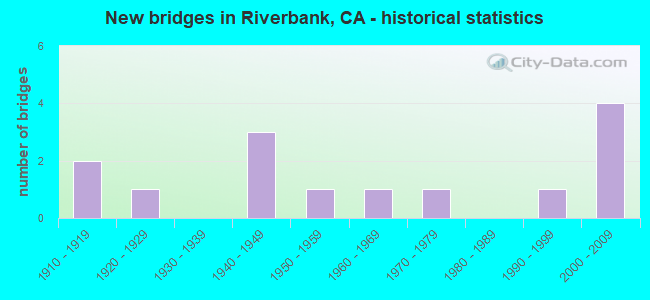
- New bridges - historical statistics
- 21910-1919
- 11920-1929
- 31940-1949
- 11950-1959
- 11960-1969
- 11970-1979
- 11990-1999
- 42000-2009
FCC Registered Antenna Towers:
6- Edward G Roach, 3312 Patterson Road (Lat: 37.730861 Lon: -120.935000), Type: 38.1, Overall height: 36.6 m, Registrant: Sba Properties, Inc., Eroach@sbasite.Com, , Boca -Raton, Phone: (561) 995-7670
- Edward G Roach, 3312 Patterson Road (Lat: 37.730861 Lon: -120.935000), Type: 38.1, Overall height: 36.6 m, Registrant: Sba Properties, Inc., Eroach@sbasite.Com, , Boca -Raton, Phone: (561) 995-7670
- Robert L Robeski, 3312 Patterson Road (Lat: 37.730861 Lon: -120.935000), Type: 38.1, Overall height: 36.6 m, Registrant: Aat Communications Corporation, Iseli-n, Phone: (732) 404-9360
- Edward G Roach, 3312 Patterson Road (Lat: 37.730861 Lon: -120.935000), Type: 38.1, Overall height: 36.6 m, Registrant: Aat Communications Corporation, Eroach@sbasite.Com, , Boca -Raton, Phone: (561) 995-7670
- Edward G Roach, 3312 Patterson Road (Lat: 37.730861 Lon: -120.935000), Type: 38.1, Overall height: 36.6 m, Registrant: Sba Structures, Inc., Eroach@sbasite.Com, , Boca -Raton, Phone: (561) 995-7670
- Edward G Roach, 3312 Patterson Road (Lat: 37.730861 Lon: -120.935000), Type: 38.1, Structure height: 06099 m, Overall height: 36.6 m, Registrant: Sba Structures, LLC, Eroach@sbasite.Com, , Boca -Raton, Phone: (561) 995-7670
FCC Registered Broadcast Land Mobile Towers:
11 (See the full list of FCC Registered Broadcast Land Mobile Towers in Riverbank, CA)FCC Registered Microwave Towers:
3- RIVERBANK, Meso Drive And Hwy 108 (Lat: 37.734083 Lon: -120.925500), Type: Pole, Structure height: 22.9 m, Overall height: 24.4 m, Call Sign: WQIH640,
Assigned Frequencies: 6345.49 MHz, Grant Date: 02/14/2008, Expiration Date: 02/14/2018, Cancellation Date: 08/14/2009, Certifier: William Chastain, Registrant: Radio Dynamics Corporation, 774 Mays Blvd., #10-465, Silver Spring, MD 20914, Phone: (301) 493-5171, Fax: (301) 576-4553, Email:
- CA0035 RIVER, 3312 Patterson Road (Lat: 37.730861 Lon: -120.935000), Type: Tower, Structure height: 36.6 m, Overall height: 38.1 m, Call Sign: WQMA320,
Assigned Frequencies: 10795.0 MHz, 19525.0 MHz, Grant Date: 06/09/2010, Expiration Date: 06/09/2020, Cancellation Date: 02/16/2012, Certifier: Dan Mieszala, Registrant: Open Range Communications Inc., 6430 S. Fiddlers Green Circle, Suite 500, Greenwood Village, CO 80111, Phone: (303) 376-2112, Fax: (303) 376-2109, Email:
- 3649 KANSAS AVE, 3649 Kansas Ave (Lat: 37.731167 Lon: -120.929750), Type: Gtower, Structure height: 18.3 m, Call Sign: WRYH729, Licensee ID: L02360430,
Assigned Frequencies: 10755.0 MHz, 10755.0 MHz, 10755.0 MHz, 10755.0 MHz, 10755.0 MHz, 10755.0 MHz, 10755.0 MHz, 10755.0 MHz, 10755.0 MHz, 10755.0 MHz, Grant Date: 08/11/2023, Expiration Date: 08/11/2033, Certifier: Timothy J Trout, Registrant: Expohl, LLC, 2437 Veduga Road, Hughson, CA 95326, Phone: (209) 480-3122, Email:
FCC Registered Amateur Radio Licenses:
85 (See the full list of FCC Registered Amateur Radio Licenses in Riverbank)FAA Registered Aircraft Manufacturers and Dealers:
1- MCHUGH FRANK A DBA, Po Box 1111, Riverbank, CA 95367
Certificate: D000538 (Individual), Certificate Issue Date: 01/22/2014, Expiration Date: 01/21/2015
FAA Registered Aircraft:
1- Aircraft: CESSNA T182T (Category: Land, Seats: 4, Weight: Up to 12,499 Pounds), Engine: LYCOMING TIO-540-AK1A (235 HP) (Reciprocating)
N-Number: 62828, N62828, N-62828, Serial Number: T18208867, Year manufactured: 2008, Airworthiness Date: 06/04/2008, Certificate Issue Date: 01/31/2019
Registrant (Corporation): Benchmark Farm Management Inc, Po Box 218, Riverbank, CA 95367
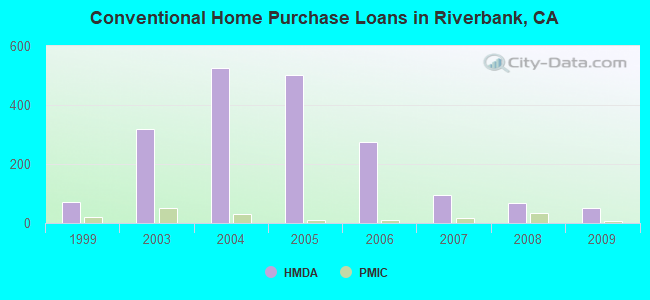
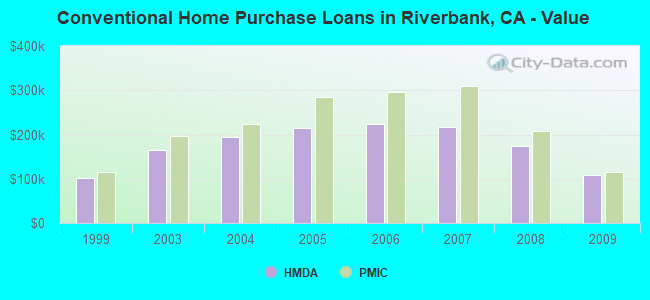
| Home Mortgage Disclosure Act Aggregated Statistics For Year 2009 (Based on 4 partial tracts) | ||||||||||||||
| A) FHA, FSA/RHS & VA Home Purchase Loans | B) Conventional Home Purchase Loans | C) Refinancings | D) Home Improvement Loans | E) Loans on Dwellings For 5+ Families | F) Non-occupant Loans on < 5 Family Dwellings (A B C & D) | G) Loans On Manufactured Home Dwelling (A B C & D) | ||||||||
|---|---|---|---|---|---|---|---|---|---|---|---|---|---|---|
| Number | Average Value | Number | Average Value | Number | Average Value | Number | Average Value | Number | Average Value | Number | Average Value | Number | Average Value | |
| LOANS ORIGINATED | 126 | $149,662 | 50 | $107,785 | 76 | $169,059 | 5 | $140,434 | 0 | $0 | 20 | $95,860 | 1 | $11,660 |
| APPLICATIONS APPROVED, NOT ACCEPTED | 12 | $135,169 | 5 | $148,030 | 11 | $167,640 | 1 | $29,530 | 0 | $0 | 1 | $61,700 | 0 | $0 |
| APPLICATIONS DENIED | 14 | $165,389 | 8 | $150,620 | 46 | $165,930 | 3 | $41,427 | 1 | $602,140 | 3 | $130,593 | 2 | $112,220 |
| APPLICATIONS WITHDRAWN | 13 | $141,235 | 11 | $120,021 | 25 | $185,120 | 1 | $235,020 | 0 | $0 | 5 | $127,554 | 0 | $0 |
| FILES CLOSED FOR INCOMPLETENESS | 1 | $126,680 | 1 | $49,010 | 6 | $136,082 | 2 | $120,825 | 0 | $0 | 1 | $72,630 | 0 | $0 |
Detailed HMDA statistics for the following Tracts: 0003.01 , 0003.02, 0003.03, 0003.04
| Private Mortgage Insurance Companies Aggregated Statistics For Year 2009 (Based on 4 partial tracts) | ||||
| A) Conventional Home Purchase Loans | B) Refinancings | |||
|---|---|---|---|---|
| Number | Average Value | Number | Average Value | |
| LOANS ORIGINATED | 8 | $116,356 | 2 | $145,825 |
| APPLICATIONS APPROVED, NOT ACCEPTED | 2 | $287,760 | 0 | $0 |
| APPLICATIONS DENIED | 1 | $184,200 | 0 | $0 |
| APPLICATIONS WITHDRAWN | 0 | $0 | 1 | $104,920 |
| FILES CLOSED FOR INCOMPLETENESS | 0 | $0 | 0 | $0 |
Detailed PMIC statistics for the following Tracts: 0003.01 , 0003.02, 0003.03, 0003.04
2005 - 2018 National Fire Incident Reporting System (NFIRS) incidents
- Fire incident types reported to NFIRS in Riverbank, CA
- 35247.4%Outside Fires
- 29439.6%Structure Fires
- 658.7%Mobile Property/Vehicle Fires
- 324.3%Other
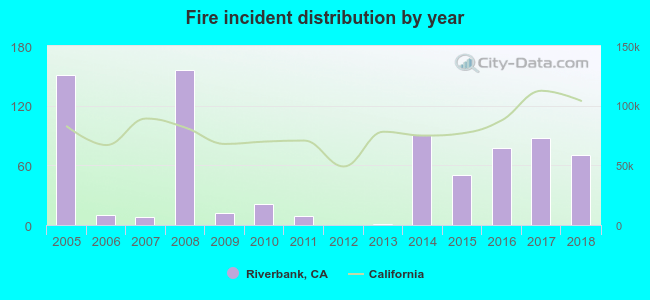 Based on the data from the years 2005 - 2018 the average number of fires per year is 53. The highest number of reported fire incidents - 156 took place in 2008, and the least - 0 in 2012. The data has a declining trend.
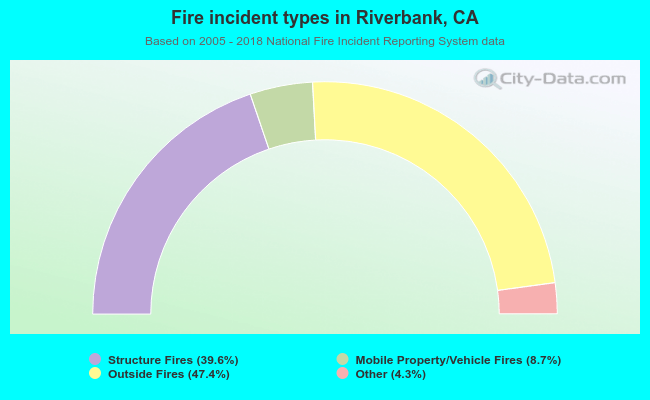 When looking into fire subcategories, the most incidents belonged to: Outside Fires (47.4%), and Structure Fires (39.6%).
| Most common first names in Riverbank, CA among deceased individuals | ||
| Name | Count | Lived (average) |
|---|---|---|
| John | 52 | 74.0 years |
| William | 42 | 75.9 years |
| James | 40 | 66.9 years |
| Mary | 40 | 81.2 years |
| Robert | 39 | 69.7 years |
| Charles | 29 | 75.4 years |
| Maria | 27 | 77.0 years |
| George | 26 | 74.7 years |
| Henry | 19 | 72.3 years |
| Frank | 19 | 73.0 years |
| Most common last names in Riverbank, CA among deceased individuals | ||
| Last name | Count | Lived (average) |
|---|---|---|
| Jones | 24 | 71.7 years |
| Williams | 23 | 79.5 years |
| Garcia | 21 | 71.9 years |
| Smith | 18 | 75.4 years |
| Brown | 16 | 76.5 years |
| Lopez | 16 | 69.6 years |
| Johnson | 14 | 75.1 years |
| Green | 13 | 72.6 years |
| Perez | 13 | 75.7 years |
| Hernandez | 13 | 75.1 years |
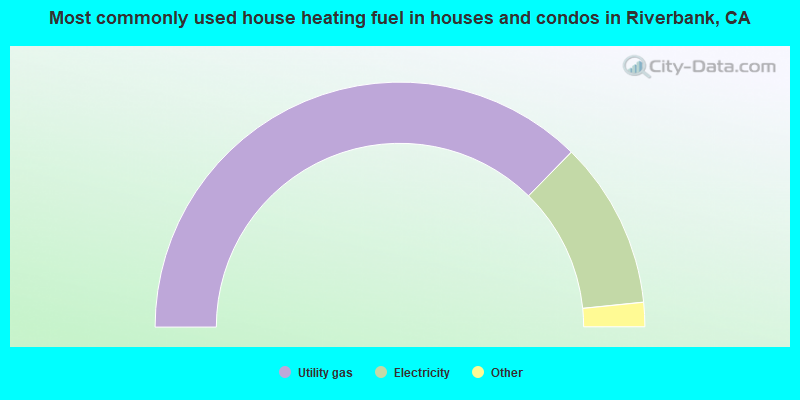
- 74.7%Utility gas
- 22.1%Electricity
- 1.6%Solar energy
- 0.9%Bottled, tank, or LP gas
- 0.4%No fuel used
- 0.2%Fuel oil, kerosene, etc.
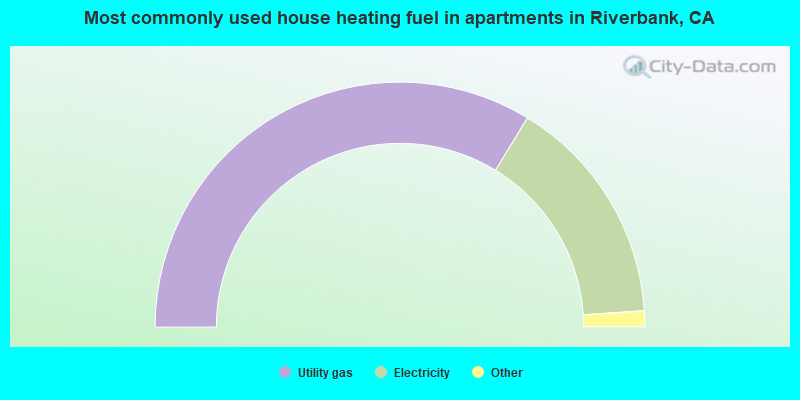
- 67.5%Utility gas
- 30.5%Electricity
- 1.4%Bottled, tank, or LP gas
- 0.6%No fuel used
Riverbank compared to California state average:
- Median house value below state average.
- Black race population percentage significantly below state average.
- Hispanic race population percentage above state average.
- Renting percentage below state average.
- House age below state average.

|
|
Total of 10 patent applications in 2008-2024.