Villa Hills, Kentucky Submit your own pictures of this city and show them to the world
OSM Map
General Map
Google Map
MSN Map
OSM Map
General Map
Google Map
MSN Map
OSM Map
General Map
Google Map
MSN Map
OSM Map
General Map
Google Map
MSN Map
Please wait while loading the map...
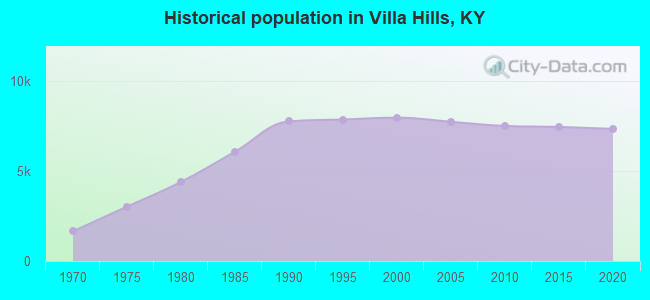
Population in 2022: 7,435 (100% urban, 0% rural). Population change since 2000: -6.5%Males: 3,389 Females: 4,046
March 2022 cost of living index in Villa Hills: 88.2 (less than average, U.S. average is 100) Percentage of residents living in poverty in 2022: 3.2%for White Non-Hispanic residents , 100.0% for Black residents , 9.9% for Hispanic or Latino residents )Business Search - 14 Million verified businesses
Data:
Median household income ($)
Median household income (% change since 2000)
Household income diversity
Ratio of average income to average house value (%)
Ratio of average income to average rent
Median household income ($) - White
Median household income ($) - Black or African American
Median household income ($) - Asian
Median household income ($) - Hispanic or Latino
Median household income ($) - American Indian and Alaska Native
Median household income ($) - Multirace
Median household income ($) - Other Race
Median household income for houses/condos with a mortgage ($)
Median household income for apartments without a mortgage ($)
Races - White alone (%)
Races - White alone (% change since 2000)
Races - Black alone (%)
Races - Black alone (% change since 2000)
Races - American Indian alone (%)
Races - American Indian alone (% change since 2000)
Races - Asian alone (%)
Races - Asian alone (% change since 2000)
Races - Hispanic (%)
Races - Hispanic (% change since 2000)
Races - Native Hawaiian and Other Pacific Islander alone (%)
Races - Native Hawaiian and Other Pacific Islander alone (% change since 2000)
Races - Two or more races (%)
Races - Two or more races (% change since 2000)
Races - Other race alone (%)
Races - Other race alone (% change since 2000)
Racial diversity
Unemployment (%)
Unemployment (% change since 2000)
Unemployment (%) - White
Unemployment (%) - Black or African American
Unemployment (%) - Asian
Unemployment (%) - Hispanic or Latino
Unemployment (%) - American Indian and Alaska Native
Unemployment (%) - Multirace
Unemployment (%) - Other Race
Population density (people per square mile)
Population - Males (%)
Population - Females (%)
Population - Males (%) - White
Population - Males (%) - Black or African American
Population - Males (%) - Asian
Population - Males (%) - Hispanic or Latino
Population - Males (%) - American Indian and Alaska Native
Population - Males (%) - Multirace
Population - Males (%) - Other Race
Population - Females (%) - White
Population - Females (%) - Black or African American
Population - Females (%) - Asian
Population - Females (%) - Hispanic or Latino
Population - Females (%) - American Indian and Alaska Native
Population - Females (%) - Multirace
Population - Females (%) - Other Race
Coronavirus confirmed cases (Jun 15, 2024)
Deaths caused by coronavirus (Jun 15, 2024)
Coronavirus confirmed cases (per 100k population) (Jun 15, 2024)
Deaths caused by coronavirus (per 100k population) (Jun 15, 2024)
Daily increase in number of cases (Jun 15, 2024)
Weekly increase in number of cases (Jun 15, 2024)
Cases doubled (in days) (Jun 15, 2024)
Hospitalized patients (Apr 18, 2022)
Negative test results (Apr 18, 2022)
Total test results (Apr 18, 2022)
COVID Vaccine doses distributed (per 100k population) (Sep 19, 2023)
COVID Vaccine doses administered (per 100k population) (Sep 19, 2023)
COVID Vaccine doses distributed (Sep 19, 2023)
COVID Vaccine doses administered (Sep 19, 2023)
Likely homosexual households (%)
Likely homosexual households (% change since 2000)
Likely homosexual households - Lesbian couples (%)
Likely homosexual households - Lesbian couples (% change since 2000)
Likely homosexual households - Gay men (%)
Likely homosexual households - Gay men (% change since 2000)
Cost of living index
Median gross rent ($)
Median contract rent ($)
Median monthly housing costs ($)
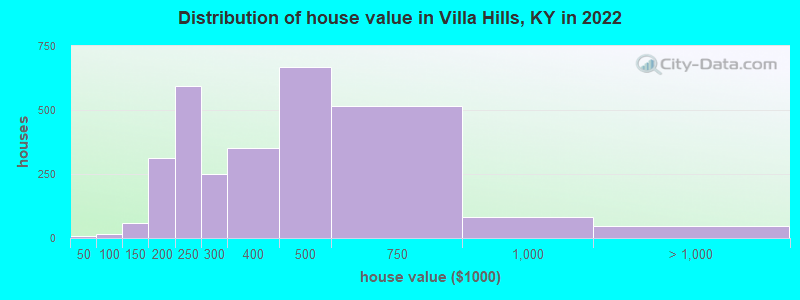
Median house or condo value ($)
Median house or condo value ($ change since 2000)
Mean house or condo value by units in structure - 1, detached ($)
Mean house or condo value by units in structure - 1, attached ($)
Mean house or condo value by units in structure - 2 ($)
Mean house or condo value by units in structure by units in structure - 3 or 4 ($)
Mean house or condo value by units in structure - 5 or more ($)
Mean house or condo value by units in structure - Boat, RV, van, etc. ($)
Mean house or condo value by units in structure - Mobile home ($)
Median house or condo value ($) - White
Median house or condo value ($) - Black or African American
Median house or condo value ($) - Asian
Median house or condo value ($) - Hispanic or Latino
Median house or condo value ($) - American Indian and Alaska Native
Median house or condo value ($) - Multirace
Median house or condo value ($) - Other Race
Median resident age
Resident age diversity
Median resident age - Males
Median resident age - Females
Median resident age - White
Median resident age - Black or African American
Median resident age - Asian
Median resident age - Hispanic or Latino
Median resident age - American Indian and Alaska Native
Median resident age - Multirace
Median resident age - Other Race
Median resident age - Males - White
Median resident age - Males - Black or African American
Median resident age - Males - Asian
Median resident age - Males - Hispanic or Latino
Median resident age - Males - American Indian and Alaska Native
Median resident age - Males - Multirace
Median resident age - Males - Other Race
Median resident age - Females - White
Median resident age - Females - Black or African American
Median resident age - Females - Asian
Median resident age - Females - Hispanic or Latino
Median resident age - Females - American Indian and Alaska Native
Median resident age - Females - Multirace
Median resident age - Females - Other Race
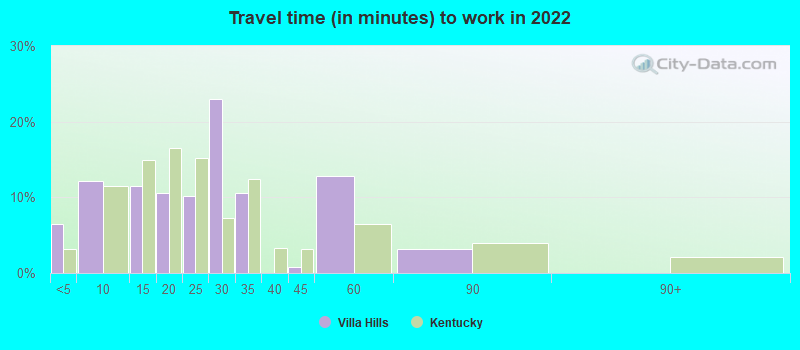
Commute - mean travel time to work (minutes)
Travel time to work - Less than 5 minutes (%)
Travel time to work - Less than 5 minutes (% change since 2000)
Travel time to work - 5 to 9 minutes (%)
Travel time to work - 5 to 9 minutes (% change since 2000)
Travel time to work - 10 to 19 minutes (%)
Travel time to work - 10 to 19 minutes (% change since 2000)
Travel time to work - 20 to 29 minutes (%)
Travel time to work - 20 to 29 minutes (% change since 2000)
Travel time to work - 30 to 39 minutes (%)
Travel time to work - 30 to 39 minutes (% change since 2000)
Travel time to work - 40 to 59 minutes (%)
Travel time to work - 40 to 59 minutes (% change since 2000)
Travel time to work - 60 to 89 minutes (%)
Travel time to work - 60 to 89 minutes (% change since 2000)
Travel time to work - 90 or more minutes (%)
Travel time to work - 90 or more minutes (% change since 2000)
Marital status - Never married (%)
Marital status - Now married (%)
Marital status - Separated (%)
Marital status - Widowed (%)
Marital status - Divorced (%)
Median family income ($)
Median family income (% change since 2000)
Median non-family income ($)
Median non-family income (% change since 2000)
Median per capita income ($)
Median per capita income (% change since 2000)
Median family income ($) - White
Median family income ($) - Black or African American
Median family income ($) - Asian
Median family income ($) - Hispanic or Latino
Median family income ($) - American Indian and Alaska Native
Median family income ($) - Multirace
Median family income ($) - Other Race
Median year house/condo built
Median year apartment built
Year house built - Built 2005 or later (%)
Year house built - Built 2000 to 2004 (%)
Year house built - Built 1990 to 1999 (%)
Year house built - Built 1980 to 1989 (%)
Year house built - Built 1970 to 1979 (%)
Year house built - Built 1960 to 1969 (%)
Year house built - Built 1950 to 1959 (%)
Year house built - Built 1940 to 1949 (%)
Year house built - Built 1939 or earlier (%)
Average household size
Household density (households per square mile)
Average household size - White
Average household size - Black or African American
Average household size - Asian
Average household size - Hispanic or Latino
Average household size - American Indian and Alaska Native
Average household size - Multirace
Average household size - Other Race
Occupied housing units (%)
Vacant housing units (%)
Owner occupied housing units (%)
Renter occupied housing units (%)
Vacancy status - For rent (%)
Vacancy status - For sale only (%)
Vacancy status - Rented or sold, not occupied (%)
Vacancy status - For seasonal, recreational, or occasional use (%)
Vacancy status - For migrant workers (%)
Vacancy status - Other vacant (%)
Residents with income below the poverty level (%)
Residents with income below 50% of the poverty level (%)
Children below poverty level (%)
Poor families by family type - Married-couple family (%)
Poor families by family type - Male, no wife present (%)
Poor families by family type - Female, no husband present (%)
Poverty status for native-born residents (%)
Poverty status for foreign-born residents (%)
Poverty among high school graduates not in families (%)
Poverty among people who did not graduate high school not in families (%)
Residents with income below the poverty level (%) - White
Residents with income below the poverty level (%) - Black or African American
Residents with income below the poverty level (%) - Asian
Residents with income below the poverty level (%) - Hispanic or Latino
Residents with income below the poverty level (%) - American Indian and Alaska Native
Residents with income below the poverty level (%) - Multirace
Residents with income below the poverty level (%) - Other Race
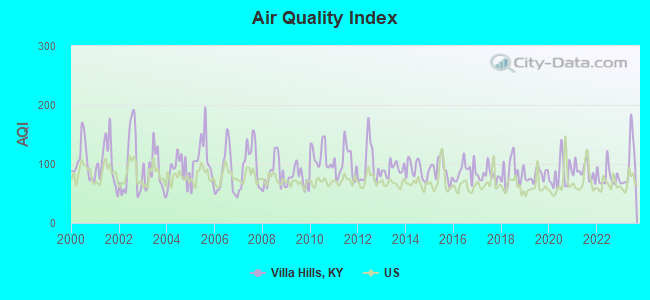
Air pollution - Air Quality Index (AQI)
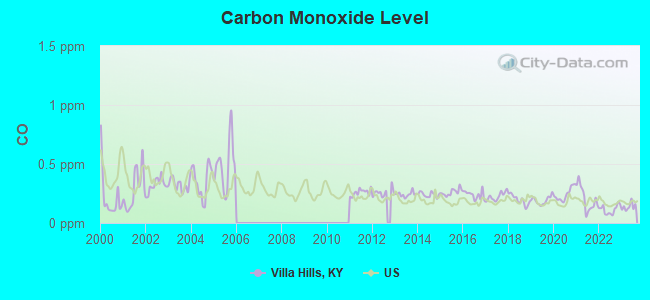
Air pollution - CO
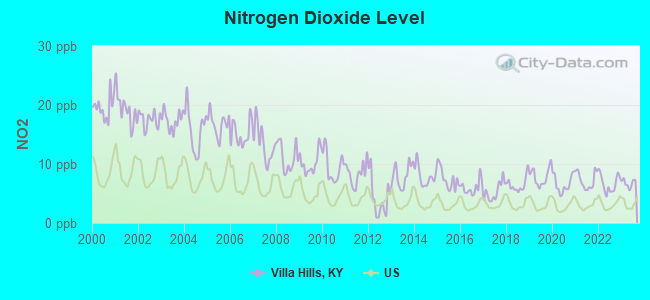
Air pollution - NO2
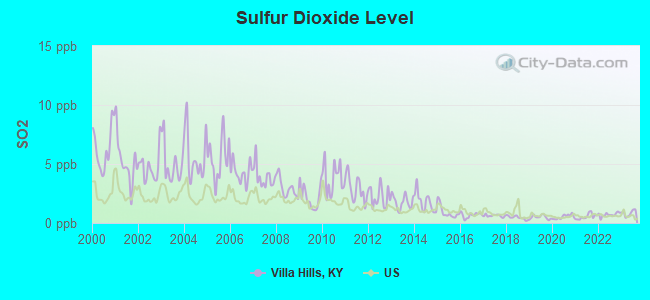
Air pollution - SO2
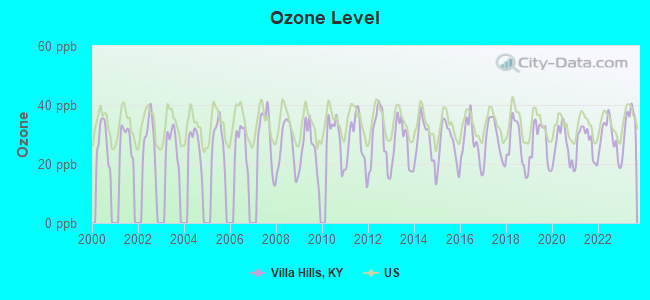
Air pollution - Ozone
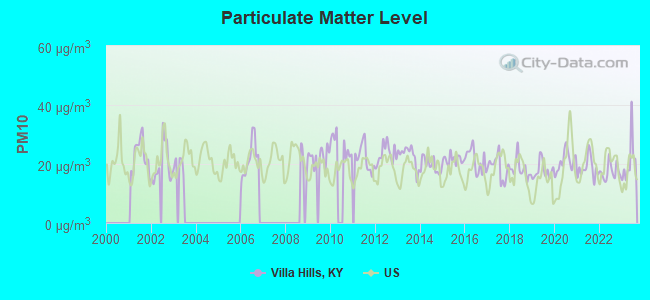
Air pollution - PM10
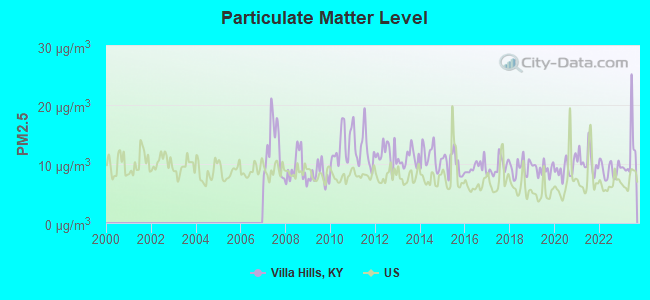
Air pollution - PM25
Air pollution - Pb
Crime - Murders per 100,000 population
Crime - Rapes per 100,000 population
Crime - Robberies per 100,000 population
Crime - Assaults per 100,000 population
Crime - Burglaries per 100,000 population
Crime - Thefts per 100,000 population
Crime - Auto thefts per 100,000 population
Crime - Arson per 100,000 population
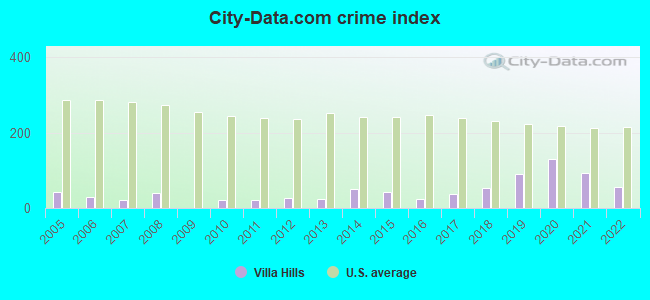
Crime - City-data.com crime index
Crime - Violent crime index
Crime - Property crime index
Crime - Murders per 100,000 population (5 year average)
Crime - Rapes per 100,000 population (5 year average)
Crime - Robberies per 100,000 population (5 year average)
Crime - Assaults per 100,000 population (5 year average)
Crime - Burglaries per 100,000 population (5 year average)
Crime - Thefts per 100,000 population (5 year average)
Crime - Auto thefts per 100,000 population (5 year average)
Crime - Arson per 100,000 population (5 year average)
Crime - City-data.com crime index (5 year average)
Crime - Violent crime index (5 year average)
Crime - Property crime index (5 year average)
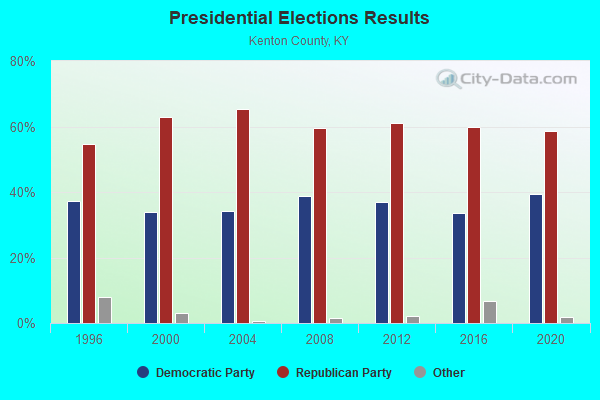
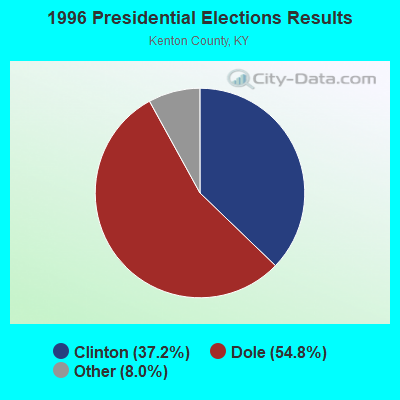
1996 Presidential Elections Results (%) - Democratic Party (Clinton)
1996 Presidential Elections Results (%) - Republican Party (Dole)
1996 Presidential Elections Results (%) - Other
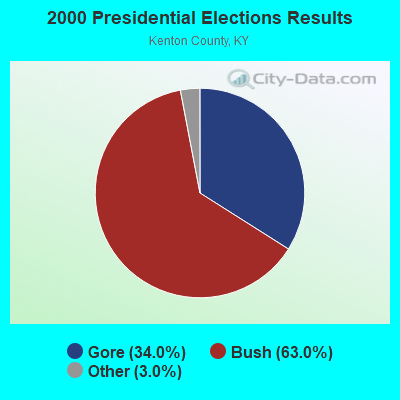
2000 Presidential Elections Results (%) - Democratic Party (Gore)
2000 Presidential Elections Results (%) - Republican Party (Bush)
2000 Presidential Elections Results (%) - Other
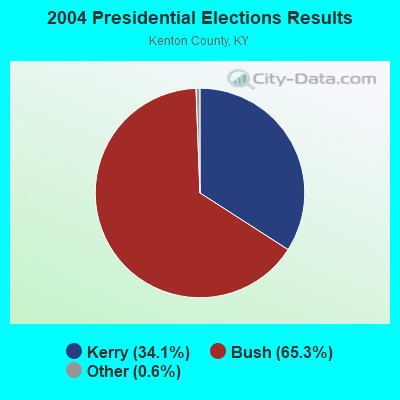
2004 Presidential Elections Results (%) - Democratic Party (Kerry)
2004 Presidential Elections Results (%) - Republican Party (Bush)
2004 Presidential Elections Results (%) - Other
2008 Presidential Elections Results (%) - Democratic Party (Obama)
2008 Presidential Elections Results (%) - Republican Party (McCain)
2008 Presidential Elections Results (%) - Other
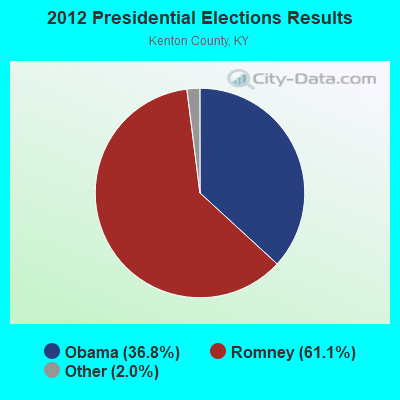
2012 Presidential Elections Results (%) - Democratic Party (Obama)
2012 Presidential Elections Results (%) - Republican Party (Romney)
2012 Presidential Elections Results (%) - Other
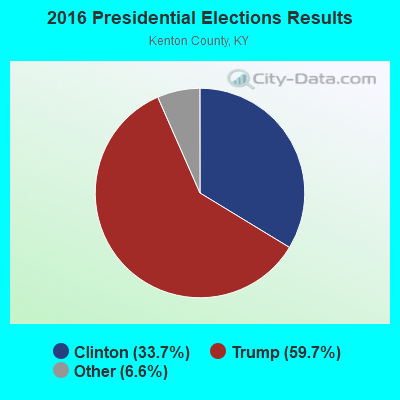
2016 Presidential Elections Results (%) - Democratic Party (Clinton)
2016 Presidential Elections Results (%) - Republican Party (Trump)
2016 Presidential Elections Results (%) - Other
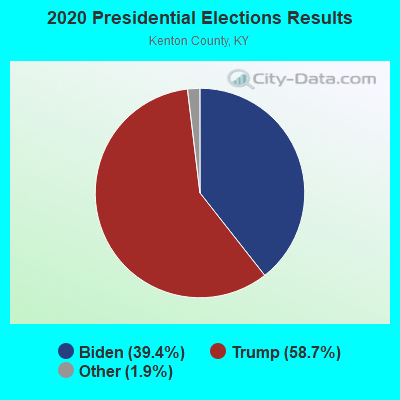
2020 Presidential Elections Results (%) - Democratic Party (Biden)
2020 Presidential Elections Results (%) - Republican Party (Trump)
2020 Presidential Elections Results (%) - Other
Ancestries Reported - Arab (%)
Ancestries Reported - Czech (%)
Ancestries Reported - Danish (%)
Ancestries Reported - Dutch (%)
Ancestries Reported - English (%)
Ancestries Reported - French (%)
Ancestries Reported - French Canadian (%)
Ancestries Reported - German (%)
Ancestries Reported - Greek (%)
Ancestries Reported - Hungarian (%)
Ancestries Reported - Irish (%)
Ancestries Reported - Italian (%)
Ancestries Reported - Lithuanian (%)
Ancestries Reported - Norwegian (%)
Ancestries Reported - Polish (%)
Ancestries Reported - Portuguese (%)
Ancestries Reported - Russian (%)
Ancestries Reported - Scotch-Irish (%)
Ancestries Reported - Scottish (%)
Ancestries Reported - Slovak (%)
Ancestries Reported - Subsaharan African (%)
Ancestries Reported - Swedish (%)
Ancestries Reported - Swiss (%)
Ancestries Reported - Ukrainian (%)
Ancestries Reported - United States (%)
Ancestries Reported - Welsh (%)
Ancestries Reported - West Indian (%)
Ancestries Reported - Other (%)
Educational Attainment - No schooling completed (%)
Educational Attainment - Less than high school (%)
Educational Attainment - High school or equivalent (%)
Educational Attainment - Less than 1 year of college (%)
Educational Attainment - 1 or more years of college (%)
Educational Attainment - Associate degree (%)
Educational Attainment - Bachelor's degree (%)
Educational Attainment - Master's degree (%)
Educational Attainment - Professional school degree (%)
Educational Attainment - Doctorate degree (%)
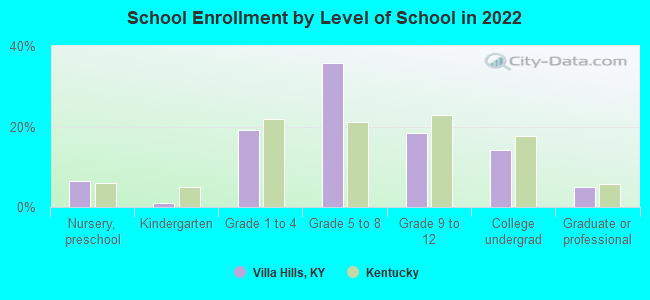
School Enrollment - Nursery, preschool (%)
School Enrollment - Kindergarten (%)
School Enrollment - Grade 1 to 4 (%)
School Enrollment - Grade 5 to 8 (%)
School Enrollment - Grade 9 to 12 (%)
School Enrollment - College undergrad (%)
School Enrollment - Graduate or professional (%)
School Enrollment - Not enrolled in school (%)
School enrollment - Public schools (%)
School enrollment - Private schools (%)
School enrollment - Not enrolled (%)
Median number of rooms in houses and condos
Median number of rooms in apartments
Housing units lacking complete plumbing facilities (%)
Housing units lacking complete kitchen facilities (%)
Density of houses
Urban houses (%)
Rural houses (%)
Households with people 60 years and over (%)
Households with people 65 years and over (%)
Households with people 75 years and over (%)
Households with one or more nonrelatives (%)
Households with no nonrelatives (%)
Population in households (%)
Family households (%)
Nonfamily households (%)
Population in families (%)
Family households with own children (%)
Median number of bedrooms in owner occupied houses
Mean number of bedrooms in owner occupied houses
Median number of bedrooms in renter occupied houses
Mean number of bedrooms in renter occupied houses
Median number of vehichles in owner occupied houses
Mean number of vehichles in owner occupied houses
Median number of vehichles in renter occupied houses
Mean number of vehichles in renter occupied houses
Mortgage status - with mortgage (%)
Mortgage status - with second mortgage (%)
Mortgage status - with home equity loan (%)
Mortgage status - with both second mortgage and home equity loan (%)
Mortgage status - without a mortgage (%)
Average family size
Average family size - White
Average family size - Black or African American
Average family size - Asian
Average family size - Hispanic or Latino
Average family size - American Indian and Alaska Native
Average family size - Multirace
Average family size - Other Race
Geographical mobility - Same house 1 year ago (%)
Geographical mobility - Moved within same county (%)
Geographical mobility - Moved from different county within same state (%)
Geographical mobility - Moved from different state (%)
Geographical mobility - Moved from abroad (%)
Place of birth - Born in state of residence (%)
Place of birth - Born in other state (%)
Place of birth - Native, outside of US (%)
Place of birth - Foreign born (%)
Housing units in structures - 1, detached (%)
Housing units in structures - 1, attached (%)
Housing units in structures - 2 (%)
Housing units in structures - 3 or 4 (%)
Housing units in structures - 5 to 9 (%)
Housing units in structures - 10 to 19 (%)
Housing units in structures - 20 to 49 (%)
Housing units in structures - 50 or more (%)
Housing units in structures - Mobile home (%)
Housing units in structures - Boat, RV, van, etc. (%)
House/condo owner moved in on average (years ago)
Renter moved in on average (years ago)
Year householder moved into unit - Moved in 1999 to March 2000 (%)
Year householder moved into unit - Moved in 1995 to 1998 (%)
Year householder moved into unit - Moved in 1990 to 1994 (%)
Year householder moved into unit - Moved in 1980 to 1989 (%)
Year householder moved into unit - Moved in 1970 to 1979 (%)
Year householder moved into unit - Moved in 1969 or earlier (%)
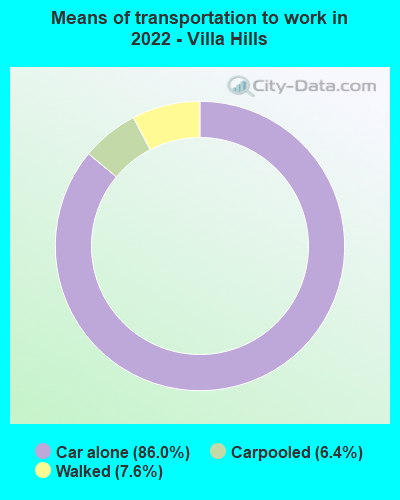
Means of transportation to work - Drove car alone (%)
Means of transportation to work - Carpooled (%)
Means of transportation to work - Public transportation (%)
Means of transportation to work - Bus or trolley bus (%)
Means of transportation to work - Streetcar or trolley car (%)
Means of transportation to work - Subway or elevated (%)
Means of transportation to work - Railroad (%)
Means of transportation to work - Ferryboat (%)
Means of transportation to work - Taxicab (%)
Means of transportation to work - Motorcycle (%)
Means of transportation to work - Bicycle (%)
Means of transportation to work - Walked (%)
Means of transportation to work - Other means (%)
Working at home (%)
Industry diversity
Most Common Industries - Agriculture, forestry, fishing and hunting, and mining (%)
Most Common Industries - Agriculture, forestry, fishing and hunting (%)
Most Common Industries - Mining, quarrying, and oil and gas extraction (%)
Most Common Industries - Construction (%)
Most Common Industries - Manufacturing (%)
Most Common Industries - Wholesale trade (%)
Most Common Industries - Retail trade (%)
Most Common Industries - Transportation and warehousing, and utilities (%)
Most Common Industries - Transportation and warehousing (%)
Most Common Industries - Utilities (%)
Most Common Industries - Information (%)
Most Common Industries - Finance and insurance, and real estate and rental and leasing (%)
Most Common Industries - Finance and insurance (%)
Most Common Industries - Real estate and rental and leasing (%)
Most Common Industries - Professional, scientific, and management, and administrative and waste management services (%)
Most Common Industries - Professional, scientific, and technical services (%)
Most Common Industries - Management of companies and enterprises (%)
Most Common Industries - Administrative and support and waste management services (%)
Most Common Industries - Educational services, and health care and social assistance (%)
Most Common Industries - Educational services (%)
Most Common Industries - Health care and social assistance (%)
Most Common Industries - Arts, entertainment, and recreation, and accommodation and food services (%)
Most Common Industries - Arts, entertainment, and recreation (%)
Most Common Industries - Accommodation and food services (%)
Most Common Industries - Other services, except public administration (%)
Most Common Industries - Public administration (%)
Occupation diversity
Most Common Occupations - Management, business, science, and arts occupations (%)
Most Common Occupations - Management, business, and financial occupations (%)
Most Common Occupations - Management occupations (%)
Most Common Occupations - Business and financial operations occupations (%)
Most Common Occupations - Computer, engineering, and science occupations (%)
Most Common Occupations - Computer and mathematical occupations (%)
Most Common Occupations - Architecture and engineering occupations (%)
Most Common Occupations - Life, physical, and social science occupations (%)
Most Common Occupations - Education, legal, community service, arts, and media occupations (%)
Most Common Occupations - Community and social service occupations (%)
Most Common Occupations - Legal occupations (%)
Most Common Occupations - Education, training, and library occupations (%)
Most Common Occupations - Arts, design, entertainment, sports, and media occupations (%)
Most Common Occupations - Healthcare practitioners and technical occupations (%)
Most Common Occupations - Health diagnosing and treating practitioners and other technical occupations (%)
Most Common Occupations - Health technologists and technicians (%)
Most Common Occupations - Service occupations (%)
Most Common Occupations - Healthcare support occupations (%)
Most Common Occupations - Protective service occupations (%)
Most Common Occupations - Fire fighting and prevention, and other protective service workers including supervisors (%)
Most Common Occupations - Law enforcement workers including supervisors (%)
Most Common Occupations - Food preparation and serving related occupations (%)
Most Common Occupations - Building and grounds cleaning and maintenance occupations (%)
Most Common Occupations - Personal care and service occupations (%)
Most Common Occupations - Sales and office occupations (%)
Most Common Occupations - Sales and related occupations (%)
Most Common Occupations - Office and administrative support occupations (%)
Most Common Occupations - Natural resources, construction, and maintenance occupations (%)
Most Common Occupations - Farming, fishing, and forestry occupations (%)
Most Common Occupations - Construction and extraction occupations (%)
Most Common Occupations - Installation, maintenance, and repair occupations (%)
Most Common Occupations - Production, transportation, and material moving occupations (%)
Most Common Occupations - Production occupations (%)
Most Common Occupations - Transportation occupations (%)
Most Common Occupations - Material moving occupations (%)
People in Group quarters - Institutionalized population (%)
People in Group quarters - Correctional institutions (%)
People in Group quarters - Federal prisons and detention centers (%)
People in Group quarters - Halfway houses (%)
People in Group quarters - Local jails and other confinement facilities (including police lockups) (%)
People in Group quarters - Military disciplinary barracks (%)
People in Group quarters - State prisons (%)
People in Group quarters - Other types of correctional institutions (%)
People in Group quarters - Nursing homes (%)
People in Group quarters - Hospitals/wards, hospices, and schools for the handicapped (%)
People in Group quarters - Hospitals/wards and hospices for chronically ill (%)
People in Group quarters - Hospices or homes for chronically ill (%)
People in Group quarters - Military hospitals or wards for chronically ill (%)
People in Group quarters - Other hospitals or wards for chronically ill (%)
People in Group quarters - Hospitals or wards for drug/alcohol abuse (%)
People in Group quarters - Mental (Psychiatric) hospitals or wards (%)
People in Group quarters - Schools, hospitals, or wards for the mentally retarded (%)
People in Group quarters - Schools, hospitals, or wards for the physically handicapped (%)
People in Group quarters - Institutions for the deaf (%)
People in Group quarters - Institutions for the blind (%)
People in Group quarters - Orthopedic wards and institutions for the physically handicapped (%)
People in Group quarters - Wards in general hospitals for patients who have no usual home elsewhere (%)
People in Group quarters - Wards in military hospitals for patients who have no usual home elsewhere (%)
People in Group quarters - Juvenile institutions (%)
People in Group quarters - Long-term care (%)
People in Group quarters - Homes for abused, dependent, and neglected children (%)
People in Group quarters - Residential treatment centers for emotionally disturbed children (%)
People in Group quarters - Training schools for juvenile delinquents (%)
People in Group quarters - Short-term care, detention or diagnostic centers for delinquent children (%)
People in Group quarters - Type of juvenile institution unknown (%)
People in Group quarters - Noninstitutionalized population (%)
People in Group quarters - College dormitories (includes college quarters off campus) (%)
People in Group quarters - Military quarters (%)
People in Group quarters - On base (%)
People in Group quarters - Barracks, unaccompanied personnel housing (UPH), (Enlisted/Officer), ;and similar group living quarters for military personnel (%)
People in Group quarters - Transient quarters for temporary residents (%)
People in Group quarters - Military ships (%)
People in Group quarters - Group homes (%)
People in Group quarters - Homes or halfway houses for drug/alcohol abuse (%)
People in Group quarters - Homes for the mentally ill (%)
People in Group quarters - Homes for the mentally retarded (%)
People in Group quarters - Homes for the physically handicapped (%)
People in Group quarters - Other group homes (%)
People in Group quarters - Religious group quarters (%)
People in Group quarters - Dormitories (%)
People in Group quarters - Agriculture workers' dormitories on farms (%)
People in Group quarters - Job Corps and vocational training facilities (%)
People in Group quarters - Other workers' dormitories (%)
People in Group quarters - Crews of maritime vessels (%)
People in Group quarters - Other nonhousehold living situations (%)
People in Group quarters - Other noninstitutional group quarters (%)
Residents speaking English at home (%)
Residents speaking English at home - Born in the United States (%)
Residents speaking English at home - Native, born elsewhere (%)
Residents speaking English at home - Foreign born (%)
Residents speaking Spanish at home (%)
Residents speaking Spanish at home - Born in the United States (%)
Residents speaking Spanish at home - Native, born elsewhere (%)
Residents speaking Spanish at home - Foreign born (%)
Residents speaking other language at home (%)
Residents speaking other language at home - Born in the United States (%)
Residents speaking other language at home - Native, born elsewhere (%)
Residents speaking other language at home - Foreign born (%)
Class of Workers - Employee of private company (%)
Class of Workers - Self-employed in own incorporated business (%)
Class of Workers - Private not-for-profit wage and salary workers (%)
Class of Workers - Local government workers (%)
Class of Workers - State government workers (%)
Class of Workers - Federal government workers (%)
Class of Workers - Self-employed workers in own not incorporated business and Unpaid family workers (%)
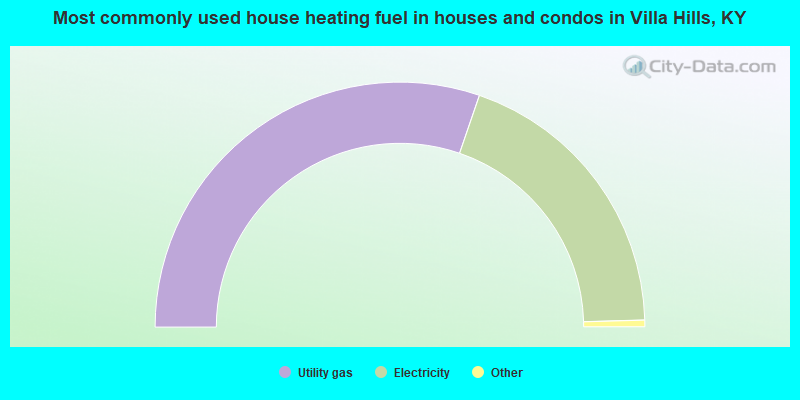
House heating fuel used in houses and condos - Utility gas (%)
House heating fuel used in houses and condos - Bottled, tank, or LP gas (%)
House heating fuel used in houses and condos - Electricity (%)
House heating fuel used in houses and condos - Fuel oil, kerosene, etc. (%)
House heating fuel used in houses and condos - Coal or coke (%)
House heating fuel used in houses and condos - Wood (%)
House heating fuel used in houses and condos - Solar energy (%)
House heating fuel used in houses and condos - Other fuel (%)
House heating fuel used in houses and condos - No fuel used (%)
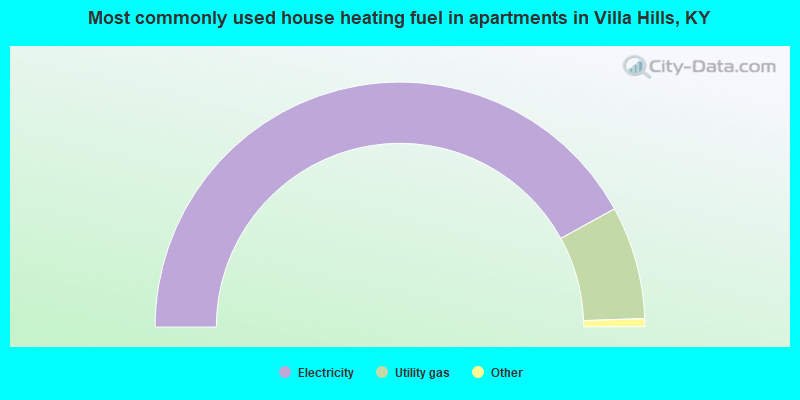
House heating fuel used in apartments - Utility gas (%)
House heating fuel used in apartments - Bottled, tank, or LP gas (%)
House heating fuel used in apartments - Electricity (%)
House heating fuel used in apartments - Fuel oil, kerosene, etc. (%)
House heating fuel used in apartments - Coal or coke (%)
House heating fuel used in apartments - Wood (%)
House heating fuel used in apartments - Solar energy (%)
House heating fuel used in apartments - Other fuel (%)
House heating fuel used in apartments - No fuel used (%)
Armed forces status - In Armed Forces (%)
Armed forces status - Civilian (%)
Armed forces status - Civilian - Veteran (%)
Armed forces status - Civilian - Nonveteran (%)
Fatal accidents locations in years 2005-2021
Fatal accidents locations in 2005
Fatal accidents locations in 2006
Fatal accidents locations in 2007
Fatal accidents locations in 2008
Fatal accidents locations in 2009
Fatal accidents locations in 2010
Fatal accidents locations in 2011
Fatal accidents locations in 2012
Fatal accidents locations in 2013
Fatal accidents locations in 2014
Fatal accidents locations in 2015
Fatal accidents locations in 2016
Fatal accidents locations in 2017
Fatal accidents locations in 2018
Fatal accidents locations in 2019
Fatal accidents locations in 2020
Fatal accidents locations in 2021
Alcohol use - People drinking some alcohol every month (%)
Alcohol use - People not drinking at all (%)
Alcohol use - Average days/month drinking alcohol
Alcohol use - Average drinks/week
Alcohol use - Average days/year people drink much
Audiometry - Average condition of hearing (%)
Audiometry - People that can hear a whisper from across a quiet room (%)
Audiometry - People that can hear normal voice from across a quiet room (%)
Audiometry - Ears ringing, roaring, buzzing (%)
Audiometry - Had a job exposure to loud noise (%)
Audiometry - Had off-work exposure to loud noise (%)
Blood Pressure & Cholesterol - Has high blood pressure (%)
Blood Pressure & Cholesterol - Checking blood pressure at home (%)
Blood Pressure & Cholesterol - Frequently checking blood cholesterol (%)
Blood Pressure & Cholesterol - Has high cholesterol level (%)
Consumer Behavior - Money monthly spent on food at supermarket/grocery store
Consumer Behavior - Money monthly spent on food at other stores
Consumer Behavior - Money monthly spent on eating out
Consumer Behavior - Money monthly spent on carryout/delivered foods
Consumer Behavior - Income spent on food at supermarket/grocery store (%)
Consumer Behavior - Income spent on food at other stores (%)
Consumer Behavior - Income spent on eating out (%)
Consumer Behavior - Income spent on carryout/delivered foods (%)
Current Health Status - General health condition (%)
Current Health Status - Blood donors (%)
Current Health Status - Has blood ever tested for HIV virus (%)
Current Health Status - Left-handed people (%)
Dermatology - People using sunscreen (%)
Diabetes - Diabetics (%)
Diabetes - Had a blood test for high blood sugar (%)
Diabetes - People taking insulin (%)
Diet Behavior & Nutrition - Diet health (%)
Diet Behavior & Nutrition - Milk product consumption (# of products/month)
Diet Behavior & Nutrition - Meals not home prepared (#/week)
Diet Behavior & Nutrition - Meals from fast food or pizza place (#/week)
Diet Behavior & Nutrition - Ready-to-eat foods (#/month)
Diet Behavior & Nutrition - Frozen meals/pizza (#/month)
Drug Use - People that ever used marijuana or hashish (%)
Drug Use - Ever used hard drugs (%)
Drug Use - Ever used any form of cocaine (%)
Drug Use - Ever used heroin (%)
Drug Use - Ever used methamphetamine (%)
Health Insurance - People covered by health insurance (%)
Kidney Conditions-Urology - Avg. # of times urinating at night
Medical Conditions - People with asthma (%)
Medical Conditions - People with anemia (%)
Medical Conditions - People with psoriasis (%)
Medical Conditions - People with overweight (%)
Medical Conditions - Elderly people having difficulties in thinking or remembering (%)
Medical Conditions - People who ever received blood transfusion (%)
Medical Conditions - People having trouble seeing even with glass/contacts (%)
Medical Conditions - People with arthritis (%)
Medical Conditions - People with gout (%)
Medical Conditions - People with congestive heart failure (%)
Medical Conditions - People with coronary heart disease (%)
Medical Conditions - People with angina pectoris (%)
Medical Conditions - People who ever had heart attack (%)
Medical Conditions - People who ever had stroke (%)
Medical Conditions - People with emphysema (%)
Medical Conditions - People with thyroid problem (%)
Medical Conditions - People with chronic bronchitis (%)
Medical Conditions - People with any liver condition (%)
Medical Conditions - People who ever had cancer or malignancy (%)
Mental Health - People who have little interest in doing things (%)
Mental Health - People feeling down, depressed, or hopeless (%)
Mental Health - People who have trouble sleeping or sleeping too much (%)
Mental Health - People feeling tired or having little energy (%)
Mental Health - People with poor appetite or overeating (%)
Mental Health - People feeling bad about themself (%)
Mental Health - People who have trouble concentrating on things (%)
Mental Health - People moving or speaking slowly or too fast (%)
Mental Health - People having thoughts they would be better off dead (%)
Oral Health - Average years since last visit a dentist
Oral Health - People embarrassed because of mouth (%)
Oral Health - People with gum disease (%)
Oral Health - General health of teeth and gums (%)
Oral Health - Average days a week using dental floss/device
Oral Health - Average days a week using mouthwash for dental problem
Oral Health - Average number of teeth
Pesticide Use - Households using pesticides to control insects (%)
Pesticide Use - Households using pesticides to kill weeds (%)
Physical Activity - People doing vigorous-intensity work activities (%)
Physical Activity - People doing moderate-intensity work activities (%)
Physical Activity - People walking or bicycling (%)
Physical Activity - People doing vigorous-intensity recreational activities (%)
Physical Activity - People doing moderate-intensity recreational activities (%)
Physical Activity - Average hours a day doing sedentary activities
Physical Activity - Average hours a day watching TV or videos
Physical Activity - Average hours a day using computer
Physical Functioning - People having limitations keeping them from working (%)
Physical Functioning - People limited in amount of work they can do (%)
Physical Functioning - People that need special equipment to walk (%)
Physical Functioning - People experiencing confusion/memory problems (%)
Physical Functioning - People requiring special healthcare equipment (%)
Prescription Medications - Average number of prescription medicines taking
Preventive Aspirin Use - Adults 40+ taking low-dose aspirin (%)
Reproductive Health - Vaginal deliveries (%)
Reproductive Health - Cesarean deliveries (%)
Reproductive Health - Deliveries resulted in a live birth (%)
Reproductive Health - Pregnancies resulted in a delivery (%)
Reproductive Health - Women breastfeeding newborns (%)
Reproductive Health - Women that had a hysterectomy (%)
Reproductive Health - Women that had both ovaries removed (%)
Reproductive Health - Women that have ever taken birth control pills (%)
Reproductive Health - Women taking birth control pills (%)
Reproductive Health - Women that have ever used Depo-Provera or injectables (%)
Reproductive Health - Women that have ever used female hormones (%)
Sexual Behavior - People 18+ that ever had sex (vaginal, anal, or oral) (%)
Sexual Behavior - Males 18+ that ever had vaginal sex with a woman (%)
Sexual Behavior - Males 18+ that ever performed oral sex on a woman (%)
Sexual Behavior - Males 18+ that ever had anal sex with a woman (%)
Sexual Behavior - Males 18+ that ever had any sex with a man (%)
Sexual Behavior - Females 18+ that ever had vaginal sex with a man (%)
Sexual Behavior - Females 18+ that ever performed oral sex on a man (%)
Sexual Behavior - Females 18+ that ever had anal sex with a man (%)
Sexual Behavior - Females 18+ that ever had any kind of sex with a woman (%)
Sexual Behavior - Average age people first had sex
Sexual Behavior - Average number of female sex partners in lifetime (males 18+)
Sexual Behavior - Average number of female vaginal sex partners in lifetime (males 18+)
Sexual Behavior - Average age people first performed oral sex on a woman (18+)
Sexual Behavior - Average number of woman performed oral sex on in lifetime (18+)
Sexual Behavior - Average number of male sex partners in lifetime (males 18+)
Sexual Behavior - Average number of male anal sex partners in lifetime (males 18+)
Sexual Behavior - Average age people first performed oral sex on a man (18+)
Sexual Behavior - Average number of male oral sex partners in lifetime (18+)
Sexual Behavior - People using protection when performing oral sex (%)
Sexual Behavior - Average number of times people have vaginal or anal sex a year
Sexual Behavior - People having sex without condom (%)
Sexual Behavior - Average number of male sex partners in lifetime (females 18+)
Sexual Behavior - Average number of male vaginal sex partners in lifetime (females 18+)
Sexual Behavior - Average number of female sex partners in lifetime (females 18+)
Sexual Behavior - Circumcised males 18+ (%)
Sleep Disorders - Average hours sleeping at night
Sleep Disorders - People that has trouble sleeping (%)
Smoking-Cigarette Use - People smoking cigarettes (%)
Taste & Smell - People 40+ having problems with smell (%)
Taste & Smell - People 40+ having problems with taste (%)
Taste & Smell - People 40+ that ever had wisdom teeth removed (%)
Taste & Smell - People 40+ that ever had tonsils teeth removed (%)
Taste & Smell - People 40+ that ever had a loss of consciousness because of a head injury (%)
Taste & Smell - People 40+ that ever had a broken nose or other serious injury to face or skull (%)
Taste & Smell - People 40+ that ever had two or more sinus infections (%)
Weight - Average height (inches)
Weight - Average weight (pounds)
Weight - Average BMI
Weight - People that are obese (%)
Weight - People that ever were obese (%)
Weight - People trying to lose weight (%)
According to our research of Kentucky and other state lists, there were 2 registered sex offenders living in Villa Hills, Kentucky as of June 15, 2024 . The ratio of all residents to sex offenders in Villa Hills is 3,723 to 1.The ratio of registered sex offenders to all residents in this city is much lower than the state average.
Officers per 1,000 residents here:
1.87Kentucky average:
1.89
Latest news from Villa Hills, KY collected exclusively by city-data.com from local newspapers, TV, and radio stations
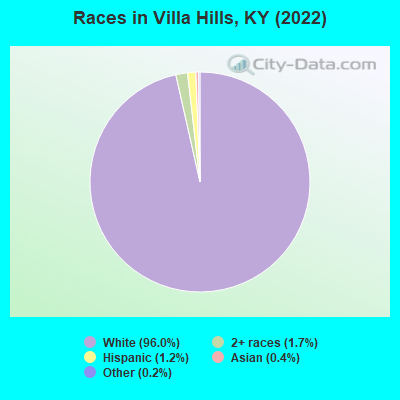
Ancestries: German (29.8%), Irish (23.8%), English (14.0%), American (12.7%), European (3.4%), Polish (2.3%).
Current Local Time:
Incorporated on 06/07/1962
Land area: 3.71 square miles.
Population density: 2,006 people per square mile (low).
50 residents are foreign born
This city:
0.7%Kentucky:
4.1%
Median real estate property taxes paid for housing units with mortgages in 2022: $3,094 (0.9%)Median real estate property taxes paid for housing units with no mortgage in 2022: $2,568 (0.9%)
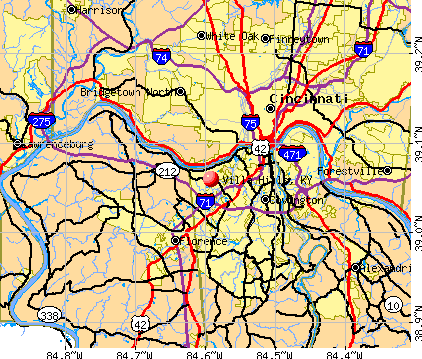
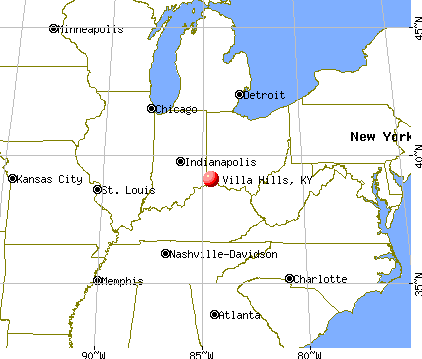
Nearest city with pop. 50,000+: Cincinnati, OH
Nearest city with pop. 1,000,000+: Chicago, IL
Nearest cities:
Latitude: 39.06 N, Longitude: 84.59 W
Daytime population change due to commuting: -2,696 (-36.5%)Workers who live and work in this city: 1,073 (26.5%)
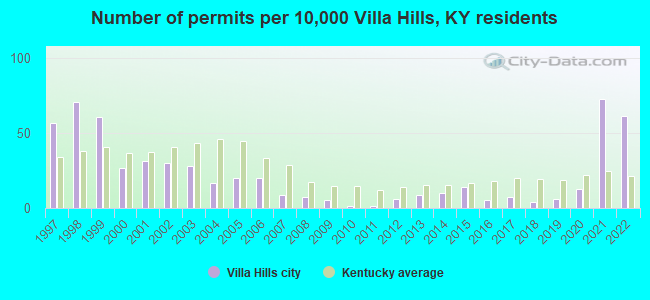
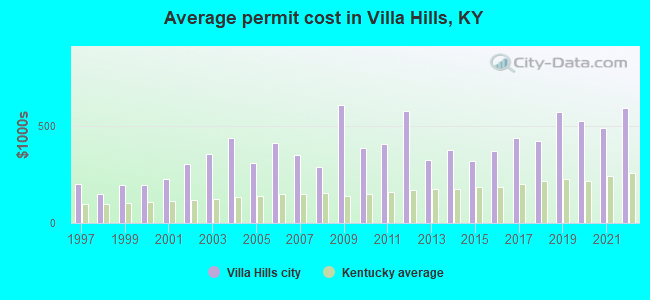
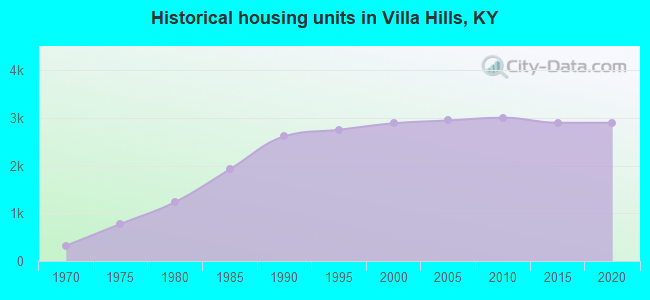
Single-family new house construction building permits:
2022: 49 buildings , average cost: $594,7002021: 58 buildings , average cost: $491,4002020: 10 buildings , average cost: $525,6002019: 5 buildings , average cost: $570,5002018: 3 buildings , average cost: $422,6002017: 6 buildings , average cost: $436,7002016: 4 buildings , average cost: $372,5002015: 11 buildings , average cost: $322,4002014: 8 buildings , average cost: $378,6002013: 7 buildings , average cost: $323,2002012: 5 buildings , average cost: $577,6002011: 1 building , cost: $410,0002010: 1 building , cost: $386,0002009: 4 buildings , average cost: $609,8002008: 6 buildings , average cost: $287,5002007: 7 buildings , average cost: $350,6002006: 16 buildings , average cost: $410,8002005: 16 buildings , average cost: $311,5002004: 13 buildings , average cost: $440,1002003: 22 buildings , average cost: $355,0002002: 24 buildings , average cost: $301,9002001: 25 buildings , average cost: $227,7002000: 21 buildings , average cost: $197,0001999: 48 buildings , average cost: $197,3001998: 56 buildings , average cost: $149,8001997: 45 buildings , average cost: $199,400Unemployment in December 2023:
Population change in the 1990s: +466 (+6.2%).
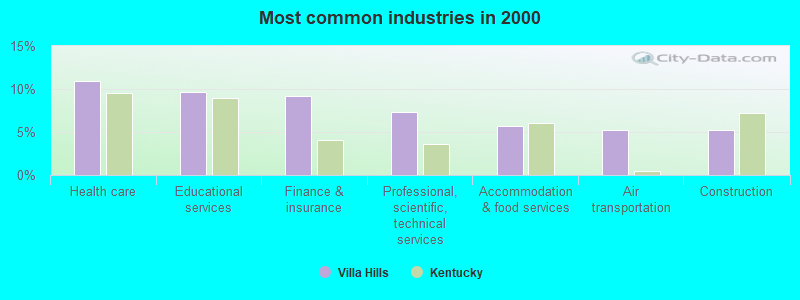
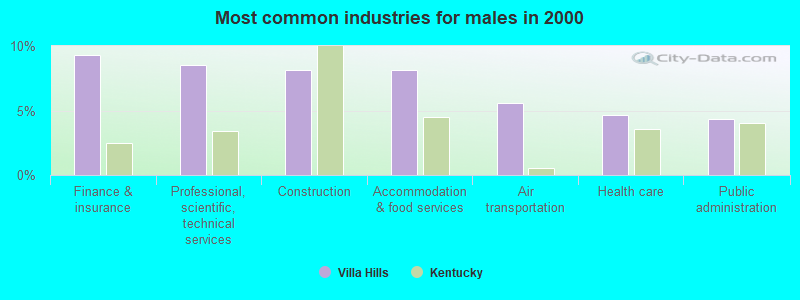
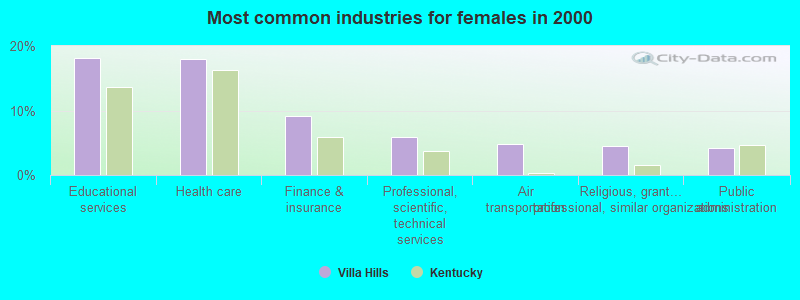
Most common industries in Villa Hills, KY (%)
Both Males Females
Health care (10.9%)
Educational services (9.7%)
Finance & insurance (9.2%)
Professional, scientific, technical services (7.3%)
Accommodation & food services (5.7%)
Air transportation (5.2%)
Construction (5.2%)
Finance & insurance (9.3%)
Professional, scientific, technical services (8.5%)
Construction (8.2%)
Accommodation & food services (8.2%)
Air transportation (5.6%)
Health care (4.6%)
Public administration (4.4%)
Educational services (18.2%)
Health care (18.1%)
Finance & insurance (9.2%)
Professional, scientific, technical services (5.9%)
Air transportation (4.8%)
Religious, grantmaking, civic, professional, similar organizations (4.5%)
Public administration (4.2%)
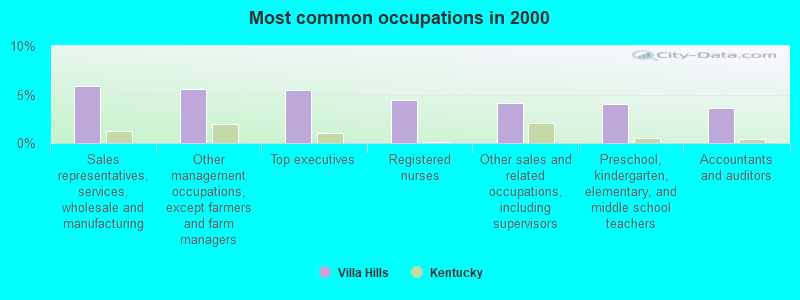
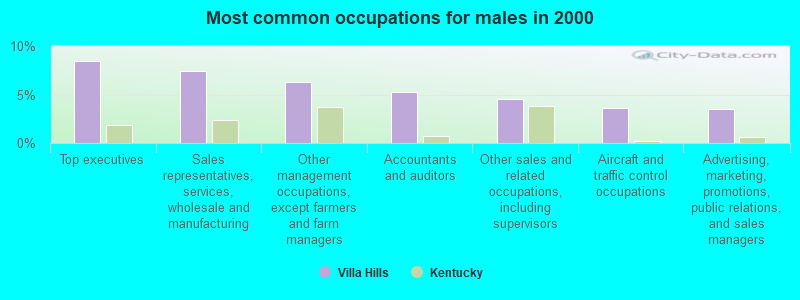
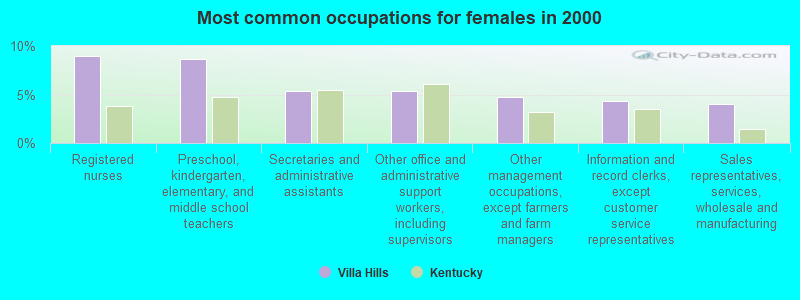
Most common occupations in Villa Hills, KY (%)
Both Males Females
Sales representatives, services, wholesale and manufacturing (5.9%)
Other management occupations, except farmers and farm managers (5.6%)
Top executives (5.4%)
Registered nurses (4.4%)
Other sales and related occupations, including supervisors (4.1%)
Preschool, kindergarten, elementary, and middle school teachers (4.1%)
Accountants and auditors (3.6%)
Top executives (8.4%)
Sales representatives, services, wholesale and manufacturing (7.5%)
Other management occupations, except farmers and farm managers (6.3%)
Accountants and auditors (5.2%)
Other sales and related occupations, including supervisors (4.6%)
Aircraft and traffic control occupations (3.6%)
Advertising, marketing, promotions, public relations, and sales managers (3.5%)
Registered nurses (9.0%)
Preschool, kindergarten, elementary, and middle school teachers (8.7%)
Secretaries and administrative assistants (5.4%)
Other office and administrative support workers, including supervisors (5.4%)
Other management occupations, except farmers and farm managers (4.8%)
Information and record clerks, except customer service representatives (4.4%)
Sales representatives, services, wholesale and manufacturing (4.0%)
Tornado activity:
Villa Hills-area historical tornado activity is slightly above Kentucky state average. It is 68% greater than the overall U.S. average.
On 4/3/1974, a category F5 (max. wind speeds 261-318 mph) tornado 11.3 miles away from the Villa Hills city center killed 3 people and injured 210 people .
On 4/3/1974, a category F4 (max. wind speeds 207-260 mph) tornado 10.3 miles away from the city center killed 2 people and injured 39 people and caused between $50,000 and $500,000 in damages.
Earthquake activity:
Villa Hills-area historical earthquake activity is significantly above Kentucky state average. It is 52% greater than the overall U.S. average. On 7/27/1980 at 18:52:21, a magnitude 5.2 (5.1 MB, 4.7 MS, 5.0 UK, 5.2 UK, Class: Moderate, Intensity: VI - VII) earthquake occurred 68.7 miles away from Villa Hills center On 4/18/2008 at 09:36:59, a magnitude 5.4 (5.1 MB, 4.8 MS, 5.4 MW, 5.2 MW) earthquake occurred 182.6 miles away from the city center On 4/18/2008 at 09:36:59, a magnitude 5.2 (5.2 MW, Depth: 8.9 mi) earthquake occurred 182.6 miles away from Villa Hills center On 6/10/1987 at 23:48:54, a magnitude 5.1 (4.9 MB, 4.4 MS, 4.6 MS, 5.1 LG) earthquake occurred 177.9 miles away from the city center On 9/7/1988 at 02:28:09, a magnitude 4.6 (4.5 MB, 4.6 LG, Class: Light, Intensity: IV - V) earthquake occurred 74.2 miles away from the city center On 6/18/2002 at 17:37:15, a magnitude 5.0 (4.3 MB, 4.6 MW, 5.0 LG) earthquake occurred 187.8 miles away from Villa Hills center Magnitude types: regional Lg-wave magnitude (LG), body-wave magnitude (MB), surface-wave magnitude (MS), moment magnitude (MW) Natural disasters: The number of natural disasters in Kenton County (10) is smaller than the US average (15).Major Disasters (Presidential) Declared: 6Emergencies Declared: 2Floods: 5, Storms: 5, Tornadoes: 3, Winds: 2, Winter Storms: 2, Blizzard: 1, Hurricane: 1, Landslide: 1, Mudslide: 1, Tropical Depression: 1, Other: 1 (Note: some incidents may be assigned to more than one category). Hospitals and medical centers in Villa Hills: MADONNA MANOR (2344 AMSTERDAM ROAD)
Other hospitals and medical centers near Villa Hills: LIBERTY NURSING CENTER OF RIVERSIDE (Nursing Home, about 2 miles away; CINCINNATI, OH)
VILLAGE CARE CENTER (Nursing Home, about 3 miles away; ERLANGER, KY)
DAVITA - DELHI DIALYSIS (Dialysis Facility, about 3 miles away; CINCINNATI, OH)
CARETENDERS OF NORTHERN KY (Home Health Center, about 3 miles away; EDGEWOOD, KY)
AMEDISYS HOME HEALTH OF KENTUCKY (Home Health Center, about 4 miles away; CRESTVIEW HILLS, KY)
NORTHKEY COMMUNITY CARE INTENSIVE SERV (Hospital, about 4 miles away; COVINGTON, KY)
ST CHARLES CARE CENTER (Nursing Home, about 4 miles away; COVINGTON, KY)
Amtrak station near Villa Hills: 5 miles: CINCINNATI (1301 WESTERN AVE.) Services: ticket office, fully wheelchair accessible, enclosed waiting area, public restrooms, public payphones, full-service food facilities, free short-term parking, paid long-term parking, taxi stand.
Colleges/universities with over 2000 students nearest to Villa Hills:
College of Mount St Joseph (about 4 miles; Cincinnati, OH ; Full-time enrollment: 2,073)
University of Cincinnati-Main Campus (about 7 miles; Cincinnati, OH ; FT enrollment: 28,747)
Cincinnati State Technical and Community College (about 7 miles; Cincinnati, OH ; FT enrollment: 8,757)
Northern Kentucky University (about 8 miles; Highland Heights, KY ; FT enrollment: 12,059)
Gateway Community and Technical College (about 8 miles; Florence, KY ; FT enrollment: 2,422)
Xavier University (about 9 miles; Cincinnati, OH ; FT enrollment: 6,143)
University of Cincinnati-Blue Ash College (about 16 miles; Blue Ash, OH ; FT enrollment: 3,711)
Public elementary/middle school in Villa Hills:
Private elementary/middle school in Villa Hills: VILLA MADONNA ACADEMY ELEM AND JR HIGH SCHOOL Students: 333, Location: 2500 AMSTERDAM RD, Grades: KG-8)
See full list of schools located in Villa Hills Birthplace of: Brett Dietz - Football player and coach, Nate Dusing - Swimmer.
Kenton County has a predicted average indoor radon screening level between 2 and 4 pCi/L (pico curies per liter) - Moderate Potential Average household size: This city:
2.6 peopleKentucky:
2.5 people
Percentage of family households: This city:
73.8%Whole state:
66.9%
Percentage of households with unmarried partners: This city:
4.7%Whole state:
6.4%
Likely homosexual households (counted as self-reported same-sex unmarried-partner households)
Lesbian couples: 0.5% of all households Gay men: 0.2% of all households
63 people in other noninstitutional facilities in 2010people in nursing facilities/skilled-nursing facilities in 2010people in religious group quarters in 2000people in nursing homes in 2000
For population 15 years and over in Villa Hills:
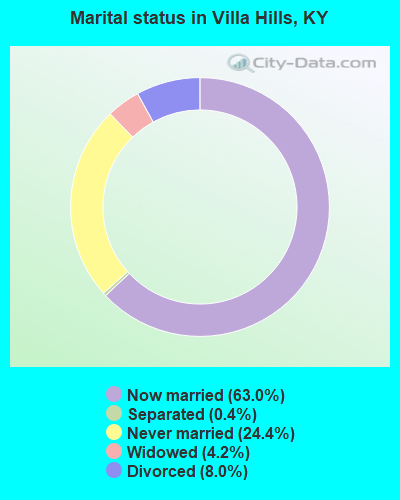
Never married: 24.4%Now married: 63.0%Separated: 0.4%Widowed: 4.2%Divorced: 8.0% For population 25 years and over in Villa Hills:
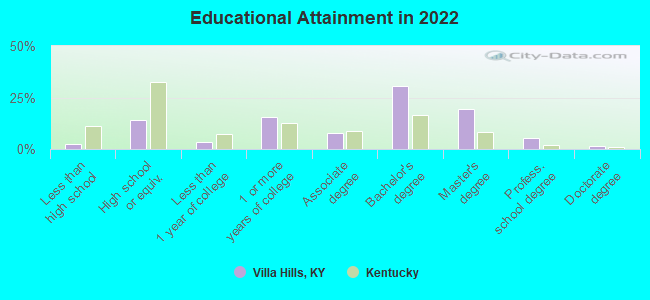
High school or higher: 97.3%Bachelor's degree or higher: 55.0%Graduate or professional degree: 27.2%Unemployed: 2.0%Mean travel time to work (commute): 19.3 minutes
Education Gini index (Inequality in education) Here:
9.2Kentucky average:
11.7
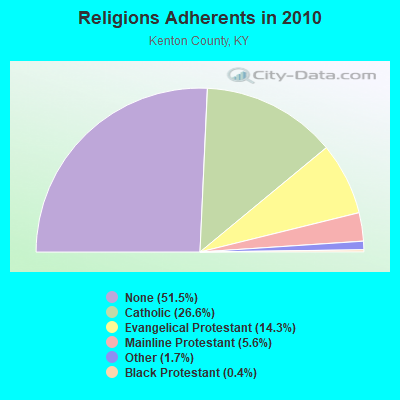
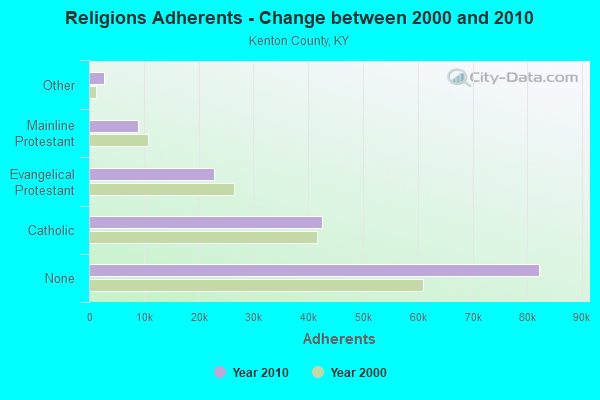
Religion statistics for Villa Hills, KY (based on Kenton County data)
Religion Adherents Congregations Catholic 42,500 20 Evangelical Protestant 22,877 85 Mainline Protestant 8,904 30 Other 2,658 8 Black Protestant 597 5 None 82,184 -
Source: Clifford Grammich, Kirk Hadaway, Richard Houseal, Dale E.Jones, Alexei Krindatch, Richie Stanley and Richard H.Taylor. 2012. 2010 U.S.Religion Census: Religious Congregations & Membership Study. Association of Statisticians of American Religious Bodies. Jones, Dale E., et al. 2002. Congregations and Membership in the United States 2000. Nashville, TN: Glenmary Research Center. Graphs represent county-level data
Food Environment Statistics: Number of grocery stores : 27This county :
1.72 / 10,000 pop.Kentucky :
2.19 / 10,000 pop.
Number of convenience stores (no gas) : 15This county :
0.96 / 10,000 pop.Kentucky :
0.74 / 10,000 pop.
Number of convenience stores (with gas) : 52Here :
3.32 / 10,000 pop.Kentucky :
4.36 / 10,000 pop.
Number of full-service restaurants : 108Here :
6.90 / 10,000 pop.Kentucky :
5.74 / 10,000 pop.
Adult diabetes rate : This county :
9.4%State :
11.0%
Adult obesity rate : Kenton County :
26.9%Kentucky :
30.0%
Low-income preschool obesity rate : Health and Nutrition: Healthy diet rate : This city:
51.2%Kentucky:
49.9%
Average overall health of teeth and gums : Average BMI : This city:
28.9Kentucky:
28.6
People feeling badly about themselves : People not drinking alcohol at all : Average hours sleeping at night : Overweight people : This city:
36.6%Kentucky:
33.8%
General health condition : Villa Hills:
58.8%Kentucky:
56.8%
Average condition of hearing : Villa Hills:
79.6%Kentucky:
78.9%
More about Health and Nutrition of Villa Hills, KY Residents
Local government employment and payroll (March 2022)
Function
Full-time employees
Monthly full-time payroll
Average yearly full-time wage
Part-time employees
Monthly part-time payroll
Police Protection - Officers
15 $81,182 $64,946 0 $0 Streets and Highways
4 $20,542 $61,626 1 $1,771 Other Government Administration
2 $13,672 $82,032 6 $3,385 Parks and Recreation
0 $0 1 $930 Police - Other
0 $0 1 $465
Totals for Government
21 $115,396 $65,941 9 $6,552
Villa Hills government finances - Expenditure in 2021 (per resident):
Construction - Regular Highways: $327,000 ($43.98)
Current Operations - Police Protection: $1,191,000 ($160.19)
Regular Highways: $962,000 ($129.39)Solid Waste Management: $484,000 ($65.10)Central Staff Services: $369,000 ($49.63)Parks and Recreation: $35,000 ($4.71)Public Welfare - Other: $10,000 ($1.34)Protective Inspection and Regulation - Other: $3,000 ($0.40)General - Interest on Debt: $23,000 ($3.09)
Intergovernmental to Local - Other - General - Other: $619,000 ($83.25)
Other Capital Outlay - Regular Highways: $49,000 ($6.59)
Police Protection: $33,000 ($4.44)Parks and Recreation: $3,000 ($0.40)Total Salaries and Wages: $1,351,000 ($181.71)
Villa Hills government finances - Revenue in 2021 (per resident):
Charges - Solid Waste Management: $484,000 ($65.10)
Other: $7,000 ($0.94)Federal Intergovernmental - Other: $404,000 ($54.34)
Local Intergovernmental - Other: $743,000 ($99.93)
Miscellaneous - Special Assessments: $510,000 ($68.59)
Sale of Property: $39,000 ($5.25)Fines and Forfeits: $11,000 ($1.48)Interest Earnings: $7,000 ($0.94)Donations From Private Sources: $4,000 ($0.54)State Intergovernmental - Highways: $146,000 ($19.64)
Other: $89,000 ($11.97)General Local Government Support: $6,000 ($0.81)Tax - Property: $1,651,000 ($222.06)
Insurance Premiums Sales: $648,000 ($87.16)Individual Income: $577,000 ($77.61)Public Utilities Sales: $153,000 ($20.58)Corporation Net Income: $71,000 ($9.55)Occupation and Business License - Other: $59,000 ($7.94)
Villa Hills government finances - Debt in 2021 (per resident):
Long Term Debt - Issue, Nonguaranteed - Public Debt for Private Purpose: $3,402,000 ($457.57)
Outstanding Nonguaranteed - Industrial Revenue: $3,394,000 ($456.49)Beginning Outstanding - Unspecified Public Purpose: $698,000 ($93.88)Outstanding Unspecified Public Purpose: $575,000 ($77.34)Retired Unspecified Public Purpose: $192,000 ($25.82)Issue, Unspecified Public Purpose: $68,000 ($9.15)Retired Nonguaranteed - Public Debt for Private Purpose: $8,000 ($1.08)
Villa Hills government finances - Cash and Securities in 2021 (per resident):
Other Funds - Cash and Securities: $2,762,000 ($371.49)
Sinking Funds - Cash and Securities: $3,394,000 ($456.49)
Businesses in Villa Hills, KY
Strongest AM radio stations in Villa Hills:
WSAI (1530 AM; 50 kW; CINCINNATI, OH; Owner: JACOR BROADCASTING CORPORATION)
WNOP (740 AM; 1 kW; NEWPORT, KY; Owner: SACRED HEART RADIO, INC.)
WLW (700 AM; 50 kW; CINCINNATI, OH; Owner: JACOR BROADCASTING CORPORATION)
WKRC (550 AM; 5 kW; CINCINNATI, OH; Owner: JACOR BROADCASTING CORPORATION)
WBOB (1160 AM; 5 kW; FLORENCE, KY; Owner: CARON BROADCASTING, INC.)
WTSJ (1050 AM; 1 kW; CINCINNATI, OH; Owner: CARON BROADCASTING, INC.)
WCIN (1480 AM; 5 kW; CINCINNATI, OH)
WCKY (1360 AM; 5 kW; CINCINNATI, OH; Owner: JACOR BROADCASTING CORPORATION)
WDBZ (1230 AM; 1 kW; CINCINNATI, OH; Owner: BLUE CHIP COMMUNICATIONS, INC.)
WCVG (1320 AM; 0 kW; COVINGTON, KY; Owner: RICHARD L. PLESSINGER SR.)
WHAS (840 AM; 50 kW; LOUISVILLE, KY; Owner: CLEAR CHANNEL BROADCASTING LICENSES, INC.)
WCNW (1560 AM; daytime; 5 kW; FAIRFIELD, OH)
WTVN (610 AM; 50 kW; COLUMBUS, OH; Owner: CITICASTERS LICENSES, L.P.)
Strongest FM radio stations in Villa Hills:
WEBN (102.7 FM; CINCINNATI, OH; Owner: JACOR BROADCASTING CORPORATION)
WVMX (94.1 FM; CINCINNATI, OH; Owner: CITICASTERS LICENSES, L.P.)
WOFX-FM (92.5 FM; CINCINNATI, OH; Owner: JACOR BROADCASTING CORPORATION)
WIZF (100.9 FM; ERLANGER, KY; Owner: BLUE CHIP BROADCASTING LICENSES II, LTD.)
WGUC (90.9 FM; CINCINNATI, OH; Owner: CINCINNATI CLASSICAL PUBLIC RADIO, INC.)
WKRQ (101.9 FM; CINCINNATI, OH; Owner: INFINITY RADIO OPERATIONS INC.)
WKFS (107.1 FM; MILFORD, OH; Owner: JACOR BROADCASTING CORPORATION)
WUBE-FM (105.1 FM; CINCINNATI, OH; Owner: INFINITY RADIO OPERATIONS INC.)
WVXU (91.7 FM; CINCINNATI, OH; Owner: XAVIER UNIVERSITY)
WGRR (103.5 FM; HAMILTON, OH; Owner: INFINITY RADIO OPERATIONS INC.)
WRRM (98.5 FM; CINCINNATI, OH; Owner: WRRM LICO, INC)
WAIF (88.3 FM; CINCINNATI, OH; Owner: STEPCHILD RADIO OF CINCINNATI, INC.)
WNKU (89.7 FM; HIGHLAND HEIGHTS, KY; Owner: BD. OF REGENTS ON N. KY UNIV.)
WMOJ (94.9 FM; FAIRFIELD, OH; Owner: WVAE LICO, INC.)
WAKW (93.3 FM; CINCINNATI, OH; Owner: PILLAR OF FIRE)
WYGY (96.5 FM; LEBANON, OH; Owner: WVAE LICO, INC.)
WSCH (99.3 FM; AURORA, IN; Owner: COLUMBUS RADIO, INC.)
WNLT (104.3 FM; HARRISON, OH; Owner: VERNON R. BALDWIN, INC.)
WJYC (90.1 FM; DELHI HILLS, OH; Owner: LIFETALK RADIO, INC.)
WMKV (89.3 FM; READING, OH; Owner: LIFESPHERE)
TV broadcast stations around Villa Hills:
WXIX-TV (Channel 19; NEWPORT, KY; Owner: RAYCOM NATIONAL, INC.)
WLWT (Channel 5; CINCINNATI, OH; Owner: OHIO/OKLAHOMA HEARST-ARGYLE TV, INC)
WSTR-TV (Channel 64; CINCINNATI, OH; Owner: WSTR LICENSEE, INC.)
WCET (Channel 48; CINCINNATI, OH; Owner: THE GREATER CINCINNATI TV EDUC'L. FOUNDATION)
WCPO-TV (Channel 9; CINCINNATI, OH; Owner: SCRIPPS HOWARD BROADCASTING COMPANY)
WKRC-TV (Channel 12; CINCINNATI, OH; Owner: CITICASTERS CO.)
WOTH-LP (Channel 35; CINCINNATI, OH; Owner: ELLIOTT B. BLOCK)
WBQC-CA (Channel 25; CINCINNATI, OH; Owner: ELLIOTT B. BLOCK)
WCVN-TV (Channel 54; COVINGTON, KY; Owner: KENTUCKY AUTHORITY FOR EDUCATIONAL TV)
WPTO (Channel 14; OXFORD, OH; Owner: GREATER DAYTON PUBLIC TELEVISION, INC.)
WKOI (Channel 43; RICHMOND, IN; Owner: TRINITY BROADCASTING OF INDIANA, INC.)
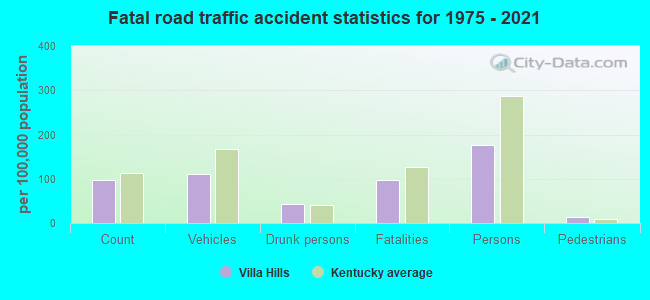
Villa Hills fatal accident statistics for 1975 - 2021
Villa Hills fatal accident list:
Nov 28, 2011 00:15 AM, Sr-08, Lat: 39.069633, Lon: -84.617825, Vehicles: 1, Persons: 1, Fatalities: 1Lat: 39.069690, Lon: -84.611800, Vehicles: 1, Persons: 1, Fatalities: 1, Drunk persons involved: 1Vehicles: 1, Persons: 1, Fatalities: 1, Drunk persons involved: 1Vehicles: 2, Persons: 2, Pedestrians: 1, Fatalities: 1Vehicles: 1, Persons: 6, Fatalities: 1Vehicles: 1, Persons: 1, Fatalities: 1Vehicles: 1, Persons: 1, Fatalities: 1, Drunk persons involved: 1
National Bridge Inventory (NBI) Statistics 2 Number of bridges33ft / 10.5m Total length2,680 Total average daily traffic118 Total average daily truck traffic2,625 Total future (year 2026) average daily traffic
FCC Registered Antenna Towers: 40 (
See the full list of FCC Registered Antenna Towers in Villa Hills )
FCC Registered Commercial Land Mobile Towers: 1
1100 Radio Road (Lat: 39.065833 Lon: -84.608333), Type: Tower, Structure height: 92.3 m, Overall height: 93.5 m, Call Sign: WPTS769, Assigned Frequencies: 455.010 MHz, Grant Date: 12/07/2001, Expiration Date: 10/01/2028, Certifier: Stephen G Davis, Registrant: Iheartmedia, Inc., 7136 S. Yale Avenue, Suite 501, Tulsa, OK 74136, Phone: (918) 664-4581, Fax: (918) 664-3066, Email:
FCC Registered Broadcast Land Mobile Towers: 1
Lat: 39.063889 Lon: -84.591806, Call Sign: WQDV374, Assigned Frequencies: 451.337 MHz, 451.712 MHz, 452.062 MHz, 452.662 MHz, Grant Date: 11/07/2005, Expiration Date: 11/07/2015, Cancellation Date: 01/09/2016, Certifier: James P Lipovsky, Registrant: Mobilcomm, Inc., 1211 W. Sharon Rd., Cincinnati, OH 45240, Phone: (513) 595-5800, Fax: (513) 595-5822FCC Registered Amateur Radio Licenses: 47 (
See the full list of FCC Registered Amateur Radio Licenses in Villa Hills )
FAA Registered Aircraft Manufacturers and Dealers: 2 (
See the full list of FAA Registered Manufacturers and Dealers in Villa Hills )
FAA Registered Aircraft: 18 (
See the full list of FAA Registered Aircraft )
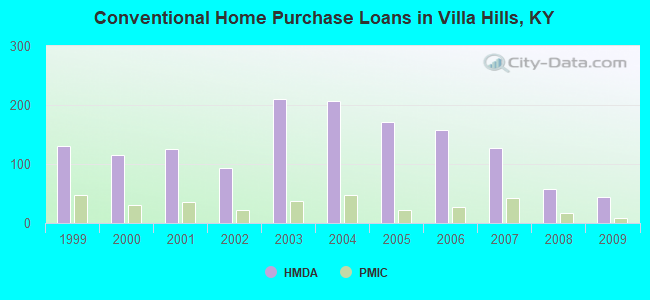
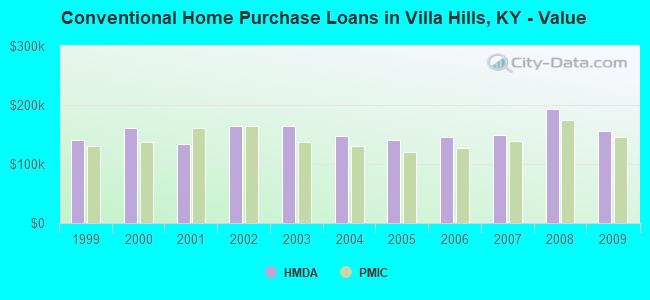
Home Mortgage Disclosure Act Aggregated Statistics For Year 2009(Based on 3 partial tracts) A) FHA, FSA/RHS & VA B) Conventional C) Refinancings D) Home Improvement Loans E) Loans on Dwellings For 5+ Families F) Non-occupant Loans on Number Average Value Number Average Value Number Average Value Number Average Value Number Average Value Number Average Value
LOANS ORIGINATED 27 $129,695 44 $156,667 323 $184,211 7 $57,977 1 $3,176,170 12 $95,002 APPLICATIONS APPROVED, NOT ACCEPTED 2 $89,750 3 $132,603 16 $191,932 4 $23,648 0 $0 1 $2,950 APPLICATIONS DENIED 5 $121,010 9 $130,089 56 $152,349 6 $17,967 0 $0 6 $73,345 APPLICATIONS WITHDRAWN 4 $159,522 5 $188,558 32 $153,812 2 $30,350 0 $0 1 $38,690 FILES CLOSED FOR INCOMPLETENESS 1 $58,420 1 $120,460 7 $184,614 0 $0 0 $0 0 $0
Aggregated Statistics For Year 2008(Based on 3 partial tracts) A) FHA, FSA/RHS & VA B) Conventional C) Refinancings D) Home Improvement Loans F) Non-occupant Loans on G) Loans On Manufactured Number Average Value Number Average Value Number Average Value Number Average Value Number Average Value Number Average Value
LOANS ORIGINATED 32 $119,977 58 $192,623 146 $176,766 16 $50,779 17 $95,691 1 $6,550 APPLICATIONS APPROVED, NOT ACCEPTED 0 $0 6 $124,897 17 $179,578 3 $86,503 3 $119,200 2 $21,515 APPLICATIONS DENIED 4 $106,655 12 $102,706 72 $135,095 11 $36,385 9 $87,064 2 $19,220 APPLICATIONS WITHDRAWN 2 $115,070 8 $204,286 32 $164,313 1 $62,950 2 $127,725 0 $0 FILES CLOSED FOR INCOMPLETENESS 1 $111,540 0 $0 5 $95,804 1 $106,920 0 $0 0 $0
Aggregated Statistics For Year 2007(Based on 3 partial tracts) A) FHA, FSA/RHS & VA B) Conventional C) Refinancings D) Home Improvement Loans E) Loans on Dwellings For 5+ Families F) Non-occupant Loans on G) Loans On Manufactured Number Average Value Number Average Value Number Average Value Number Average Value Number Average Value Number Average Value Number Average Value
LOANS ORIGINATED 8 $124,764 127 $149,956 155 $168,421 25 $35,612 1 $244,470 22 $89,057 1 $13,600 APPLICATIONS APPROVED, NOT ACCEPTED 0 $0 9 $125,264 25 $131,152 7 $61,761 0 $0 1 $122,200 2 $19,860 APPLICATIONS DENIED 4 $105,740 25 $96,282 115 $152,159 19 $65,599 0 $0 8 $96,056 4 $25,855 APPLICATIONS WITHDRAWN 2 $129,655 12 $149,601 34 $146,640 3 $53,440 0 $0 3 $61,467 0 $0 FILES CLOSED FOR INCOMPLETENESS 0 $0 3 $118,017 11 $159,202 0 $0 0 $0 0 $0 0 $0
Aggregated Statistics For Year 2006(Based on 3 partial tracts) A) FHA, FSA/RHS & VA B) Conventional C) Refinancings D) Home Improvement Loans F) Non-occupant Loans on G) Loans On Manufactured Number Average Value Number Average Value Number Average Value Number Average Value Number Average Value Number Average Value
LOANS ORIGINATED 14 $120,401 157 $146,506 159 $131,937 23 $37,808 41 $99,569 1 $57,730 APPLICATIONS APPROVED, NOT ACCEPTED 2 $110,235 18 $142,052 37 $140,917 4 $24,418 4 $60,218 2 $38,030 APPLICATIONS DENIED 2 $93,795 19 $126,315 91 $128,415 20 $38,538 8 $85,826 1 $201,440 APPLICATIONS WITHDRAWN 4 $120,748 16 $157,052 44 $149,584 2 $38,625 4 $115,412 0 $0 FILES CLOSED FOR INCOMPLETENESS 0 $0 2 $137,950 9 $141,023 1 $26,570 1 $22,660 0 $0
Aggregated Statistics For Year 2005(Based on 3 partial tracts) A) FHA, FSA/RHS & VA B) Conventional C) Refinancings D) Home Improvement Loans E) Loans on Dwellings For 5+ Families F) Non-occupant Loans on G) Loans On Manufactured Number Average Value Number Average Value Number Average Value Number Average Value Number Average Value Number Average Value Number Average Value
LOANS ORIGINATED 13 $97,300 172 $140,957 178 $155,875 30 $33,129 1 $41,370 28 $80,605 0 $0 APPLICATIONS APPROVED, NOT ACCEPTED 2 $93,660 23 $110,577 25 $131,869 6 $75,403 0 $0 2 $104,960 2 $13,600 APPLICATIONS DENIED 4 $73,330 28 $94,478 93 $144,233 19 $30,546 0 $0 10 $112,103 6 $53,995 APPLICATIONS WITHDRAWN 1 $127,550 13 $110,151 63 $146,276 5 $110,844 0 $0 7 $113,907 0 $0 FILES CLOSED FOR INCOMPLETENESS 0 $0 3 $111,650 15 $137,645 1 $49,080 0 $0 1 $83,280 0 $0
Aggregated Statistics For Year 2004(Based on 3 partial tracts) A) FHA, FSA/RHS & VA B) Conventional C) Refinancings D) Home Improvement Loans E) Loans on Dwellings For 5+ Families F) Non-occupant Loans on G) Loans On Manufactured Number Average Value Number Average Value Number Average Value Number Average Value Number Average Value Number Average Value Number Average Value
LOANS ORIGINATED 21 $107,379 206 $147,394 257 $142,698 23 $50,264 1 $221,440 29 $78,188 4 $18,748 APPLICATIONS APPROVED, NOT ACCEPTED 1 $77,370 23 $146,627 34 $97,914 6 $60,033 0 $0 3 $47,093 1 $12,990 APPLICATIONS DENIED 5 $88,412 25 $141,971 87 $148,590 17 $27,529 0 $0 4 $134,865 4 $42,212 APPLICATIONS WITHDRAWN 4 $91,732 21 $147,763 58 $130,038 2 $33,155 0 $0 3 $63,117 0 $0 FILES CLOSED FOR INCOMPLETENESS 1 $72,520 5 $146,558 15 $154,591 1 $8,860 0 $0 1 $51,370 0 $0
Aggregated Statistics For Year 2003(Based on 3 partial tracts) A) FHA, FSA/RHS & VA B) Conventional C) Refinancings D) Home Improvement Loans E) Loans on Dwellings For 5+ Families F) Non-occupant Loans on Number Average Value Number Average Value Number Average Value Number Average Value Number Average Value Number Average Value
LOANS ORIGINATED 18 $106,960 210 $164,242 800 $148,851 27 $18,709 1 $335,200 41 $116,266 APPLICATIONS APPROVED, NOT ACCEPTED 2 $84,705 16 $127,779 68 $120,933 5 $43,264 0 $0 4 $107,538 APPLICATIONS DENIED 3 $71,857 18 $95,249 128 $118,713 14 $37,417 0 $0 7 $72,137 APPLICATIONS WITHDRAWN 4 $92,672 15 $142,609 79 $124,540 2 $117,220 0 $0 2 $53,625 FILES CLOSED FOR INCOMPLETENESS 1 $35,460 5 $96,702 21 $158,607 1 $12,590 0 $0 2 $46,080
Aggregated Statistics For Year 2002(Based on 2 partial tracts) A) FHA, FSA/RHS & VA B) Conventional C) Refinancings D) Home Improvement Loans E) Loans on Dwellings For 5+ Families F) Non-occupant Loans on Number Average Value Number Average Value Number Average Value Number Average Value Number Average Value Number Average Value
LOANS ORIGINATED 14 $113,928 93 $164,247 392 $156,359 15 $23,686 1 $62,000 13 $95,155 APPLICATIONS APPROVED, NOT ACCEPTED 0 $0 11 $135,830 44 $140,068 2 $36,990 0 $0 3 $132,273 APPLICATIONS DENIED 2 $103,930 8 $118,444 47 $142,694 8 $7,258 0 $0 1 $47,240 APPLICATIONS WITHDRAWN 2 $86,240 5 $130,056 30 $135,211 2 $45,175 0 $0 1 $40,300 FILES CLOSED FOR INCOMPLETENESS 0 $0 2 $80,410 14 $138,941 1 $82,210 0 $0 0 $0
Aggregated Statistics For Year 2001(Based on 2 partial tracts) A) FHA, FSA/RHS & VA B) Conventional C) Refinancings D) Home Improvement Loans E) Loans on Dwellings For 5+ Families F) Non-occupant Loans on Number Average Value Number Average Value Number Average Value Number Average Value Number Average Value Number Average Value
LOANS ORIGINATED 17 $113,162 125 $134,565 303 $157,019 17 $17,684 1 $193,430 14 $116,948 APPLICATIONS APPROVED, NOT ACCEPTED 1 $147,760 11 $75,467 26 $121,040 7 $26,049 0 $0 2 $147,245 APPLICATIONS DENIED 0 $0 17 $76,918 52 $124,457 10 $14,967 0 $0 3 $87,067 APPLICATIONS WITHDRAWN 1 $192,410 8 $131,140 25 $109,764 2 $21,130 0 $0 2 $43,505 FILES CLOSED FOR INCOMPLETENESS 0 $0 2 $81,920 7 $201,683 1 $16,380 0 $0 1 $35,430
Aggregated Statistics For Year 2000(Based on 2 partial tracts) A) FHA, FSA/RHS & VA B) Conventional C) Refinancings D) Home Improvement Loans E) Loans on Dwellings For 5+ Families F) Non-occupant Loans on Number Average Value Number Average Value Number Average Value Number Average Value Number Average Value Number Average Value
LOANS ORIGINATED 13 $102,942 116 $161,659 55 $115,833 22 $20,730 1 $11,810 7 $131,949 APPLICATIONS APPROVED, NOT ACCEPTED 1 $13,580 9 $122,684 15 $89,541 15 $16,001 0 $0 2 $84,965 APPLICATIONS DENIED 1 $39,220 9 $76,592 21 $79,936 12 $10,594 0 $0 3 $101,107 APPLICATIONS WITHDRAWN 0 $0 7 $211,024 7 $69,926 2 $45,925 0 $0 1 $289,350 FILES CLOSED FOR INCOMPLETENESS 0 $0 1 $23,630 4 $85,132 1 $16,120 0 $0 0 $0
Aggregated Statistics For Year 1999(Based on 3 partial tracts) A) FHA, FSA/RHS & VA B) Conventional C) Refinancings D) Home Improvement Loans E) Loans on Dwellings For 5+ Families F) Non-occupant Loans on Number Average Value Number Average Value Number Average Value Number Average Value Number Average Value Number Average Value
LOANS ORIGINATED 21 $88,774 130 $139,912 189 $114,594 26 $18,358 1 $246,960 11 $61,194 APPLICATIONS APPROVED, NOT ACCEPTED 0 $0 13 $118,042 27 $128,131 11 $13,825 0 $0 0 $0 APPLICATIONS DENIED 1 $77,560 19 $55,289 48 $73,545 19 $15,551 0 $0 3 $66,197 APPLICATIONS WITHDRAWN 5 $77,726 8 $102,129 31 $95,853 3 $59,223 0 $0 2 $55,515 FILES CLOSED FOR INCOMPLETENESS 0 $0 4 $140,022 6 $78,310 1 $2,940 0 $0 0 $0
Detailed HMDA statistics for the following Tracts:
0640.00
, 0641.00 , 0669.00
Private Mortgage Insurance Companies Aggregated Statistics For Year 2009(Based on 3 partial tracts) A) Conventional B) Refinancings Number Average Value Number Average Value
LOANS ORIGINATED 8 $146,371 6 $182,520 APPLICATIONS APPROVED, NOT ACCEPTED 1 $205,270 4 $210,222 APPLICATIONS DENIED 2 $175,970 1 $69,850 APPLICATIONS WITHDRAWN 1 $185,420 2 $149,630 FILES CLOSED FOR INCOMPLETENESS 0 $0 1 $32,230
Aggregated Statistics For Year 2008(Based on 3 partial tracts) A) Conventional B) Refinancings C) Non-occupant Loans on Number Average Value Number Average Value Number Average Value
LOANS ORIGINATED 17 $174,279 7 $195,547 1 $88,950 APPLICATIONS APPROVED, NOT ACCEPTED 3 $191,410 8 $199,785 1 $75,210 APPLICATIONS DENIED 1 $59,640 2 $329,795 0 $0 APPLICATIONS WITHDRAWN 1 $57,870 1 $83,280 0 $0 FILES CLOSED FOR INCOMPLETENESS 0 $0 1 $54,390 0 $0
Aggregated Statistics For Year 2007(Based on 3 partial tracts) A) Conventional B) Refinancings C) Non-occupant Loans on Number Average Value Number Average Value Number Average Value
LOANS ORIGINATED 43 $138,268 14 $168,924 4 $66,315 APPLICATIONS APPROVED, NOT ACCEPTED 5 $128,508 2 $116,290 1 $83,090 APPLICATIONS DENIED 1 $42,810 0 $0 1 $42,810 APPLICATIONS WITHDRAWN 1 $63,770 2 $87,415 1 $53,380 FILES CLOSED FOR INCOMPLETENESS 0 $0 0 $0 0 $0
Aggregated Statistics For Year 2006(Based on 3 partial tracts) A) Conventional B) Refinancings C) Non-occupant Loans on Number Average Value Number Average Value Number Average Value
LOANS ORIGINATED 27 $127,740 9 $139,094 4 $74,990 APPLICATIONS APPROVED, NOT ACCEPTED 2 $110,695 2 $110,910 0 $0 APPLICATIONS DENIED 0 $0 0 $0 0 $0 APPLICATIONS WITHDRAWN 0 $0 1 $118,100 0 $0 FILES CLOSED FOR INCOMPLETENESS 0 $0 0 $0 0 $0
Aggregated Statistics For Year 2005(Based on 3 partial tracts) A) Conventional B) Refinancings C) Non-occupant Loans on Number Average Value Number Average Value Number Average Value
LOANS ORIGINATED 22 $119,649 6 $177,720 3 $72,627 APPLICATIONS APPROVED, NOT ACCEPTED 3 $130,397 2 $120,995 1 $203,470 APPLICATIONS DENIED 0 $0 1 $44,880 0 $0 APPLICATIONS WITHDRAWN 0 $0 1 $94,030 0 $0 FILES CLOSED FOR INCOMPLETENESS 1 $56,910 0 $0 1 $56,910
Aggregated Statistics For Year 2004(Based on 3 partial tracts) A) Conventional B) Refinancings C) Non-occupant Loans on Number Average Value Number Average Value Number Average Value
LOANS ORIGINATED 48 $129,758 16 $135,386 4 $65,782 APPLICATIONS APPROVED, NOT ACCEPTED 9 $168,096 9 $123,411 2 $55,935 APPLICATIONS DENIED 1 $23,170 0 $0 0 $0 APPLICATIONS WITHDRAWN 2 $122,885 1 $104,750 0 $0 FILES CLOSED FOR INCOMPLETENESS 0 $0 0 $0 0 $0
Aggregated Statistics For Year 2003(Based on 3 partial tracts) A) Conventional B) Refinancings C) Non-occupant Loans on Number Average Value Number Average Value Number Average Value
LOANS ORIGINATED 38 $138,058 41 $125,919 3 $53,137 APPLICATIONS APPROVED, NOT ACCEPTED 10 $164,743 12 $136,931 2 $56,705 APPLICATIONS DENIED 0 $0 0 $0 0 $0 APPLICATIONS WITHDRAWN 2 $182,095 5 $81,698 2 $122,610 FILES CLOSED FOR INCOMPLETENESS 1 $50,360 0 $0 0 $0
Aggregated Statistics For Year 2002(Based on 2 partial tracts) A) Conventional B) Refinancings C) Non-occupant Loans on Number Average Value Number Average Value Number Average Value
LOANS ORIGINATED 22 $164,681 27 $151,505 1 $110,970 APPLICATIONS APPROVED, NOT ACCEPTED 7 $248,647 7 $161,727 0 $0 APPLICATIONS DENIED 0 $0 1 $33,310 0 $0 APPLICATIONS WITHDRAWN 1 $60,230 2 $120,385 0 $0 FILES CLOSED FOR INCOMPLETENESS 0 $0 0 $0 0 $0
Aggregated Statistics For Year 2001(Based on 2 partial tracts) A) Conventional B) Refinancings C) Non-occupant Loans on Number Average Value Number Average Value Number Average Value
LOANS ORIGINATED 35 $160,835 19 $156,723 1 $183,540 APPLICATIONS APPROVED, NOT ACCEPTED 8 $165,230 4 $179,080 1 $132,860 APPLICATIONS DENIED 0 $0 0 $0 0 $0 APPLICATIONS WITHDRAWN 0 $0 2 $84,195 0 $0 FILES CLOSED FOR INCOMPLETENESS 0 $0 0 $0 0 $0
Aggregated Statistics For Year 2000(Based on 2 partial tracts) A) Conventional B) Refinancings C) Non-occupant Loans on Number Average Value Number Average Value Number Average Value
LOANS ORIGINATED 30 $138,114 3 $126,777 1 $140,540 APPLICATIONS APPROVED, NOT ACCEPTED 5 $154,708 1 $173,020 1 $110,610 APPLICATIONS DENIED 1 $39,560 0 $0 0 $0 APPLICATIONS WITHDRAWN 1 $129,490 0 $0 0 $0 FILES CLOSED FOR INCOMPLETENESS 0 $0 0 $0 0 $0
Aggregated Statistics For Year 1999(Based on 3 partial tracts) A) Conventional B) Refinancings Number Average Value Number Average Value
LOANS ORIGINATED 48 $130,337 16 $124,171 APPLICATIONS APPROVED, NOT ACCEPTED 7 $98,569 4 $79,625 APPLICATIONS DENIED 2 $136,240 1 $120,310 APPLICATIONS WITHDRAWN 2 $157,680 1 $109,200 FILES CLOSED FOR INCOMPLETENESS 1 $53,360 1 $58,590
Detailed PMIC statistics for the following Tracts:
0640.00
, 0641.00 , 0669.00 Villa Hills compared to Kentucky state average:
Median household income above state average. Median house value above state average. Unemployed percentage significantly below state average. Black race population percentage significantly below state average. Hispanic race population percentage significantly below state average. Foreign-born population percentage significantly below state average. Renting percentage significantly below state average. Length of stay since moving in significantly above state average. Number of rooms per house above state average. Percentage of population with a bachelor's degree or higher significantly above state average. Villa Hills on our top lists :
#7 on the list of "Top 101 cities with the largest percentage of high school students in private schools (500+ students)"
#9 on the list of "Top 101 cities with largest percentage of males in occupations: business and financial operations occupations (population 5,000+)"
#37 on the list of "Top 100 safest cities (lowest city-data.com crime index) (pop. 5,000+)"
#53 on the list of "Top 101 cities with the lowest number of burglaries per 100,000 residents (population 5,000+)"
#54 on the list of "Top 101 cities with the most residents born in Other Eastern Europe (population 500+)"
#55 on the list of "Top 101 cities with the lowest city-data.com crime index (population 5,000+)"
#56 on the list of "Top 101 cities with the largest percentage of people in religious group quarters (population 1,000+)"
#67 on the list of "Top 101 cities with largest percentage of males in occupations: sales and related occupations (population 5,000+)"
#91 on the list of "Top 101 counties with the highest number of births per 1000 residents 2007-2013"
#93 on the list of "Top 101 counties with the lowest percentage of residents relocating from foreign countries between 2010 and 2011"
Top Patent Applicants
Genevieve Cagalawan Wenning (10)
Mel Steven Lessley (10)
Charles A. Schneider (10)
Robert J. Ratterman (9)
Terry J. Stratman (6)
Jeffrey H. Chapman (5)
Michael A. Jacobs (4)
Karen Lai-Ting Chan (4)
William Mitchell Scott (4)
William M. Scott (4)
Total of 107 patent applications in 2008-2024.


 Recent articles from our blog. Our writers, many of them Ph.D. graduates or candidates, create easy-to-read articles on a wide variety of topics.

 (7.1 miles
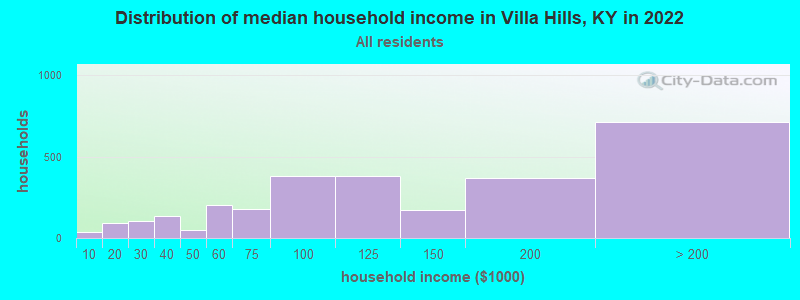


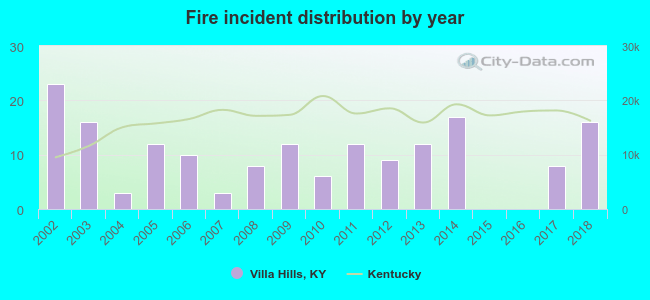 According to the data from the years 2002 - 2018 the average number of fires per year is 10. The highest number of fire incidents - 23 took place in 2002, and the least - 0 in 2015. The data has a decreasing trend.
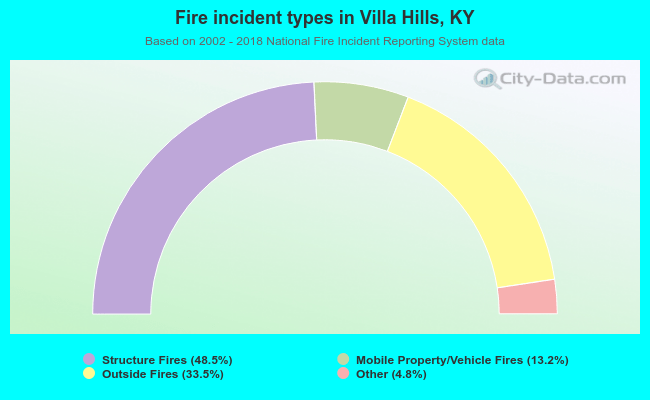 When looking into fire subcategories, the most incidents belonged to: Structure Fires (48.5%), and Outside Fires (33.5%).