Races in Verona, Wisconsin (WI) Detailed Stats
Ancestries, Foreign-born residents, place of birth
Settings
X


Recent posts about races in Verona, Wisconsin on our local forum with over 2,400,000 registered users:
 | Moving back to Madison, how has it changed? (26 replies) |
| Relocating to Verona WI (6 replies) |
| Waunakee, Sun Prarie, DeForest/Windsor, or McFarland for a Family from San Diego (9 replies) |
| Realtor to Help Find Rental House (18 replies) |
| moving to madison; local attitudes to latinos. (2 replies) |
| Are Madison Public Schools bad (10 replies) |
Latest news about races in Verona, WI collected exclusively by city-data.com from local newspapers, TV, and radio stations
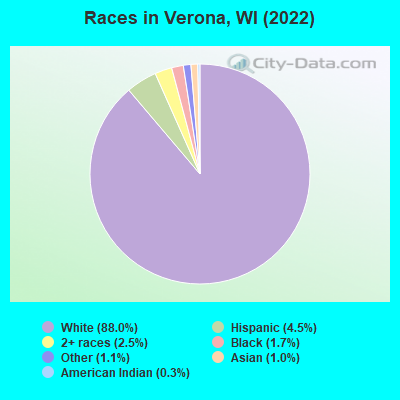
According to 2022 data, the most numerous races in Verona, WI are White alone (12,541 residents), Hispanic (646 residents), and Black alone (238 residents). 94.1% of Verona residents speak English at home. 5.7% of Verona, WI residents are foreign-born (2.4% born in Latin America, 1.5% born in Asia, 0.9% born in Africa, 0.7% born in Europe), which is 13.0% greater than the foreign-born rate of 5.0% across the entire state of Wisconsin.
Race distribution in Verona
2000
2022

- 6,84197.0%White alone
- 500.7%Hispanic
- 520.7%Two or more races
- 470.7%Asian alone
- 440.6%Black alone
- 120.2%American Indian alone
- 60.09%Other race alone

-
- 12,54188.0%White alone
- 6464.5%Hispanic
- 3602.5%Two or more races
- 2381.7%Black alone
- 1601.1%Other race alone
- 1391.0%Asian alone
- 370.3%American Indian alone
2000
2022
-
- 4,681,63087.3%White alone
- 300,2455.6%Black alone
- 192,9213.6%Hispanic
- 87,9951.6%Asian alone
- 51,9211.0%Two or more races
- 43,9800.8%American Indian alone
- 3,6370.07%Other race alone
- 1,3460.03%Native Hawaiian and Other
Pacific Islander alone

-
- 4,654,03179.0%White alone
- 447,0227.6%Hispanic
- 345,6785.9%Black alone
- 217,5323.7%Two or more races
- 172,2422.9%Asian alone
- 33,7620.6%American Indian alone
- 19,6800.3%Other race alone
- 2,5920.04%Native Hawaiian and Other
Pacific Islander alone

Income and house value in Verona
- Median household income in 2022
- $113,611White non-Hispanic householders
- $72,972Two or more races householders
- $90,828Hispanic or Latino race householders
- Median 2022 house value
- $391,268White Non-Hispanic householders
- $332,300American Indian or Alaska Native householders
- $664,600Asian householders
- $332,300Some other race householders
- $332,300Hispanic or Latino householders
Household income for White non-Hispanic householders

Household income for Black householders

Household income for Asian householders

Household income for Some other race householders

Household income for Two or more races householders

Household income for Hispanic or Latino race householders

Median age by race in Verona
- 40.6Median age for White residents
- 40.0Males
- 40.9Females
- 27.6Median age for Black or African American residents
- 27.3Males
- -662,146,892.0Females
- -592,592,592.0Median age for American Indian / Alaska Native residents
- -584,362,139.3Males
- -641,898,864.2Females
- 33.7Median age for Asian residents
- 34.0Males
- 33.2Females
- -825,688,072.6Median age for Native Hawaiian / Pacific Islander residents
- -862,745,097.2Males
- -732,444,443.7Females
- 38.0Median age for Other race residents
- 9.5Males
- -598,290,597.7Females
- 25.4Median age for Two or more races residents
- 17.3Males
- 34.9Females
- 40.4Median age for White alone residents
- 39.9Males
- 40.6Females
- 22.6Median age for Hispanic or Latino residents
- 14.6Males
- 48.5Females
Owner/renter occupied households by race in Verona
- House owners and renters - White residents
- 3,98774.2%Owner occupied
- 1,38325.8%Renter occupied
- House owners and renters - Black or African American residents
- 1226.8%Owner occupied
- 3273.2%Renter occupied
- House owners and renters - Asian residents
- 2260.2%Owner occupied
- 1539.8%Renter occupied
- House owners and renters - Other race residents
- 84100.0%Renter occupied
- House owners and renters - Two or more races residents
- 25553.1%Owner occupied
- 22646.9%Renter occupied
- House owners and renters - White alone residents
- 3,98473.7%Owner occupied
- 1,42026.3%Renter occupied
- House owners and renters - Hispanic or Latino residents
- 219100.0%Owner occupied
Language usage in Verona
- English speakers - Total
- 94.1% of residents of Verona speak English at home.
- 2.5% of residents speak Spanish at home
- 30790.8%Speak English very well
- 319.2%Speak English less than very well
- 3.4% of residents speak other language at home
- 453100.0%Speak English very well
- English speakers - Born in the United States
- 99.4% of residents of Verona speak English at home.
- 0.3% of residents speak Spanish at home
- 14100.0%Speak English very well
- 0.4% of residents speak other language at home
- 19100.0%Speak English very well
- English speakers - Native, born elsewhere
- 52.4% of residents of Verona speak English at home.
- 56.8% of residents speak Spanish at home
- 142100.0%Speak English very well
- 8.0% of residents speak other language at home
- 20100.0%Speak English very well
- English speakers - Foreign-born
- 44.4% of residents of Verona speak English at home.
- 15.0% of residents speak Spanish at home
- 10083.3%Speak English very well
- 2016.7%Speak English less than very well
- 37.0% of residents speak other language at home
- 295100.0%Speak English very well
White (Caucasian) - Speak only English
| Native: | 98.3% (11,501) |
| Foreign-born: | 81.6% (87) |
White (Caucasian) - Speak another language
| Native: | 1.7% (204) |
| Foreign-born: | 18.2% (19) |
Black or African American - Speak only English
| Native: | 99.8% (19) |
| Foreign-born: | 54.4% (73) |
Asian - Speak only English
| Native: | 100.0% (35) |
| Foreign-born: | 28.8% (21) |
Two or more races - Speak only English
| Native: | 76.1% (536) |
| Foreign-born: | 45.8% (215) |
Two or more races - Speak another language
| Native: | 25.7% (181) |
| Foreign-born: | 44.0% (207) |
White alone - Speak only English
| Native: | 98.1% (11,495) |
| Foreign-born: | 68.6% (99) |
White alone - Speak another language
| Native: | 1.9% (221) |
| Foreign-born: | 22.6% (33) |
Hispanic or Latino - Speak only English
| Native: | 64.3% (290) |
| Foreign-born: | 44.6% (90) |
Hispanic or Latino - Speak another language
| Native: | 34.3% (154) |
| Foreign-born: | 52.1% (105) |
Foreign-born residents in Verona
819 residents are foreign born (2.4% Latin America, 1.5% Asia, 0.9% Africa, 0.7% Europe).
| This city: | 5.7% |
| Wisconsin: | 5.0% |


Marital status for residents in Verona
Marital status - White (Caucasian) population 15 years and over
- Males
- 26.8%Never married
- 63.8%Now married
- 0.8%Separated
- 1.8%Widowed
- 6.8%Divorced
- Females
- 18.5%Never married
- 61.3%Now married
- 0.6%Separated
- 7.2%Widowed
- 12.4%Divorced
Women who gave birth in the past 12 months
| Now married: | 100.0% (129) |
| Unmarried: | 0.0% (0) |
Women who did not give birth in the past 12 months
| Now married: | 62.1% (1,527) |
| Unmarried: | 37.9% (932) |
Marital status - Black or African American population 15 years and over
- Males
- 51.4%Never married
- 48.6%Now married
- 0.0%Separated
- 0.0%Widowed
- 0.0%Divorced
- Females
- 0.0%Never married
- 100.0%Now married
- 0.0%Separated
- 0.0%Widowed
- 0.0%Divorced
Women who did not give birth in the past 12 months
| Now married: | 100.0% (51) |
| Unmarried: | 0.0% (0) |
Marital status - Asian population 15 years and over
- Males
- 47.1%Never married
- 52.9%Now married
- 0.0%Separated
- 0.0%Widowed
- 0.0%Divorced
- Females
- 45.2%Never married
- 54.8%Now married
- 0.0%Separated
- 0.0%Widowed
- 0.0%Divorced
Women who gave birth in the past 12 months
| Now married: | 100.0% (14) |
| Unmarried: | 0.0% (0) |
Women who did not give birth in the past 12 months
| Now married: | 43.1% (23) |
| Unmarried: | 56.9% (30) |
Marital status - Other race population 15 years and over
- Males
- 23.3%Never married
- 76.7%Now married
- 0.0%Separated
- 0.0%Widowed
- 0.0%Divorced
- Females
- 0.0%Never married
- 100.0%Now married
- 0.0%Separated
- 0.0%Widowed
- 0.0%Divorced
Women who did not give birth in the past 12 months
| Now married: | 100.0% (41) |
| Unmarried: | 0.0% (0) |
Marital status - Two or more races population 15 years and over
- Males
- 30.3%Never married
- 40.3%Now married
- 0.0%Separated
- 0.0%Widowed
- 29.4%Divorced
- Females
- 36.9%Never married
- 23.5%Now married
- 0.0%Separated
- 4.7%Widowed
- 34.9%Divorced
Women who did not give birth in the past 12 months
| Now married: | 22.0% (80) |
| Unmarried: | 78.0% (284) |
Marital status - White alone, not Hispanic / Latino population 15 years and over
- Males
- 26.3%Never married
- 64.2%Now married
- 0.9%Separated
- 1.8%Widowed
- 6.8%Divorced
- Females
- 18.3%Never married
- 61.4%Now married
- 0.6%Separated
- 7.3%Widowed
- 12.5%Divorced
Women who gave birth in the past 12 months
| Now married: | 100.0% (132) |
| Unmarried: | 0.0% (0) |
Women who did not give birth in the past 12 months
| Now married: | 62.3% (1,553) |
| Unmarried: | 37.7% (939) |
Marital status - Hispanic or Latino population 15 years and over
- Males
- 36.3%Never married
- 54.4%Now married
- 0.0%Separated
- 0.0%Widowed
- 9.4%Divorced
- Females
- 16.0%Never married
- 31.4%Now married
- 0.0%Separated
- 0.0%Widowed
- 52.7%Divorced
Women who did not give birth in the past 12 months
| Now married: | 31.4% (56) |
| Unmarried: | 68.6% (122) |
Ancestries in Verona

- 1,39226.5%German
- 4809.2%American
- 3807.2%Irish
- 3216.1%English
- 2965.6%Norwegian
- 2294.4%European
- 2124.0%Brazilian
- 1863.5%Northern European
- 1813.5%Swedish
- 1743.3%African
- 1512.9%French
- 801.5%Scottish
- 621.2%Polish
- 501.0%Italian
- 330.6%Danish
- 310.6%Armenian
- 250.5%Lebanese
- 250.5%Swiss
- 220.4%Canadian
- 130.2%Dutch
- 130.2%Greek
- 110.2%British
- 90.2%Scotch-Irish
- 70.1%Czech
- 60.1%Welsh

Geographical mobility in Verona

- Same house 1 year ago
- 10,71787.6%White (Caucasian)
- 17473.5%Black or African American
- 42100.0%American Indian / Alaska Native
- 12399.4%Asian
- 20497.7%Other race
- 90680.1%Two or more races
- 10,82087.4%White alone, not Hispanic / Latino
- 55284.8%Hispanic or Latino

-
- Moved within same county
- 9577.8%White / Caucasian
- 17015.0%Two or more races
- 9807.9%White alone, not Hispanic / Latino
- 6610.1%Hispanic or Latino

-
- Moved within same state
- 1661.4%White / Caucasian
- 1481.2%White alone, not Hispanic / Latino
- 243.8%Hispanic or Latino

-
- Moved from different state
- 3653.0%White / Caucasian
- 232.1%Two or more races
- 3793.1%White alone, not Hispanic / Latino

-
- Moved from abroad
- 5422.8%Black or African American

Children Nativity (place of birth) in Verona
Place of birth for residents in Verona
![Place of birth for the foreign-born population - Regions]()
- 373Americas
- 342Latin America
- 216Asia
- 198South America
- 132Africa
- 132Middle Africa
- 130Central America
- 101Eastern Asia
- 98Western Asia
- 96Europe
- 80Northern Europe
- 76China
- 30Northern America
- 15Eastern Europe
- 15South Eastern Asia
- 12Caribbean

![Place of birth for the foreign-born population - Countries]()
- 135Brazil
- 132Cameroon
- 130Mexico
- 76China
- 68Armenia
- 62Venezuela
- 46United Kingdom
- 30England
- 30Canada
- 24Korea
- 15Poland
- 15Vietnam
- 14Lebanon
- 14Syria
- 12Dominican Republic
- 2Norway

Grandparents responsible for own grandchildren in Verona
Zip codes: 53593.