Estimated zip code population in 2022: 4,467 Zip code population in 2010: 4,136 Zip code population in 2000: 3,866
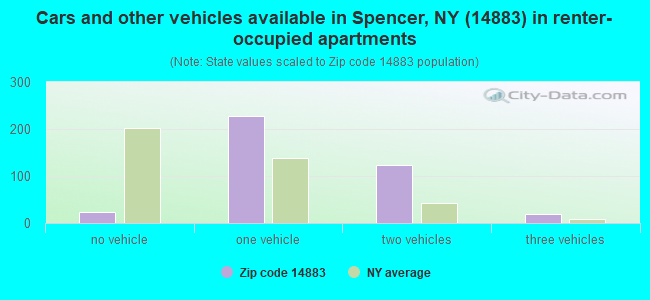
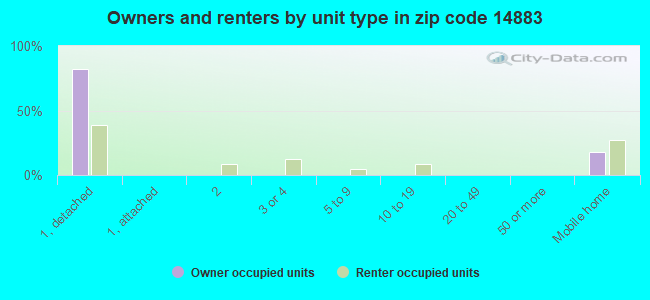
Houses and condos: 1,990 Renter-occupied apartments: 395
% of renters here:
22%
State:
46%
March 2022 cost of living index in zip code 14883: 95.0 (less than average, U.S. average is 100)
Land area: 72.2 sq. mi. Water area: 0.5 sq. mi.
Population density: 62 people per square mile
(very low).
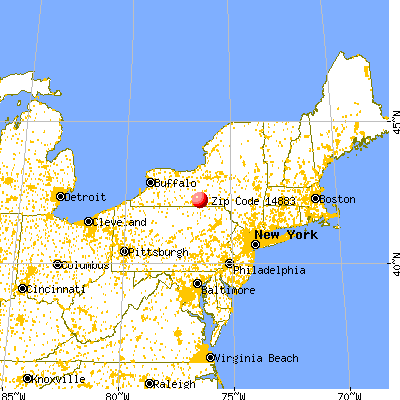
OSM Map
General Map
Google Map
MSN Map
OSM Map
General Map
Google Map
MSN Map
OSM Map
General Map
Google Map
MSN Map
OSM Map
General Map
Google Map
MSN Map
Please wait while loading the map...
Real estate property taxes paid for housing units in 2022:
This zip code:
2.0% ($3,611)
New York:
1.5% ($6,180)
Median real estate property taxes paid for housing units with mortgages in 2022: $4,887 (2.4%) Median real estate property taxes paid for housing units with no mortgage in 2022: $2,896 (1.9%)
Business Search- 14 Million verified businesses
Males: 2,258
(50.5%)
Females: 2,209
(49.5%)
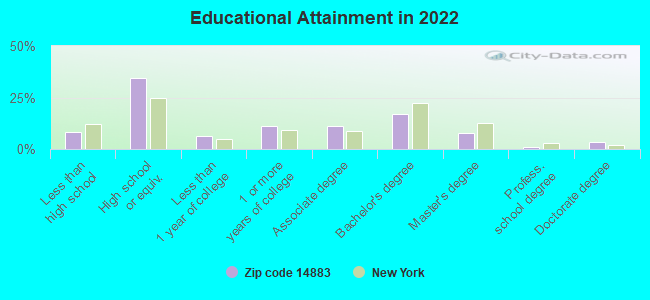
For population 25 years and over in 14883:
High school or higher: 91.4%
Bachelor's degree or higher: 28.6%
Graduate or professional degree: 11.9%
Unemployed: 2.9%
Mean travel time to work (commute): 26.6 minutes
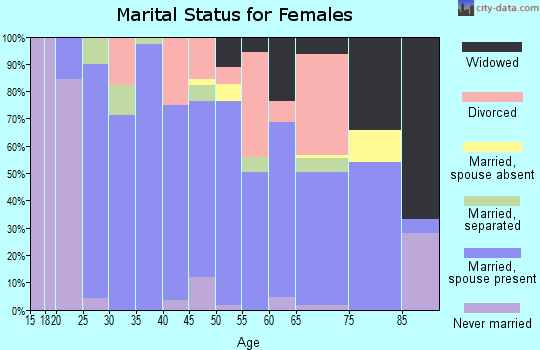
For population 15 years and over in 14883:
Never married: 26.6%
Now married: 54.5%
Separated: 1.9%
Widowed: 6.7%
Divorced: 10.3%
Zip code 14883 compared to state average:
Median house value below state average.
Unemployed percentage below state average.
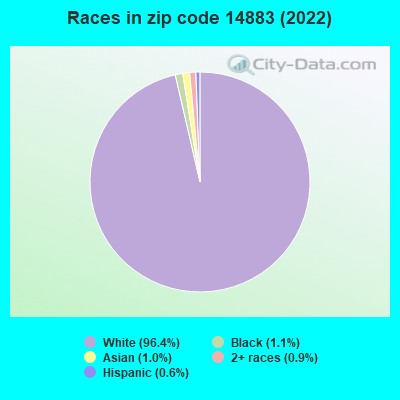
Black race population percentage significantly below state average.
Hispanic race population percentage significantly below state average.
Foreign-born population percentage significantly below state average.
Estimated median house/condo value in 2022: $182,322
14883:
$182,322
New York:
$400,400
According to our research of New York and other state lists, there were 4 registered sex offenders living in 14883 zip code as of April 28, 2024. The ratio of all residents to sex offenders in zip code 14883 is 994 to 1. The ratio of registered sex offenders to all residents in this zip code is near the state average.
Median resident age:
This zip code:
37.3 years
New York median age:
40.0 years
Average household size:
This zip code:
2.4 people
New York:
2.5 people
Averages for the 2020 tax year for zip code 14883, filed in 2021:
Average Adjusted Gross Income (AGI) in 2020: $54,520 (Individual Income Tax Returns)
Here:
$54,520
State:
$90,930
Salary/wage: $46,472 (reported on 79.2% of returns)
Here:
$46,472
State:
$72,104
(% of AGI for various income ranges: 1009.3% for AGIs below $25k, 3142.3% for AGIs $25k-50k, 5872.8% for AGIs $50k-75k, 9195.0% for AGIs $75k-100k, 15066.4% for AGIs $100k-200k)
Taxable interest for individuals: $1,012 (reported on 38.5% of returns)
This zip code:
$1,012
New York:
$3,075
(% of AGI for various income ranges: 11.4% for AGIs below $25k, 26.1% for AGIs $25k-50k, 56.0% for AGIs $50k-75k, 75.7% for AGIs $75k-100k, 46.4% for AGIs $100k-200k)
Ordinary dividends: $3,423 (reported on 15.6% of returns)
Here:
$3,423
State:
$11,095
(% of AGI for various income ranges: 25.6% for AGIs below $25k, 28.4% for AGIs $25k-50k, 56.4% for AGIs $50k-75k, 122.1% for AGIs $75k-100k, 342.9% for AGIs $100k-200k)
Net capital gain/loss in AGI: +$9,336 (reported on 13.0% of returns)
Here:
+$9,336
State:
+$44,925
(% of AGI for various income ranges: 16.5% for AGIs below $25k, 29.3% for AGIs $25k-50k, 94.4% for AGIs $50k-75k, 247.9% for AGIs $75k-100k, 1107.9% for AGIs $100k-200k)
Profit/loss from business: +$13,254 (reported on 14.6% of returns)
Here:
+$13,254
State:
+$14,940
(% of AGI for various income ranges: 64.4% for AGIs below $25k, 105.0% for AGIs $25k-50k, 163.6% for AGIs $50k-75k, 439.3% for AGIs $75k-100k, 1391.4% for AGIs $100k-200k)
Taxable individual retirement arrangement distribution: $13,957 (reported on 10.9% of returns)
14883:
$13,957
New York:
$19,609
(% of AGI for various income ranges: 67.4% for AGIs below $25k, 115.5% for AGIs $25k-50k, 182.4% for AGIs $50k-75k, 471.4% for AGIs $75k-100k, 726.4% for AGIs $100k-200k)
Total itemized deductions: $24,362 (reported on 4.2% of returns)
Here:
$24,362
State:
$39,326
(% of AGI for various income ranges: 465.2% for AGIs $50k-75k, 561.4% for AGIs $100k-200k)
Charity contributions: $7,275 (reported on 2.1% of returns)
Here:
$7,275
State:
$15,420
(% of AGI for various income ranges: 207.9% for AGIs $100k-200k)
Taxes paid: $8,243 (reported on 3.6% of returns)
14883:
$8,243
State:
$9,183
(% of AGI for various income ranges: 136.8% for AGIs $50k-75k, 167.9% for AGIs $100k-200k)
Earned income credit: $2,027 (reported on 13.5% of returns)
Here:
$2,027
State:
$2,138
(% of AGI for various income ranges: 58.4% for AGIs below $25k, 62.7% for AGIs $25k-50k)
Percentage of individuals using paid preparers for their 2020 taxes: 96.4%
Here:
96%
State:
95%
(% for various income ranges: 96.6% for AGIs below $25k, 96.3% for AGIs $25k-50k, 96.9% for AGIs $50k-75k, 95.5% for AGIs $75k-100k, 95.7% for AGIs $100k-200k, 100.0% for AGIs over 200k)
Averages for the 2012 tax year for zip code 14883, filed in 2013:
Average Adjusted Gross Income (AGI) in 2012: $45,184 (Individual Income Tax Returns)
Here:
$45,184
State:
$77,088
Salary/wage: $40,186 (reported on 82.0% of returns)
Here:
$40,186
State:
$60,593
(% of AGI for various income ranges: 67.8% for AGIs below $25k, 76.8% for AGIs $25k-50k, 73.4% for AGIs $50k-75k, 79.7% for AGIs $75k-100k, 66.0% for AGIs $100k-200k)
Taxable interest for individuals: $841 (reported on 39.9% of returns)
This zip code:
$841
New York:
$3,125
(% of AGI for various income ranges: 1.2% for AGIs below $25k, 0.4% for AGIs $25k-50k, 0.9% for AGIs $50k-75k, 0.5% for AGIs $75k-100k, 0.9% for AGIs $100k-200k)
Ordinary dividends: $2,412 (reported on 18.0% of returns)
Here:
$2,412
State:
$10,299
(% of AGI for various income ranges: 1.5% for AGIs below $25k, 0.6% for AGIs $25k-50k, 0.8% for AGIs $50k-75k, 0.8% for AGIs $75k-100k, 1.3% for AGIs $100k-200k)
Net capital gain/loss in AGI: +$3,577 (reported on 12.0% of returns)
Here:
+$3,577
State:
+$42,474
(% of AGI for various income ranges: 0.4% for AGIs below $25k, 0.5% for AGIs $25k-50k, 1.2% for AGIs $50k-75k, 0.3% for AGIs $75k-100k, 1.9% for AGIs $100k-200k)
Profit/loss from business: +$10,531 (reported on 15.8% of returns)
Here:
+$10,531
State:
+$16,168
(% of AGI for various income ranges: 8.7% for AGIs below $25k, 4.1% for AGIs $25k-50k, 3.5% for AGIs $50k-75k, 2.1% for AGIs $75k-100k, 2.7% for AGIs $100k-200k)
Taxable individual retirement arrangement distribution: $10,856 (reported on 9.8% of returns)
14883:
$10,856
New York:
$17,621
(% of AGI for various income ranges: 3.8% for AGIs below $25k, 2.5% for AGIs $25k-50k, 3.0% for AGIs $50k-75k, 2.8% for AGIs $100k-200k)
Total itemized deductions: $19,136 (23% of AGI, reported on 24.0% of returns)
Here:
$19,136
State:
$34,985
Here:
22.6% of AGI
State:
21.3% of AGI
(% of AGI for various income ranges: 5.8% for AGIs below $25k, 7.9% for AGIs $25k-50k, 10.4% for AGIs $50k-75k, 11.1% for AGIs $75k-100k, 13.1% for AGIs $100k-200k)
Charity contributions: $2,863 (reported on 16.4% of returns)
Here:
$2,863
State:
$5,572
(% of AGI for various income ranges: 0.3% for AGIs below $25k, 0.6% for AGIs $25k-50k, 0.9% for AGIs $50k-75k, 1.2% for AGIs $75k-100k, 1.7% for AGIs $100k-200k)
Taxes paid: $9,186 (reported on 24.0% of returns)
14883:
$9,186
State:
$18,656
(% of AGI for various income ranges: 2.1% for AGIs below $25k, 2.8% for AGIs $25k-50k, 4.1% for AGIs $50k-75k, 5.7% for AGIs $75k-100k, 7.9% for AGIs $100k-200k)
Earned income credit: $2,182 (reported on 18.0% of returns)
Here:
$2,182
State:
$2,230
(% of AGI for various income ranges: 5.9% for AGIs below $25k, 1.1% for AGIs $25k-50k)
Percentage of individuals using paid preparers for their 2012 taxes: 45.9%
Here:
46%
State:
66%
(% for various income ranges: 38.6% for AGIs below $25k, 44.2% for AGIs $25k-50k, 55.2% for AGIs $50k-75k, 55.6% for AGIs $75k-100k, 57.1% for AGIs $100k-200k)
Averages for the 2004 tax year for zip code 14883, filed in 2005:
Average Adjusted Gross Income (AGI) in 2004: $38,036 (Individual Income Tax Returns)
Here:
$38,036
State:
$59,519
Salary/wage: $33,759 (reported on 85.7% of returns)
Here:
$33,759
State:
$50,673
(% of AGI for various income ranges: 86.2% for AGIs below $10k, 73.1% for AGIs $10k-25k, 81.6% for AGIs $25k-50k, 84.2% for AGIs $50k-75k, 80.5% for AGIs $75k-100k, 54.3% for AGIs over 100k)
Taxable interest for individuals: $816 (reported on 47.3% of returns)
This zip code:
$816
New York:
$2,377
(% of AGI for various income ranges: 4.2% for AGIs below $10k, 2.6% for AGIs $10k-25k, 0.9% for AGIs $25k-50k, 0.5% for AGIs $50k-75k, 0.6% for AGIs $75k-100k, 0.8% for AGIs over 100k)
Taxable dividends: $1,917 (reported on 20.2% of returns)
Here:
$1,917
State:
$5,394
(% of AGI for various income ranges: 2.1% for AGIs below $10k, 0.7% for AGIs $10k-25k, 0.8% for AGIs $25k-50k, 0.4% for AGIs $50k-75k, 0.5% for AGIs $75k-100k, 2.6% for AGIs over 100k)
Net capital gain/loss: +$4,945 (reported on 15.3% of returns)
Here:
+$4,945
State:
+$23,581
(% of AGI for various income ranges: -0.9% for AGIs below $10k, 0.9% for AGIs $10k-25k, 0.2% for AGIs $25k-50k, 1.4% for AGIs $50k-75k, 3.3% for AGIs $75k-100k, 5.5% for AGIs over 100k)
Profit/loss from business: +$11,237 (reported on 17.6% of returns)
Here:
+$11,237
State:
+$13,809
(% of AGI for various income ranges: 10.6% for AGIs below $10k, 7.2% for AGIs $10k-25k, 5.6% for AGIs $25k-50k, 2.0% for AGIs $50k-75k, 2.1% for AGIs $75k-100k, 9.2% for AGIs over 100k)
IRA payment deduction: $2,977 (reported on 2.4% of returns)
14883:
$2,977
New York:
$3,115
Total itemized deductions: $14,864 (21% of AGI, reported on 21.7% of returns)
Here:
$14,864
State:
$25,864
Here:
20.9% of AGI
State:
21.9% of AGI
(% of AGI for various income ranges: 5.9% for AGIs $10k-25k, 5.9% for AGIs $25k-50k, 7.6% for AGIs $50k-75k, 13.3% for AGIs $75k-100k, 12.5% for AGIs over 100k)
Charity contributions deductions: $2,933 (4% of AGI, reported on 17.4% of returns)
Here:
$2,933
State:
$4,439
Here:
3.8% of AGI
State:
3.6% of AGI
(% of AGI for various income ranges: 0.3% for AGIs $10k-25k, 0.7% for AGIs $25k-50k, 0.9% for AGIs $50k-75k, 2.4% for AGIs $75k-100k, 3.0% for AGIs over 100k)
Total tax: $4,862 (reported on 75.3% of returns)
14883:
$4,862
State:
$11,730
(% of AGI for various income ranges: 3.1% for AGIs below $10k, 4.6% for AGIs $10k-25k, 7.1% for AGIs $25k-50k, 8.5% for AGIs $50k-75k, 10.2% for AGIs $75k-100k, 18.2% for AGIs over 100k)
Earned income credit: $1,607 (reported on 17.1% of returns)
Here:
$1,607
State:
$1,757
Percentage of individuals using paid preparers for their 2004 taxes: 53.7%
Here:
54%
State:
67%
(% for various income ranges: 43.6% for AGIs below $10k, 57.7% for AGIs $10k-25k, 54.5% for AGIs $25k-50k, 56.8% for AGIs $50k-75k, 50.9% for AGIs $75k-100k, 64.9% for AGIs over 100k)
Household received Food Stamps/SNAP in the past 12 months: 341 Household did not receive Food Stamps/SNAP in the past 12 months: 1,479
Women who had a birth in the past 12 months: 61 (55 now married, 5 unmarried) Women who did not have a birth in the past 12 months: 874 (449 now married, 418 unmarried)
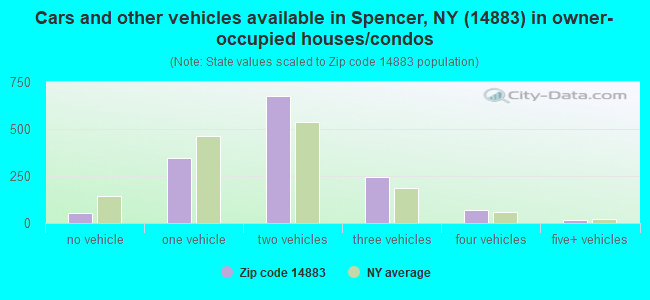
Housing units in zip code 14883 with a mortgage: 811 (42 second mortgage, 2 home equity loan, 40 both second mortgage and home equity loan) Houses without a mortgage: 32
Median monthly owner costs for units with a mortgage: $1,718 Median monthly owner costs for units without a mortgage: $534
Residents with income below the poverty level in 2022:
This zip code:
13.1%
Whole state:
14.3%
Residents with income below 50% of the poverty level in 2022:
This zip code:
7.9%
Whole state:
6.8%
Median number of rooms in houses and condos:
Here:
7.0
State:
6.3
Median number of rooms in apartments:
Here:
4.3
State:
3.8
Notable locations in this zip code not listed on our city pages
Notable locations in zip code 14883: Hollybrook Country Club (A), Angel Ridge Farm (B), Locust Woods Farm (C), Mandeville Farm (D), Siren Farms (E), Jewell Farms (F), Spencer Library (G), Tioga Fire Company (H). Display/hide their locations on the map
Churches in zip code 14883 include: Saint Paul's Lutheran Church (A), Spencer Federated Church (B), Faith Bible Chapel (C), Bible Baptist Church (D). Display/hide their locations on the map
Cemeteries: Baptist Corners Cemetery (1), Valley View Cemetery (2), West Danby Methodist Cemetery (3), South Danby Cemetery (4), Danby Presbyterian Cemetery (5), Green And Mettler Cemetery (6), Michael Handy Farm Cemetery (7). Display/hide their locations on the map
Creeks: Owl Creek (A), Burheight Creek (B), South Branch Catatonk Creek (C), Sulphur Springs Creek (D), Bliven Creek (E), Dean Creek (F), Seelytown Creek (G), Miller Creek (H), Michigan Creek (I). Display/hide their locations on the map
In group quarters: 40 (-1 institutionalized population)
Size of family households: 634 2-persons, 262 3-persons, 297 4-persons, 86 5-persons, 3 6-persons, 13 7-or-more-persons
Size of nonfamily households: 457 1-person, 52 2-persons
503 married couples with children.
414 single-parent households (187 men, 227 women).
97.8% of residents of 14883 zip code speak English at home.
0.4% of residents speak Spanish at home (100% very well).
1.0% of residents speak other Indo-European language at home (93% very well, 5% well, 2% not at all).
0.4% of residents speak Asian or Pacific Island language at home (75% very well, 6% well, 19% not well).
Foreign born population: 180 (4.0%) (93.6% of them are naturalized citizens)
This zip code:
4.0%
Whole state:
22.7%
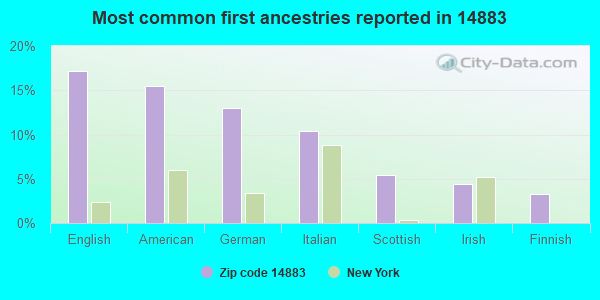
12%Italy
10%Egypt
5%Singapore
3%Honduras
3%Brazil
2%Romania
2%Somalia
17%English
15%American
13%German
10%Italian
5%Scottish
4%Irish
3%Finnish
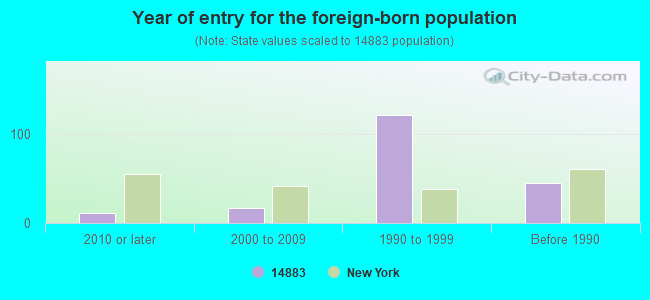
Year of entry for the foreign-born population
112010 or later
172000 to 2009
1211990 to 1999
45Before 1990
Facilities with environmental interests located in this zip code:
HOLLYBROOK GOLF COURSE (29 FISHER SETTLEMENT ROAD in SPENCER, NY)
STATE MASTER (New York facility tracking) - SECTION 404 PERMITTING, 401 CERTIFICATION National Pollutant Discharge Elimination System NON-MAJOR (Tracking pollutant discharge elimination systems) - permit Organizations: MARK STEVENS (CONTACT/OWNER)
Alternative names: MARK STEVENS
Housing units lacking complete plumbing facilities: 2.0% Housing units lacking complete kitchen facilities: 1.8%
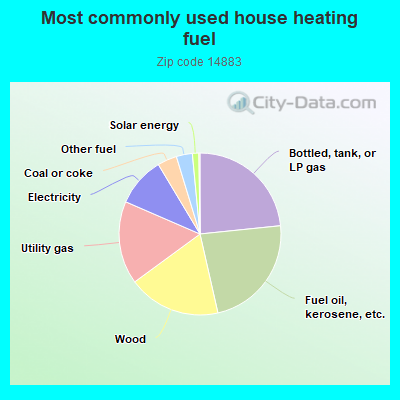
23.4%Bottled, tank, or LP gas
23.1%Fuel oil, kerosene, etc.
18.5%Wood
16.6%Utility gas
9.9%Electricity
3.9%Coal or coke
3.2%Other fuel
1.3%Solar energy
Population in 1990: 3,829. Population change in the 1990s: +37 (+1.0%).
Place of birth for U.S.-born residents:
This state: 2,921
Northeast: 896
Midwest: 161
South: 160
West: 122
66% of the 14883 zip code residents lived in the same house 5 years ago. Out of people who lived in different houses, 50% lived in this county. Out of people who lived in different counties, 50% lived in New York.
92% of the 14883 zip code residents lived in the same house 1 year ago. Out of people who lived in different houses, 59% moved from this county. Out of people who lived in different houses, 20% moved from different county within same state. Out of people who lived in different houses, 21% moved from different state.
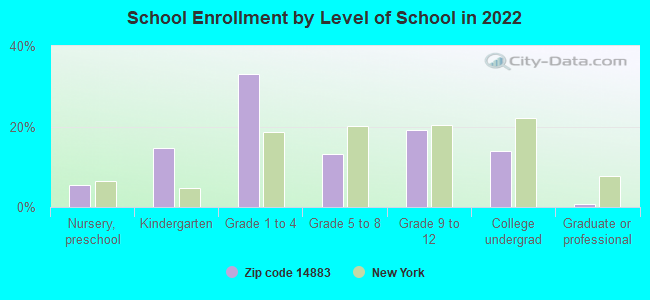
Private vs. public school enrollment:
Students in private schools in grades 1 to 8 (elementary and middle school): 130
Here:
28.6%
New York:
15.6%
Students in private schools in grades 9 to 12 (high school): 19
Here:
10.5%
New York:
15.0%
Students in private undergraduate colleges: 41
Here:
30.4%
New York:
39.2%
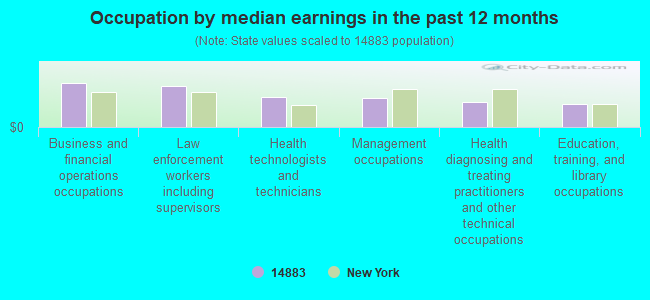
Occupation by median earnings in the past 12 months ($)
103,796Business and financial operations occupations
96,804Law enforcement workers including supervisors
69,659Health technologists and technicians
67,386Management occupations
57,863Health diagnosing and treating practitioners and other technical occupations
54,976Education, training, and library occupations
Top industries in this zip code by the number of employees in 2005:
Finance and Insurance: Commercial Banking (50-99 employees: 1 establishment)
Other Services (except Public Administration): Reupholstery and Furniture Repair (20-49: 1)
Wholesale Trade: Grain and Field Bean Merchant Wholesalers (20-49: 1)
Other Services (except Public Administration): Religious Organizations (10-19: 1, 1-4: 3)
Information: Cable and Other Program Distribution (10-19: 1)
Administrative and Support and Waste Management and Remediation Services: Landscaping Services (5-9: 1)
Finance and Insurance: Insurance Agencies and Brokerages (5-9: 1)
People in group quarters in 2010:
14 people in residential schools for people with disabilities
5 people in workers' group living quarters and job corps centers
People in group quarters in 2000:
5 people in homes for the physically handicapped
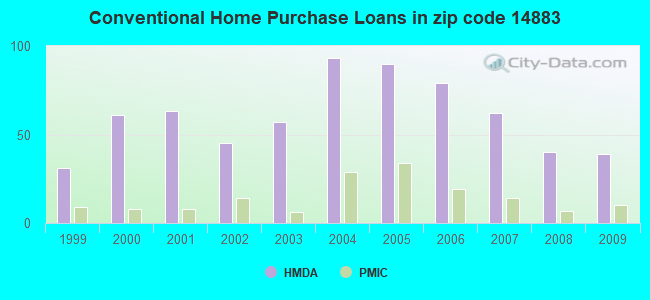
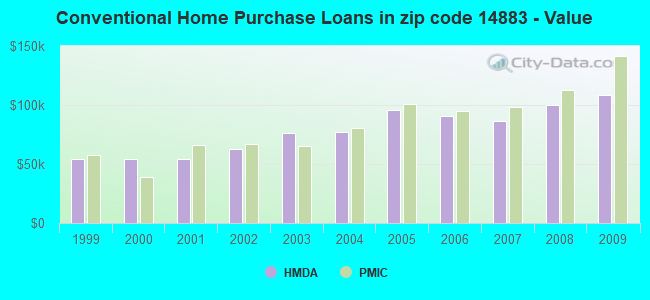
Home Mortgage Disclosure Act Aggregated Statistics For Year 2009 (Based on 2 full and 2 partial tracts)
A) FHA, FSA/RHS & VA Home Purchase Loans
B) Conventional Home Purchase Loans
C) Refinancings
D) Home Improvement Loans
F) Non-occupant Loans on < 5 Family Dwellings (A B C & D)
G) Loans On Manufactured Home Dwelling (A B C & D)
Number
Average Value
Number
Average Value
Number
Average Value
Number
Average Value
Number
Average Value
Number
Average Value
LOANS ORIGINATED
29
$118,071
39
$108,544
76
$106,262
43
$34,058
5
$144,822
34
$52,832
APPLICATIONS APPROVED, NOT ACCEPTED
2
$118,375
2
$217,635
5
$70,768
2
$14,525
0
$0
1
$29,960
APPLICATIONS DENIED
4
$137,940
19
$91,039
54
$121,671
31
$21,970
6
$85,765
12
$35,833
APPLICATIONS WITHDRAWN
2
$110,550
5
$152,928
21
$93,385
3
$40,113
0
$0
3
$81,470
FILES CLOSED FOR INCOMPLETENESS
1
$76,300
0
$0
6
$161,205
4
$18,588
2
$88,045
1
$68,290
Aggregated Statistics For Year 2008 (Based on 2 full and 2 partial tracts)
A) FHA, FSA/RHS & VA Home Purchase Loans
B) Conventional Home Purchase Loans
C) Refinancings
D) Home Improvement Loans
F) Non-occupant Loans on < 5 Family Dwellings (A B C & D)
G) Loans On Manufactured Home Dwelling (A B C & D)
Number
Average Value
Number
Average Value
Number
Average Value
Number
Average Value
Number
Average Value
Number
Average Value
LOANS ORIGINATED
7
$95,316
40
$99,749
53
$110,146
34
$27,247
11
$80,691
21
$51,472
APPLICATIONS APPROVED, NOT ACCEPTED
2
$115,985
9
$54,507
9
$64,668
8
$6,359
0
$0
9
$54,507
APPLICATIONS DENIED
2
$121,310
12
$94,938
63
$92,057
37
$49,003
1
$97,550
20
$66,438
APPLICATIONS WITHDRAWN
0
$0
2
$173,745
37
$119,515
7
$25,447
2
$31,305
4
$106,098
FILES CLOSED FOR INCOMPLETENESS
0
$0
0
$0
7
$148,144
0
$0
0
$0
0
$0
Aggregated Statistics For Year 2007 (Based on 2 full and 2 partial tracts)
A) FHA, FSA/RHS & VA Home Purchase Loans
B) Conventional Home Purchase Loans
C) Refinancings
D) Home Improvement Loans
F) Non-occupant Loans on < 5 Family Dwellings (A B C & D)
G) Loans On Manufactured Home Dwelling (A B C & D)
Number
Average Value
Number
Average Value
Number
Average Value
Number
Average Value
Number
Average Value
Number
Average Value
LOANS ORIGINATED
6
$158,158
62
$86,517
67
$87,867
68
$34,151
10
$110,850
33
$35,696
APPLICATIONS APPROVED, NOT ACCEPTED
0
$0
9
$36,564
19
$90,725
4
$51,428
3
$157,193
2
$14,675
APPLICATIONS DENIED
0
$0
24
$58,579
67
$106,768
46
$32,612
9
$62,799
18
$44,386
APPLICATIONS WITHDRAWN
0
$0
0
$0
67
$104,746
3
$30,590
10
$76,462
6
$41,910
FILES CLOSED FOR INCOMPLETENESS
0
$0
1
$127,860
3
$133,097
2
$18,935
0
$0
0
$0
Aggregated Statistics For Year 2006 (Based on 2 full and 2 partial tracts)
A) FHA, FSA/RHS & VA Home Purchase Loans
B) Conventional Home Purchase Loans
C) Refinancings
D) Home Improvement Loans
F) Non-occupant Loans on < 5 Family Dwellings (A B C & D)
G) Loans On Manufactured Home Dwelling (A B C & D)
Number
Average Value
Number
Average Value
Number
Average Value
Number
Average Value
Number
Average Value
Number
Average Value
LOANS ORIGINATED
5
$66,126
79
$90,777
86
$69,213
75
$40,231
15
$82,557
29
$59,556
APPLICATIONS APPROVED, NOT ACCEPTED
2
$124,245
19
$67,294
14
$71,271
3
$44,080
2
$41,760
8
$75,724
APPLICATIONS DENIED
5
$44,968
25
$79,764
82
$86,293
63
$37,346
8
$60,900
23
$51,750
APPLICATIONS WITHDRAWN
0
$0
13
$94,062
57
$85,414
2
$55,045
2
$152,960
3
$43,537
FILES CLOSED FOR INCOMPLETENESS
0
$0
5
$102,148
12
$106,790
4
$32,832
0
$0
0
$0
Aggregated Statistics For Year 2005 (Based on 2 full and 2 partial tracts)
A) FHA, FSA/RHS & VA Home Purchase Loans
B) Conventional Home Purchase Loans
C) Refinancings
D) Home Improvement Loans
F) Non-occupant Loans on < 5 Family Dwellings (A B C & D)
G) Loans On Manufactured Home Dwelling (A B C & D)
Number
Average Value
Number
Average Value
Number
Average Value
Number
Average Value
Number
Average Value
Number
Average Value
LOANS ORIGINATED
9
$75,851
90
$95,769
99
$81,592
57
$32,330
23
$64,960
36
$47,293
APPLICATIONS APPROVED, NOT ACCEPTED
3
$82,970
10
$108,920
20
$93,020
3
$29,633
0
$0
1
$52,960
APPLICATIONS DENIED
0
$0
27
$95,590
136
$87,375
53
$29,842
5
$23,730
39
$42,345
APPLICATIONS WITHDRAWN
2
$59,675
11
$90,565
80
$100,284
6
$28,495
4
$34,240
4
$76,182
FILES CLOSED FOR INCOMPLETENESS
0
$0
6
$97,275
30
$114,240
2
$34,575
0
$0
0
$0
Aggregated Statistics For Year 2004 (Based on 2 full and 2 partial tracts)
A) FHA, FSA/RHS & VA Home Purchase Loans
B) Conventional Home Purchase Loans
C) Refinancings
D) Home Improvement Loans
E) Loans on Dwellings For 5+ Families
F) Non-occupant Loans on < 5 Family Dwellings (A B C & D)
G) Loans On Manufactured Home Dwelling (A B C & D)
Number
Average Value
Number
Average Value
Number
Average Value
Number
Average Value
Number
Average Value
Number
Average Value
Number
Average Value
LOANS ORIGINATED
12
$73,032
93
$77,019
101
$71,350
62
$19,680
1
$330,980
19
$68,977
39
$51,459
APPLICATIONS APPROVED, NOT ACCEPTED
0
$0
7
$61,743
21
$77,981
4
$13,125
0
$0
0
$0
2
$54,875
APPLICATIONS DENIED
0
$0
30
$72,549
122
$73,796
38
$21,377
0
$0
8
$70,028
40
$52,773
APPLICATIONS WITHDRAWN
0
$0
20
$72,210
60
$89,075
3
$73,723
0
$0
0
$0
9
$58,914
FILES CLOSED FOR INCOMPLETENESS
0
$0
0
$0
21
$84,980
6
$56,415
0
$0
4
$68,480
2
$91,960
Aggregated Statistics For Year 2003 (Based on 2 full tracts)
A) FHA, FSA/RHS & VA Home Purchase Loans
B) Conventional Home Purchase Loans
C) Refinancings
D) Home Improvement Loans
E) Loans on Dwellings For 5+ Families
F) Non-occupant Loans on < 5 Family Dwellings (A B C & D)
Number
Average Value
Number
Average Value
Number
Average Value
Number
Average Value
Number
Average Value
Number
Average Value
LOANS ORIGINATED
6
$62,612
57
$76,239
112
$68,376
29
$16,462
2
$77,285
10
$26,218
APPLICATIONS APPROVED, NOT ACCEPTED
0
$0
14
$73,791
27
$71,670
0
$0
0
$0
2
$14,675
APPLICATIONS DENIED
2
$89,025
22
$49,182
125
$66,368
23
$31,220
0
$0
2
$78,265
APPLICATIONS WITHDRAWN
0
$0
23
$63,207
78
$100,288
12
$29,675
2
$28,370
10
$49,502
FILES CLOSED FOR INCOMPLETENESS
0
$0
2
$159,465
6
$194,682
0
$0
0
$0
0
$0
Aggregated Statistics For Year 2002 (Based on 2 full tracts)
A) FHA, FSA/RHS & VA Home Purchase Loans
B) Conventional Home Purchase Loans
C) Refinancings
D) Home Improvement Loans
F) Non-occupant Loans on < 5 Family Dwellings (A B C & D)
Number
Average Value
Number
Average Value
Number
Average Value
Number
Average Value
Number
Average Value
LOANS ORIGINATED
8
$97,096
45
$62,350
78
$66,299
35
$16,324
8
$63,100
APPLICATIONS APPROVED, NOT ACCEPTED
4
$40,110
12
$70,763
12
$60,166
2
$12,720
2
$158,485
APPLICATIONS DENIED
0
$0
33
$53,125
72
$69,459
16
$5,258
0
$0
APPLICATIONS WITHDRAWN
0
$0
6
$93,917
53
$77,858
2
$20,545
4
$26,415
FILES CLOSED FOR INCOMPLETENESS
0
$0
2
$46,960
10
$73,764
2
$11,740
0
$0
Aggregated Statistics For Year 2001 (Based on 2 full tracts)
A) FHA, FSA/RHS & VA Home Purchase Loans
B) Conventional Home Purchase Loans
C) Refinancings
D) Home Improvement Loans
F) Non-occupant Loans on < 5 Family Dwellings (A B C & D)
Number
Average Value
Number
Average Value
Number
Average Value
Number
Average Value
Number
Average Value
LOANS ORIGINATED
6
$55,437
63
$54,133
39
$69,936
23
$23,479
8
$38,154
APPLICATIONS APPROVED, NOT ACCEPTED
6
$69,460
16
$41,700
22
$122,554
4
$19,565
4
$48,425
APPLICATIONS DENIED
4
$43,535
47
$37,592
61
$54,336
20
$17,414
12
$42,393
APPLICATIONS WITHDRAWN
4
$59,188
6
$35,872
59
$49,976
6
$16,632
2
$14,675
FILES CLOSED FOR INCOMPLETENESS
0
$0
2
$110,550
6
$64,568
0
$0
0
$0
Aggregated Statistics For Year 2000 (Based on 2 full tracts)
A) FHA, FSA/RHS & VA Home Purchase Loans
B) Conventional Home Purchase Loans
C) Refinancings
D) Home Improvement Loans
E) Loans on Dwellings For 5+ Families
F) Non-occupant Loans on < 5 Family Dwellings (A B C & D)
Number
Average Value
Number
Average Value
Number
Average Value
Number
Average Value
Number
Average Value
Number
Average Value
LOANS ORIGINATED
8
$47,448
61
$54,368
33
$57,868
27
$18,261
2
$117,395
10
$38,349
APPLICATIONS APPROVED, NOT ACCEPTED
0
$0
14
$56,601
12
$49,893
4
$33,752
0
$0
0
$0
APPLICATIONS DENIED
2
$40,110
82
$44,692
68
$56,482
25
$22,853
0
$0
2
$84,135
APPLICATIONS WITHDRAWN
0
$0
8
$71,416
22
$61,277
0
$0
0
$0
0
$0
FILES CLOSED FOR INCOMPLETENESS
0
$0
0
$0
4
$22,012
2
$14,675
0
$0
0
$0
Aggregated Statistics For Year 1999 (Based on 1 full tract)
A) FHA, FSA/RHS & VA Home Purchase Loans
B) Conventional Home Purchase Loans
C) Refinancings
D) Home Improvement Loans
E) Loans on Dwellings For 5+ Families
F) Non-occupant Loans on < 5 Family Dwellings (A B C & D)


 Nearest zip codes: 13864, 14889, 13743, 14859, 14867, 14817.