Estimated zip code population in 2022: 9,025
Zip code population in 2010: 10,406
Zip code population in 2000: 13,352
Houses and condos: 5,537
Renter-occupied apartments: 1,993
% of renters here:
49%State:
31%
March 2022 cost of living index in zip code 15208: 94.8
(less than average, U.S. average is 100)
Land area: 1.6
sq. mi.
Water area: 0.0
sq. mi.
Population density: 5,609 people per square mile (average).
OSM Map
General Map
Google Map
MSN Map
OSM Map
General Map
Google Map
MSN Map
OSM Map
General Map
Google Map
MSN Map
OSM Map
General Map
Google Map
MSN Map
Please wait while loading the map...
Real estate property taxes paid for housing units in 2022:
This zip code:
1.2% ($2,749)Pennsylvania:
1.3% ($3,094)
Median real estate property taxes paid for housing units with mortgages in 2022: $3,680 (1.3%)
Median real estate property taxes paid for housing units with no mortgage in 2022: $1,392 (0.8%)
Profiles of local businesses
Business Search - 14 Million verified businesses
Males: 4,428 Females: 4,596
For population 25 years and over in 15208:
High school or higher: 96.6%Bachelor's degree or higher: 52.3%Graduate or professional degree: 32.6%Unemployed: 4.6%Mean travel time to work (commute): 21.1 minutes
For population 15 years and over in 15208:
Never married: 44.9%Now married: 36.4%Separated: 1.3%Widowed: 5.7%Divorced: 11.8%
Zip code 15208 compared to state average:
Black race population percentage significantly above state average. Hispanic race population percentage significantly below state average. Median age below state average. Renting percentage above state average. Length of stay since moving in significantly above state average. House age above state average. 4,748 52.6% Black 3,371 37.4% White 408 4.5% Two or more races 218 2.4% Asian 203 2.3% Hispanic or Latino 73 0.8% Some other race
Data:
Median household income ($)
Median household income (% change since 2000)
Household income diversity
Ratio of average income to average house value (%)
Ratio of average income to average rent
Median household income ($) - White
Median household income ($) - Black or African American
Median household income ($) - Asian
Median household income ($) - Hispanic or Latino
Median household income ($) - American Indian and Alaska Native
Median household income ($) - Multirace
Median household income ($) - Other Race
Median household income for houses/condos with a mortgage ($)
Median household income for apartments without a mortgage ($)
Races - White alone (%)
Races - White alone (% change since 2000)
Races - Black alone (%)
Races - Black alone (% change since 2000)
Races - American Indian alone (%)
Races - American Indian alone (% change since 2000)
Races - Asian alone (%)
Races - Asian alone (% change since 2000)
Races - Hispanic (%)
Races - Hispanic (% change since 2000)
Races - Native Hawaiian and Other Pacific Islander alone (%)
Races - Native Hawaiian and Other Pacific Islander alone (% change since 2000)
Races - Two or more races (%)
Races - Two or more races (% change since 2000)
Races - Other race alone (%)
Races - Other race alone (% change since 2000)
Racial diversity
Unemployment (%)
Unemployment (% change since 2000)
Unemployment (%) - White
Unemployment (%) - Black or African American
Unemployment (%) - Asian
Unemployment (%) - Hispanic or Latino
Unemployment (%) - American Indian and Alaska Native
Unemployment (%) - Multirace
Unemployment (%) - Other Race
Population density (people per square mile)
Population - Males (%)
Population - Females (%)
Population - Males (%) - White
Population - Males (%) - Black or African American
Population - Males (%) - Asian
Population - Males (%) - Hispanic or Latino
Population - Males (%) - American Indian and Alaska Native
Population - Males (%) - Multirace
Population - Males (%) - Other Race
Population - Females (%) - White
Population - Females (%) - Black or African American
Population - Females (%) - Asian
Population - Females (%) - Hispanic or Latino
Population - Females (%) - American Indian and Alaska Native
Population - Females (%) - Multirace
Population - Females (%) - Other Race
Coronavirus confirmed cases (May 03, 2024)
Deaths caused by coronavirus (May 03, 2024)
Coronavirus confirmed cases (per 100k population) (May 03, 2024)
Deaths caused by coronavirus (per 100k population) (May 03, 2024)
Daily increase in number of cases (May 03, 2024)
Weekly increase in number of cases (May 03, 2024)
Cases doubled (in days) (May 03, 2024)
Hospitalized patients (Apr 18, 2022)
Negative test results (Apr 18, 2022)
Total test results (Apr 18, 2022)
COVID Vaccine doses distributed (per 100k population) (Sep 19, 2023)
COVID Vaccine doses administered (per 100k population) (Sep 19, 2023)
COVID Vaccine doses distributed (Sep 19, 2023)
COVID Vaccine doses administered (Sep 19, 2023)
Likely homosexual households (%)
Likely homosexual households (% change since 2000)
Likely homosexual households - Lesbian couples (%)
Likely homosexual households - Lesbian couples (% change since 2000)
Likely homosexual households - Gay men (%)
Likely homosexual households - Gay men (% change since 2000)
Cost of living index
Median gross rent ($)
Median contract rent ($)
Median monthly housing costs ($)
Median house or condo value ($)
Median house or condo value ($ change since 2000)
Mean house or condo value by units in structure - 1, detached ($)
Mean house or condo value by units in structure - 1, attached ($)
Mean house or condo value by units in structure - 2 ($)
Mean house or condo value by units in structure by units in structure - 3 or 4 ($)
Mean house or condo value by units in structure - 5 or more ($)
Mean house or condo value by units in structure - Boat, RV, van, etc. ($)
Mean house or condo value by units in structure - Mobile home ($)
Median house or condo value ($) - White
Median house or condo value ($) - Black or African American
Median house or condo value ($) - Asian
Median house or condo value ($) - Hispanic or Latino
Median house or condo value ($) - American Indian and Alaska Native
Median house or condo value ($) - Multirace
Median house or condo value ($) - Other Race
Median resident age
Resident age diversity
Median resident age - Males
Median resident age - Females
Median resident age - White
Median resident age - Black or African American
Median resident age - Asian
Median resident age - Hispanic or Latino
Median resident age - American Indian and Alaska Native
Median resident age - Multirace
Median resident age - Other Race
Median resident age - Males - White
Median resident age - Males - Black or African American
Median resident age - Males - Asian
Median resident age - Males - Hispanic or Latino
Median resident age - Males - American Indian and Alaska Native
Median resident age - Males - Multirace
Median resident age - Males - Other Race
Median resident age - Females - White
Median resident age - Females - Black or African American
Median resident age - Females - Asian
Median resident age - Females - Hispanic or Latino
Median resident age - Females - American Indian and Alaska Native
Median resident age - Females - Multirace
Median resident age - Females - Other Race
Commute - mean travel time to work (minutes)
Travel time to work - Less than 5 minutes (%)
Travel time to work - Less than 5 minutes (% change since 2000)
Travel time to work - 5 to 9 minutes (%)
Travel time to work - 5 to 9 minutes (% change since 2000)
Travel time to work - 10 to 19 minutes (%)
Travel time to work - 10 to 19 minutes (% change since 2000)
Travel time to work - 20 to 29 minutes (%)
Travel time to work - 20 to 29 minutes (% change since 2000)
Travel time to work - 30 to 39 minutes (%)
Travel time to work - 30 to 39 minutes (% change since 2000)
Travel time to work - 40 to 59 minutes (%)
Travel time to work - 40 to 59 minutes (% change since 2000)
Travel time to work - 60 to 89 minutes (%)
Travel time to work - 60 to 89 minutes (% change since 2000)
Travel time to work - 90 or more minutes (%)
Travel time to work - 90 or more minutes (% change since 2000)
Marital status - Never married (%)
Marital status - Now married (%)
Marital status - Separated (%)
Marital status - Widowed (%)
Marital status - Divorced (%)
Median family income ($)
Median family income (% change since 2000)
Median non-family income ($)
Median non-family income (% change since 2000)
Median per capita income ($)
Median per capita income (% change since 2000)
Median family income ($) - White
Median family income ($) - Black or African American
Median family income ($) - Asian
Median family income ($) - Hispanic or Latino
Median family income ($) - American Indian and Alaska Native
Median family income ($) - Multirace
Median family income ($) - Other Race
Median year house/condo built
Median year apartment built
Year house built - Built 2005 or later (%)
Year house built - Built 2000 to 2004 (%)
Year house built - Built 1990 to 1999 (%)
Year house built - Built 1980 to 1989 (%)
Year house built - Built 1970 to 1979 (%)
Year house built - Built 1960 to 1969 (%)
Year house built - Built 1950 to 1959 (%)
Year house built - Built 1940 to 1949 (%)
Year house built - Built 1939 or earlier (%)
Average household size
Household density (households per square mile)
Average household size - White
Average household size - Black or African American
Average household size - Asian
Average household size - Hispanic or Latino
Average household size - American Indian and Alaska Native
Average household size - Multirace
Average household size - Other Race
Occupied housing units (%)
Vacant housing units (%)
Owner occupied housing units (%)
Renter occupied housing units (%)
Vacancy status - For rent (%)
Vacancy status - For sale only (%)
Vacancy status - Rented or sold, not occupied (%)
Vacancy status - For seasonal, recreational, or occasional use (%)
Vacancy status - For migrant workers (%)
Vacancy status - Other vacant (%)
Residents with income below the poverty level (%)
Residents with income below 50% of the poverty level (%)
Children below poverty level (%)
Poor families by family type - Married-couple family (%)
Poor families by family type - Male, no wife present (%)
Poor families by family type - Female, no husband present (%)
Poverty status for native-born residents (%)
Poverty status for foreign-born residents (%)
Poverty among high school graduates not in families (%)
Poverty among people who did not graduate high school not in families (%)
Residents with income below the poverty level (%) - White
Residents with income below the poverty level (%) - Black or African American
Residents with income below the poverty level (%) - Asian
Residents with income below the poverty level (%) - Hispanic or Latino
Residents with income below the poverty level (%) - American Indian and Alaska Native
Residents with income below the poverty level (%) - Multirace
Residents with income below the poverty level (%) - Other Race
Air pollution - Air Quality Index (AQI)
Air pollution - CO
Air pollution - NO2
Air pollution - SO2
Air pollution - Ozone
Air pollution - PM10
Air pollution - PM25
Air pollution - Pb
Crime - Murders per 100,000 population
Crime - Rapes per 100,000 population
Crime - Robberies per 100,000 population
Crime - Assaults per 100,000 population
Crime - Burglaries per 100,000 population
Crime - Thefts per 100,000 population
Crime - Auto thefts per 100,000 population
Crime - Arson per 100,000 population
Crime - City-data.com crime index
Crime - Violent crime index
Crime - Property crime index
Crime - Murders per 100,000 population (5 year average)
Crime - Rapes per 100,000 population (5 year average)
Crime - Robberies per 100,000 population (5 year average)
Crime - Assaults per 100,000 population (5 year average)
Crime - Burglaries per 100,000 population (5 year average)
Crime - Thefts per 100,000 population (5 year average)
Crime - Auto thefts per 100,000 population (5 year average)
Crime - Arson per 100,000 population (5 year average)
Crime - City-data.com crime index (5 year average)
Crime - Violent crime index (5 year average)
Crime - Property crime index (5 year average)
1996 Presidential Elections Results (%) - Democratic Party (Clinton)
1996 Presidential Elections Results (%) - Republican Party (Dole)
1996 Presidential Elections Results (%) - Other
2000 Presidential Elections Results (%) - Democratic Party (Gore)
2000 Presidential Elections Results (%) - Republican Party (Bush)
2000 Presidential Elections Results (%) - Other
2004 Presidential Elections Results (%) - Democratic Party (Kerry)
2004 Presidential Elections Results (%) - Republican Party (Bush)
2004 Presidential Elections Results (%) - Other
2008 Presidential Elections Results (%) - Democratic Party (Obama)
2008 Presidential Elections Results (%) - Republican Party (McCain)
2008 Presidential Elections Results (%) - Other
2012 Presidential Elections Results (%) - Democratic Party (Obama)
2012 Presidential Elections Results (%) - Republican Party (Romney)
2012 Presidential Elections Results (%) - Other
2016 Presidential Elections Results (%) - Democratic Party (Clinton)
2016 Presidential Elections Results (%) - Republican Party (Trump)
2016 Presidential Elections Results (%) - Other
2020 Presidential Elections Results (%) - Democratic Party (Biden)
2020 Presidential Elections Results (%) - Republican Party (Trump)
2020 Presidential Elections Results (%) - Other
Ancestries Reported - Arab (%)
Ancestries Reported - Czech (%)
Ancestries Reported - Danish (%)
Ancestries Reported - Dutch (%)
Ancestries Reported - English (%)
Ancestries Reported - French (%)
Ancestries Reported - French Canadian (%)
Ancestries Reported - German (%)
Ancestries Reported - Greek (%)
Ancestries Reported - Hungarian (%)
Ancestries Reported - Irish (%)
Ancestries Reported - Italian (%)
Ancestries Reported - Lithuanian (%)
Ancestries Reported - Norwegian (%)
Ancestries Reported - Polish (%)
Ancestries Reported - Portuguese (%)
Ancestries Reported - Russian (%)
Ancestries Reported - Scotch-Irish (%)
Ancestries Reported - Scottish (%)
Ancestries Reported - Slovak (%)
Ancestries Reported - Subsaharan African (%)
Ancestries Reported - Swedish (%)
Ancestries Reported - Swiss (%)
Ancestries Reported - Ukrainian (%)
Ancestries Reported - United States (%)
Ancestries Reported - Welsh (%)
Ancestries Reported - West Indian (%)
Ancestries Reported - Other (%)
Educational Attainment - No schooling completed (%)
Educational Attainment - Less than high school (%)
Educational Attainment - High school or equivalent (%)
Educational Attainment - Less than 1 year of college (%)
Educational Attainment - 1 or more years of college (%)
Educational Attainment - Associate degree (%)
Educational Attainment - Bachelor's degree (%)
Educational Attainment - Master's degree (%)
Educational Attainment - Professional school degree (%)
Educational Attainment - Doctorate degree (%)
School Enrollment - Nursery, preschool (%)
School Enrollment - Kindergarten (%)
School Enrollment - Grade 1 to 4 (%)
School Enrollment - Grade 5 to 8 (%)
School Enrollment - Grade 9 to 12 (%)
School Enrollment - College undergrad (%)
School Enrollment - Graduate or professional (%)
School Enrollment - Not enrolled in school (%)
School enrollment - Public schools (%)
School enrollment - Private schools (%)
School enrollment - Not enrolled (%)
Median number of rooms in houses and condos
Median number of rooms in apartments
Housing units lacking complete plumbing facilities (%)
Housing units lacking complete kitchen facilities (%)
Density of houses
Urban houses (%)
Rural houses (%)
Households with people 60 years and over (%)
Households with people 65 years and over (%)
Households with people 75 years and over (%)
Households with one or more nonrelatives (%)
Households with no nonrelatives (%)
Population in households (%)
Family households (%)
Nonfamily households (%)
Population in families (%)
Family households with own children (%)
Median number of bedrooms in owner occupied houses
Mean number of bedrooms in owner occupied houses
Median number of bedrooms in renter occupied houses
Mean number of bedrooms in renter occupied houses
Median number of vehichles in owner occupied houses
Mean number of vehichles in owner occupied houses
Median number of vehichles in renter occupied houses
Mean number of vehichles in renter occupied houses
Mortgage status - with mortgage (%)
Mortgage status - with second mortgage (%)
Mortgage status - with home equity loan (%)
Mortgage status - with both second mortgage and home equity loan (%)
Mortgage status - without a mortgage (%)
Average family size
Average family size - White
Average family size - Black or African American
Average family size - Asian
Average family size - Hispanic or Latino
Average family size - American Indian and Alaska Native
Average family size - Multirace
Average family size - Other Race
Geographical mobility - Same house 1 year ago (%)
Geographical mobility - Moved within same county (%)
Geographical mobility - Moved from different county within same state (%)
Geographical mobility - Moved from different state (%)
Geographical mobility - Moved from abroad (%)
Place of birth - Born in state of residence (%)
Place of birth - Born in other state (%)
Place of birth - Native, outside of US (%)
Place of birth - Foreign born (%)
Housing units in structures - 1, detached (%)
Housing units in structures - 1, attached (%)
Housing units in structures - 2 (%)
Housing units in structures - 3 or 4 (%)
Housing units in structures - 5 to 9 (%)
Housing units in structures - 10 to 19 (%)
Housing units in structures - 20 to 49 (%)
Housing units in structures - 50 or more (%)
Housing units in structures - Mobile home (%)
Housing units in structures - Boat, RV, van, etc. (%)
House/condo owner moved in on average (years ago)
Renter moved in on average (years ago)
Year householder moved into unit - Moved in 1999 to March 2000 (%)
Year householder moved into unit - Moved in 1995 to 1998 (%)
Year householder moved into unit - Moved in 1990 to 1994 (%)
Year householder moved into unit - Moved in 1980 to 1989 (%)
Year householder moved into unit - Moved in 1970 to 1979 (%)
Year householder moved into unit - Moved in 1969 or earlier (%)
Means of transportation to work - Drove car alone (%)
Means of transportation to work - Carpooled (%)
Means of transportation to work - Public transportation (%)
Means of transportation to work - Bus or trolley bus (%)
Means of transportation to work - Streetcar or trolley car (%)
Means of transportation to work - Subway or elevated (%)
Means of transportation to work - Railroad (%)
Means of transportation to work - Ferryboat (%)
Means of transportation to work - Taxicab (%)
Means of transportation to work - Motorcycle (%)
Means of transportation to work - Bicycle (%)
Means of transportation to work - Walked (%)
Means of transportation to work - Other means (%)
Working at home (%)
Industry diversity
Most Common Industries - Agriculture, forestry, fishing and hunting, and mining (%)
Most Common Industries - Agriculture, forestry, fishing and hunting (%)
Most Common Industries - Mining, quarrying, and oil and gas extraction (%)
Most Common Industries - Construction (%)
Most Common Industries - Manufacturing (%)
Most Common Industries - Wholesale trade (%)
Most Common Industries - Retail trade (%)
Most Common Industries - Transportation and warehousing, and utilities (%)
Most Common Industries - Transportation and warehousing (%)
Most Common Industries - Utilities (%)
Most Common Industries - Information (%)
Most Common Industries - Finance and insurance, and real estate and rental and leasing (%)
Most Common Industries - Finance and insurance (%)
Most Common Industries - Real estate and rental and leasing (%)
Most Common Industries - Professional, scientific, and management, and administrative and waste management services (%)
Most Common Industries - Professional, scientific, and technical services (%)
Most Common Industries - Management of companies and enterprises (%)
Most Common Industries - Administrative and support and waste management services (%)
Most Common Industries - Educational services, and health care and social assistance (%)
Most Common Industries - Educational services (%)
Most Common Industries - Health care and social assistance (%)
Most Common Industries - Arts, entertainment, and recreation, and accommodation and food services (%)
Most Common Industries - Arts, entertainment, and recreation (%)
Most Common Industries - Accommodation and food services (%)
Most Common Industries - Other services, except public administration (%)
Most Common Industries - Public administration (%)
Occupation diversity
Most Common Occupations - Management, business, science, and arts occupations (%)
Most Common Occupations - Management, business, and financial occupations (%)
Most Common Occupations - Management occupations (%)
Most Common Occupations - Business and financial operations occupations (%)
Most Common Occupations - Computer, engineering, and science occupations (%)
Most Common Occupations - Computer and mathematical occupations (%)
Most Common Occupations - Architecture and engineering occupations (%)
Most Common Occupations - Life, physical, and social science occupations (%)
Most Common Occupations - Education, legal, community service, arts, and media occupations (%)
Most Common Occupations - Community and social service occupations (%)
Most Common Occupations - Legal occupations (%)
Most Common Occupations - Education, training, and library occupations (%)
Most Common Occupations - Arts, design, entertainment, sports, and media occupations (%)
Most Common Occupations - Healthcare practitioners and technical occupations (%)
Most Common Occupations - Health diagnosing and treating practitioners and other technical occupations (%)
Most Common Occupations - Health technologists and technicians (%)
Most Common Occupations - Service occupations (%)
Most Common Occupations - Healthcare support occupations (%)
Most Common Occupations - Protective service occupations (%)
Most Common Occupations - Fire fighting and prevention, and other protective service workers including supervisors (%)
Most Common Occupations - Law enforcement workers including supervisors (%)
Most Common Occupations - Food preparation and serving related occupations (%)
Most Common Occupations - Building and grounds cleaning and maintenance occupations (%)
Most Common Occupations - Personal care and service occupations (%)
Most Common Occupations - Sales and office occupations (%)
Most Common Occupations - Sales and related occupations (%)
Most Common Occupations - Office and administrative support occupations (%)
Most Common Occupations - Natural resources, construction, and maintenance occupations (%)
Most Common Occupations - Farming, fishing, and forestry occupations (%)
Most Common Occupations - Construction and extraction occupations (%)
Most Common Occupations - Installation, maintenance, and repair occupations (%)
Most Common Occupations - Production, transportation, and material moving occupations (%)
Most Common Occupations - Production occupations (%)
Most Common Occupations - Transportation occupations (%)
Most Common Occupations - Material moving occupations (%)
People in Group quarters - Institutionalized population (%)
People in Group quarters - Correctional institutions (%)
People in Group quarters - Federal prisons and detention centers (%)
People in Group quarters - Halfway houses (%)
People in Group quarters - Local jails and other confinement facilities (including police lockups) (%)
People in Group quarters - Military disciplinary barracks (%)
People in Group quarters - State prisons (%)
People in Group quarters - Other types of correctional institutions (%)
People in Group quarters - Nursing homes (%)
People in Group quarters - Hospitals/wards, hospices, and schools for the handicapped (%)
People in Group quarters - Hospitals/wards and hospices for chronically ill (%)
People in Group quarters - Hospices or homes for chronically ill (%)
People in Group quarters - Military hospitals or wards for chronically ill (%)
People in Group quarters - Other hospitals or wards for chronically ill (%)
People in Group quarters - Hospitals or wards for drug/alcohol abuse (%)
People in Group quarters - Mental (Psychiatric) hospitals or wards (%)
People in Group quarters - Schools, hospitals, or wards for the mentally retarded (%)
People in Group quarters - Schools, hospitals, or wards for the physically handicapped (%)
People in Group quarters - Institutions for the deaf (%)
People in Group quarters - Institutions for the blind (%)
People in Group quarters - Orthopedic wards and institutions for the physically handicapped (%)
People in Group quarters - Wards in general hospitals for patients who have no usual home elsewhere (%)
People in Group quarters - Wards in military hospitals for patients who have no usual home elsewhere (%)
People in Group quarters - Juvenile institutions (%)
People in Group quarters - Long-term care (%)
People in Group quarters - Homes for abused, dependent, and neglected children (%)
People in Group quarters - Residential treatment centers for emotionally disturbed children (%)
People in Group quarters - Training schools for juvenile delinquents (%)
People in Group quarters - Short-term care, detention or diagnostic centers for delinquent children (%)
People in Group quarters - Type of juvenile institution unknown (%)
People in Group quarters - Noninstitutionalized population (%)
People in Group quarters - College dormitories (includes college quarters off campus) (%)
People in Group quarters - Military quarters (%)
People in Group quarters - On base (%)
People in Group quarters - Barracks, unaccompanied personnel housing (UPH), (Enlisted/Officer), ;and similar group living quarters for military personnel (%)
People in Group quarters - Transient quarters for temporary residents (%)
People in Group quarters - Military ships (%)
People in Group quarters - Group homes (%)
People in Group quarters - Homes or halfway houses for drug/alcohol abuse (%)
People in Group quarters - Homes for the mentally ill (%)
People in Group quarters - Homes for the mentally retarded (%)
People in Group quarters - Homes for the physically handicapped (%)
People in Group quarters - Other group homes (%)
People in Group quarters - Religious group quarters (%)
People in Group quarters - Dormitories (%)
People in Group quarters - Agriculture workers' dormitories on farms (%)
People in Group quarters - Job Corps and vocational training facilities (%)
People in Group quarters - Other workers' dormitories (%)
People in Group quarters - Crews of maritime vessels (%)
People in Group quarters - Other nonhousehold living situations (%)
People in Group quarters - Other noninstitutional group quarters (%)
Residents speaking English at home (%)
Residents speaking English at home - Born in the United States (%)
Residents speaking English at home - Native, born elsewhere (%)
Residents speaking English at home - Foreign born (%)
Residents speaking Spanish at home (%)
Residents speaking Spanish at home - Born in the United States (%)
Residents speaking Spanish at home - Native, born elsewhere (%)
Residents speaking Spanish at home - Foreign born (%)
Residents speaking other language at home (%)
Residents speaking other language at home - Born in the United States (%)
Residents speaking other language at home - Native, born elsewhere (%)
Residents speaking other language at home - Foreign born (%)
Class of Workers - Employee of private company (%)
Class of Workers - Self-employed in own incorporated business (%)
Class of Workers - Private not-for-profit wage and salary workers (%)
Class of Workers - Local government workers (%)
Class of Workers - State government workers (%)
Class of Workers - Federal government workers (%)
Class of Workers - Self-employed workers in own not incorporated business and Unpaid family workers (%)
House heating fuel used in houses and condos - Utility gas (%)
House heating fuel used in houses and condos - Bottled, tank, or LP gas (%)
House heating fuel used in houses and condos - Electricity (%)
House heating fuel used in houses and condos - Fuel oil, kerosene, etc. (%)
House heating fuel used in houses and condos - Coal or coke (%)
House heating fuel used in houses and condos - Wood (%)
House heating fuel used in houses and condos - Solar energy (%)
House heating fuel used in houses and condos - Other fuel (%)
House heating fuel used in houses and condos - No fuel used (%)
House heating fuel used in apartments - Utility gas (%)
House heating fuel used in apartments - Bottled, tank, or LP gas (%)
House heating fuel used in apartments - Electricity (%)
House heating fuel used in apartments - Fuel oil, kerosene, etc. (%)
House heating fuel used in apartments - Coal or coke (%)
House heating fuel used in apartments - Wood (%)
House heating fuel used in apartments - Solar energy (%)
House heating fuel used in apartments - Other fuel (%)
House heating fuel used in apartments - No fuel used (%)
Armed forces status - In Armed Forces (%)
Armed forces status - Civilian (%)
Armed forces status - Civilian - Veteran (%)
Armed forces status - Civilian - Nonveteran (%)
Fatal accidents locations in years 2005-2021
Fatal accidents locations in 2005
Fatal accidents locations in 2006
Fatal accidents locations in 2007
Fatal accidents locations in 2008
Fatal accidents locations in 2009
Fatal accidents locations in 2010
Fatal accidents locations in 2011
Fatal accidents locations in 2012
Fatal accidents locations in 2013
Fatal accidents locations in 2014
Fatal accidents locations in 2015
Fatal accidents locations in 2016
Fatal accidents locations in 2017
Fatal accidents locations in 2018
Fatal accidents locations in 2019
Fatal accidents locations in 2020
Fatal accidents locations in 2021
Alcohol use - People drinking some alcohol every month (%)
Alcohol use - People not drinking at all (%)
Alcohol use - Average days/month drinking alcohol
Alcohol use - Average drinks/week
Alcohol use - Average days/year people drink much
Audiometry - Average condition of hearing (%)
Audiometry - People that can hear a whisper from across a quiet room (%)
Audiometry - People that can hear normal voice from across a quiet room (%)
Audiometry - Ears ringing, roaring, buzzing (%)
Audiometry - Had a job exposure to loud noise (%)
Audiometry - Had off-work exposure to loud noise (%)
Blood Pressure & Cholesterol - Has high blood pressure (%)
Blood Pressure & Cholesterol - Checking blood pressure at home (%)
Blood Pressure & Cholesterol - Frequently checking blood cholesterol (%)
Blood Pressure & Cholesterol - Has high cholesterol level (%)
Consumer Behavior - Money monthly spent on food at supermarket/grocery store
Consumer Behavior - Money monthly spent on food at other stores
Consumer Behavior - Money monthly spent on eating out
Consumer Behavior - Money monthly spent on carryout/delivered foods
Consumer Behavior - Income spent on food at supermarket/grocery store (%)
Consumer Behavior - Income spent on food at other stores (%)
Consumer Behavior - Income spent on eating out (%)
Consumer Behavior - Income spent on carryout/delivered foods (%)
Current Health Status - General health condition (%)
Current Health Status - Blood donors (%)
Current Health Status - Has blood ever tested for HIV virus (%)
Current Health Status - Left-handed people (%)
Dermatology - People using sunscreen (%)
Diabetes - Diabetics (%)
Diabetes - Had a blood test for high blood sugar (%)
Diabetes - People taking insulin (%)
Diet Behavior & Nutrition - Diet health (%)
Diet Behavior & Nutrition - Milk product consumption (# of products/month)
Diet Behavior & Nutrition - Meals not home prepared (#/week)
Diet Behavior & Nutrition - Meals from fast food or pizza place (#/week)
Diet Behavior & Nutrition - Ready-to-eat foods (#/month)
Diet Behavior & Nutrition - Frozen meals/pizza (#/month)
Drug Use - People that ever used marijuana or hashish (%)
Drug Use - Ever used hard drugs (%)
Drug Use - Ever used any form of cocaine (%)
Drug Use - Ever used heroin (%)
Drug Use - Ever used methamphetamine (%)
Health Insurance - People covered by health insurance (%)
Kidney Conditions-Urology - Avg. # of times urinating at night
Medical Conditions - People with asthma (%)
Medical Conditions - People with anemia (%)
Medical Conditions - People with psoriasis (%)
Medical Conditions - People with overweight (%)
Medical Conditions - Elderly people having difficulties in thinking or remembering (%)
Medical Conditions - People who ever received blood transfusion (%)
Medical Conditions - People having trouble seeing even with glass/contacts (%)
Medical Conditions - People with arthritis (%)
Medical Conditions - People with gout (%)
Medical Conditions - People with congestive heart failure (%)
Medical Conditions - People with coronary heart disease (%)
Medical Conditions - People with angina pectoris (%)
Medical Conditions - People who ever had heart attack (%)
Medical Conditions - People who ever had stroke (%)
Medical Conditions - People with emphysema (%)
Medical Conditions - People with thyroid problem (%)
Medical Conditions - People with chronic bronchitis (%)
Medical Conditions - People with any liver condition (%)
Medical Conditions - People who ever had cancer or malignancy (%)
Mental Health - People who have little interest in doing things (%)
Mental Health - People feeling down, depressed, or hopeless (%)
Mental Health - People who have trouble sleeping or sleeping too much (%)
Mental Health - People feeling tired or having little energy (%)
Mental Health - People with poor appetite or overeating (%)
Mental Health - People feeling bad about themself (%)
Mental Health - People who have trouble concentrating on things (%)
Mental Health - People moving or speaking slowly or too fast (%)
Mental Health - People having thoughts they would be better off dead (%)
Oral Health - Average years since last visit a dentist
Oral Health - People embarrassed because of mouth (%)
Oral Health - People with gum disease (%)
Oral Health - General health of teeth and gums (%)
Oral Health - Average days a week using dental floss/device
Oral Health - Average days a week using mouthwash for dental problem
Oral Health - Average number of teeth
Pesticide Use - Households using pesticides to control insects (%)
Pesticide Use - Households using pesticides to kill weeds (%)
Physical Activity - People doing vigorous-intensity work activities (%)
Physical Activity - People doing moderate-intensity work activities (%)
Physical Activity - People walking or bicycling (%)
Physical Activity - People doing vigorous-intensity recreational activities (%)
Physical Activity - People doing moderate-intensity recreational activities (%)
Physical Activity - Average hours a day doing sedentary activities
Physical Activity - Average hours a day watching TV or videos
Physical Activity - Average hours a day using computer
Physical Functioning - People having limitations keeping them from working (%)
Physical Functioning - People limited in amount of work they can do (%)
Physical Functioning - People that need special equipment to walk (%)
Physical Functioning - People experiencing confusion/memory problems (%)
Physical Functioning - People requiring special healthcare equipment (%)
Prescription Medications - Average number of prescription medicines taking
Preventive Aspirin Use - Adults 40+ taking low-dose aspirin (%)
Reproductive Health - Vaginal deliveries (%)
Reproductive Health - Cesarean deliveries (%)
Reproductive Health - Deliveries resulted in a live birth (%)
Reproductive Health - Pregnancies resulted in a delivery (%)
Reproductive Health - Women breastfeeding newborns (%)
Reproductive Health - Women that had a hysterectomy (%)
Reproductive Health - Women that had both ovaries removed (%)
Reproductive Health - Women that have ever taken birth control pills (%)
Reproductive Health - Women taking birth control pills (%)
Reproductive Health - Women that have ever used Depo-Provera or injectables (%)
Reproductive Health - Women that have ever used female hormones (%)
Sexual Behavior - People 18+ that ever had sex (vaginal, anal, or oral) (%)
Sexual Behavior - Males 18+ that ever had vaginal sex with a woman (%)
Sexual Behavior - Males 18+ that ever performed oral sex on a woman (%)
Sexual Behavior - Males 18+ that ever had anal sex with a woman (%)
Sexual Behavior - Males 18+ that ever had any sex with a man (%)
Sexual Behavior - Females 18+ that ever had vaginal sex with a man (%)
Sexual Behavior - Females 18+ that ever performed oral sex on a man (%)
Sexual Behavior - Females 18+ that ever had anal sex with a man (%)
Sexual Behavior - Females 18+ that ever had any kind of sex with a woman (%)
Sexual Behavior - Average age people first had sex
Sexual Behavior - Average number of female sex partners in lifetime (males 18+)
Sexual Behavior - Average number of female vaginal sex partners in lifetime (males 18+)
Sexual Behavior - Average age people first performed oral sex on a woman (18+)
Sexual Behavior - Average number of woman performed oral sex on in lifetime (18+)
Sexual Behavior - Average number of male sex partners in lifetime (males 18+)
Sexual Behavior - Average number of male anal sex partners in lifetime (males 18+)
Sexual Behavior - Average age people first performed oral sex on a man (18+)
Sexual Behavior - Average number of male oral sex partners in lifetime (18+)
Sexual Behavior - People using protection when performing oral sex (%)
Sexual Behavior - Average number of times people have vaginal or anal sex a year
Sexual Behavior - People having sex without condom (%)
Sexual Behavior - Average number of male sex partners in lifetime (females 18+)
Sexual Behavior - Average number of male vaginal sex partners in lifetime (females 18+)
Sexual Behavior - Average number of female sex partners in lifetime (females 18+)
Sexual Behavior - Circumcised males 18+ (%)
Sleep Disorders - Average hours sleeping at night
Sleep Disorders - People that has trouble sleeping (%)
Smoking-Cigarette Use - People smoking cigarettes (%)
Taste & Smell - People 40+ having problems with smell (%)
Taste & Smell - People 40+ having problems with taste (%)
Taste & Smell - People 40+ that ever had wisdom teeth removed (%)
Taste & Smell - People 40+ that ever had tonsils teeth removed (%)
Taste & Smell - People 40+ that ever had a loss of consciousness because of a head injury (%)
Taste & Smell - People 40+ that ever had a broken nose or other serious injury to face or skull (%)
Taste & Smell - People 40+ that ever had two or more sinus infections (%)
Weight - Average height (inches)
Weight - Average weight (pounds)
Weight - Average BMI
Weight - People that are obese (%)
Weight - People that ever were obese (%)
Weight - People trying to lose weight (%)
100%
urban population.
Estimated median house/condo value in 2022: $224,445
15208:
$224,445Pennsylvania:
$245,500
Median resident age: This zip code:
35.4 yearsPennsylvania median age:
40.9 years
Average household size: This zip code:
2.2 peoplePennsylvania:
2.4 people
Averages for the 2020 tax year for zip code 15208, filed in 2021:
Average Adjusted Gross Income (AGI) in 2020: $85,940 (Individual Income Tax Returns) Here:
$85,940State:
$75,707
Salary/wage: $70,169 (reported on 81.1% of returns )Here:
$70,169State:
$62,806
(% of AGI for various income ranges: 982.4% for AGIs below $25k , 3215.9% for AGIs $25k-50k , 6455.6% for AGIs $50k-75k , 9767.9% for AGIs $75k-100k , 20166.3% for AGIs $100k-200k , 114600.0% for AGIs over 200k ) Taxable interest for individuals: $2,016 (reported on 27.1% of returns )This zip code:
$2,016Pennsylvania:
$1,633
(% of AGI for various income ranges: 6.6% for AGIs below $25k , 11.6% for AGIs $25k-50k , 31.8% for AGIs $50k-75k , 44.3% for AGIs $75k-100k , 182.6% for AGIs $100k-200k , 1462.5% for AGIs over 200k ) Ordinary dividends: $17,036 (reported on 22.5% of returns )(% of AGI for various income ranges: 26.7% for AGIs below $25k , 35.9% for AGIs $25k-50k , 105.3% for AGIs $50k-75k , 413.6% for AGIs $75k-100k , 1178.9% for AGIs $100k-200k , 11229.2% for AGIs over 200k ) Net capital gain/loss in AGI: +$25,478 (reported on 19.6% of returns )Here:
+$25,478State:
+$23,522
(% of AGI for various income ranges: 15.3% for AGIs below $25k , 23.7% for AGIs $25k-50k , 110.3% for AGIs $50k-75k , 320.7% for AGIs $75k-100k , 1392.1% for AGIs $100k-200k , 15631.7% for AGIs over 200k ) Profit/loss from business: +$17,241 (reported on 16.5% of returns )Here:
+$17,241State:
+$16,274
(% of AGI for various income ranges: 74.7% for AGIs below $25k , 96.5% for AGIs $25k-50k , 209.7% for AGIs $50k-75k , 387.1% for AGIs $75k-100k , 1300.0% for AGIs $100k-200k , 6016.7% for AGIs over 200k ) Taxable individual retirement arrangement distribution: $34,318 (reported on 7.3% of returns )15208:
$34,318Pennsylvania:
$18,583
(% of AGI for various income ranges: 31.5% for AGIs below $25k , 32.1% for AGIs $25k-50k , 156.8% for AGIs $50k-75k , 477.1% for AGIs $75k-100k , 1592.6% for AGIs $100k-200k , 5293.3% for AGIs over 200k ) Self-employed (Keogh) retirement plans: $23,083 (reported on 1.3% of returns )15208:
$23,083Pennsylvania:
$25,407
(% of AGI for various income ranges: 1154.2% for AGIs over 200k ) Total itemized deductions: $41,911 (reported on 8.4% of returns )Here:
$41,911State:
$34,850
(% of AGI for various income ranges: 84.4% for AGIs $25k-50k , 176.8% for AGIs $50k-75k , 537.9% for AGIs $75k-100k , 1320.5% for AGIs $100k-200k , 9306.7% for AGIs over 200k ) Charity contributions: $21,676 (reported on 7.3% of returns )Here:
$21,676State:
$12,392
(% of AGI for various income ranges: 10.0% for AGIs below $25k , 35.3% for AGIs $50k-75k , 125.0% for AGIs $75k-100k , 463.2% for AGIs $100k-200k , 4874.2% for AGIs over 200k ) Taxes paid: $8,634 (reported on 8.4% of returns )(% of AGI for various income ranges: 13.5% for AGIs $25k-50k , 43.8% for AGIs $50k-75k , 137.1% for AGIs $75k-100k , 433.2% for AGIs $100k-200k , 1645.0% for AGIs over 200k ) Earned income credit: $2,404 (reported on 21.6% of returns )(% of AGI for various income ranges: 120.3% for AGIs below $25k , 75.8% for AGIs $25k-50k ) Percentage of individuals using paid preparers for their 2020 taxes: 92.3%(% for various income ranges: 91.1% for AGIs below $25k , 92.9% for AGIs $25k-50k , 91.7% for AGIs $50k-75k , 95.5% for AGIs $75k-100k , 92.9% for AGIs $100k-200k , 93.5% for AGIs over 200k )
Averages for the 2012 tax year for zip code 15208, filed in 2013:
Average Adjusted Gross Income (AGI) in 2012: $69,918 (Individual Income Tax Returns) Here:
$69,918State:
$61,346
Salary/wage: $55,047 (reported on 85.6% of returns )Here:
$55,047State:
$51,902
(% of AGI for various income ranges: 78.1% for AGIs below $25k , 83.5% for AGIs $25k-50k , 74.1% for AGIs $50k-75k , 69.1% for AGIs $75k-100k , 74.2% for AGIs $100k-200k , 58.3% for AGIs over 200k ) Taxable interest for individuals: $2,524 (reported on 27.3% of returns )This zip code:
$2,524Pennsylvania:
$1,588
(% of AGI for various income ranges: 0.5% for AGIs below $25k , 0.5% for AGIs $25k-50k , 0.5% for AGIs $50k-75k , 0.7% for AGIs $75k-100k , 0.6% for AGIs $100k-200k , 1.4% for AGIs over 200k ) Ordinary dividends: $12,636 (reported on 20.5% of returns )(% of AGI for various income ranges: 1.3% for AGIs below $25k , 1.1% for AGIs $25k-50k , 1.7% for AGIs $50k-75k , 2.4% for AGIs $75k-100k , 2.8% for AGIs $100k-200k , 5.5% for AGIs over 200k ) Net capital gain/loss in AGI: +$18,248 (reported on 15.5% of returns )Here:
+$18,248State:
+$14,495
(% of AGI for various income ranges: 0.1% for AGIs below $25k , 1.0% for AGIs $50k-75k , 0.6% for AGIs $75k-100k , 1.4% for AGIs $100k-200k , 7.4% for AGIs over 200k ) Profit/loss from business: +$18,879 (reported on 14.8% of returns )Here:
+$18,879State:
+$16,268
(% of AGI for various income ranges: 5.9% for AGIs below $25k , 1.2% for AGIs $25k-50k , 3.5% for AGIs $50k-75k , 1.7% for AGIs $75k-100k , 4.5% for AGIs $100k-200k , 4.5% for AGIs over 200k ) Taxable individual retirement arrangement distribution: $21,622 (reported on 7.0% of returns )15208:
$21,622Pennsylvania:
$14,550
(% of AGI for various income ranges: 1.3% for AGIs below $25k , 1.0% for AGIs $25k-50k , 2.8% for AGIs $50k-75k , 4.0% for AGIs $75k-100k , 4.5% for AGIs $100k-200k , 1.5% for AGIs over 200k ) Self-employment retirement plans: $21,200 (reported on 1.5% of returns )15208:
$21,200Pennsylvania:
$20,922
(% of AGI for various income ranges: 1.5% for AGIs $75k-100k , 0.8% for AGIs over 200k ) Total itemized deductions: $32,355 (16% of AGI, reported on 25.3% of returns )Here:
$32,355State:
$23,538
Here:
15.9% of AGIState:
18.4% of AGI
(% of AGI for various income ranges: 3.6% for AGIs below $25k , 5.3% for AGIs $25k-50k , 9.6% for AGIs $50k-75k , 14.5% for AGIs $75k-100k , 16.0% for AGIs $100k-200k , 13.1% for AGIs over 200k ) Charity contributions: $7,078 (reported on 22.3% of returns )(% of AGI for various income ranges: 0.5% for AGIs below $25k , 0.9% for AGIs $25k-50k , 1.5% for AGIs $50k-75k , 2.7% for AGIs $75k-100k , 2.5% for AGIs $100k-200k , 2.8% for AGIs over 200k ) Taxes paid: $17,059 (reported on 25.3% of returns )15208:
$17,059State:
$9,982
(% of AGI for various income ranges: 0.9% for AGIs below $25k , 2.0% for AGIs $25k-50k , 3.7% for AGIs $50k-75k , 6.3% for AGIs $75k-100k , 8.6% for AGIs $100k-200k , 7.6% for AGIs over 200k ) Earned income credit: $2,306 (reported on 26.4% of returns )(% of AGI for various income ranges: 9.1% for AGIs below $25k , 1.1% for AGIs $25k-50k ) Percentage of individuals using paid preparers for their 2012 taxes: 43.9%(% for various income ranges: 39.0% for AGIs below $25k , 40.2% for AGIs $25k-50k , 45.2% for AGIs $50k-75k , 47.6% for AGIs $75k-100k , 53.8% for AGIs $100k-200k , 74.2% for AGIs over 200k )
Averages for the 2004 tax year for zip code 15208, filed in 2005:
Average Adjusted Gross Income (AGI) in 2004: $47,829 (Individual Income Tax Returns) Here:
$47,829State:
$48,049
Salary/wage: $40,427 (reported on 85.5% of returns )Here:
$40,427State:
$42,646
(% of AGI for various income ranges: 86.2% for AGIs below $10k , 81.4% for AGIs $10k-25k , 84.2% for AGIs $25k-50k , 76.1% for AGIs $50k-75k , 77.7% for AGIs $75k-100k , 65.1% for AGIs over 100k ) Taxable interest for individuals: $2,239 (reported on 32.5% of returns )This zip code:
$2,239Pennsylvania:
$1,657
(% of AGI for various income ranges: 2.5% for AGIs below $10k , 1.0% for AGIs $10k-25k , 0.8% for AGIs $25k-50k , 2.5% for AGIs $50k-75k , 1.1% for AGIs $75k-100k , 1.7% for AGIs over 100k ) Taxable dividends: $7,757 (reported on 22.9% of returns )(% of AGI for various income ranges: 4.3% for AGIs below $10k , 0.9% for AGIs $10k-25k , 1.2% for AGIs $25k-50k , 2.1% for AGIs $50k-75k , 2.4% for AGIs $75k-100k , 5.4% for AGIs over 100k ) Net capital gain/loss: +$11,546 (reported on 17.3% of returns )Here:
+$11,546State:
+$9,716
(% of AGI for various income ranges: -1.3% for AGIs below $10k , 0.1% for AGIs $10k-25k , 0.3% for AGIs $25k-50k , 1.0% for AGIs $50k-75k , 1.7% for AGIs $75k-100k , 7.2% for AGIs over 100k ) Profit/loss from business: +$15,555 (reported on 12.5% of returns )Here:
+$15,555State:
+$14,267
(% of AGI for various income ranges: 3.9% for AGIs below $10k , 3.0% for AGIs $10k-25k , 1.5% for AGIs $25k-50k , 2.3% for AGIs $50k-75k , 4.4% for AGIs $75k-100k , 5.2% for AGIs over 100k ) IRA payment deduction: $2,683 (reported on 1.7% of returns )15208:
$2,683Pennsylvania:
$2,903
(% of AGI for various income ranges: 0.2% for AGIs $10k-25k , 0.2% for AGIs $25k-50k , 0.3% for AGIs $50k-75k , 0.0% for AGIs over 100k ) Self-employed pension: $13,896 (reported on 1.3% of returns )Here:
$13,896Pennsylvania:
$14,674
Total itemized deductions: $24,065 (18% of AGI, reported on 25.2% of returns )Here:
$24,065State:
$18,804
Here:
18.3% of AGIState:
19.5% of AGI
(% of AGI for various income ranges: 4.3% for AGIs below $10k , 5.4% for AGIs $10k-25k , 9.2% for AGIs $25k-50k , 15.0% for AGIs $50k-75k , 17.6% for AGIs $75k-100k , 14.5% for AGIs over 100k ) Charity contributions deductions: $5,933 (4% of AGI, reported on 23.3% of returns )Here:
4.3% of AGIState:
3.3% of AGI
(% of AGI for various income ranges: 0.5% for AGIs below $10k , 0.8% for AGIs $10k-25k , 1.7% for AGIs $25k-50k , 2.7% for AGIs $50k-75k , 3.1% for AGIs $75k-100k , 3.8% for AGIs over 100k ) Total tax: $11,121 (reported on 63.6% of returns )15208:
$11,121State:
$8,008
(% of AGI for various income ranges: 1.7% for AGIs below $10k , 3.4% for AGIs $10k-25k , 6.9% for AGIs $25k-50k , 10.6% for AGIs $50k-75k , 11.4% for AGIs $75k-100k , 21.0% for AGIs over 100k ) Earned income credit: $1,752 (reported on 29.3% of returns )Percentage of individuals using paid preparers for their 2004 taxes: 56.5%(% for various income ranges: 54.0% for AGIs below $10k , 59.7% for AGIs $10k-25k , 52.4% for AGIs $25k-50k , 52.5% for AGIs $50k-75k , 52.9% for AGIs $75k-100k , 67.0% for AGIs over 100k )
Estimated median household income in 2022: This zip code:
$54,729Pennsylvania:
$71,798
Nearest zip codes: 15206 ,
15217 ,
15218 ,
15232 ,
15221 ,
15224 .
Pittsburgh Zip Code Map
Percentage of family households: This zip code:
33.4%Pennsylvania:
42.6%
Percentage of households with unmarried partners: This zip code:
7.3%Pennsylvania:
46.5%
Likely homosexual households (counted as self-reported same-sex unmarried-partner households)
Lesbian couples: 0.2% of all households Gay men: 0.6% of all households
Household received Food Stamps/SNAP in the past 12 months: 1,078Household did not receive Food Stamps/SNAP in the past 12 months: 3,045
Women who had a birth in the past 12 months: 127 (69 now married , 53 unmarried) Women who did not have a birth in the past 12 months: 1,874 (526 now married , 1,355 unmarried)
Housing units in zip code 15208 with a mortgage: 1,119 (175
second mortgage , 145
both second mortgage and home equity loan )
Houses without a mortgage: 63
Median monthly owner costs for units with a mortgage: $1,233
Median monthly owner costs for units without a mortgage: $634
Residents with income below the poverty level in 2022:
This zip code:
21.8%Whole state:
11.8%
Residents with income below 50% of the poverty level in 2022:
This zip code:
13.0%Whole state:
6.1%
Median number of rooms in houses and condos: Median number of rooms in apartments: Notable locations in this zip code not listed on our city pages
Click to draw/clear zip code borders Notable locations in zip code 15208: (A) , Pittsburgh Bureau of Fire Station 17 (B) , Frick Art and Historical Center (C) , Homewood Branch Carnegie Free Library of Pittsburgh (D) , Homewood Montessori Elementary School Library (E) , Homewood-Brushton YWCA (F) , New Homewood Elementary School Library (G) , Options Center (H) , Sterrett Classical Academy Library (I) , Student Achievement Center (J) , Yvonnes Child Care Center (K) . Display/hide their locations on the map
Churches in zip code 15208 include: (A) , Holy Cross Episcopal Church (B) , Unity Evangelical Lutheran Church (C) , Saint James Baptist Church (D) , Refuge Temple Church (E) , Reformed Presbyterian Church of North America (F) , Praise Center Ministries of Homewood (G) , New Life African Methodist Episcopal Church (H) , New Grace Missionary Baptist Church (I) . Display/hide their locations on the map
Cemetery: (1) . Display/hide its location on the map
Park in zip code 15208: (1) . Display/hide its location on the map
Tourist attraction (not listed on the city page) :
Year house built (houses)
0 2020 or later150 2010 to 2019194 2000 to 200995 1990 to 1999227 1980 to 1989181 1970 to 1979272 1960 to 1969586 1950 to 1959504 1940 to 19493,231 1939 or earlier
Zip code 15208 household income distribution in 2022 322 Less than $10,000314 $10,000 to $14,999190 $15,000 to $19,999169 $20,000 to $24,999144 $25,000 to $29,999363 $30,000 to $34,999116 $35,000 to $39,999122 $40,000 to $44,999224 $45,000 to $49,999261 $50,000 to $59,999269 $60,000 to $74,999437 $75,000 to $99,999225 $100,000 to $124,999168 $125,000 to $149,999243 $150,000 to $199,999535 $200,000 or moreEstimate of home value of owner-occupied houses/condos in 2022 in zip code 15208 14 Less than $10,0006 $10,000 to $14,99914 $20,000 to $24,99981 $25,000 to $29,99945 $30,000 to $34,99914 $35,000 to $39,99965 $40,000 to $49,999153 $50,000 to $59,99959 $60,000 to $69,99930 $70,000 to $79,999219 $80,000 to $89,99931 $90,000 to $99,99956 $100,000 to $124,99918 $125,000 to $149,99991 $150,000 to $174,99941 $175,000 to $199,99976 $200,000 to $249,99995 $250,000 to $299,999193 $300,000 to $399,999187 $400,000 to $499,999424 $500,000 to $749,999163 $750,000 to $999,99948 $1,000,000 to $1,499,99913 $1,500,000 to $1,999,99910 $2,000,000 or moreRent paid by renters in 2022 in zip code 15208 103 Less than $10052 $100 to $14974 $150 to $199124 $200 to $24927 $250 to $29912 $300 to $34992 $350 to $399119 $400 to $44946 $450 to $49950 $500 to $54975 $550 to $59929 $600 to $64971 $650 to $69997 $700 to $74923 $750 to $79995 $800 to $89988 $900 to $999220 $1,000 to $1,249261 $1,250 to $1,499231 $1,500 to $1,99934 $2,000 to $2,49913 $2,500 to $2,99975 No cash rent
Median gross rent in 2022: $983.
Median price asked for vacant for-sale houses and condos in 2022: $189,438.
Estimated median house (or condo) value in 2022 for: White Non-Hispanic householders: $674,981Black or African American householders: $160,200American Indian or Alaska Native householders: $123,547Asian householders: $455,890Some other race householders: $80,717Two or more races householders: $226,503Estimated median house or condo value in 2022: $224,445
15208:
$224,445Pennsylvania:
$245,500
Lower value quartile - upper value quartile: $83,836 - $550,233
Mean price in 2022: Detached houses: $335,533Here:
$335,533State:
$317,202
Townhouses or other attached units: $264,544Here:
$264,544State:
$254,369
In 2-unit structures: $343,441Here:
$343,441State:
$249,182
In 3-to-4-unit structures: $85,194Here:
$85,194State:
$297,446
In 5-or-more-unit structures: $67,446Here:
$67,446State:
$320,068
Housing units in structures:
One, detached: 2,610One, attached: 1,147Two: 4713 or 4: 5375 to 9: 24410 to 19: 15420 to 49: 16450 or more: 212Unemployment : 4.6%
Means of transportation to work in zip code 15208 53.8% 2,069 Drove a car alone2.7% 104 Carpooled9.2% 354 Bus or trolley bus0.2% 6 Taxi0.3% 13 Motorcycle0.6% 22 Bicycle4.3% 164 Walked4.9% 190 Other means25.5% 980 Worked at homeTravel time to work (commute) in zip code 15208 162 Less than 5 minutes367 5 to 9 minutes322 10 to 14 minutes496 15 to 19 minutes433 20 to 24 minutes251 25 to 29 minutes556 30 to 34 minutes49 35 to 39 minutes74 40 to 44 minutes190 45 to 59 minutes36 60 to 89 minutes25 90 or more minutes
Neighborhoods in zip code 15208: Percentage of zip code residents living and working in this county: 96.1%
Household type by relationship:
Households: 9,025
Male householders: 1,676 (649 living alone ), Female householders: 2,426 (1,102 living alone )1,234 spouses (1,220 opposite-sex spouses ), 277 unmarried partners , (207 opposite-sex unmarried partners ), 2,596 children (2,384 natural , 48 adopted , 164 stepchildren ), 208 grandchildren , 148 brothers or sisters , 64 parents , 36 foster children , 93 other relatives , 195 non-relatives In group quarters: 66 (-1 institutionalized population )
Size of family households: 1,086 2-persons , 405 3-persons , 334 4-persons , 172 5-persons , 40 6-persons , 22 7-or-more-persons
Size of nonfamily households: 1,750 1-person , 260 2-persons , 35 3-persons , 4 4-persons
943 married couples with children. single-parent households (199 men , 759 women ).
92.9% of residents of 15208 zip code speak English at home. of residents speak Spanish at home (50% very well, 19% well, 5% not well, 25% not at all ).of residents speak other Indo-European language at home (83% very well, 11% well, 6% not well ).of residents speak Asian or Pacific Island language at home (71% very well, 29% well ).of residents speak other language at home (71% very well, 29% not well ).
Foreign born population: 528 (5.9%)
(46.6%
of them are naturalized citizens )
This zip code:
5.9%Whole state:
7.5%
15% Dominica 12% Bhutan 7% Japan 5% Belgium 5% Sweden 5% St. Vincent and the Grenadines 4% Austria 3% German 3% American 2% English 2% Ethiopian 2% Polish 2% Irish 1% Italian
Year of entry for the foreign-born population
398 2010 or later 90 2000 to 2009 55 1990 to 1999 155 Before 1990
There are
76 Medical Specialists in Zip Code 15208 .
Facilities with environmental interests located in this zip code:
BECK ARNLEY (6905 SUSQUEHANNA ST in PITTSBURGH, PA)
AIR MINOR (AIRS/AFS) Small Quantity Generators, between 100 kg and 1000 kg of hazardous waste/month (Resource Conservation and Recovery Act (tracking hazardous waste)) - notification TRI REPORTER (Tracking of toxic chemicals releasing facilities) Business SIC classification: MOTOR VEHICLE PARTS AND ACCESSORIESOrganizations: OPERNAME (CONTACT/OPERATOR)
, LINNETT CO (CONTACT/OWNER)
Alternative names: BECK/ARNLEY WORLD PARTS CORP., LINNETT CO
BELMAR EL SCH (7109 HERMITAGE ST in PITTSBURGH, PA)
(National Center for Education Statistics) - STATE ID-0320 Organizations: PITTSBURGH SD (SCHOOL DISTRICT)
BERRYS PROFESSIONAL AUTO SERVICE (568 HOMEWOOD AVE in PITTSBURGH, PA)
AIR MINOR (AIRS/AFS) Business SIC classification: GASOLINE SERVICE STATIONS
AIR TOOL MAINTENANCE CO INC (7800 TIOGA ST in PITTSBURGH, PA)
Small Quantity Generators, between 100 kg and 1000 kg of hazardous waste/month (Resource Conservation and Recovery Act (tracking hazardous waste)) - notification Organizations: JAMES P MULVIHILL JR (CONTACT/OWNER)
Housing units lacking complete plumbing facilities: 12.7%
Housing units lacking complete kitchen facilities: 10.4%
80.0% Utility gas 16.5% Electricity 1.9% Bottled, tank, or LP gas 0.8% No fuel used
Population in 1990: 16,136.
Place of birth for U.S.-born residents:
This state: 5,863Northeast: 550Midwest: 528South: 1,220West: 213
65% of the 15208 zip code residents lived in the same house 5 years ago.
Out of people who lived in different houses, 85% lived in this county.
Out of people who lived in different counties, 50% lived in Pennsylvania.
92% of the 15208 zip code residents lived in the same house 1 year ago.
Out of people who lived in different houses, 75% moved from this county.
Out of people who lived in different houses, 10% moved from different county within same state.
Out of people who lived in different houses, 11% moved from different state.
Out of people who lived in different houses, 4% moved from abroad.
Private vs. public school enrollment:
Students in private schools in grades 1 to 8 (elementary and middle school): 253
Here:
22.9%Pennsylvania:
15.7%
Students in private schools in grades 9 to 12 (high school): 26
Here:
6.0%Pennsylvania:
13.4%
Students in private undergraduate colleges: 120
Here:
42.5%Pennsylvania:
39.8%
Occupation by median earnings in the past 12 months ($)
108,881 Management occupations 105,865 Health diagnosing and treating practitioners and other technical occupations 103,232 Production occupations 89,285 Community and social service occupations 82,343 Sales and related occupations 81,228 Legal occupations
Companies with federal contracts located in this zip code:
CHEMIMAGE CORP (7301 PENN AVENUE in PITTSBURGH, PA; small business) in 20 contracts from 2000 to 2005
Contracts for Other Medical -- Basic Research (R&D), Other Research and Development -- Basic Research (R&D), Other Professional Services, Services -- Basic Research (R&D), and more by Army, Federal Bureau of Investigation, Internal Revenue Service, U.S. Secret Service, and others Signed by year: 2000: $65,000; 2001: $0; 2002: $0; 2003: $4,367,529; 2004: $3,651,460; 2005: $3,904,932; 2006: $0.
Biggest contracts: with Army for Other Medical -- Basic Research (R&D). Signed on 2003-07-17. Completion date: 2004-09-30.
with Army for Other Research and Development -- Basic Research (R&D). Signed on 2005-05-27. Completion date: 2006-05-31.
with Army for Other Professional Services. Signed on 2004-11-02. Completion date: 2005-10-31.
with Army for Services -- Basic Research (R&D). Signed on 2004-02-19. Completion date: 2005-03-18.
Top industries in this zip code by the number of employees in 2005:
Health Care and Social Assistance: All Other Outpatient Care Centers (100-249 employees: 1 establishment, 5-9 employees: 1 establishment, 1-4 employees: 1 establishment)Arts, Entertainment, and Recreation: Museums (100-249: 1)Other Services (except Public Administration): Religious Organizations (20-49: 2, 10-19: 1, 5-9: 3, 1-4: 6)Educational Services: Elementary and Secondary Schools (50-99: 1, 20-49: 1, 5-9: 1)Health Care and Social Assistance: Child Day Care Services (20-49: 1, 10-19: 3, 5-9: 2, 1-4: 3)Health Care and Social Assistance: Other Individual and Family Services (20-49: 2, 1-4: 1)Health Care and Social Assistance: Child and Youth Services (20-49: 1, 10-19: 1)Construction: Plumbing, Heating, and Air-Conditioning Contractors (20-49: 1, 1-4: 2)
People in group quarters in 2010:
31 people in emergency and transitional shelters (with sleeping facilities) for people experiencing homelessness
9 people in nursing facilities/skilled-nursing facilities
9 people in group homes intended for adults
3 people in other noninstitutional facilities
People in group quarters in 2000:
16 people in other group homes
15 people in nursing homes
14 people in college dormitories (includes college quarters off campus)
10 people in other noninstitutional group quarters
2 people in homes for the mentally retarded
2 people in religious group quarters
Fatal accident statistics in 2012:
Fatal accident count: 2Vehicles involved in fatal accidents: 2Fatal accidents caused by drunken drivers: 0Fatalities: 2Persons involved in fatal accidents: 2Pedestrians involved in fatal accidents: 2
Fatal accident statistics in 2010:
Fatal accident count: 2Vehicles involved in fatal accidents: 5Fatal accidents caused by drunken drivers: 1Fatalities: 2Persons involved in fatal accidents: 5Pedestrians involved in fatal accidents: 3
Home Mortgage Disclosure Act Aggregated Statistics For Year 2009(Based on 6 full and 8 partial tracts) A) FHA, FSA/RHS & VA B) Conventional C) Refinancings D) Home Improvement Loans E) Loans on Dwellings For 5+ Families F) Non-occupant Loans on Number Average Value Number Average Value Number Average Value Number Average Value Number Average Value Number Average Value
LOANS ORIGINATED 31 $167,930 109 $187,055 212 $187,692 35 $50,361 2 $187,395 19 $141,413 APPLICATIONS APPROVED, NOT ACCEPTED 2 $78,665 16 $183,214 23 $179,210 11 $13,105 0 $0 5 $99,856 APPLICATIONS DENIED 7 $164,103 10 $121,907 81 $135,276 53 $32,278 1 $184,000 14 $22,759 APPLICATIONS WITHDRAWN 3 $170,740 12 $175,984 49 $164,848 6 $119,687 0 $0 5 $149,602 FILES CLOSED FOR INCOMPLETENESS 1 $93,000 2 $309,040 8 $115,976 0 $0 0 $0 2 $132,445
Aggregated Statistics For Year 2008(Based on 6 full and 8 partial tracts) A) FHA, FSA/RHS & VA B) Conventional C) Refinancings D) Home Improvement Loans E) Loans on Dwellings For 5+ Families F) Non-occupant Loans on Number Average Value Number Average Value Number Average Value Number Average Value Number Average Value Number Average Value
LOANS ORIGINATED 3 $198,297 104 $183,733 84 $155,219 30 $33,392 5 $409,228 17 $113,583 APPLICATIONS APPROVED, NOT ACCEPTED 4 $83,610 6 $161,352 22 $117,705 7 $17,111 0 $0 7 $113,867 APPLICATIONS DENIED 3 $107,150 16 $100,107 109 $110,864 102 $27,298 2 $67,660 41 $64,788 APPLICATIONS WITHDRAWN 3 $136,277 16 $119,294 20 $138,859 5 $60,386 0 $0 5 $51,170 FILES CLOSED FOR INCOMPLETENESS 2 $111,160 6 $110,738 17 $110,585 2 $7,890 0 $0 2 $115,945
Aggregated Statistics For Year 2007(Based on 6 full and 8 partial tracts) A) FHA, FSA/RHS & VA B) Conventional C) Refinancings D) Home Improvement Loans E) Loans on Dwellings For 5+ Families F) Non-occupant Loans on Number Average Value Number Average Value Number Average Value Number Average Value Number Average Value Number Average Value
LOANS ORIGINATED 6 $141,363 164 $158,201 95 $125,019 82 $44,921 6 $289,335 29 $77,192 APPLICATIONS APPROVED, NOT ACCEPTED 3 $79,640 24 $102,523 31 $109,433 13 $38,421 2 $483,300 14 $77,731 APPLICATIONS DENIED 6 $96,338 38 $56,623 233 $84,308 148 $25,117 2 $79,385 51 $66,420 APPLICATIONS WITHDRAWN 3 $104,393 17 $141,464 62 $88,585 17 $42,821 0 $0 8 $84,871 FILES CLOSED FOR INCOMPLETENESS 0 $0 5 $212,186 15 $112,111 3 $15,293 0 $0 5 $95,628
Aggregated Statistics For Year 2006(Based on 6 full and 8 partial tracts) A) FHA, FSA/RHS & VA B) Conventional C) Refinancings D) Home Improvement Loans E) Loans on Dwellings For 5+ Families F) Non-occupant Loans on G) Loans On Manufactured Number Average Value Number Average Value Number Average Value Number Average Value Number Average Value Number Average Value Number Average Value
LOANS ORIGINATED 17 $116,926 170 $132,384 153 $103,227 111 $40,916 4 $396,305 54 $84,369 0 $0 APPLICATIONS APPROVED, NOT ACCEPTED 0 $0 28 $103,736 58 $69,961 26 $24,475 0 $0 10 $48,068 0 $0 APPLICATIONS DENIED 2 $47,345 45 $95,545 265 $65,339 179 $20,125 1 $228,850 61 $51,218 4 $33,522 APPLICATIONS WITHDRAWN 0 $0 20 $113,722 102 $109,512 6 $25,705 0 $0 5 $148,708 0 $0 FILES CLOSED FOR INCOMPLETENESS 0 $0 3 $21,067 21 $93,917 3 $30,177 0 $0 5 $80,722 0 $0
Aggregated Statistics For Year 2005(Based on 6 full and 8 partial tracts) A) FHA, FSA/RHS & VA B) Conventional C) Refinancings D) Home Improvement Loans E) Loans on Dwellings For 5+ Families F) Non-occupant Loans on G) Loans On Manufactured Number Average Value Number Average Value Number Average Value Number Average Value Number Average Value Number Average Value Number Average Value
LOANS ORIGINATED 7 $155,263 131 $142,986 170 $102,894 68 $46,274 2 $640,375 69 $68,915 0 $0 APPLICATIONS APPROVED, NOT ACCEPTED 3 $60,727 17 $129,328 66 $70,467 12 $29,157 0 $0 13 $65,005 0 $0 APPLICATIONS DENIED 2 $41,460 37 $80,792 359 $72,719 204 $20,780 0 $0 105 $27,569 3 $1,677 APPLICATIONS WITHDRAWN 2 $25,130 16 $88,025 123 $84,287 19 $79,929 1 $160,000 17 $76,219 0 $0 FILES CLOSED FOR INCOMPLETENESS 0 $0 6 $124,013 31 $168,843 7 $40,241 0 $0 3 $50,787 0 $0
Aggregated Statistics For Year 2004(Based on 6 full and 8 partial tracts) A) FHA, FSA/RHS & VA B) Conventional C) Refinancings D) Home Improvement Loans E) Loans on Dwellings For 5+ Families F) Non-occupant Loans on G) Loans On Manufactured Number Average Value Number Average Value Number Average Value Number Average Value Number Average Value Number Average Value Number Average Value
LOANS ORIGINATED 16 $76,582 166 $135,623 284 $106,710 89 $49,598 11 $301,898 67 $80,104 0 $0 APPLICATIONS APPROVED, NOT ACCEPTED 0 $0 17 $116,342 74 $99,832 32 $34,916 0 $0 15 $76,396 0 $0 APPLICATIONS DENIED 0 $0 27 $93,563 385 $78,561 166 $16,312 0 $0 95 $46,488 1 $1,260 APPLICATIONS WITHDRAWN 0 $0 20 $142,937 126 $86,637 17 $56,203 0 $0 10 $125,478 0 $0 FILES CLOSED FOR INCOMPLETENESS 0 $0 4 $243,748 44 $124,453 6 $24,065 0 $0 6 $97,878 0 $0
Aggregated Statistics For Year 2003(Based on 6 full and 8 partial tracts) A) FHA, FSA/RHS & VA B) Conventional C) Refinancings D) Home Improvement Loans E) Loans on Dwellings For 5+ Families F) Non-occupant Loans on Number Average Value Number Average Value Number Average Value Number Average Value Number Average Value Number Average Value
LOANS ORIGINATED 18 $68,091 156 $144,990 581 $123,678 65 $37,648 6 $173,022 78 $80,142 APPLICATIONS APPROVED, NOT ACCEPTED 2 $123,400 21 $66,167 153 $91,558 21 $29,707 0 $0 14 $72,729 APPLICATIONS DENIED 3 $72,240 35 $105,172 375 $87,190 132 $17,343 1 $15,090 60 $39,198 APPLICATIONS WITHDRAWN 0 $0 28 $144,488 105 $80,393 21 $42,967 0 $0 9 $94,777 FILES CLOSED FOR INCOMPLETENESS 0 $0 2 $140,060 29 $80,846 0 $0 0 $0 0 $0
Aggregated Statistics For Year 2002(Based on 6 full and 8 partial tracts) A) FHA, FSA/RHS & VA B) Conventional C) Refinancings D) Home Improvement Loans E) Loans on Dwellings For 5+ Families F) Non-occupant Loans on Number Average Value Number Average Value Number Average Value Number Average Value Number Average Value Number Average Value
LOANS ORIGINATED 14 $54,687 165 $126,914 404 $111,554 56 $34,901 4 $207,820 57 $63,642 APPLICATIONS APPROVED, NOT ACCEPTED 0 $0 17 $101,811 128 $82,676 22 $20,624 0 $0 15 $47,689 APPLICATIONS DENIED 2 $52,065 30 $55,369 343 $63,227 91 $25,413 0 $0 34 $39,189 APPLICATIONS WITHDRAWN 3 $57,033 14 $91,051 128 $76,219 15 $11,923 0 $0 5 $66,950 FILES CLOSED FOR INCOMPLETENESS 2 $25,245 13 $56,567 66 $77,577 6 $54,825 0 $0 7 $52,354
Aggregated Statistics For Year 2001(Based on 6 full and 8 partial tracts) A) FHA, FSA/RHS & VA B) Conventional C) Refinancings D) Home Improvement Loans E) Loans on Dwellings For 5+ Families F) Non-occupant Loans on Number Average Value Number Average Value Number Average Value Number Average Value Number Average Value Number Average Value
LOANS ORIGINATED 24 $58,009 117 $141,468 370 $88,878 88 $27,370 3 $427,033 40 $60,058 APPLICATIONS APPROVED, NOT ACCEPTED 1 $46,000 21 $78,315 133 $58,770 41 $23,177 0 $0 20 $41,536 APPLICATIONS DENIED 0 $0 26 $52,963 398 $49,052 188 $16,126 0 $0 40 $42,886 APPLICATIONS WITHDRAWN 4 $31,365 31 $59,861 166 $67,984 29 $12,945 2 $81,075 7 $32,869 FILES CLOSED FOR INCOMPLETENESS 0 $0 3 $113,273 48 $64,087 2 $19,805 0 $0 3 $115,547
Aggregated Statistics For Year 2000(Based on 6 full and 8 partial tracts) A) FHA, FSA/RHS & VA B) Conventional C) Refinancings D) Home Improvement Loans E) Loans on Dwellings For 5+ Families F) Non-occupant Loans on Number Average Value Number Average Value Number Average Value Number Average Value Number Average Value Number Average Value
LOANS ORIGINATED 13 $69,078 143 $108,539 189 $52,544 100 $15,196 8 $183,872 28 $55,663 APPLICATIONS APPROVED, NOT ACCEPTED 1 $38,000 18 $55,628 70 $53,148 54 $16,559 0 $0 6 $50,982 APPLICATIONS DENIED 6 $82,337 53 $42,868 334 $45,936 152 $19,095 0 $0 41 $36,825 APPLICATIONS WITHDRAWN 2 $84,095 24 $108,862 156 $45,152 17 $29,624 0 $0 15 $39,345 FILES CLOSED FOR INCOMPLETENESS 1 $46,520 7 $89,650 49 $34,484 5 $28,966 0 $0 3 $34,517
Aggregated Statistics For Year 1999(Based on 4 full and 5 partial tracts) A) FHA, FSA/RHS & VA B) Conventional C) Refinancings D) Home Improvement Loans E) Loans on Dwellings For 5+ Families F) Non-occupant Loans on Number Average Value Number Average Value Number Average Value Number Average Value Number Average Value Number Average Value
LOANS ORIGINATED 21 $60,132 99 $96,394 171 $66,594 71 $17,398 0 $0 25 $45,764 APPLICATIONS APPROVED, NOT ACCEPTED 5 $49,734 15 $65,977 84 $41,991 30 $17,840 0 $0 3 $25,160 APPLICATIONS DENIED 3 $34,807 16 $49,447 220 $40,904 113 $13,061 0 $0 29 $30,994 APPLICATIONS WITHDRAWN 4 $47,075 9 $57,876 107 $47,466 26 $33,991 1 $79,320 6 $30,688 FILES CLOSED FOR INCOMPLETENESS 2 $45,000 4 $58,815 28 $39,918 0 $0 0 $0 2 $42,455
Private Mortgage Insurance Companies Aggregated Statistics For Year 2009(Based on 5 full and 4 partial tracts) A) Conventional B) Refinancings Number Average Value Number Average Value
LOANS ORIGINATED 19 $198,704 7 $308,310 APPLICATIONS APPROVED, NOT ACCEPTED 4 $235,782 2 $110,190 APPLICATIONS DENIED 0 $0 0 $0 APPLICATIONS WITHDRAWN 2 $35,725 1 $104,060 FILES CLOSED FOR INCOMPLETENESS 0 $0 0 $0
Aggregated Statistics For Year 2008(Based on 2 full and 6 partial tracts) A) Conventional B) Refinancings C) Non-occupant Loans on Number Average Value Number Average Value Number Average Value
LOANS ORIGINATED 34 $168,546 9 $155,729 5 $107,192 APPLICATIONS APPROVED, NOT ACCEPTED 7 $160,676 5 $195,276 1 $62,870 APPLICATIONS DENIED 0 $0 0 $0 0 $0 APPLICATIONS WITHDRAWN 0 $0 0 $0 0 $0 FILES CLOSED FOR INCOMPLETENESS 2 $87,495 0 $0 0 $0
Aggregated Statistics For Year 2007(Based on 5 full and 6 partial tracts) A) Conventional B) Refinancings C) Non-occupant Loans on Number Average Value Number Average Value Number Average Value
LOANS ORIGINATED 25 $118,688 2 $71,205 2 $83,290 APPLICATIONS APPROVED, NOT ACCEPTED 3 $255,260 0 $0 0 $0 APPLICATIONS DENIED 0 $0 0 $0 0 $0 APPLICATIONS WITHDRAWN 2 $113,985 0 $0 2 $113,985 FILES CLOSED FOR INCOMPLETENESS 0 $0 0 $0 0 $0
Aggregated Statistics For Year 2006(Based on 4 full and 6 partial tracts) A) Conventional B) Refinancings C) Non-occupant Loans on Number Average Value Number Average Value Number Average Value
LOANS ORIGINATED 19 $138,716 8 $91,521 6 $90,920 APPLICATIONS APPROVED, NOT ACCEPTED 3 $102,687 2 $108,365 0 $0 APPLICATIONS DENIED 0 $0 0 $0 0 $0 APPLICATIONS WITHDRAWN 2 $175,720 1 $38,980 0 $0 FILES CLOSED FOR INCOMPLETENESS 0 $0 0 $0 0 $0
Aggregated Statistics For Year 2005(Based on 3 full and 8 partial tracts) A) Conventional B) Refinancings C) Non-occupant Loans on Number Average Value Number Average Value Number Average Value
LOANS ORIGINATED 23 $137,689 2 $45,635 6 $67,093 APPLICATIONS APPROVED, NOT ACCEPTED 4 $196,178 5 $86,316 0 $0 APPLICATIONS DENIED 0 $0 0 $0 0 $0 APPLICATIONS WITHDRAWN 1 $48,220 2 $272,920 0 $0 FILES CLOSED FOR INCOMPLETENESS 0 $0 0 $0 0 $0
Aggregated Statistics For Year 2004(Based on 6 full and 8 partial tracts) A) Conventional B) Refinancings C) Non-occupant Loans on Number Average Value Number Average Value Number Average Value
LOANS ORIGINATED 33 $130,190 11 $73,441 3 $59,363 APPLICATIONS APPROVED, NOT ACCEPTED 12 $93,868 4 $105,580 5 $95,888 APPLICATIONS DENIED 0 $0 0 $0 0 $0 APPLICATIONS WITHDRAWN 2 $145,020 1 $50,000 2 $68,630 FILES CLOSED FOR INCOMPLETENESS 0 $0 0 $0 0 $0
Aggregated Statistics For Year 2003(Based on 6 full and 8 partial tracts) A) Conventional B) Refinancings C) Non-occupant Loans on Number Average Value Number Average Value Number Average Value
LOANS ORIGINATED 37 $112,499 27 $111,088 15 $79,630 APPLICATIONS APPROVED, NOT ACCEPTED 4 $157,652 8 $102,801 1 $77,960 APPLICATIONS DENIED 4 $101,208 2 $274,525 2 $38,665 APPLICATIONS WITHDRAWN 6 $152,247 3 $87,480 3 $118,800 FILES CLOSED FOR INCOMPLETENESS 0 $0 0 $0 0 $0
Aggregated Statistics For Year 2002(Based on 6 full and 8 partial tracts) A) Conventional B) Refinancings C) Non-occupant Loans on Number Average Value Number Average Value Number Average Value
LOANS ORIGINATED 62 $96,173 24 $80,352 11 $74,861 APPLICATIONS APPROVED, NOT ACCEPTED 7 $81,630 9 $64,508 1 $30,960 APPLICATIONS DENIED 4 $54,125 2 $93,760 2 $22,475 APPLICATIONS WITHDRAWN 2 $94,720 2 $66,625 0 $0 FILES CLOSED FOR INCOMPLETENESS 0 $0 0 $0 0 $0
Aggregated Statistics For Year 2001(Based on 4 full and 6 partial tracts) A) Conventional B) Refinancings C) Non-occupant Loans on Number Average Value Number Average Value Number Average Value
LOANS ORIGINATED 42 $139,513 18 $126,778 5 $93,544 APPLICATIONS APPROVED, NOT ACCEPTED 2 $95,605 2 $128,020 0 $0 APPLICATIONS DENIED 0 $0 2 $83,480 0 $0 APPLICATIONS WITHDRAWN 0 $0 0 $0 0 $0 FILES CLOSED FOR INCOMPLETENESS 0 $0 0 $0 0 $0
Aggregated Statistics For Year 2000(Based on 6 full and 6 partial tracts) A) Conventional B) Refinancings C) Non-occupant Loans on Number Average Value Number Average Value Number Average Value
LOANS ORIGINATED 34 $94,165 8 $54,955 2 $56,190 APPLICATIONS APPROVED, NOT ACCEPTED 2 $47,360 4 $61,728 2 $46,395 APPLICATIONS DENIED 0 $0 2 $37,695 0 $0 APPLICATIONS WITHDRAWN 0 $0 0 $0 0 $0 FILES CLOSED FOR INCOMPLETENESS 0 $0 0 $0 0 $0
Aggregated Statistics For Year 1999(Based on 3 full and 5 partial tracts) A) Conventional B) Refinancings C) Non-occupant Loans on Number Average Value Number Average Value Number Average Value
LOANS ORIGINATED 20 $130,410 15 $82,791 2 $41,060 APPLICATIONS APPROVED, NOT ACCEPTED 4 $71,860 3 $62,607 0 $0 APPLICATIONS DENIED 1 $32,000 0 $0 1 $32,000 APPLICATIONS WITHDRAWN 1 $21,630 0 $0 1 $21,630 FILES CLOSED FOR INCOMPLETENESS 1 $55,110 0 $0 0 $0
2004 - 2018 National Fire Incident Reporting System (NFIRS) incidents See full 2006 National Fire Incident Reporting System statistics for zip code 15208, Pennsylvania
Most common first names in zip code 15208 among deceased individuals Name Count Lived (average)
John 227 74.1 years Mary 212 77.9 years William 212 72.6 years James 190 72.0 years Robert 130 67.9 years Charles 121 74.2 years George 106 75.4 years Joseph 97 72.5 years Edward 71 71.5 years Elizabeth 70 78.0 years
Most common last names in zip code 15208 among deceased individuals Last name Count Lived (average)
Williams 117 72.6 years Johnson 109 71.6 years Jones 96 75.0 years Smith 95 74.1 years Brown 94 73.6 years Jackson 83 71.1 years Davis 65 71.7 years Harris 53 73.7 years White 48 78.8 years Washington 47 72.8 years
Businesses in zip code 15208

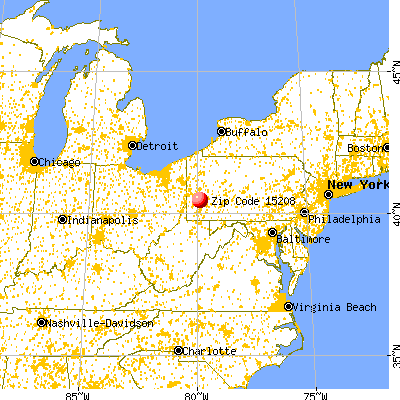


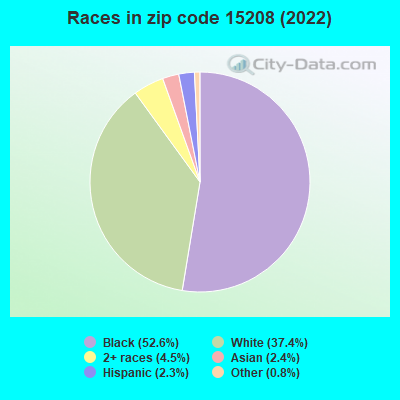


 Nearest zip codes: 15206, 15217, 15218, 15232, 15221, 15224.
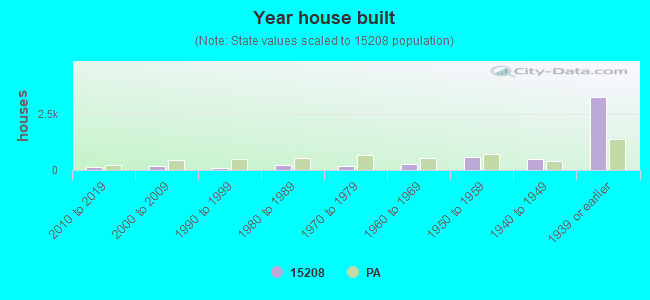

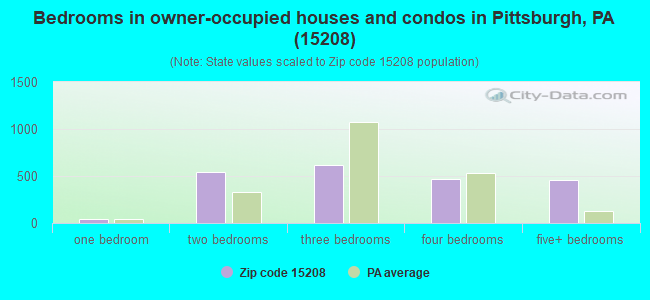
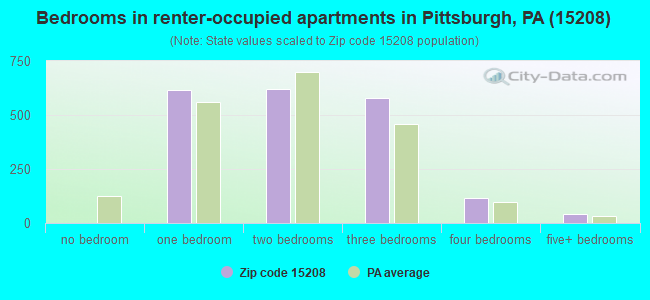
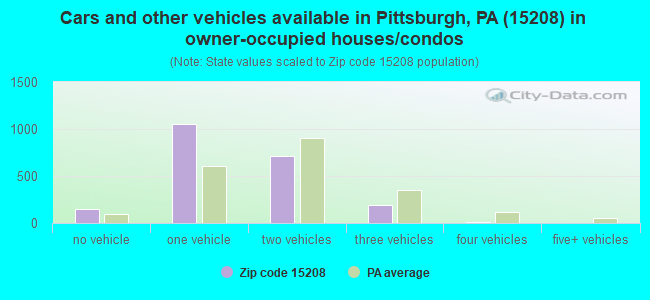
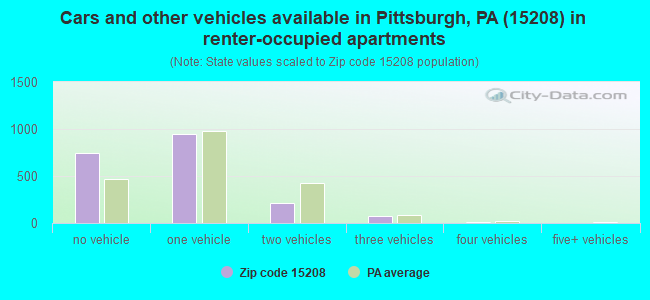


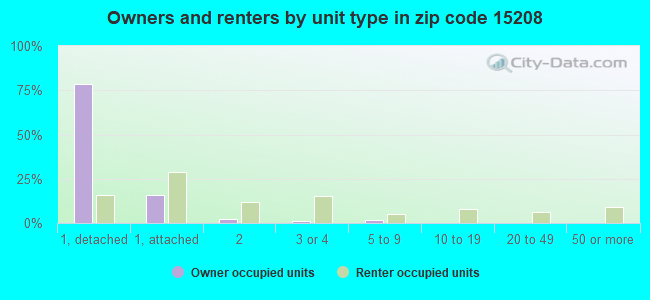
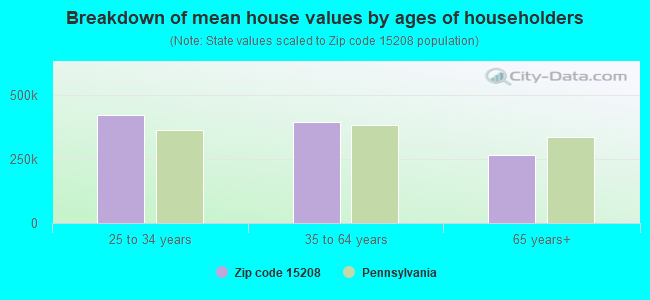


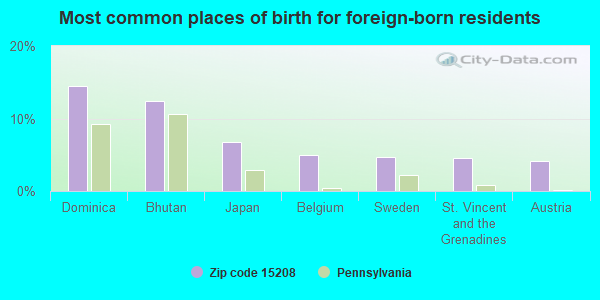
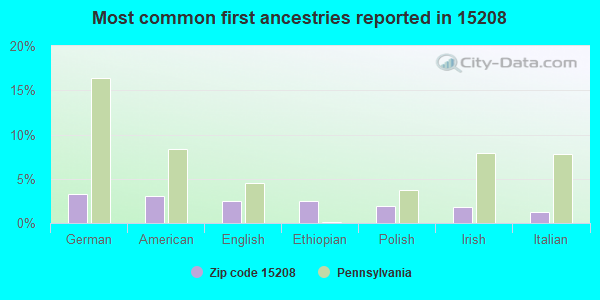
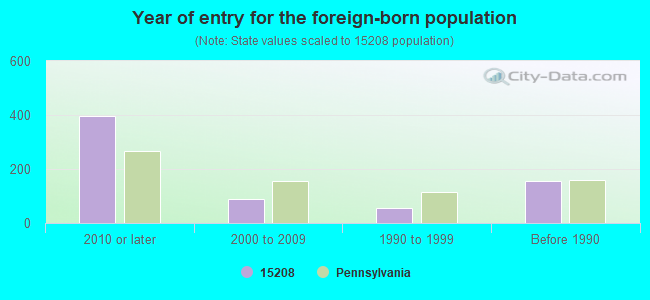


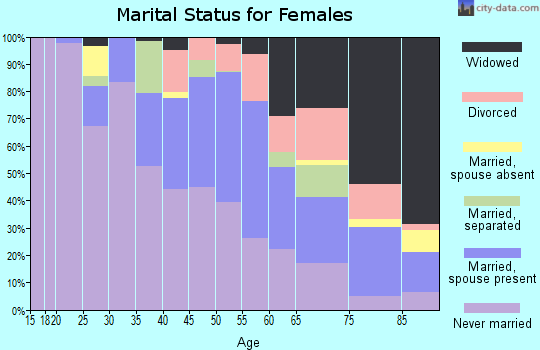
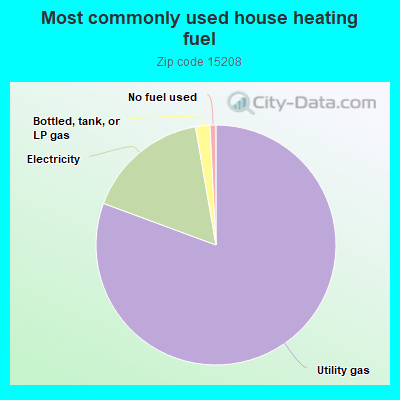
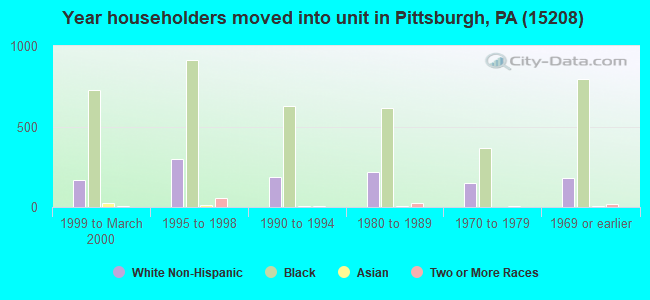
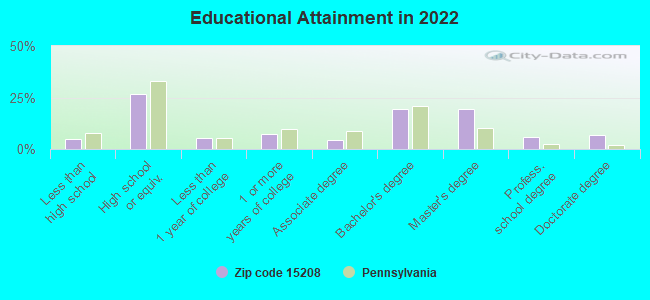
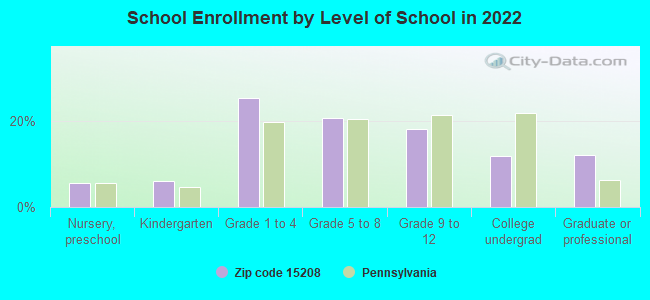
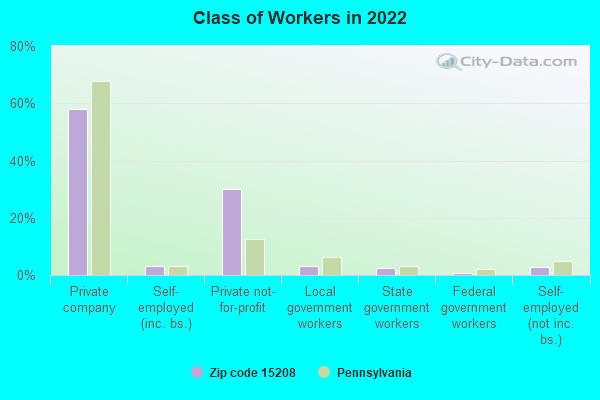
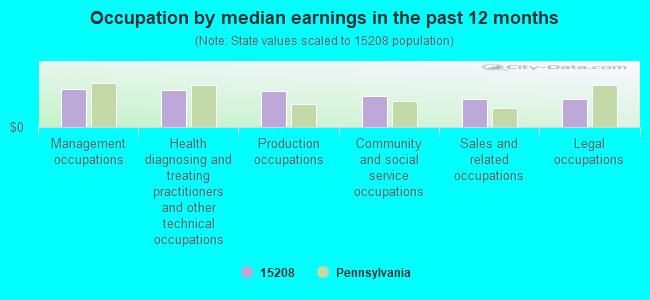
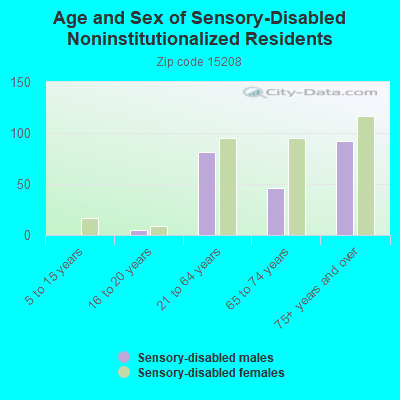
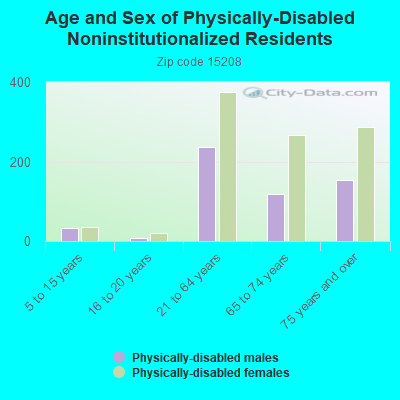
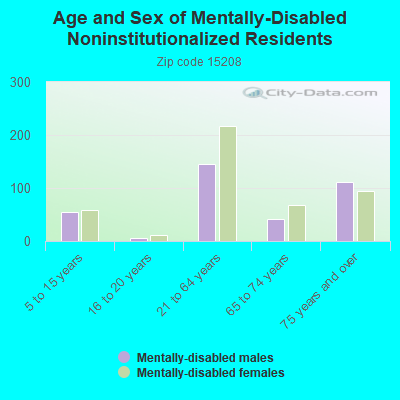
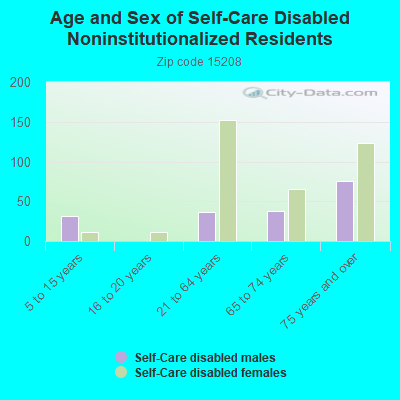
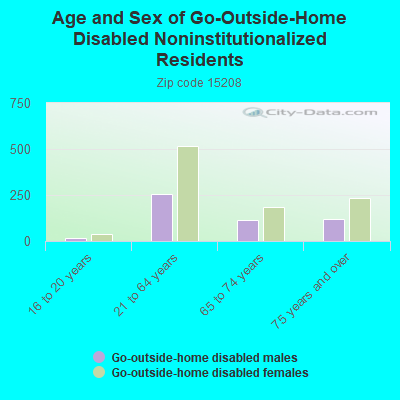
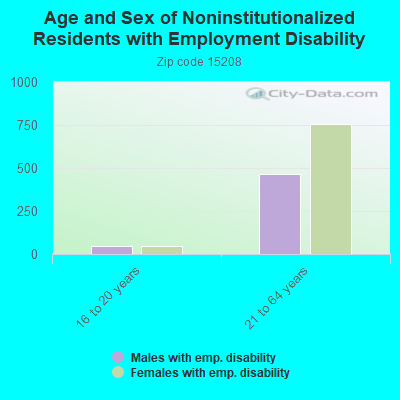
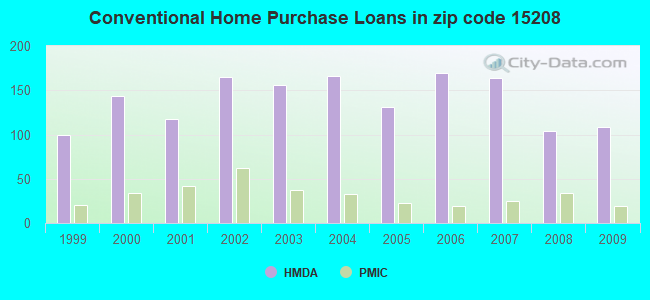
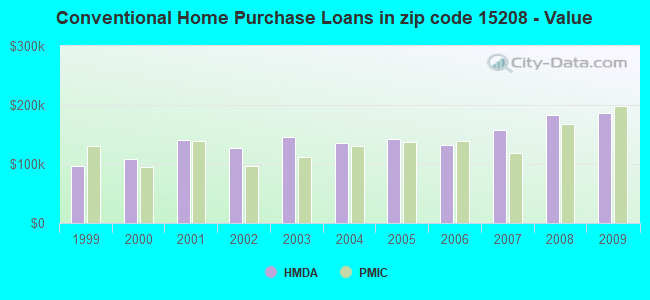
 Based on the data from the years 2004 - 2018 the average number of fire incidents per year is 28. The highest number of reported fire incidents - 72 took place in 2010, and the least - 0 in 2012. The data has a rising trend.
 When looking into fire subcategories, the most incidents belonged to: Structure Fires (49.9%), and Outside Fires (28.8%).