Estimated zip code population in 2022: 5,849 Zip code population in 2010: 5,302 Zip code population in 2000: 4,398
Houses and condos: 2,410 Renter-occupied apartments: 541
% of renters here:
24%
State:
33%
March 2022 cost of living index in zip code 28391: 79.8 (low, U.S. average is 100)
Land area: 35.4 sq. mi. Water area: 0.0 sq. mi.
Population density: 165 people per square mile
(very low).
OSM Map
General Map
Google Map
MSN Map
OSM Map
General Map
Google Map
MSN Map
OSM Map
General Map
Google Map
MSN Map
OSM Map
General Map
Google Map
MSN Map
Please wait while loading the map...
Real estate property taxes paid for housing units in 2022:
This zip code:
0.8% ($1,578)
North Carolina:
0.6% ($1,769)
Median real estate property taxes paid for housing units with mortgages in 2022: $1,522 (0.7%) Median real estate property taxes paid for housing units with no mortgage in 2022: $1,662 (0.9%)
Estimated median house/condo value in 2022: $195,190
28391:
$195,190
North Carolina:
$280,600
According to our research of North Carolina and other state lists, there were 13 registered sex offenders living in 28391 zip code as of May 24, 2024. The ratio of all residents to sex offenders in zip code 28391 is 422 to 1. The ratio of registered sex offenders to all residents in this zip code is near the state average.
Median resident age:
This zip code:
37.5 years
North Carolina median age:
39.2 years
Average household size:
This zip code:
2.6 people
North Carolina:
2.4 people
Averages for the 2020 tax year for zip code 28391, filed in 2021:
Average Adjusted Gross Income (AGI) in 2020: $55,791 (Individual Income Tax Returns)
Here:
$55,791
State:
$70,020
Salary/wage: $49,602 (reported on 82.9% of returns)
Here:
$49,602
State:
$58,387
(% of AGI for various income ranges: 1195.9% for AGIs below $25k, 3589.0% for AGIs $25k-50k, 6689.3% for AGIs $50k-75k, 8910.6% for AGIs $75k-100k, 18749.5% for AGIs $100k-200k)
Taxable interest for individuals: $598 (reported on 24.9% of returns)
This zip code:
$598
North Carolina:
$1,479
(% of AGI for various income ranges: 9.5% for AGIs below $25k, 9.0% for AGIs $25k-50k, 17.3% for AGIs $50k-75k, 25.0% for AGIs $75k-100k, 76.8% for AGIs $100k-200k)
Ordinary dividends: $1,544 (reported on 9.7% of returns)
Here:
$1,544
State:
$7,888
(% of AGI for various income ranges: 8.3% for AGIs below $25k, 16.7% for AGIs $25k-50k, 12.7% for AGIs $50k-75k, 20.0% for AGIs $75k-100k, 90.5% for AGIs $100k-200k)
Net capital gain/loss in AGI: +$8,117 (reported on 8.9% of returns)
Here:
+$8,117
State:
+$23,652
(% of AGI for various income ranges: 2.0% for AGIs below $25k, 21.9% for AGIs $25k-50k, 56.3% for AGIs $50k-75k, 114.4% for AGIs $75k-100k, 127.4% for AGIs $100k-200k)
Profit/loss from business: +$6,400 (reported on 15.2% of returns)
Here:
+$6,400
State:
+$11,710
(% of AGI for various income ranges: 94.8% for AGIs below $25k, 91.0% for AGIs $25k-50k, 88.0% for AGIs $50k-75k, 74.4% for AGIs $75k-100k, 535.8% for AGIs $100k-200k)
Taxable individual retirement arrangement distribution: $12,825 (reported on 6.2% of returns)
28391:
$12,825
North Carolina:
$20,247
(% of AGI for various income ranges: 39.8% for AGIs below $25k, 121.7% for AGIs $25k-50k, 271.7% for AGIs $75k-100k, 355.3% for AGIs $100k-200k)
Total itemized deductions: $29,533 (reported on 5.8% of returns)
Here:
$29,533
State:
$34,549
(% of AGI for various income ranges: 127.3% for AGIs $25k-50k, 356.0% for AGIs $50k-75k, 1421.1% for AGIs $100k-200k)
Charity contributions: $12,562 (reported on 5.1% of returns)
Here:
$12,562
State:
$13,360
(% of AGI for various income ranges: 131.7% for AGIs $50k-75k, 651.6% for AGIs $100k-200k)
Taxes paid: $6,627 (reported on 5.8% of returns)
28391:
$6,627
State:
$7,586
(% of AGI for various income ranges: 20.0% for AGIs $25k-50k, 73.7% for AGIs $50k-75k, 352.1% for AGIs $100k-200k)
Earned income credit: $2,274 (reported on 17.9% of returns)
Here:
$2,274
State:
$2,337
(% of AGI for various income ranges: 105.9% for AGIs below $25k, 70.8% for AGIs $25k-50k)
Percentage of individuals using paid preparers for their 2020 taxes: 94.6%
Here:
95%
State:
93%
(% for various income ranges: 92.9% for AGIs below $25k, 93.9% for AGIs $25k-50k, 92.7% for AGIs $50k-75k, 96.0% for AGIs $75k-100k, 100.0% for AGIs $100k-200k, 100.0% for AGIs over 200k)
Averages for the 2012 tax year for zip code 28391, filed in 2013:
Average Adjusted Gross Income (AGI) in 2012: $46,868 (Individual Income Tax Returns)
Here:
$46,868
State:
$54,937
Salary/wage: $41,676 (reported on 86.6% of returns)
Here:
$41,676
State:
$46,336
(% of AGI for various income ranges: 77.3% for AGIs below $25k, 81.5% for AGIs $25k-50k, 81.5% for AGIs $50k-75k, 78.7% for AGIs $75k-100k, 87.5% for AGIs $100k-200k)
Taxable interest for individuals: $647 (reported on 28.3% of returns)
This zip code:
$647
North Carolina:
$1,298
(% of AGI for various income ranges: 0.7% for AGIs below $25k, 0.5% for AGIs $25k-50k, 0.3% for AGIs $50k-75k, 0.3% for AGIs $75k-100k, 0.3% for AGIs $100k-200k)
Ordinary dividends: $860 (reported on 10.1% of returns)
Here:
$860
State:
$6,213
(% of AGI for various income ranges: 0.8% for AGIs below $25k, 0.2% for AGIs $100k-200k)
Net capital gain/loss in AGI: +$5,225 (reported on 8.1% of returns)
Here:
+$5,225
State:
+$12,740
(% of AGI for various income ranges: 0.5% for AGIs $25k-50k, 0.2% for AGIs $75k-100k, 3.1% for AGIs $100k-200k)
Profit/loss from business: +$4,238 (reported on 15.0% of returns)
Here:
+$4,238
State:
+$10,311
(% of AGI for various income ranges: 5.1% for AGIs below $25k, 1.0% for AGIs $25k-50k, 1.3% for AGIs $50k-75k, 1.0% for AGIs $75k-100k, 0.7% for AGIs $100k-200k)
Taxable individual retirement arrangement distribution: $11,295 (reported on 7.7% of returns)
28391:
$11,295
North Carolina:
$15,575
(% of AGI for various income ranges: 2.6% for AGIs below $25k, 1.8% for AGIs $25k-50k, 2.2% for AGIs $50k-75k, 1.1% for AGIs $75k-100k, 2.3% for AGIs $100k-200k)
Total itemized deductions: $19,315 (24% of AGI, reported on 31.6% of returns)
Here:
$19,315
State:
$23,438
Here:
23.8% of AGI
State:
21.5% of AGI
(% of AGI for various income ranges: 7.7% for AGIs below $25k, 9.6% for AGIs $25k-50k, 13.5% for AGIs $50k-75k, 14.6% for AGIs $75k-100k, 19.7% for AGIs $100k-200k)
Charity contributions: $4,522 (reported on 26.3% of returns)
Here:
$4,522
State:
$4,687
(% of AGI for various income ranges: 1.1% for AGIs below $25k, 1.3% for AGIs $25k-50k, 2.5% for AGIs $50k-75k, 2.6% for AGIs $75k-100k, 4.8% for AGIs $100k-200k)
Taxes paid: $6,327 (reported on 31.6% of returns)
28391:
$6,327
State:
$8,823
(% of AGI for various income ranges: 1.3% for AGIs below $25k, 2.3% for AGIs $25k-50k, 3.9% for AGIs $50k-75k, 4.9% for AGIs $75k-100k, 8.1% for AGIs $100k-200k)
Earned income credit: $2,182 (reported on 20.2% of returns)
Here:
$2,182
State:
$2,376
(% of AGI for various income ranges: 6.5% for AGIs below $25k, 1.3% for AGIs $25k-50k)
Percentage of individuals using paid preparers for their 2012 taxes: 55.1%
Here:
55%
State:
53%
(% for various income ranges: 51.1% for AGIs below $25k, 53.1% for AGIs $25k-50k, 58.5% for AGIs $50k-75k, 62.5% for AGIs $75k-100k, 68.2% for AGIs $100k-200k)
Averages for the 2004 tax year for zip code 28391, filed in 2005:
Average Adjusted Gross Income (AGI) in 2004: $38,687 (Individual Income Tax Returns)
Here:
$38,687
State:
$45,376
Salary/wage: $35,814 (reported on 87.1% of returns)
Here:
$35,814
State:
$39,442
(% of AGI for various income ranges: 89.5% for AGIs below $10k, 78.5% for AGIs $10k-25k, 86.6% for AGIs $25k-50k, 84.0% for AGIs $50k-75k, 85.4% for AGIs $75k-100k, 63.3% for AGIs over 100k)
Taxable interest for individuals: $869 (reported on 33.8% of returns)
This zip code:
$869
North Carolina:
$1,515
(% of AGI for various income ranges: 1.4% for AGIs below $10k, 1.0% for AGIs $10k-25k, 0.5% for AGIs $25k-50k, 0.9% for AGIs $50k-75k, 0.5% for AGIs $75k-100k, 0.9% for AGIs over 100k)
Taxable dividends: $696 (reported on 11.5% of returns)
Here:
$696
State:
$4,016
(% of AGI for various income ranges: 0.7% for AGIs below $10k, 0.6% for AGIs $10k-25k, 0.1% for AGIs $25k-50k, 0.1% for AGIs $50k-75k, 0.1% for AGIs $75k-100k, 0.2% for AGIs over 100k)
Net capital gain/loss: +$7,318 (reported on 9.1% of returns)
Here:
+$7,318
State:
+$11,152
(% of AGI for various income ranges: -1.8% for AGIs below $10k, -0.1% for AGIs $10k-25k, 0.6% for AGIs $25k-50k, 0.4% for AGIs $50k-75k, 0.7% for AGIs $75k-100k, 7.8% for AGIs over 100k)
Profit/loss from business: +$6,047 (reported on 12.9% of returns)
Here:
+$6,047
State:
+$9,490
(% of AGI for various income ranges: 7.6% for AGIs below $10k, 4.3% for AGIs $10k-25k, 1.8% for AGIs $25k-50k, 1.1% for AGIs $50k-75k, 1.9% for AGIs $75k-100k, 1.4% for AGIs over 100k)
IRA payment deduction: $2,107 (reported on 1.3% of returns)
28391:
$2,107
North Carolina:
$2,967
Total itemized deductions: $16,783 (25% of AGI, reported on 33.8% of returns)
Here:
$16,783
State:
$19,464
Here:
25.0% of AGI
State:
22.7% of AGI
(% of AGI for various income ranges: 9.6% for AGIs below $10k, 8.1% for AGIs $10k-25k, 10.9% for AGIs $25k-50k, 15.3% for AGIs $50k-75k, 16.8% for AGIs $75k-100k, 21.9% for AGIs over 100k)
Charity contributions deductions: $3,532 (5% of AGI, reported on 29.8% of returns)
Here:
$3,532
State:
$4,035
Here:
5.2% of AGI
State:
4.5% of AGI
(% of AGI for various income ranges: 1.0% for AGIs below $10k, 1.7% for AGIs $10k-25k, 1.8% for AGIs $25k-50k, 2.9% for AGIs $50k-75k, 3.6% for AGIs $75k-100k, 3.8% for AGIs over 100k)
Total tax: $4,340 (reported on 73.4% of returns)
28391:
$4,340
State:
$7,257
(% of AGI for various income ranges: 2.4% for AGIs below $10k, 3.6% for AGIs $10k-25k, 5.7% for AGIs $25k-50k, 8.0% for AGIs $50k-75k, 9.7% for AGIs $75k-100k, 14.4% for AGIs over 100k)
Earned income credit: $1,771 (reported on 20.4% of returns)
Here:
$1,771
State:
$1,851
Percentage of individuals using paid preparers for their 2004 taxes: 63.5%
Here:
64%
State:
62%
(% for various income ranges: 57.2% for AGIs below $10k, 67.1% for AGIs $10k-25k, 62.6% for AGIs $25k-50k, 66.4% for AGIs $50k-75k, 58.8% for AGIs $75k-100k, 72.3% for AGIs over 100k)
Household received Food Stamps/SNAP in the past 12 months: 344 Household did not receive Food Stamps/SNAP in the past 12 months: 1,885
Women who had a birth in the past 12 months: 4 (4 now married, 0 unmarried) Women who did not have a birth in the past 12 months: 1,429 (676 now married, 753 unmarried)
Housing units in zip code 28391 with a mortgage: 1,157 (76 second mortgage, 66 both second mortgage and home equity loan) Houses without a mortgage: 23
Median monthly owner costs for units with a mortgage: $1,255 Median monthly owner costs for units without a mortgage: $476
Residents with income below the poverty level in 2022:
This zip code:
11.8%
Whole state:
12.8%
Residents with income below 50% of the poverty level in 2022:
This zip code:
3.7%
Whole state:
6.8%
Median number of rooms in houses and condos:
Here:
6.3
State:
6.4
Median number of rooms in apartments:
Here:
5.1
State:
4.4
Notable locations in this zip code not listed on our city pages
Churches in zip code 28391 include: Bethany Church (A), Magnolia Church (B), Brotherhood Holiness Church (C), Oak Grove Church (D), China Grove Church (E), Cokesbury Church (F), Prophecy Church (G), Galilee Church (H). Display/hide their locations on the map
Size of family households: 607 2-persons, 314 3-persons, 346 4-persons, 180 5-persons, 27 6-persons
Size of nonfamily households: 695 1-person, 41 2-persons, 1 3-persons
647 married couples with children.
378 single-parent households (36 men, 342 women).
98.4% of residents of 28391 zip code speak English at home.
0.6% of residents speak Spanish at home (77% very well, 16% well, 6% not at all).
0.1% of residents speak other Indo-European language at home (100% very well).
0.3% of residents speak Asian or Pacific Island language at home (100% well).
Foreign born population: 144 (2.5%) (92.9% of them are naturalized citizens)
This zip code:
2.5%
Whole state:
8.6%
29%Haiti
21%France
13%West Indies
10%Taiwan
10%Honduras
6%Bolivia
4%Barbados
22%English
13%American
9%Irish
5%Scottish
3%German
3%Italian
3%Scotch-Irish
Year of entry for the foreign-born population
72010 or later
432000 to 2009
411990 to 1999
97Before 1990
Facilities with environmental interests located in this zip code:
3TEDMAN ELEMENTARY (7370 CLINTON ROAD HIGHWAY 24 in STEDMAN, NC)
STATE MASTER (North Carolina facility info) - UNDERGROUND STORAGE TANK PROGRAM (National Center for Education Statistics) - STATE ID-430 Business SIC classification: NONCLASSIFIABLE ESTABLISHMENTS Organizations: CUMBERLAND COUNTY SCHOOLS (SCHOOL DISTRICT)
CAPE FEAR CREMATORY (ROUTE 1 BOX 115-B in STEDMAN, NC)
AIR MINOR (AIRS/AFS) STATE MASTER (North Carolina facility info) - AIR PROGRAM Business SIC classification: FUNERAL SERVICE AND CREMATORIES Alternative names: CAPE FEAR CREMATORY **INACTIVE**
AAA STORAGE CO INCORPORATED (1355 BAINBRIDGE RD in STEDMAN, NC)
National Pollutant Discharge Elimination System NON-MAJOR (Tracking pollutant discharge elimination systems) - permit Business SIC classification: TRUCKING, EXCEPT LOCAL
Housing units lacking complete plumbing facilities: 5.4% Housing units lacking complete kitchen facilities: 2.4%
87.8%Electricity
6.0%Bottled, tank, or LP gas
5.2%Utility gas
1.0%No fuel used
Population in 1990: 4,776.
Place of birth for U.S.-born residents:
This state: 3,916
Northeast: 260
Midwest: 421
South: 833
West: 173
61% of the 28391 zip code residents lived in the same house 5 years ago. Out of people who lived in different houses, 63% lived in this county. Out of people who lived in different counties, 50% lived in North Carolina.
93% of the 28391 zip code residents lived in the same house 1 year ago. Out of people who lived in different houses, 54% moved from this county. Out of people who lived in different houses, 29% moved from different county within same state. Out of people who lived in different houses, 17% moved from different state. Out of people who lived in different houses, 1% moved from abroad.
Private vs. public school enrollment:
Students in private schools in grades 1 to 8 (elementary and middle school): 59
Here:
10.2%
North Carolina:
13.8%
Students in private schools in grades 9 to 12 (high school): 26
Here:
7.8%
North Carolina:
11.9%
Students in private undergraduate colleges: 50
Here:
13.7%
North Carolina:
19.3%
Occupation by median earnings in the past 12 months ($)
78,216Law enforcement workers including supervisors
71,599Health diagnosing and treating practitioners and other technical occupations
69,791Management occupations
60,179Business and financial operations occupations
54,534Installation, maintenance, and repair occupations
54,481Health technologists and technicians
Companies with federal contracts located in this zip code (STEDMAN, NC):
AMERICAN ROOF-BRITE CO (1890 PAGE RD; small business) : $131,895 in 6 contractsfrom 2001 to 2003
Contracts for Maintenance, Repair or Alteration of Real Property -- Miscellaneous Buildings, Maintenance, Repair or Alteration of Real Property -- Family Housing Facilities by Army Signed by year:2000: $0; 2001: $19,613; 2002: $63,708; 2003: $48,574; 2004: $0; 2005: $0; 2006: $0.
Biggest contracts:
$48,574 with Army for Maintenance, Repair or Alteration of Real Property -- Miscellaneous Buildings. Signed on 2003-06-23. Completion date: 2003-07-31.
$26,543 with Army for Maintenance, Repair or Alteration of Real Property -- Family Housing Facilities. Signed on 2002-03-19. Completion date: 2002-04-15.
$21,711, same as above.Signed on 2002-03-20. Completion date: 2002-05-30.
$15,454, same as above.Signed on 2002-03-19. Completion date: 2002-05-30.
SPELL CONCRETE SERVICE (6791 NORTH ST; small business) : $120,416 in 11 contractsfrom 2004 to 2005
Contracts for Maintenance, Repair or Alteration of Real Property -- Other Non-Building Facilities, Maintenance, Repair or Alteration of Real Property -- Office Buildings, Maintenance, Repair or Alteration of Real Property -- Miscellaneous Buildings, Maintenance, Repair or Alteration of Real Property -- Other Administrative Facilities and Service Buildings, and moreby Army Signed by year:2000: $0; 2001: $0; 2002: $0; 2003: $0; 2004: $106,466; 2005: $13,950; 2006: $0.
Biggest contracts:
$65,000 with Army for Maintenance, Repair or Alteration of Real Property -- Other Non-Building Facilities. Signed on 2004-08-23. Completion date: 2004-08-03.
$40,000 with Army for Maintenance, Repair or Alteration of Real Property -- Office Buildings. Signed on 2004-04-08. Completion date: 2004-04-15.
$18,500 with Army for Maintenance, Repair or Alteration of Real Property -- Miscellaneous Buildings. Signed on 2004-01-28. Completion date: 2004-02-25.
$18,000 with Army for Maintenance, Repair or Alteration of Real Property -- Other Non-Building Facilities. Signed on 2004-09-16. Completion date: 2004-10-25.
GEORGE ROBERT PHILLIPS (1032 BAINBRIDGE ROAD; small business) : $35,155 in 4 contractsfrom 2004 to 2005
$12,310 with Army for Maintenance, Repair or Alteration of Real Property -- Electronic and Communications Facilities. Signed on 2004-08-18. Completion date: 2004-09-10.
$10,268 with Army for Maintenance, Repair or Alteration of Real Property -- Dredging. Signed on 2005-12-15. Completion date: 2005-12-27.
$7,532 with Army for Maintenance, Repair or Alteration of Real Property -- Other Non-Building Facilities. Signed on 2005-01-06. Completion date: 2005-01-17.
$5,045, same as above.Signed on 2005-06-06. Completion date: 2005-06-23.
IMAGE CONTRACTORS, INC (702 FRONT STREET; small business)
$32,300 with Air Force for Maintenance, Repair or Alteration of Real Property -- Laboratories and Clinics. Signed on 2004-09-29. Completion date: 2005-01-07.
Top industries in this zip code by the number of employees in 2005:
Administrative and Support and Waste Management and Remediation Services: Office Administrative Services (20-49 employees: 1 establishment)
Other Services (except Public Administration): Religious Organizations (10-19: 1, 1-4: 5)
Health Care and Social Assistance: Child Day Care Services (5-9: 3)
Construction: Commercial and Institutional Building Construction (5-9: 2, 1-4: 1)
Fatal accident statistics in 2014:
Fatal accident count: 1
Vehicles involved in fatal accidents: 1
Fatal accidents caused by drunken drivers: 0
Fatalities: 1
Persons involved in fatal accidents: 1
Pedestrians involved in fatal accidents: 0
Fatal accident statistics in 2013:
Fatal accident count: 4
Vehicles involved in fatal accidents: 7
Fatal accidents caused by drunken drivers: 3
Fatalities: 6
Persons involved in fatal accidents: 16
Pedestrians involved in fatal accidents: 0
Home Mortgage Disclosure Act Aggregated Statistics For Year 2009 (Based on 4 partial tracts)
A) FHA, FSA/RHS & VA Home Purchase Loans
B) Conventional Home Purchase Loans
C) Refinancings
D) Home Improvement Loans
E) Loans on Dwellings For 5+ Families
F) Non-occupant Loans on < 5 Family Dwellings (A B C & D)
G) Loans On Manufactured Home Dwelling (A B C & D)
Number
Average Value
Number
Average Value
Number
Average Value
Number
Average Value
Number
Average Value
Number
Average Value
Number
Average Value
LOANS ORIGINATED
85
$190,424
35
$155,333
181
$173,239
17
$43,188
1
$689,660
11
$107,558
26
$58,513
APPLICATIONS APPROVED, NOT ACCEPTED
6
$115,747
1
$244,330
12
$192,877
1
$240,720
0
$0
0
$0
4
$55,968
APPLICATIONS DENIED
7
$114,857
10
$209,426
67
$143,803
13
$57,588
0
$0
4
$96,288
13
$54,625
APPLICATIONS WITHDRAWN
10
$155,385
1
$327,380
36
$157,036
2
$128,185
0
$0
2
$195,585
5
$33,700
FILES CLOSED FOR INCOMPLETENESS
0
$0
6
$176,728
8
$117,652
0
$0
0
$0
0
$0
1
$60,180
Aggregated Statistics For Year 2008 (Based on 4 partial tracts)
A) FHA, FSA/RHS & VA Home Purchase Loans
B) Conventional Home Purchase Loans
C) Refinancings
D) Home Improvement Loans
E) Loans on Dwellings For 5+ Families
F) Non-occupant Loans on < 5 Family Dwellings (A B C & D)
G) Loans On Manufactured Home Dwelling (A B C & D)
Number
Average Value
Number
Average Value
Number
Average Value
Number
Average Value
Number
Average Value
Number
Average Value
Number
Average Value
LOANS ORIGINATED
79
$166,264
30
$130,751
85
$137,989
14
$63,876
1
$672,810
8
$66,649
31
$64,567
APPLICATIONS APPROVED, NOT ACCEPTED
7
$118,984
4
$114,642
14
$97,406
2
$15,045
0
$0
0
$0
7
$75,827
APPLICATIONS DENIED
7
$165,237
11
$48,472
72
$90,019
28
$61,899
0
$0
5
$60,180
30
$60,621
APPLICATIONS WITHDRAWN
1
$123,970
1
$98,700
34
$128,006
6
$77,432
0
$0
1
$104,710
4
$78,835
FILES CLOSED FOR INCOMPLETENESS
0
$0
1
$64,990
4
$186,258
0
$0
0
$0
0
$0
0
$0
Aggregated Statistics For Year 2007 (Based on 4 partial tracts)
A) FHA, FSA/RHS & VA Home Purchase Loans
B) Conventional Home Purchase Loans
C) Refinancings
D) Home Improvement Loans
F) Non-occupant Loans on < 5 Family Dwellings (A B C & D)
G) Loans On Manufactured Home Dwelling (A B C & D)
Number
Average Value
Number
Average Value
Number
Average Value
Number
Average Value
Number
Average Value
Number
Average Value
LOANS ORIGINATED
64
$155,603
91
$132,026
81
$108,859
22
$50,880
16
$102,908
46
$66,381
APPLICATIONS APPROVED, NOT ACCEPTED
1
$190,170
11
$121,016
22
$103,291
8
$28,585
2
$69,205
6
$74,222
APPLICATIONS DENIED
7
$198,594
40
$81,002
89
$104,348
35
$25,688
8
$144,732
31
$63,208
APPLICATIONS WITHDRAWN
7
$131,709
10
$108,204
31
$106,305
5
$70,050
0
$0
6
$75,425
FILES CLOSED FOR INCOMPLETENESS
1
$45,740
6
$115,545
8
$151,504
0
$0
0
$0
0
$0
Aggregated Statistics For Year 2006 (Based on 4 partial tracts)
A) FHA, FSA/RHS & VA Home Purchase Loans
B) Conventional Home Purchase Loans
C) Refinancings
D) Home Improvement Loans
F) Non-occupant Loans on < 5 Family Dwellings (A B C & D)
G) Loans On Manufactured Home Dwelling (A B C & D)
Number
Average Value
Number
Average Value
Number
Average Value
Number
Average Value
Number
Average Value
Number
Average Value
LOANS ORIGINATED
54
$147,040
113
$135,400
101
$103,724
32
$49,160
22
$69,809
39
$63,853
APPLICATIONS APPROVED, NOT ACCEPTED
4
$146,840
13
$125,638
19
$110,605
6
$27,683
2
$119,760
6
$71,012
APPLICATIONS DENIED
2
$114,945
36
$92,911
89
$72,689
23
$57,563
11
$39,937
30
$52,156
APPLICATIONS WITHDRAWN
4
$86,358
14
$90,528
32
$107,196
0
$0
2
$195,585
5
$66,198
FILES CLOSED FOR INCOMPLETENESS
2
$114,340
6
$129,387
13
$136,377
0
$0
0
$0
0
$0
Aggregated Statistics For Year 2005 (Based on 4 partial tracts)
A) FHA, FSA/RHS & VA Home Purchase Loans
B) Conventional Home Purchase Loans
C) Refinancings
D) Home Improvement Loans
F) Non-occupant Loans on < 5 Family Dwellings (A B C & D)
G) Loans On Manufactured Home Dwelling (A B C & D)
Number
Average Value
Number
Average Value
Number
Average Value
Number
Average Value
Number
Average Value
Number
Average Value
LOANS ORIGINATED
46
$109,632
95
$115,647
89
$89,783
23
$31,032
19
$66,388
43
$71,404
APPLICATIONS APPROVED, NOT ACCEPTED
2
$234,100
6
$60,582
17
$90,341
5
$28,404
1
$31,290
5
$26,480
APPLICATIONS DENIED
7
$79,266
39
$76,814
111
$83,113
22
$51,810
8
$137,962
40
$56,629
APPLICATIONS WITHDRAWN
4
$68,002
22
$84,963
45
$92,624
1
$36,110
4
$49,048
14
$65,424
FILES CLOSED FOR INCOMPLETENESS
2
$86,055
8
$140,370
23
$123,918
1
$79,440
0
$0
6
$68,405
Aggregated Statistics For Year 2004 (Based on 4 partial tracts)
A) FHA, FSA/RHS & VA Home Purchase Loans
B) Conventional Home Purchase Loans
C) Refinancings
D) Home Improvement Loans
F) Non-occupant Loans on < 5 Family Dwellings (A B C & D)
G) Loans On Manufactured Home Dwelling (A B C & D)
Number
Average Value
Number
Average Value
Number
Average Value
Number
Average Value
Number
Average Value
Number
Average Value
LOANS ORIGINATED
54
$100,389
73
$111,275
101
$78,437
20
$36,409
13
$55,365
49
$61,998
APPLICATIONS APPROVED, NOT ACCEPTED
1
$102,310
7
$57,944
22
$72,106
2
$12,035
0
$0
11
$51,865
APPLICATIONS DENIED
5
$87,622
26
$82,910
88
$76,005
20
$29,729
1
$97,490
43
$64,519
APPLICATIONS WITHDRAWN
1
$63,790
13
$111,472
46
$92,730
1
$110,730
0
$0
19
$67,592
FILES CLOSED FOR INCOMPLETENESS
1
$104,710
4
$142,325
6
$76,428
0
$0
0
$0
2
$72,215
Aggregated Statistics For Year 2003 (Based on 4 partial tracts)
A) FHA, FSA/RHS & VA Home Purchase Loans
B) Conventional Home Purchase Loans
C) Refinancings
D) Home Improvement Loans
F) Non-occupant Loans on < 5 Family Dwellings (A B C & D)
Number
Average Value
Number
Average Value
Number
Average Value
Number
Average Value
Number
Average Value
LOANS ORIGINATED
26
$93,140
59
$91,372
227
$91,585
11
$32,606
16
$54,011
APPLICATIONS APPROVED, NOT ACCEPTED
0
$0
7
$73,763
41
$91,121
4
$25,878
5
$102,306
APPLICATIONS DENIED
5
$113,620
17
$69,596
93
$85,067
11
$21,775
13
$54,625
APPLICATIONS WITHDRAWN
0
$0
8
$108,625
31
$79,981
0
$0
2
$52,355
FILES CLOSED FOR INCOMPLETENESS
0
$0
4
$88,465
14
$90,872
0
$0
2
$83,050
Aggregated Statistics For Year 2002 (Based on 4 partial tracts)
A) FHA, FSA/RHS & VA Home Purchase Loans
B) Conventional Home Purchase Loans
C) Refinancings
D) Home Improvement Loans
F) Non-occupant Loans on < 5 Family Dwellings (A B C & D)
Number
Average Value
Number
Average Value
Number
Average Value
Number
Average Value
Number
Average Value
LOANS ORIGINATED
23
$95,294
48
$106,845
140
$86,376
4
$11,132
20
$66,980
APPLICATIONS APPROVED, NOT ACCEPTED
0
$0
10
$87,622
30
$71,574
1
$25,280
2
$21,665
APPLICATIONS DENIED
2
$90,870
41
$52,988
71
$60,909
11
$13,021
4
$47,242
APPLICATIONS WITHDRAWN
0
$0
5
$77,752
22
$68,332
1
$42,130
1
$49,350
FILES CLOSED FOR INCOMPLETENESS
0
$0
0
$0
5
$121,322
0
$0
0
$0
Aggregated Statistics For Year 2001 (Based on 4 partial tracts)
A) FHA, FSA/RHS & VA Home Purchase Loans
B) Conventional Home Purchase Loans
C) Refinancings
D) Home Improvement Loans
F) Non-occupant Loans on < 5 Family Dwellings (A B C & D)
Number
Average Value
Number
Average Value
Number
Average Value
Number
Average Value
Number
Average Value
LOANS ORIGINATED
25
$69,183
46
$62,326
116
$85,497
10
$11,073
12
$51,153
APPLICATIONS APPROVED, NOT ACCEPTED
0
$0
18
$42,995
12
$80,942
4
$34,302
0
$0
APPLICATIONS DENIED
2
$126,380
51
$40,403
53
$58,954
8
$8,576
5
$33,460
APPLICATIONS WITHDRAWN
0
$0
5
$121,564
35
$69,327
1
$6,020
1
$196,190
FILES CLOSED FOR INCOMPLETENESS
0
$0
2
$54,160
7
$103,510
0
$0
0
$0
Aggregated Statistics For Year 2000 (Based on 4 partial tracts)
A) FHA, FSA/RHS & VA Home Purchase Loans
B) Conventional Home Purchase Loans
C) Refinancings
D) Home Improvement Loans
F) Non-occupant Loans on < 5 Family Dwellings (A B C & D)
Number
Average Value
Number
Average Value
Number
Average Value
Number
Average Value
Number
Average Value
LOANS ORIGINATED
12
$70,110
78
$62,309
53
$61,611
10
$26,600
11
$31,185
APPLICATIONS APPROVED, NOT ACCEPTED
7
$47,971
25
$42,608
10
$70,170
6
$9,830
1
$48,140
APPLICATIONS DENIED
10
$73,059
64
$44,928
54
$52,379
22
$12,857
4
$39,720
APPLICATIONS WITHDRAWN
2
$118,555
6
$67,602
35
$71,012
1
$4,810
0
$0
FILES CLOSED FOR INCOMPLETENESS
0
$0
2
$54,160
5
$77,752
0
$0
0
$0
Aggregated Statistics For Year 1999 (Based on 2 partial tracts)
A) FHA, FSA/RHS & VA Home Purchase Loans
B) Conventional Home Purchase Loans
C) Refinancings
D) Home Improvement Loans
F) Non-occupant Loans on < 5 Family Dwellings (A B C & D)
Detailed PMIC statistics for the following Tracts:0028.00
2002 - 2018 National Fire Incident Reporting System (NFIRS) incidents
Based on the data from the years 2002 - 2018 the average number of fires per year is 64. The highest number of reported fire incidents - 113 took place in 2007, and the least - 18 in 2017. The data has a rising trend.
When looking into fire subcategories, the most incidents belonged to: Outside Fires (47.6%), and Structure Fires (41.5%).
Fire incident types reported to NFIRS in Zip Code 28391

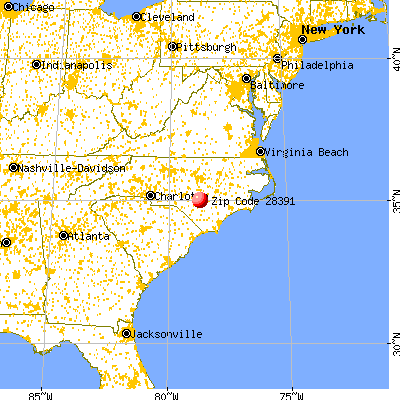


 Nearest zip codes: 28312, 28318, 28395, 28344, 28342, 28382.


 Based on the data from the years 2002 - 2018 the average number of fires per year is 64. The highest number of reported fire incidents - 113 took place in 2007, and the least - 18 in 2017. The data has a rising trend.
 When looking into fire subcategories, the most incidents belonged to: Outside Fires (47.6%), and Structure Fires (41.5%).