Estimated zip code population in 2022: 2,479 Zip code population in 2010: 2,375 Zip code population in 2000: 2,134
Houses and condos: 1,084 Renter-occupied apartments: 158
% of renters here:
17%
State:
33%
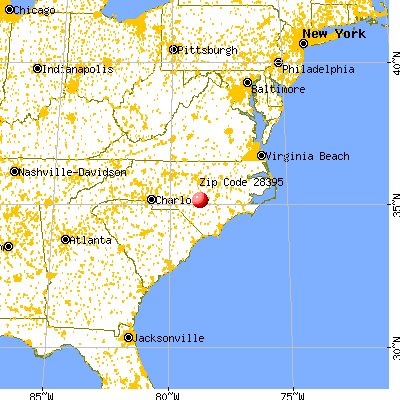
March 2022 cost of living index in zip code 28395: 80.8 (low, U.S. average is 100)
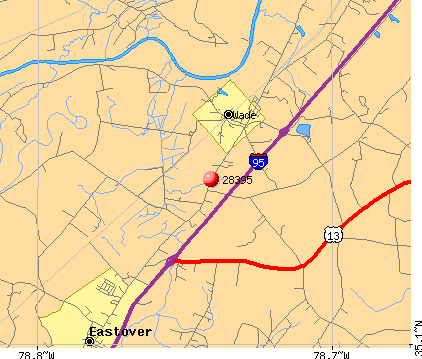
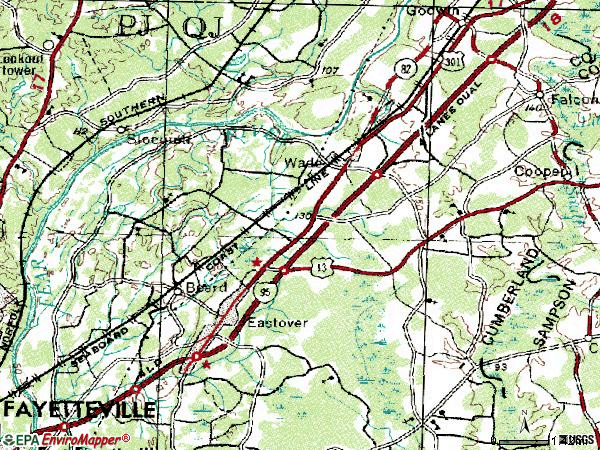
Land area: 47.9 sq. mi. Water area: 0.3 sq. mi.
Population density: 52 people per square mile
(very low).
OSM Map
General Map
Google Map
MSN Map
OSM Map
General Map
Google Map
MSN Map
OSM Map
General Map
Google Map
MSN Map
OSM Map
General Map
Google Map
MSN Map
Please wait while loading the map...
Real estate property taxes paid for housing units in 2022:
This zip code:
0.6% ($1,558)
North Carolina:
0.6% ($1,769)
Median real estate property taxes paid for housing units with mortgages in 2022: $1,643 (0.6%) Median real estate property taxes paid for housing units with no mortgage in 2022: $1,225 (0.8%)
Estimated median house/condo value in 2022: $241,299
28395:
$241,299
North Carolina:
$280,600
According to our research of North Carolina and other state lists, there were 6 registered sex offenders living in 28395 zip code as of June 16, 2024. The ratio of all residents to sex offenders in zip code 28395 is 423 to 1. The ratio of registered sex offenders to all residents in this zip code is near the state average.
Median resident age:
This zip code:
39.7 years
North Carolina median age:
39.2 years
Average household size:
This zip code:
2.7 people
North Carolina:
2.4 people
Averages for the 2020 tax year for zip code 28395, filed in 2021:
Average Adjusted Gross Income (AGI) in 2020: $62,046 (Individual Income Tax Returns)
Here:
$62,046
State:
$70,020
Salary/wage: $55,367 (reported on 79.2% of returns)
Here:
$55,367
State:
$58,387
(% of AGI for various income ranges: 1100.8% for AGIs below $25k, 3978.4% for AGIs $25k-50k, 6622.9% for AGIs $50k-75k, 10870.0% for AGIs $75k-100k, 19776.4% for AGIs $100k-200k)
Taxable interest for individuals: $594 (reported on 26.4% of returns)
This zip code:
$594
North Carolina:
$1,479
(% of AGI for various income ranges: 8.1% for AGIs below $25k, 12.6% for AGIs $25k-50k, 12.9% for AGIs $50k-75k, 41.2% for AGIs $75k-100k, 90.9% for AGIs $100k-200k)
Ordinary dividends: $3,247 (reported on 12.0% of returns)
Here:
$3,247
State:
$7,888
(% of AGI for various income ranges: 7.9% for AGIs $25k-50k, 11.4% for AGIs $50k-75k, 31.2% for AGIs $75k-100k, 391.8% for AGIs $100k-200k)
Net capital gain/loss in AGI: +$6,867 (reported on 12.0% of returns)
Here:
+$6,867
State:
+$23,652
(% of AGI for various income ranges: 13.7% for AGIs $25k-50k, 123.6% for AGIs $50k-75k, 755.5% for AGIs $100k-200k)
Profit/loss from business: +$7,200 (reported on 16.8% of returns)
Here:
+$7,200
State:
+$11,710
(% of AGI for various income ranges: 166.5% for AGIs below $25k, 206.4% for AGIs $50k-75k, 398.8% for AGIs $75k-100k, 460.9% for AGIs $100k-200k)
Taxable individual retirement arrangement distribution: $14,522 (reported on 7.2% of returns)
28395:
$14,522
North Carolina:
$20,247
(% of AGI for various income ranges: 95.8% for AGIs below $25k, 398.6% for AGIs $50k-75k, 454.5% for AGIs $100k-200k)
Total itemized deductions: $26,978 (reported on 7.2% of returns)
Here:
$26,978
State:
$34,549
(% of AGI for various income ranges: 574.3% for AGIs $50k-75k, 1476.4% for AGIs $100k-200k)
Charity contributions: $12,857 (reported on 5.6% of returns)
Here:
$12,857
State:
$13,360
(% of AGI for various income ranges: 129.5% for AGIs $25k-50k, 594.5% for AGIs $100k-200k)
Taxes paid: $6,478 (reported on 7.2% of returns)
28395:
$6,478
State:
$7,586
(% of AGI for various income ranges: 128.6% for AGIs $50k-75k, 366.4% for AGIs $100k-200k)
Earned income credit: $2,333 (reported on 16.8% of returns)
Here:
$2,333
State:
$2,337
(% of AGI for various income ranges: 123.5% for AGIs below $25k, 88.9% for AGIs $25k-50k)
Percentage of individuals using paid preparers for their 2020 taxes: 91.2%
Here:
91%
State:
93%
(% for various income ranges: 92.1% for AGIs below $25k, 89.3% for AGIs $25k-50k, 90.5% for AGIs $50k-75k, 92.9% for AGIs $75k-100k, 95.2% for AGIs $100k-200k, 66.7% for AGIs over 200k)
Averages for the 2012 tax year for zip code 28395, filed in 2013:
Average Adjusted Gross Income (AGI) in 2012: $48,008 (Individual Income Tax Returns)
Here:
$48,008
State:
$54,937
Salary/wage: $43,100 (reported on 83.8% of returns)
Here:
$43,100
State:
$46,336
(% of AGI for various income ranges: 74.9% for AGIs below $25k, 80.3% for AGIs $25k-50k, 75.0% for AGIs $50k-75k, 81.4% for AGIs $75k-100k, 68.9% for AGIs $100k-200k)
Taxable interest for individuals: $743 (reported on 31.5% of returns)
This zip code:
$743
North Carolina:
$1,298
(% of AGI for various income ranges: 0.5% for AGIs below $25k, 0.4% for AGIs $25k-50k, 0.5% for AGIs $50k-75k, 0.2% for AGIs $75k-100k, 0.7% for AGIs $100k-200k)
Ordinary dividends: $862 (reported on 11.7% of returns)
Here:
$862
State:
$6,213
(% of AGI for various income ranges: 0.2% for AGIs below $25k, 0.3% for AGIs $50k-75k, 0.4% for AGIs $100k-200k)
Net capital gain/loss in AGI: +$2,300 (reported on 9.0% of returns)
Here:
+$2,300
State:
+$12,740
(% of AGI for various income ranges: 0.2% for AGIs below $25k, 1.1% for AGIs $50k-75k, 0.6% for AGIs $100k-200k)
Profit/loss from business: +$8,093 (reported on 12.6% of returns)
Here:
+$8,093
State:
+$10,311
(% of AGI for various income ranges: 3.7% for AGIs below $25k, 1.9% for AGIs $25k-50k, 1.3% for AGIs $50k-75k, 6.2% for AGIs $75k-100k)
Taxable individual retirement arrangement distribution: $9,688 (reported on 7.2% of returns)
28395:
$9,688
North Carolina:
$15,575
(% of AGI for various income ranges: 1.9% for AGIs below $25k, 1.4% for AGIs $25k-50k, 4.6% for AGIs $50k-75k)
Total itemized deductions: $18,174 (22% of AGI, reported on 34.2% of returns)
Here:
$18,174
State:
$23,438
Here:
22.3% of AGI
State:
21.5% of AGI
(% of AGI for various income ranges: 7.8% for AGIs below $25k, 12.0% for AGIs $25k-50k, 12.8% for AGIs $50k-75k, 15.6% for AGIs $75k-100k, 13.8% for AGIs $100k-200k)
Charity contributions: $4,009 (reported on 28.8% of returns)
Here:
$4,009
State:
$4,687
(% of AGI for various income ranges: 2.4% for AGIs $25k-50k, 2.8% for AGIs $50k-75k, 3.2% for AGIs $75k-100k, 2.4% for AGIs $100k-200k)
Taxes paid: $6,545 (reported on 34.2% of returns)
28395:
$6,545
State:
$8,823
(% of AGI for various income ranges: 1.0% for AGIs below $25k, 3.0% for AGIs $25k-50k, 3.9% for AGIs $50k-75k, 5.0% for AGIs $75k-100k, 7.2% for AGIs $100k-200k)
Earned income credit: $2,171 (reported on 21.6% of returns)
Here:
$2,171
State:
$2,376
(% of AGI for various income ranges: 6.9% for AGIs below $25k, 1.4% for AGIs $25k-50k)
Percentage of individuals using paid preparers for their 2012 taxes: 57.7%
Here:
58%
State:
53%
(% for various income ranges: 52.4% for AGIs below $25k, 57.1% for AGIs $25k-50k, 63.2% for AGIs $50k-75k, 63.6% for AGIs $75k-100k, 63.6% for AGIs $100k-200k)
Averages for the 2004 tax year for zip code 28395, filed in 2005:
Average Adjusted Gross Income (AGI) in 2004: $37,017 (Individual Income Tax Returns)
Here:
$37,017
State:
$45,376
Salary/wage: $33,068 (reported on 85.9% of returns)
Here:
$33,068
State:
$39,442
(% of AGI for various income ranges: 82.1% for AGIs below $10k, 82.3% for AGIs $10k-25k, 81.2% for AGIs $25k-50k, 77.4% for AGIs $50k-75k, 82.3% for AGIs $75k-100k, 56.7% for AGIs over 100k)
Taxable interest for individuals: $983 (reported on 35.4% of returns)
This zip code:
$983
North Carolina:
$1,515
(% of AGI for various income ranges: 4.6% for AGIs below $10k, 1.5% for AGIs $10k-25k, 1.2% for AGIs $25k-50k, 0.2% for AGIs $50k-75k, 0.5% for AGIs $75k-100k, 1.1% for AGIs over 100k)
Taxable dividends: $642 (reported on 14.7% of returns)
Here:
$642
State:
$4,016
(% of AGI for various income ranges: 0.9% for AGIs below $10k, 0.1% for AGIs $10k-25k, 0.2% for AGIs $25k-50k, 0.3% for AGIs $50k-75k, 0.1% for AGIs $75k-100k, 0.5% for AGIs over 100k)
Net capital gain/loss: +$10,138 (reported on 9.3% of returns)
Here:
+$10,138
State:
+$11,152
(% of AGI for various income ranges: -0.0% for AGIs $10k-25k, -0.0% for AGIs $25k-50k, -0.1% for AGIs $50k-75k, -0.0% for AGIs $75k-100k, 16.2% for AGIs over 100k)
Profit/loss from business: +$5,695 (reported on 12.7% of returns)
Here:
+$5,695
State:
+$9,490
(% of AGI for various income ranges: 7.7% for AGIs below $10k, 3.2% for AGIs $10k-25k, 1.3% for AGIs $25k-50k, 0.8% for AGIs $50k-75k, 4.6% for AGIs $75k-100k)
IRA payment deduction: $1,733 (reported on 1.5% of returns)
28395:
$1,733
North Carolina:
$2,967
Total itemized deductions: $15,558 (25% of AGI, reported on 34.1% of returns)
Here:
$15,558
State:
$19,464
Here:
25.2% of AGI
State:
22.7% of AGI
(% of AGI for various income ranges: 18.5% for AGIs below $10k, 6.4% for AGIs $10k-25k, 14.7% for AGIs $25k-50k, 15.7% for AGIs $50k-75k, 17.3% for AGIs $75k-100k, 14.6% for AGIs over 100k)
Charity contributions deductions: $3,258 (5% of AGI, reported on 29.6% of returns)
Here:
$3,258
State:
$4,035
Here:
5.1% of AGI
State:
4.5% of AGI
(% of AGI for various income ranges: 1.4% for AGIs $10k-25k, 2.7% for AGIs $25k-50k, 2.5% for AGIs $50k-75k, 3.6% for AGIs $75k-100k, 2.8% for AGIs over 100k)
Total tax: $4,337 (reported on 71.6% of returns)
28395:
$4,337
State:
$7,257
(% of AGI for various income ranges: 2.2% for AGIs below $10k, 3.8% for AGIs $10k-25k, 6.1% for AGIs $25k-50k, 8.3% for AGIs $50k-75k, 10.6% for AGIs $75k-100k, 14.6% for AGIs over 100k)
Earned income credit: $1,915 (reported on 19.9% of returns)
Here:
$1,915
State:
$1,851
Percentage of individuals using paid preparers for their 2004 taxes: 69.1%
Here:
69%
State:
62%
(% for various income ranges: 62.2% for AGIs below $10k, 68.1% for AGIs $10k-25k, 72.1% for AGIs $25k-50k, 74.1% for AGIs $50k-75k, 66.7% for AGIs $75k-100k, 72.7% for AGIs over 100k)
Household received Food Stamps/SNAP in the past 12 months: 179 Household did not receive Food Stamps/SNAP in the past 12 months: 755
Women who had a birth in the past 12 months: 16 (17 now married, 0 unmarried) Women who did not have a birth in the past 12 months: 504 (311 now married, 194 unmarried)
Housing units in zip code 28395 with a mortgage: 488 (16 second mortgage, 13 both second mortgage and home equity loan) Houses without a mortgage: 14
Median monthly owner costs for units with a mortgage: $1,468 Median monthly owner costs for units without a mortgage: $496
Residents with income below the poverty level in 2022:
This zip code:
4.8%
Whole state:
12.8%
Residents with income below 50% of the poverty level in 2022:
This zip code:
2.0%
Whole state:
6.8%
Median number of rooms in houses and condos:
Here:
6.6
State:
6.4
Median number of rooms in apartments:
Here:
5.4
State:
4.4
Notable locations in this zip code not listed on our city pages
Churches in zip code 28395 include: McMillan Church (A), Bluff Church (B), Wesley Chapel (C), Mount Olive Church (D), New Hope Church (E), Oak Ridge Church (F), Emmanuel Church (G), Sandy Grove Church (H). Display/hide their locations on the map
Size of family households: 291 2-persons, 135 3-persons, 117 4-persons, 88 5-persons, 4 6-persons, 20 7-or-more-persons
Size of nonfamily households: 263 1-person, 8 2-persons
485 married couples with children.
49 single-parent households (9 men, 40 women).
94.0% of residents of 28395 zip code speak English at home.
4.0% of residents speak Spanish at home (96% very well, 4% not well).
0.3% of residents speak other Indo-European language at home (100% very well).
1.3% of residents speak Asian or Pacific Island language at home (17% very well, 83% not well).
Foreign born population: 64 (2.6%) (88.9% of them are naturalized citizens)
This zip code:
2.6%
Whole state:
8.6%
74%Barbados
11%France
8%Japan
6%Honduras
5%Singapore
5%Guatemala
2%Nicaragua
16%American
10%English
8%Irish
6%Scottish
5%German
2%European
2%Scotch-Irish
Year of entry for the foreign-born population
342010 or later
432000 to 2009
201990 to 1999
29Before 1990
Facilities with environmental interests located in this zip code:
DONAVAN MCLAURIN COMPANY (7133 POWELL STREET in WADE, NC)
AIR MINOR (AIRS/AFS) STATE MASTER (North Carolina facility info) - AIR PROGRAM CRITERIA AND HAZARDOUS AIR POLLUTANT INVENTORY (Inventory of air pollution sources) National Pollutant Discharge Elimination System NON-MAJOR (Tracking pollutant discharge elimination systems) - permit National Pollutant Discharge Elimination System NON-MAJOR (Tracking pollutant discharge elimination systems) - permit Business SIC classification: NAILED AND LOCK CORNER WOOD BOXES AND SHOOK; WOOD PALLETS AND SKIDS Alternative names: DONOVAN E. MCLAURIN CO., INC., MCLAURIN COMPANY INC
CLARK MINE (3451 RIVER RD in WADE, NC)
National Pollutant Discharge Elimination System NON-MAJOR (Tracking pollutant discharge elimination systems) - permit Alternative names: AMER MTRL CO LLC CLARK MINE
Housing units lacking complete plumbing facilities: 6.5% Housing units lacking complete kitchen facilities: 4.8%
83.4%Electricity
16.3%Bottled, tank, or LP gas
Population in 1990: 1,369. Population change in the 1990s: +765 (+55.9%).
Place of birth for U.S.-born residents:
This state: 1,489
Northeast: 126
Midwest: 111
South: 556
West: 53
71% of the 28395 zip code residents lived in the same house 5 years ago. Out of people who lived in different houses, 71% lived in this county. Out of people who lived in different counties, 50% lived in North Carolina.
88% of the 28395 zip code residents lived in the same house 1 year ago. Out of people who lived in different houses, 28% moved from this county. Out of people who lived in different houses, 43% moved from different county within same state. Out of people who lived in different houses, 30% moved from different state.
Private vs. public school enrollment:
Students in private schools in grades 1 to 8 (elementary and middle school): 33
Here:
12.0%
North Carolina:
13.8%
Students in private schools in grades 9 to 12 (high school): 10
Here:
9.0%
North Carolina:
11.9%
Students in private undergraduate colleges: 11
Here:
6.4%
North Carolina:
19.3%
Occupation by median earnings in the past 12 months ($)
109,563Health diagnosing and treating practitioners and other technical occupations
103,084Computer and mathematical occupations
92,660Installation, maintenance, and repair occupations
82,035Management occupations
63,345Architecture and engineering occupations
61,809Building and grounds cleaning and maintenance occupations
Companies with federal contracts located in this zip code:
SHIVAM OF WADE INC (3945 GOLDSBORO RD in WADE, NC; small business) : $186,550 in 34 contractsfrom 2004 to 2006
Contracts for Lodging - Hotel/Motel, Food Services by Army Signed by year:2000: $0; 2001: $0; 2002: $0; 2003: $0; 2004: $873,600; 2005: -$651,200; 2006: -$35,850.
Biggest contracts:
$873,600 with Army for Lodging - Hotel/Motel. Signed on 2004-11-15. Completion date: 2004-10-01.
$585,600, same as above.Signed on 2004-06-03. Completion date: 2004-05-27.
$148,800, same as above.Signed on 2006-03-06. Completion date: 2006-03-31.
$148,800, same as above.Signed on 2005-11-04. Completion date: 2005-10-31.
AMERICAN MATERIALS COMPANY, LL (4755 GAME ROAD in WADE, NC; small business) : $6,918 in 2 contractsin 2003
$6,528 with Army for Miscellaneous Construction Materials. Signed on 2003-04-24. Completion date: 2003-04-25.
$390, same as above.Signed on 2003-04-30. Completion date: 2003-04-25.
Top industries in this zip code by the number of employees in 2005:
Health Care and Social Assistance: All Other Outpatient Care Centers (20-49 employees: 1 establishment)
Other Services (except Public Administration): Commercial and Industrial Machinery and Equipment (except Automotive and Electronic) Repair and Maintenance (5-9: 2, 1-4: 1)
Health Care and Social Assistance: Child Day Care Services (10-19: 1)
Mining: Construction Sand and Gravel Mining (5-9: 1, 1-4: 1)
Wholesale Trade: Recyclable Material Merchant Wholesalers (5-9: 1)
Construction: Siding Contractors (5-9: 1)
Accommodation and Food Services: Hotels (except Casino Hotels) and Motels (5-9: 1)
Construction: Structural Steel and Precast Concrete Contractors (5-9: 1)
Fatal accident statistics in 2013:
Fatal accident count: 1
Vehicles involved in fatal accidents: 1
Fatal accidents caused by drunken drivers: 0
Fatalities: 1
Persons involved in fatal accidents: 3
Pedestrians involved in fatal accidents: 0
Fatal accident statistics in 2012:
Fatal accident count: 1
Vehicles involved in fatal accidents: 1
Fatal accidents caused by drunken drivers: 1
Fatalities: 1
Persons involved in fatal accidents: 1
Pedestrians involved in fatal accidents: 0
Home Mortgage Disclosure Act Aggregated Statistics For Year 2009 (Based on 4 partial tracts)
A) FHA, FSA/RHS & VA Home Purchase Loans
B) Conventional Home Purchase Loans
C) Refinancings
D) Home Improvement Loans
F) Non-occupant Loans on < 5 Family Dwellings (A B C & D)
G) Loans On Manufactured Home Dwelling (A B C & D)
Number
Average Value
Number
Average Value
Number
Average Value
Number
Average Value
Number
Average Value
Number
Average Value
LOANS ORIGINATED
77
$196,565
46
$154,009
214
$178,884
15
$79,674
10
$84,031
16
$63,096
APPLICATIONS APPROVED, NOT ACCEPTED
3
$243,390
2
$164,785
9
$121,770
1
$160,760
0
$0
2
$43,765
APPLICATIONS DENIED
11
$187,579
10
$110,148
77
$168,207
9
$44,800
5
$103,706
12
$56,277
APPLICATIONS WITHDRAWN
7
$232,751
7
$108,411
42
$196,531
3
$53,343
4
$82,768
3
$28,153
FILES CLOSED FOR INCOMPLETENESS
2
$141,225
2
$241,920
13
$167,568
1
$169,770
0
$0
1
$49,580
Aggregated Statistics For Year 2008 (Based on 4 partial tracts)
A) FHA, FSA/RHS & VA Home Purchase Loans
B) Conventional Home Purchase Loans
C) Refinancings
D) Home Improvement Loans
F) Non-occupant Loans on < 5 Family Dwellings (A B C & D)
G) Loans On Manufactured Home Dwelling (A B C & D)
Number
Average Value
Number
Average Value
Number
Average Value
Number
Average Value
Number
Average Value
Number
Average Value
LOANS ORIGINATED
63
$181,071
40
$213,030
103
$159,433
12
$55,968
13
$154,991
33
$64,495
APPLICATIONS APPROVED, NOT ACCEPTED
4
$129,232
5
$88,938
17
$146,798
3
$19,957
2
$95,025
3
$79,627
APPLICATIONS DENIED
4
$206,768
10
$125,780
84
$139,732
36
$54,642
2
$57,645
17
$56,594
APPLICATIONS WITHDRAWN
2
$223,960
9
$157,472
38
$138,522
3
$23,537
2
$84,150
2
$76,245
FILES CLOSED FOR INCOMPLETENESS
2
$230,995
2
$91,645
9
$149,974
2
$57,200
2
$124,920
2
$54,460
Aggregated Statistics For Year 2007 (Based on 4 partial tracts)
A) FHA, FSA/RHS & VA Home Purchase Loans
B) Conventional Home Purchase Loans
C) Refinancings
D) Home Improvement Loans
F) Non-occupant Loans on < 5 Family Dwellings (A B C & D)
G) Loans On Manufactured Home Dwelling (A B C & D)
Number
Average Value
Number
Average Value
Number
Average Value
Number
Average Value
Number
Average Value
Number
Average Value
LOANS ORIGINATED
42
$182,703
73
$170,515
115
$131,747
22
$36,825
17
$127,537
32
$64,042
APPLICATIONS APPROVED, NOT ACCEPTED
2
$106,295
8
$110,426
27
$112,111
8
$38,286
2
$67,360
5
$54,684
APPLICATIONS DENIED
5
$179,688
18
$141,873
86
$121,394
22
$43,014
9
$99,470
21
$55,529
APPLICATIONS WITHDRAWN
4
$198,735
11
$138,265
44
$147,410
4
$71,880
6
$117,228
3
$42,067
FILES CLOSED FOR INCOMPLETENESS
2
$54,460
5
$244,646
12
$188,555
0
$0
1
$81,910
1
$87,030
Aggregated Statistics For Year 2006 (Based on 4 partial tracts)
A) FHA, FSA/RHS & VA Home Purchase Loans
B) Conventional Home Purchase Loans
C) Refinancings
D) Home Improvement Loans
F) Non-occupant Loans on < 5 Family Dwellings (A B C & D)
G) Loans On Manufactured Home Dwelling (A B C & D)
Number
Average Value
Number
Average Value
Number
Average Value
Number
Average Value
Number
Average Value
Number
Average Value
LOANS ORIGINATED
36
$165,043
109
$181,891
127
$116,533
33
$36,373
18
$88,856
27
$63,315
APPLICATIONS APPROVED, NOT ACCEPTED
5
$200,514
9
$139,854
29
$103,018
10
$31,833
2
$35,410
7
$57,984
APPLICATIONS DENIED
2
$52,960
43
$88,393
101
$104,034
33
$40,078
7
$39,159
29
$59,052
APPLICATIONS WITHDRAWN
4
$116,955
12
$127,889
47
$114,867
5
$45,888
1
$33,800
5
$55,858
FILES CLOSED FOR INCOMPLETENESS
0
$0
6
$105,418
20
$164,816
2
$63,100
2
$127,705
0
$0
Aggregated Statistics For Year 2005 (Based on 4 partial tracts)
A) FHA, FSA/RHS & VA Home Purchase Loans
B) Conventional Home Purchase Loans
C) Refinancings
D) Home Improvement Loans
F) Non-occupant Loans on < 5 Family Dwellings (A B C & D)
G) Loans On Manufactured Home Dwelling (A B C & D)
Number
Average Value
Number
Average Value
Number
Average Value
Number
Average Value
Number
Average Value
Number
Average Value
LOANS ORIGINATED
33
$141,481
112
$130,636
134
$105,022
23
$55,406
27
$68,050
32
$50,436
APPLICATIONS APPROVED, NOT ACCEPTED
3
$171,807
19
$119,583
36
$84,274
2
$16,440
3
$51,447
14
$58,137
APPLICATIONS DENIED
4
$118,855
51
$87,614
127
$97,691
27
$41,845
8
$78,125
45
$54,868
APPLICATIONS WITHDRAWN
1
$208,830
17
$127,741
38
$114,447
11
$52,859
1
$11,270
8
$58,555
FILES CLOSED FOR INCOMPLETENESS
1
$50,330
7
$156,250
27
$115,751
0
$0
2
$123,890
4
$62,778
Aggregated Statistics For Year 2004 (Based on 4 partial tracts)
A) FHA, FSA/RHS & VA Home Purchase Loans
B) Conventional Home Purchase Loans
C) Refinancings
D) Home Improvement Loans
F) Non-occupant Loans on < 5 Family Dwellings (A B C & D)
G) Loans On Manufactured Home Dwelling (A B C & D)
Number
Average Value
Number
Average Value
Number
Average Value
Number
Average Value
Number
Average Value
Number
Average Value
LOANS ORIGINATED
35
$140,137
87
$135,582
147
$100,134
15
$38,055
20
$54,616
29
$57,183
APPLICATIONS APPROVED, NOT ACCEPTED
2
$170,145
11
$87,444
26
$97,986
5
$21,034
4
$72,962
6
$49,653
APPLICATIONS DENIED
4
$82,068
32
$61,112
105
$98,600
17
$30,564
8
$67,750
39
$61,212
APPLICATIONS WITHDRAWN
2
$184,795
10
$150,361
58
$111,642
5
$29,264
3
$81,890
7
$55,464
FILES CLOSED FOR INCOMPLETENESS
1
$92,400
3
$101,520
16
$140,876
2
$39,675
1
$55,460
2
$71,740
Aggregated Statistics For Year 2003 (Based on 4 partial tracts)
A) FHA, FSA/RHS & VA Home Purchase Loans
B) Conventional Home Purchase Loans
C) Refinancings
D) Home Improvement Loans
F) Non-occupant Loans on < 5 Family Dwellings (A B C & D)
Number
Average Value
Number
Average Value
Number
Average Value
Number
Average Value
Number
Average Value
LOANS ORIGINATED
16
$129,081
68
$108,360
360
$110,519
11
$24,593
16
$68,741
APPLICATIONS APPROVED, NOT ACCEPTED
2
$95,165
15
$56,149
38
$111,929
4
$16,360
3
$43,570
APPLICATIONS DENIED
7
$56,637
69
$63,353
121
$96,100
10
$18,868
8
$79,624
APPLICATIONS WITHDRAWN
2
$119,510
12
$108,938
66
$97,596
2
$27,445
2
$76,935
FILES CLOSED FOR INCOMPLETENESS
0
$0
1
$128,460
15
$104,829
2
$90,145
1
$36,810
Aggregated Statistics For Year 2002 (Based on 4 partial tracts)
A) FHA, FSA/RHS & VA Home Purchase Loans
B) Conventional Home Purchase Loans
C) Refinancings
D) Home Improvement Loans
F) Non-occupant Loans on < 5 Family Dwellings (A B C & D)
Number
Average Value
Number
Average Value
Number
Average Value
Number
Average Value
Number
Average Value
LOANS ORIGINATED
30
$119,604
96
$117,303
238
$103,690
15
$15,884
12
$75,883
APPLICATIONS APPROVED, NOT ACCEPTED
2
$105,220
28
$66,522
43
$85,630
3
$18,933
1
$33,270
APPLICATIONS DENIED
7
$78,114
79
$44,041
83
$78,739
13
$19,719
2
$51,860
APPLICATIONS WITHDRAWN
4
$110,435
12
$131,686
60
$91,895
3
$23,897
2
$100,285
FILES CLOSED FOR INCOMPLETENESS
0
$0
2
$110,750
18
$123,382
0
$0
0
$0
Aggregated Statistics For Year 2001 (Based on 4 partial tracts)
A) FHA, FSA/RHS & VA Home Purchase Loans
B) Conventional Home Purchase Loans
C) Refinancings
D) Home Improvement Loans
F) Non-occupant Loans on < 5 Family Dwellings (A B C & D)
Number
Average Value
Number
Average Value
Number
Average Value
Number
Average Value
Number
Average Value
LOANS ORIGINATED
28
$95,857
103
$96,311
159
$95,486
15
$35,937
15
$54,442
APPLICATIONS APPROVED, NOT ACCEPTED
2
$108,355
34
$43,957
23
$93,127
2
$19,035
3
$43,230
APPLICATIONS DENIED
2
$48,100
70
$50,991
100
$69,145
14
$20,380
5
$36,618
APPLICATIONS WITHDRAWN
1
$57,840
12
$51,373
43
$86,198
5
$18,812
0
$0
FILES CLOSED FOR INCOMPLETENESS
0
$0
1
$120,190
17
$102,137
0
$0
0
$0
Aggregated Statistics For Year 2000 (Based on 4 partial tracts)
A) FHA, FSA/RHS & VA Home Purchase Loans
B) Conventional Home Purchase Loans
C) Refinancings
D) Home Improvement Loans
F) Non-occupant Loans on < 5 Family Dwellings (A B C & D)
Number
Average Value
Number
Average Value
Number
Average Value
Number
Average Value
Number
Average Value
LOANS ORIGINATED
34
$92,741
72
$86,189
80
$73,276
17
$32,640
13
$62,042
APPLICATIONS APPROVED, NOT ACCEPTED
6
$39,587
28
$43,155
19
$60,042
5
$19,192
1
$21,030
APPLICATIONS DENIED
10
$49,848
89
$51,449
75
$61,089
16
$25,386
4
$49,352
APPLICATIONS WITHDRAWN
3
$111,483
9
$80,331
36
$66,504
2
$18,780
1
$22,540
FILES CLOSED FOR INCOMPLETENESS
0
$0
2
$133,715
8
$81,515
0
$0
0
$0
Aggregated Statistics For Year 1999 (Based on 2 partial tracts)
A) FHA, FSA/RHS & VA Home Purchase Loans
B) Conventional Home Purchase Loans
C) Refinancings
D) Home Improvement Loans
F) Non-occupant Loans on < 5 Family Dwellings (A B C & D)
Detailed PMIC statistics for the following Tracts:0026.00
, 0027.00
2002 - 2018 National Fire Incident Reporting System (NFIRS) incidents
According to the data from the years 2002 - 2018 the average number of fires per year is 36. The highest number of reported fire incidents - 84 took place in 2011, and the least - 2 in 2003. The data has a growing trend.
When looking into fire subcategories, the most reports belonged to: Outside Fires (43.9%), and Structure Fires (34.7%).
Fire incident types reported to NFIRS in Zip Code 28395


 Nearest zip codes: 28342, 28356, 28344, 28391, 28311, 28301.


 According to the data from the years 2002 - 2018 the average number of fires per year is 36. The highest number of reported fire incidents - 84 took place in 2011, and the least - 2 in 2003. The data has a growing trend.
 When looking into fire subcategories, the most reports belonged to: Outside Fires (43.9%), and Structure Fires (34.7%).