Estimated zip code population in 2022: 1,376 Zip code population in 2010: 1,184 Zip code population in 2000: 1,084
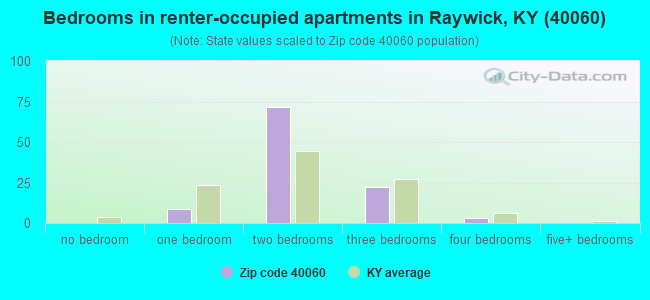
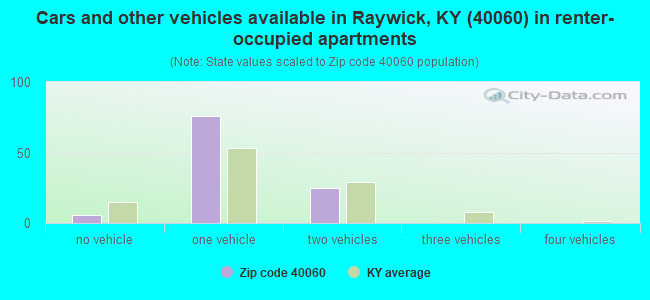
Houses and condos: 552 Renter-occupied apartments: 105
% of renters here:
20%
State:
31%
March 2022 cost of living index in zip code 40060: 81.2 (low, U.S. average is 100)
Land area: 43.9 sq. mi. Water area: 0.9 sq. mi.
Population density: 31 people per square mile
(very low).
OSM Map
General Map
Google Map
MSN Map
OSM Map
General Map
Google Map
MSN Map
OSM Map
General Map
Google Map
MSN Map
OSM Map
General Map
Google Map
MSN Map
Please wait while loading the map...
Real estate property taxes paid for housing units in 2022:
This zip code:
0.7% ($1,165)
Kentucky:
0.7% ($1,456)
Median real estate property taxes paid for housing units with mortgages in 2022: $1,290 (0.6%) Median real estate property taxes paid for housing units with no mortgage in 2022: $734 (0.5%)
Business Search- 14 Million verified businesses
Males: 700
(50.9%)
Females: 676
(49.1%)
For population 25 years and over in 40060:
High school or higher: 86.3%
Bachelor's degree or higher: 11.3%
Graduate or professional degree: 3.4%
Unemployed: 1.5%
Mean travel time to work (commute): 22.9 minutes
For population 15 years and over in 40060:
Never married: 20.6%
Now married: 55.4%
Separated: 0.6%
Widowed: 7.7%
Divorced: 15.6%
Zip code 40060 compared to state average:
Unemployed percentage below state average.
Black race population percentage significantly below state average.
Hispanic race population percentage significantly below state average.
Foreign-born population percentage significantly below state average.
Renting percentage below state average.
Length of stay since moving in above state average.
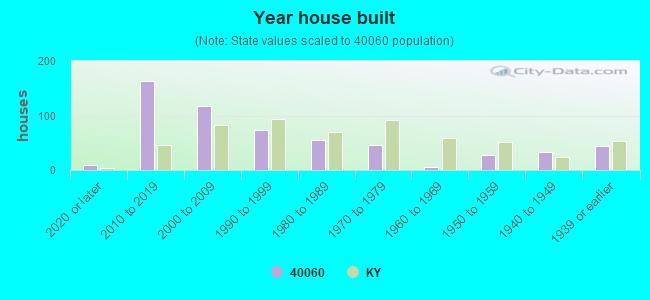
House age below state average.
Number of college students below state average.
Percentage of population with a bachelor's degree or higher significantly below state average.
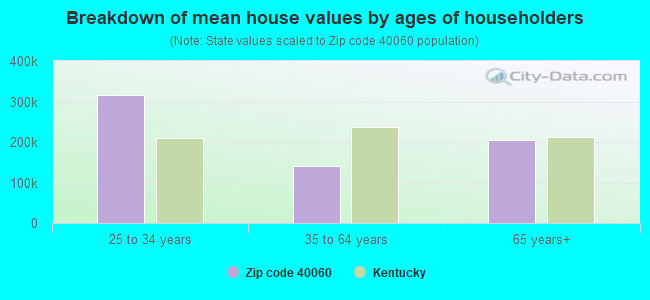
Estimated median house/condo value in 2022: $170,127
40060:
$170,127
Kentucky:
$196,300
According to our research of Kentucky and other state lists, there was 1 registered sex offender living in 40060 zip code as of April 30, 2024. The ratio of all residents to sex offenders in zip code 40060 is 1,038 to 1. The ratio of registered sex offenders to all residents in this zip code is lower than the state average.
Median resident age:
This zip code:
38.8 years
Kentucky median age:
39.4 years
Average household size:
This zip code:
2.6 people
Kentucky:
2.4 people
Averages for the 2020 tax year for zip code 40060, filed in 2021:
Average Adjusted Gross Income (AGI) in 2020: $54,380 (Individual Income Tax Returns)
Here:
$54,380
State:
$61,342
Salary/wage: $42,934 (reported on 83.7% of returns)
Here:
$42,934
State:
$50,827
(% of AGI for various income ranges: 1174.5% for AGIs below $25k, 3490.9% for AGIs $25k-50k, 6165.0% for AGIs $50k-75k, 8432.5% for AGIs $75k-100k, 13497.5% for AGIs $100k-200k)
Taxable interest for individuals: $391 (reported on 22.4% of returns)
This zip code:
$391
Kentucky:
$1,441
(% of AGI for various income ranges: 5.5% for AGIs below $25k, 23.6% for AGIs $25k-50k, 5.0% for AGIs $50k-75k, 20.0% for AGIs $100k-200k)
Ordinary dividends: $1,340 (reported on 10.2% of returns)
Here:
$1,340
State:
$7,388
(% of AGI for various income ranges: 43.6% for AGIs $25k-50k, 47.5% for AGIs $75k-100k)
Net capital gain/loss in AGI: +$7,540 (reported on 10.2% of returns)
Here:
+$7,540
State:
+$19,475
(% of AGI for various income ranges: 45.5% for AGIs $25k-50k, 817.5% for AGIs $75k-100k)
Profit/loss from business: +$4,883 (reported on 12.2% of returns)
Here:
+$4,883
State:
+$11,386
(% of AGI for various income ranges: 134.5% for AGIs below $25k, 362.5% for AGIs $75k-100k)
Taxable individual retirement arrangement distribution: $7,267 (reported on 6.1% of returns)
40060:
$7,267
Kentucky:
$18,941
(% of AGI for various income ranges: 198.2% for AGIs $25k-50k)
Earned income credit: $2,080 (reported on 20.4% of returns)
Here:
$2,080
State:
$2,336
(% of AGI for various income ranges: 108.2% for AGIs below $25k, 80.9% for AGIs $25k-50k)
Percentage of individuals using paid preparers for their 2020 taxes: 95.9%
Here:
96%
State:
94%
(% for various income ranges: 100.0% for AGIs below $25k, 92.9% for AGIs $25k-50k, 87.5% for AGIs $50k-75k, 100.0% for AGIs $75k-100k, 100.0% for AGIs $100k-200k)
Averages for the 2012 tax year for zip code 40060, filed in 2013:
Average Adjusted Gross Income (AGI) in 2012: $39,591 (Individual Income Tax Returns)
Here:
$39,591
State:
$50,814
Salary/wage: $35,655 (reported on 84.4% of returns)
Here:
$35,655
State:
$42,723
(% of AGI for various income ranges: 68.7% for AGIs below $25k, 82.3% for AGIs $25k-50k, 84.1% for AGIs $50k-75k, 89.4% for AGIs $75k-100k, 54.4% for AGIs $100k-200k)
Taxable interest for individuals: $692 (reported on 26.7% of returns)
This zip code:
$692
Kentucky:
$1,381
(% of AGI for various income ranges: 0.7% for AGIs below $25k, 0.5% for AGIs $25k-50k, 0.4% for AGIs $50k-75k, 0.7% for AGIs $100k-200k)
Ordinary dividends: $475 (reported on 8.9% of returns)
Here:
$475
State:
$6,239
Net capital gain/loss in AGI: +$1,550 (reported on 13.3% of returns)
Here:
+$1,550
State:
+$11,336
Profit/loss from business: +$5,750 (reported on 17.8% of returns)
Here:
+$5,750
State:
+$10,862
Total itemized deductions: $15,400 (18% of AGI, reported on 17.8% of returns)
Here:
$15,400
State:
$21,160
Here:
18.2% of AGI
State:
20.0% of AGI
Charity contributions: $1,533 (reported on 13.3% of returns)
Here:
$1,533
State:
$4,303
Taxes paid: $5,812 (reported on 17.8% of returns)
40060:
$5,812
State:
$8,496
Earned income credit: $2,042 (reported on 26.7% of returns)
Here:
$2,042
State:
$2,273
(% of AGI for various income ranges: 7.2% for AGIs below $25k, 1.3% for AGIs $25k-50k)
Percentage of individuals using paid preparers for their 2012 taxes: 75.6%
Here:
76%
State:
60%
(% for various income ranges: 73.7% for AGIs below $25k, 76.9% for AGIs $25k-50k, 83.3% for AGIs $50k-75k, 75.0% for AGIs $75k-100k, 66.7% for AGIs $100k-200k)
Averages for the 2004 tax year for zip code 40060, filed in 2005:
Average Adjusted Gross Income (AGI) in 2004: $32,885 (Individual Income Tax Returns)
Here:
$32,885
State:
$41,540
Salary/wage: $32,192 (reported on 84.1% of returns)
Here:
$32,192
State:
$36,432
(% of AGI for various income ranges: 94.0% for AGIs below $10k, 69.2% for AGIs $10k-25k, 87.3% for AGIs $25k-50k, 91.6% for AGIs $50k-75k, 90.6% for AGIs $75k-100k, 59.4% for AGIs over 100k)
Taxable interest for individuals: $774 (reported on 36.3% of returns)
This zip code:
$774
Kentucky:
$1,571
(% of AGI for various income ranges: 8.0% for AGIs below $10k, 2.2% for AGIs $10k-25k, 0.7% for AGIs $25k-50k, 0.3% for AGIs $50k-75k, 0.3% for AGIs $75k-100k)
Taxable dividends: $333 (reported on 8.4% of returns)
Here:
$333
State:
$3,453
Net capital gain/loss: +$3,828 (reported on 13.6% of returns)
Here:
+$3,828
State:
+$9,663
(% of AGI for various income ranges: 7.7% for AGIs below $10k, 1.9% for AGIs $10k-25k, 3.0% for AGIs $25k-50k, 0.5% for AGIs $50k-75k)
Profit/loss from business: +$4,187 (reported on 17.6% of returns)
Here:
+$4,187
State:
+$9,233
(% of AGI for various income ranges: 23.7% for AGIs below $10k, 10.0% for AGIs $10k-25k, 0.9% for AGIs $25k-50k, -0.6% for AGIs $50k-75k)
Total itemized deductions: $13,128 (22% of AGI, reported on 18.3% of returns)
Here:
$13,128
State:
$17,474
Here:
21.8% of AGI
State:
21.0% of AGI
(% of AGI for various income ranges: 6.0% for AGIs $10k-25k, 6.2% for AGIs $25k-50k, 7.4% for AGIs $50k-75k, 25.1% for AGIs $75k-100k)
Charity contributions deductions: $1,102 (2% of AGI, reported on 13.8% of returns)
Here:
$1,102
State:
$3,494
Here:
1.8% of AGI
State:
4.0% of AGI
Total tax: $3,508 (reported on 77.0% of returns)
40060:
$3,508
State:
$6,162
(% of AGI for various income ranges: 4.3% for AGIs below $10k, 4.8% for AGIs $10k-25k, 6.3% for AGIs $25k-50k, 7.9% for AGIs $50k-75k, 8.5% for AGIs $75k-100k, 18.1% for AGIs over 100k)
Earned income credit: $1,683 (reported on 19.2% of returns)
Here:
$1,683
State:
$1,723
Percentage of individuals using paid preparers for their 2004 taxes: 75.4%
Here:
75%
State:
66%
(% for various income ranges: 74.7% for AGIs below $10k, 72.3% for AGIs $10k-25k, 75.2% for AGIs $25k-50k, 78.7% for AGIs $50k-75k, 81.2% for AGIs $75k-100k, 91.7% for AGIs over 100k)
Household received Food Stamps/SNAP in the past 12 months: 95 Household did not receive Food Stamps/SNAP in the past 12 months: 441
Women who did not have a birth in the past 12 months: 229 (145 now married, 85 unmarried)
Housing units in zip code 40060 with a mortgage: 274 (1 second mortgage, 1 both second mortgage and home equity loan) Median monthly owner costs for units with a mortgage: $994 Median monthly owner costs for units without a mortgage: $361
Residents with income below the poverty level in 2022:
This zip code:
27.8%
Whole state:
16.5%
Residents with income below 50% of the poverty level in 2022:
This zip code:
8.6%
Whole state:
9.0%
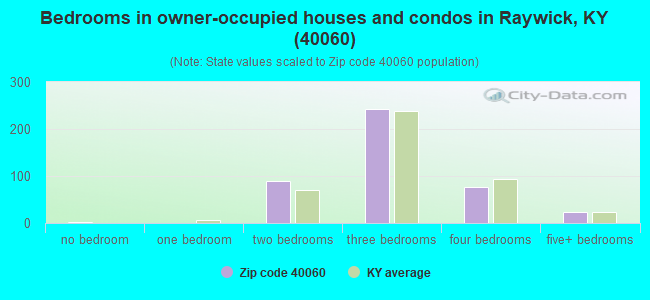
Median number of rooms in houses and condos:
Here:
5.5
State:
6.4
Median number of rooms in apartments:
Here:
5.0
State:
4.4
Notable locations in this zip code not listed on our city pages
Streams, rivers, and creeks: Dry Fork (A), Clear Creek (B), Cherry Run (C), Sullivans Prong (D), Slate Creek (E), Pound Run (F), Prather Creek (G). Display/hide their locations on the map
Size of family households: 161 2-persons, 84 3-persons, 87 4-persons, 11 6-persons, 15 7-or-more-persons
Size of nonfamily households: 170 1-person, 7 2-persons
309 married couples with children.
58 single-parent households (8 men, 50 women).
99.6% of residents of 40060 zip code speak English at home.
0.3% of residents speak Spanish at home (100% very well).
Foreign born population: 0 (0.0%)
:
0.0%
Whole state:
4.0%
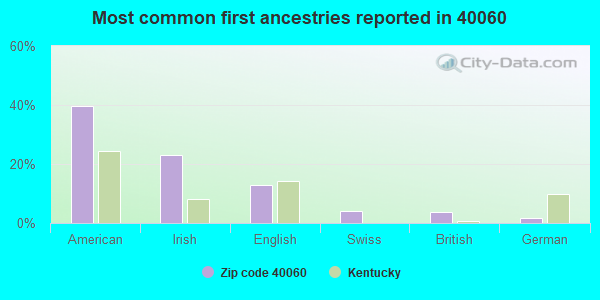
40%American
23%Irish
13%English
4%Swiss
4%British
2%German
Year of entry for the foreign-born population
02010 or later
02000 to 2009
01990 to 1999
6Before 1990
Facilities with environmental interests located in this zip code:
ALLEN CHEMICAL SITE (MILLEN HILL RD in RAYWICK, KY)
National Pollutant Discharge Elimination System NON-MAJOR (Tracking pollutant discharge elimination systems) - permit Business SIC classification: HEAVY CONSTRUCTION
ALLEN CHEMICAL DUMP (RURAL ROUTE 1 in RAYWICK, KY)
SUPERFUND (Superfund database)
Housing units lacking complete kitchen facilities: 4.0%
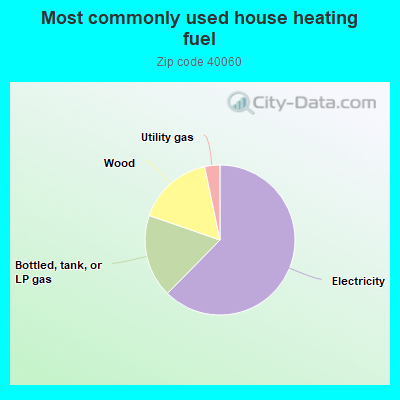
62.7%Electricity
18.0%Bottled, tank, or LP gas
16.5%Wood
3.3%Utility gas
Population in 1990: 981. Population change in the 1990s: +103 (+10.5%).
Place of birth for U.S.-born residents:
This state: 1,233
Northeast: 23
Midwest: 34
South: 60
West: 4
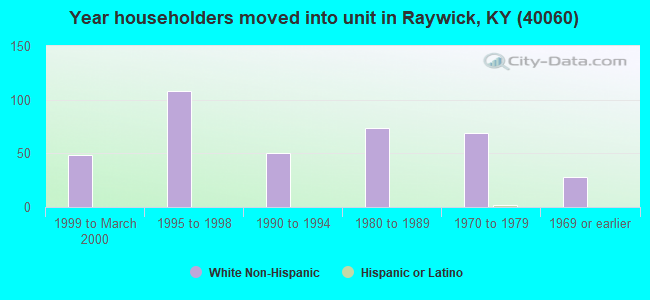
70% of the 40060 zip code residents lived in the same house 5 years ago. Out of people who lived in different houses, 64% lived in this county. Out of people who lived in different counties, 50% lived in Kentucky.
89% of the 40060 zip code residents lived in the same house 1 year ago. Out of people who lived in different houses, 69% moved from this county. Out of people who lived in different houses, 14% moved from different county within same state. Out of people who lived in different houses, 13% moved from different state.
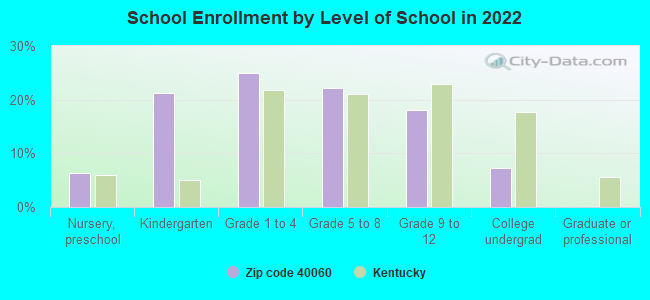
Private vs. public school enrollment:
Students in private schools in grades 1 to 8 (elementary and middle school): 9
Here:
6.6%
Kentucky:
17.2%
Students in private schools in grades 9 to 12 (high school):
Here:
0.0%
Kentucky:
15.2%
Students in private undergraduate colleges:
Here:
0.0%
Kentucky:
19.6%
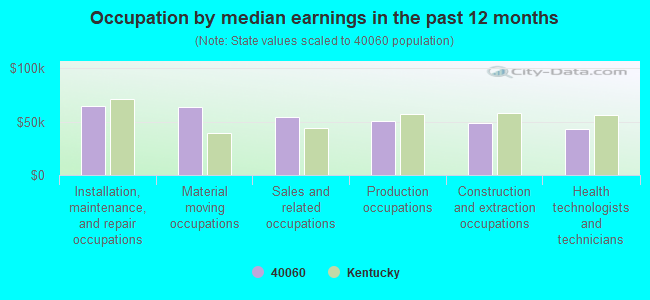
Occupation by median earnings in the past 12 months ($)
65,151Installation, maintenance, and repair occupations
64,108Material moving occupations
54,763Sales and related occupations
50,783Production occupations
48,474Construction and extraction occupations
42,829Health technologists and technicians
Top industries in this zip code by the number of employees in 2005:
Other Services (except Public Administration): Labor Unions and Similar Labor Organizations (10-19 employees: 1 establishment)
Accommodation and Food Services: Full-Service Restaurants (10-19: 1)
Other Services (except Public Administration): Religious Organizations (5-9: 1)
Real Estate and Rental and Leasing: Lessors of Nonresidential Buildings (except Miniwarehouses) (1-4: 1)
Construction: Electrical Contractors (1-4: 1)
Construction: Poured Concrete Foundation and Structure Contractors (1-4: 1)
Fatal accident statistics in 2012:
Fatal accident count: 1
Vehicles involved in fatal accidents: 2
Fatal accidents caused by drunken drivers: 0
Fatalities: 1
Persons involved in fatal accidents: 2
Pedestrians involved in fatal accidents: 0
Fatal accident statistics in 2010:
Fatal accident count: 1
Vehicles involved in fatal accidents: 1
Fatal accidents caused by drunken drivers: 1
Fatalities: 1
Persons involved in fatal accidents: 2
Pedestrians involved in fatal accidents: 0
Most common first names in zip code 40060 among deceased individuals
Name
Count
Lived (average)
Mary
23
77.0 years
Joseph
19
69.6 years
James
13
74.9 years
John
9
79.4 years
William
7
74.4 years
Robert
6
74.2 years
Walter
5
74.0 years
George
4
74.7 years
Dorothy
3
73.0 years
Edward
3
77.6 years
Most common last names in zip code 40060 among deceased individuals
Last name
Count
Lived (average)
Mattingly
11
73.4 years
Brady
8
78.0 years
Mills
7
77.7 years
Thompson
7
76.3 years
Reynolds
7
77.7 years
Shofner
6
79.9 years
Leake
6
80.7 years
Miles
6
75.8 years
Mccauley
6
78.2 years
Lamkin
6
71.7 years
Discuss Raywick, Kentucky (KY) on our hugely popular Kentucky forum.

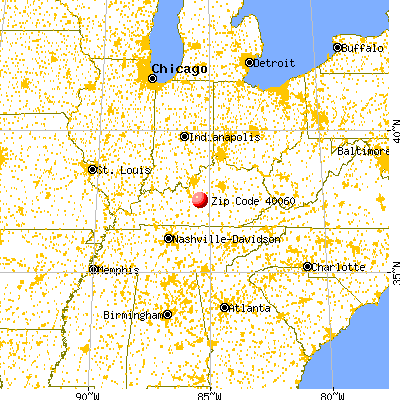


 Nearest zip codes: 40052, 40062, 40063, 40037, 40049, 42716.