Estimated zip code population in 2022: 1,174 Zip code population in 2010: 1,152 Zip code population in 2000: 608
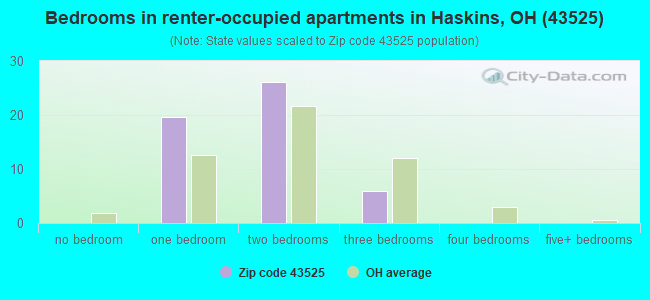
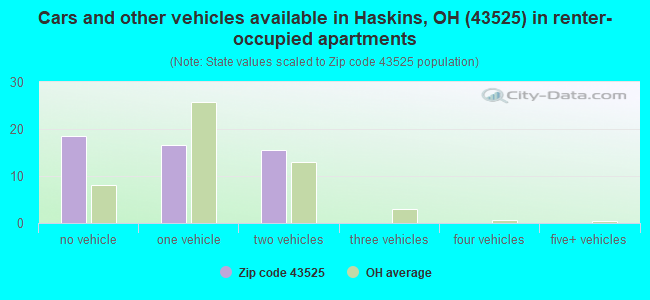
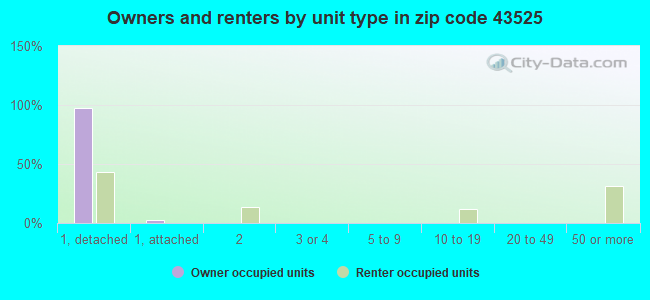
Houses and condos: 476 Renter-occupied apartments: 51
% of renters here:
11%
State:
33%
March 2022 cost of living index in zip code 43525: 83.6 (less than average, U.S. average is 100)
Land area: 1.1 sq. mi. Water area: 0.0 sq. mi.
Population density: 1,032 people per square mile
(low).
OSM Map
General Map
Google Map
MSN Map
OSM Map
General Map
Google Map
MSN Map
OSM Map
General Map
Google Map
MSN Map
OSM Map
General Map
Google Map
MSN Map
Please wait while loading the map...
Real estate property taxes paid for housing units in 2022:
This zip code:
1.2% ($3,104)
Ohio:
1.3% ($2,639)
Median real estate property taxes paid for housing units with mortgages in 2022: $3,312 (1.2%) Median real estate property taxes paid for housing units with no mortgage in 2022: $2,501 (1.2%)
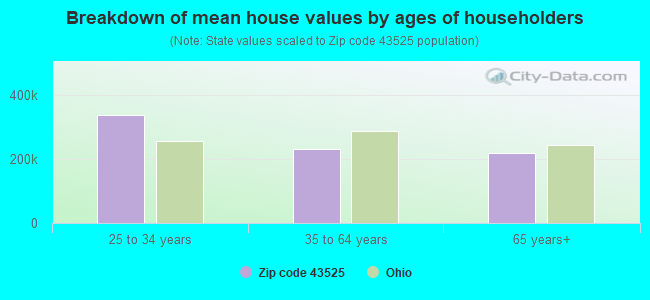
Estimated median house/condo value in 2022: $260,999
43525:
$260,999
Ohio:
$204,100
Median resident age:
This zip code:
37.2 years
Ohio median age:
39.9 years
Average household size:
This zip code:
2.6 people
Ohio:
2.4 people
Averages for the 2020 tax year for zip code 43525, filed in 2021:
Average Adjusted Gross Income (AGI) in 2020: $70,879 (Individual Income Tax Returns)
Here:
$70,879
State:
$67,288
Salary/wage: $65,324 (reported on 87.5% of returns)
Here:
$65,324
State:
$55,628
(% of AGI for various income ranges: 1083.3% for AGIs below $25k, 4067.1% for AGIs $25k-50k, 5981.2% for AGIs $50k-75k, 9590.0% for AGIs $75k-100k, 18543.3% for AGIs $100k-200k)
Taxable interest for individuals: $307 (reported on 25.0% of returns)
This zip code:
$307
Ohio:
$1,518
(% of AGI for various income ranges: 20.0% for AGIs below $25k, 6.2% for AGIs $50k-75k, 12.9% for AGIs $75k-100k, 12.2% for AGIs $100k-200k)
Ordinary dividends: $1,330 (reported on 17.9% of returns)
Here:
$1,330
State:
$7,167
(% of AGI for various income ranges: 82.9% for AGIs $25k-50k, 57.1% for AGIs $75k-100k, 38.9% for AGIs $100k-200k)
Net capital gain/loss in AGI: +$2,260 (reported on 17.9% of returns)
Here:
+$2,260
State:
+$18,919
(% of AGI for various income ranges: 105.7% for AGIs $25k-50k, 78.6% for AGIs $75k-100k, 107.8% for AGIs $100k-200k)
Profit/loss from business: +$9,050 (reported on 14.3% of returns)
Here:
+$9,050
State:
+$13,744
(% of AGI for various income ranges: 183.3% for AGIs below $25k, 83.8% for AGIs $50k-75k, 546.7% for AGIs $100k-200k)
Taxable individual retirement arrangement distribution: $12,480 (reported on 8.9% of returns)
43525:
$12,480
Ohio:
$18,876
(% of AGI for various income ranges: 304.4% for AGIs below $25k, 500.0% for AGIs $75k-100k)
Total itemized deductions: $26,450 (reported on 3.6% of returns)
Here:
$26,450
State:
$33,869
(% of AGI for various income ranges: 661.2% for AGIs $50k-75k)
Taxes paid: $8,800 (reported on 3.6% of returns)
43525:
$8,800
State:
$7,681
(% of AGI for various income ranges: 220.0% for AGIs $50k-75k)
Earned income credit: $1,500 (reported on 5.4% of returns)
Here:
$1,500
State:
$2,304
(% of AGI for various income ranges: 50.0% for AGIs below $25k)
Percentage of individuals using paid preparers for their 2020 taxes: 96.4%
Here:
96%
State:
94%
(% for various income ranges: 100.0% for AGIs below $25k, 100.0% for AGIs $25k-50k, 100.0% for AGIs $50k-75k, 90.0% for AGIs $75k-100k, 92.9% for AGIs $100k-200k)
Averages for the 2012 tax year for zip code 43525, filed in 2013:
Average Adjusted Gross Income (AGI) in 2012: $59,256 (Individual Income Tax Returns)
Here:
$59,256
State:
$54,926
Salary/wage: $56,226 (reported on 89.6% of returns)
Here:
$56,226
State:
$45,869
(% of AGI for various income ranges: 68.2% for AGIs below $25k, 87.5% for AGIs $25k-50k, 83.5% for AGIs $50k-75k, 90.8% for AGIs $75k-100k, 83.7% for AGIs $100k-200k)
Taxable interest for individuals: $220 (reported on 31.2% of returns)
This zip code:
$220
Ohio:
$1,297
(% of AGI for various income ranges: 0.3% for AGIs $25k-50k, 0.1% for AGIs $50k-75k, 0.1% for AGIs $75k-100k)
Ordinary dividends: $771 (reported on 14.6% of returns)
Here:
$771
State:
$5,821
(% of AGI for various income ranges: 0.3% for AGIs below $25k, 0.5% for AGIs $50k-75k, 0.2% for AGIs $100k-200k)
Profit/loss from business: +$3,920 (reported on 10.4% of returns)
Here:
+$3,920
State:
+$12,773
(% of AGI for various income ranges: 9.3% for AGIs below $25k, 1.1% for AGIs $50k-75k)
Taxable individual retirement arrangement distribution: $11,325 (reported on 8.3% of returns)
43525:
$11,325
Ohio:
$14,511
(% of AGI for various income ranges: 7.5% for AGIs $50k-75k)
Total itemized deductions: $18,248 (22% of AGI, reported on 47.9% of returns)
Here:
$18,248
State:
$21,278
Here:
21.5% of AGI
State:
18.8% of AGI
(% of AGI for various income ranges: 15.0% for AGIs $25k-50k, 15.1% for AGIs $50k-75k, 14.8% for AGIs $75k-100k, 16.5% for AGIs $100k-200k)
Charity contributions: $2,053 (reported on 35.4% of returns)
Here:
$2,053
State:
$3,943
(% of AGI for various income ranges: 0.8% for AGIs $25k-50k, 0.8% for AGIs $50k-75k, 1.3% for AGIs $75k-100k, 1.7% for AGIs $100k-200k)
Taxes paid: $7,674 (reported on 47.9% of returns)
43525:
$7,674
State:
$9,568
(% of AGI for various income ranges: 4.6% for AGIs $25k-50k, 5.0% for AGIs $50k-75k, 6.5% for AGIs $75k-100k, 8.2% for AGIs $100k-200k)
Earned income credit: $2,200 (reported on 8.3% of returns)
Here:
$2,200
State:
$2,285
(% of AGI for various income ranges: 6.2% for AGIs below $25k)
Percentage of individuals using paid preparers for their 2012 taxes: 54.2%
Here:
54%
State:
51%
(% for various income ranges: 50.0% for AGIs below $25k, 45.5% for AGIs $25k-50k, 60.0% for AGIs $50k-75k, 57.1% for AGIs $75k-100k, 62.5% for AGIs $100k-200k)
Averages for the 2004 tax year for zip code 43525, filed in 2005:
Average Adjusted Gross Income (AGI) in 2004: $46,526 (Individual Income Tax Returns)
Here:
$46,526
State:
$44,480
Salary/wage: $45,796 (reported on 91.9% of returns)
Here:
$45,796
State:
$39,198
(% of AGI for various income ranges: 86.1% for AGIs below $10k, 77.2% for AGIs $10k-25k, 86.2% for AGIs $25k-50k, 94.9% for AGIs $50k-75k, 92.8% for AGIs $75k-100k, 91.8% for AGIs over 100k)
Taxable interest for individuals: $428 (reported on 42.2% of returns)
This zip code:
$428
Ohio:
$1,532
(% of AGI for various income ranges: 3.2% for AGIs $10k-25k, 0.4% for AGIs $25k-50k, 0.2% for AGIs $50k-75k, 0.1% for AGIs $75k-100k, 0.1% for AGIs over 100k)
Taxable dividends: $367 (reported on 20.3% of returns)
Here:
$367
State:
$3,496
(% of AGI for various income ranges: 0.4% for AGIs $10k-25k, 0.2% for AGIs $25k-50k, 0.3% for AGIs $50k-75k, 0.1% for AGIs $75k-100k, 0.1% for AGIs over 100k)
Net capital gain/loss: +$130 (reported on 10.4% of returns)
Here:
+$130
State:
+$8,582
(% of AGI for various income ranges: 0.5% for AGIs $10k-25k, 0.2% for AGIs $50k-75k, -0.2% for AGIs $75k-100k)
Profit/loss from business: +$1,818 (reported on 7.4% of returns)
Here:
+$1,818
State:
+$10,813
Total itemized deductions: $14,662 (22% of AGI, reported on 50.8% of returns)
Here:
$14,662
State:
$17,503
Here:
22.0% of AGI
State:
20.8% of AGI
(% of AGI for various income ranges: 17.2% for AGIs $25k-50k, 17.4% for AGIs $50k-75k, 17.8% for AGIs $75k-100k, 16.7% for AGIs over 100k)
Charity contributions deductions: $1,643 (2% of AGI, reported on 41.8% of returns)
Here:
$1,643
State:
$3,087
Here:
2.3% of AGI
State:
3.4% of AGI
(% of AGI for various income ranges: 1.5% for AGIs $25k-50k, 1.8% for AGIs $50k-75k, 1.4% for AGIs $75k-100k, 1.7% for AGIs over 100k)
Total tax: $5,097 (reported on 81.5% of returns)
43525:
$5,097
State:
$6,781
(% of AGI for various income ranges: 0.9% for AGIs below $10k, 4.4% for AGIs $10k-25k, 7.1% for AGIs $25k-50k, 8.1% for AGIs $50k-75k, 9.9% for AGIs $75k-100k, 13.2% for AGIs over 100k)
Earned income credit: $1,206 (reported on 7.7% of returns)
Here:
$1,206
State:
$1,696
Percentage of individuals using paid preparers for their 2004 taxes: 43.3%
Here:
43%
State:
55%
(% for various income ranges: 23.1% for AGIs below $10k, 41.0% for AGIs $10k-25k, 48.9% for AGIs $25k-50k, 47.7% for AGIs $50k-75k, 48.1% for AGIs $75k-100k, 38.2% for AGIs over 100k)
Household received Food Stamps/SNAP in the past 12 months: 19 Household did not receive Food Stamps/SNAP in the past 12 months: 437
Women who had a birth in the past 12 months: 11 (12 now married, 0 unmarried) Women who did not have a birth in the past 12 months: 261 (162 now married, 98 unmarried)
Housing units in zip code 43525 with a mortgage: 302 (20 second mortgage, 18 both second mortgage and home equity loan) Houses without a mortgage: 21
Median monthly owner costs for units with a mortgage: $1,593 Median monthly owner costs for units without a mortgage: $559
Residents with income below the poverty level in 2022:
This zip code:
3.3%
Whole state:
13.4%
Residents with income below 50% of the poverty level in 2022:
This zip code:
2.4%
Whole state:
7.0%
Median number of rooms in houses and condos:
Here:
7.1
State:
6.7
Median number of rooms in apartments:
Here:
3.8
State:
4.4
Notable locations in this zip code not listed on our city pages
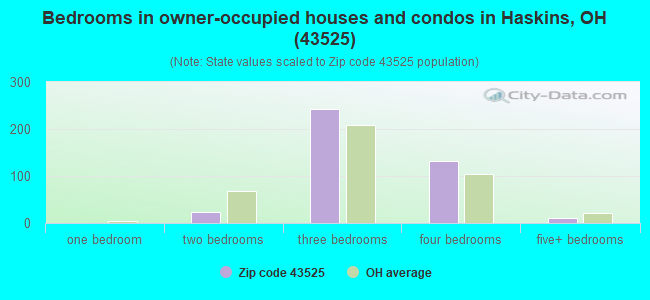
Size of family households: 141 2-persons, 80 3-persons, 87 4-persons, 24 5-persons, 14 6-persons
Size of nonfamily households: 93 1-person, 12 2-persons
273 married couples with children.
39 single-parent households (15 men, 24 women).
96.8% of residents of 43525 zip code speak English at home.
1.9% of residents speak Spanish at home (100% very well).
0.4% of residents speak other Indo-European language at home (100% very well).
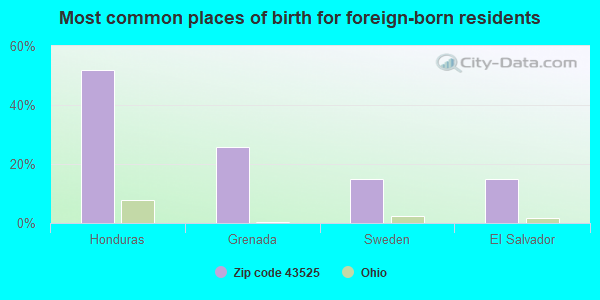
Foreign born population: 27 (2.4%) (81.8% of them are naturalized citizens)
This zip code:
2.4%
Whole state:
5.0%
52%Honduras
26%Grenada
15%Sweden
15%El Salvador
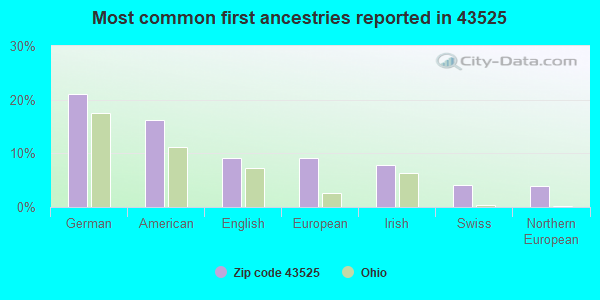
21%German
16%American
9%English
9%European
8%Irish
4%Swiss
4%Northern European
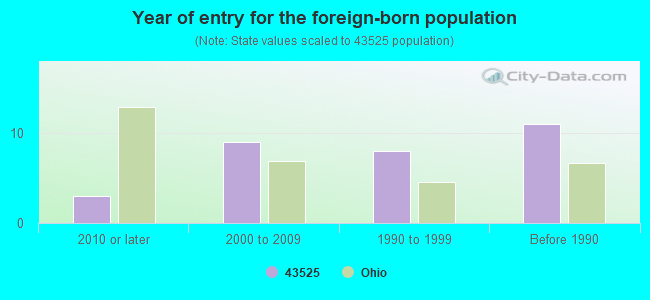
Year of entry for the foreign-born population
32010 or later
92000 to 2009
81990 to 1999
11Before 1990
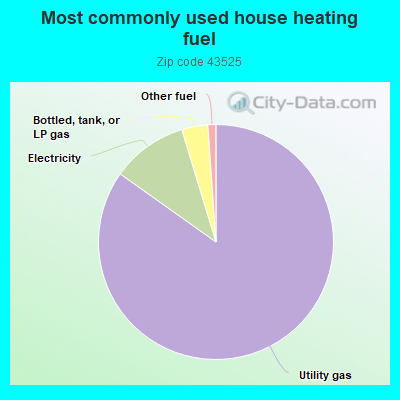
85.1%Utility gas
10.5%Electricity
3.6%Bottled, tank, or LP gas
1.1%Other fuel
Population in 1990: 549. Population change in the 1990s: +59 (+10.7%).
Place of birth for U.S.-born residents:
This state: 977
Northeast: 33
Midwest: 91
South: 20
West: 15
66% of the 43525 zip code residents lived in the same house 5 years ago. Out of people who lived in different houses, 54% lived in this county. Out of people who lived in different counties, 50% lived in Ohio.
97% of the 43525 zip code residents lived in the same house 1 year ago. Out of people who lived in different houses, 40% moved from this county. Out of people who lived in different houses, 60% moved from different county within same state. Out of people who lived in different houses, 12% moved from different state.
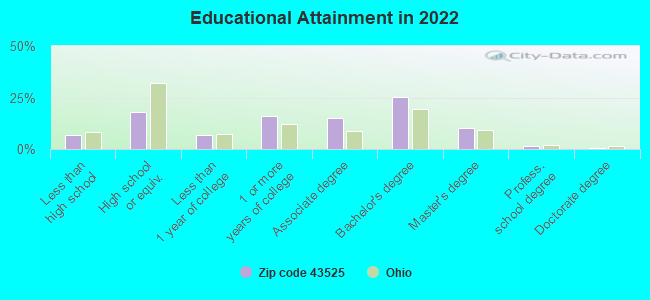
Private vs. public school enrollment:
Students in private schools in grades 1 to 8 (elementary and middle school): 14
Here:
11.9%
Ohio:
16.0%
Students in private schools in grades 9 to 12 (high school): 3
Here:
3.7%
Ohio:
13.1%
Students in private undergraduate colleges:
Here:
0.0%
Ohio:
22.3%
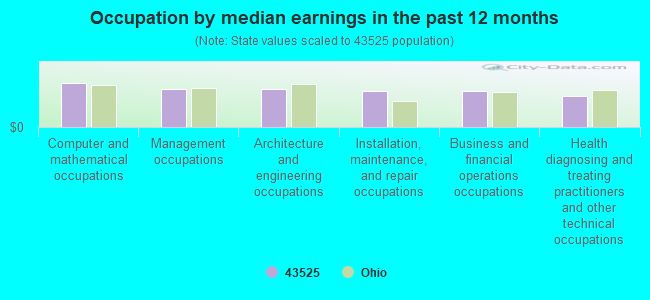
Occupation by median earnings in the past 12 months ($)
103,314Computer and mathematical occupations
89,151Management occupations
88,672Architecture and engineering occupations
85,017Installation, maintenance, and repair occupations
83,607Business and financial operations occupations
71,695Health diagnosing and treating practitioners and other technical occupations
Top industries in this zip code by the number of employees in 2005:
Construction: Plumbing, Heating, and Air-Conditioning Contractors (10-19 employees: 1 establishment)
Accommodation and Food Services: Drinking Places (Alcoholic Beverages) (5-9: 1)
Real Estate and Rental and Leasing: Lessors of Nonresidential Buildings (except Miniwarehouses) (5-9: 1)
Wholesale Trade: Grain and Field Bean Merchant Wholesalers (1-4: 1)
Other Services (except Public Administration): Religious Organizations (1-4: 1)
Other Services (except Public Administration): Automotive Body, Paint, and Interior Repair and Maintenance (1-4: 1)
Accommodation and Food Services: Snack and Nonalcoholic Beverage Bars (1-4: 1)
Professional, Scientific, and Technical Services: Engineering Services (1-4: 1)
Home Mortgage Disclosure Act Aggregated Statistics For Year 2009 (Based on 2 partial tracts)
A) FHA, FSA/RHS & VA Home Purchase Loans
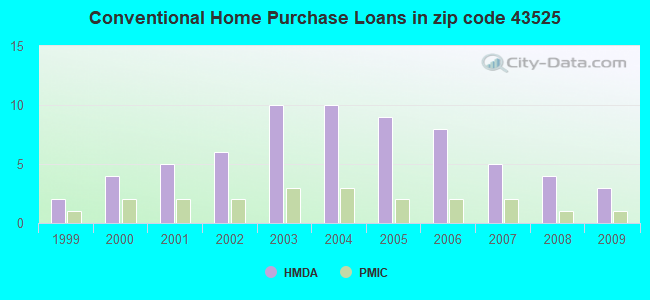
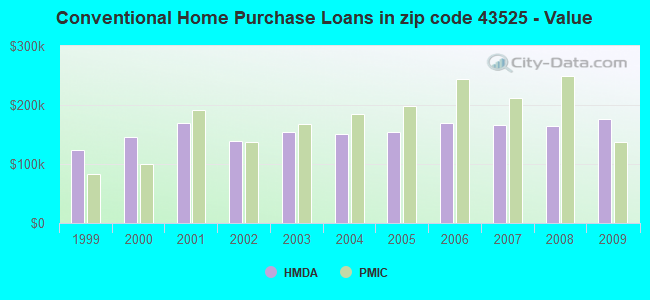
B) Conventional Home Purchase Loans
C) Refinancings
Number
Average Value
Number
Average Value
Number
Average Value
LOANS ORIGINATED
2
$188,270
3
$176,790
11
$181,477
APPLICATIONS APPROVED, NOT ACCEPTED
0
$0
1
$85,980
0
$0
APPLICATIONS DENIED
0
$0
0
$0
5
$176,650
APPLICATIONS WITHDRAWN
0
$0
0
$0
2
$181,125
FILES CLOSED FOR INCOMPLETENESS
0
$0
0
$0
1
$158,000
Aggregated Statistics For Year 2008 (Based on 2 partial tracts)
A) FHA, FSA/RHS & VA Home Purchase Loans
B) Conventional Home Purchase Loans
C) Refinancings
F) Non-occupant Loans on < 5 Family Dwellings (A B C & D)
Number
Average Value
Number
Average Value
Number
Average Value
Number
Average Value
LOANS ORIGINATED
1
$171,680
4
$164,570
5
$173,476
1
$135,640
APPLICATIONS APPROVED, NOT ACCEPTED
0
$0
0
$0
1
$184,200
0
$0
APPLICATIONS DENIED
0
$0
1
$102,260
3
$207,297
0
$0
APPLICATIONS WITHDRAWN
0
$0
0
$0
1
$279,760
0
$0
FILES CLOSED FOR INCOMPLETENESS
0
$0
0
$0
0
$0
0
$0
Aggregated Statistics For Year 2007 (Based on 2 partial tracts)
B) Conventional Home Purchase Loans
C) Refinancings
D) Home Improvement Loans
F) Non-occupant Loans on < 5 Family Dwellings (A B C & D)
Number
Average Value
Number
Average Value
Number
Average Value
Number
Average Value
LOANS ORIGINATED
5
$166,116
6
$125,947
1
$85,430
1
$112,450
APPLICATIONS APPROVED, NOT ACCEPTED
0
$0
1
$206,770
0
$0
0
$0
APPLICATIONS DENIED
0
$0
3
$174,123
1
$23,940
0
$0
APPLICATIONS WITHDRAWN
0
$0
2
$151,370
0
$0
0
$0
FILES CLOSED FOR INCOMPLETENESS
0
$0
1
$128,390
0
$0
0
$0
Aggregated Statistics For Year 2006 (Based on 2 partial tracts)
B) Conventional Home Purchase Loans
C) Refinancings
D) Home Improvement Loans
F) Non-occupant Loans on < 5 Family Dwellings (A B C & D)
Number
Average Value
Number
Average Value
Number
Average Value
Number
Average Value
LOANS ORIGINATED
8
$168,726
7
$159,236
2
$22,160
1
$84,880
APPLICATIONS APPROVED, NOT ACCEPTED
1
$61,150
1
$230,100
0
$0
0
$0
APPLICATIONS DENIED
1
$159,650
3
$165,527
1
$34,820
0
$0
APPLICATIONS WITHDRAWN
1
$89,060
2
$206,535
0
$0
0
$0
FILES CLOSED FOR INCOMPLETENESS
0
$0
1
$173,460
0
$0
0
$0
Aggregated Statistics For Year 2005 (Based on 2 partial tracts)
B) Conventional Home Purchase Loans
C) Refinancings
D) Home Improvement Loans
Number
Average Value
Number
Average Value
Number
Average Value
LOANS ORIGINATED
9
$154,690
10
$152,587
1
$60,600
APPLICATIONS APPROVED, NOT ACCEPTED
1
$124,210
2
$112,755
1
$17,650
APPLICATIONS DENIED
1
$147,130
3
$162,063
1
$78,450
APPLICATIONS WITHDRAWN
1
$158,690
3
$145,123
0
$0
FILES CLOSED FOR INCOMPLETENESS
0
$0
0
$0
0
$0
Aggregated Statistics For Year 2004 (Based on 2 partial tracts)
B) Conventional Home Purchase Loans
C) Refinancings
D) Home Improvement Loans
Number
Average Value
Number
Average Value
Number
Average Value
LOANS ORIGINATED
10
$150,630
9
$164,267
1
$42,070
APPLICATIONS APPROVED, NOT ACCEPTED
0
$0
1
$143,430
0
$0
APPLICATIONS DENIED
1
$123,190
3
$164,890
1
$58,690
APPLICATIONS WITHDRAWN
1
$83,110
3
$126,450
0
$0
FILES CLOSED FOR INCOMPLETENESS
0
$0
1
$173,190
0
$0
Aggregated Statistics For Year 2003 (Based on 2 partial tracts)
B) Conventional Home Purchase Loans
C) Refinancings
D) Home Improvement Loans
F) Non-occupant Loans on < 5 Family Dwellings (A B C & D)
Number
Average Value
Number
Average Value
Number
Average Value
Number
Average Value
LOANS ORIGINATED
10
$154,905
19
$146,524
1
$9,230
1
$76,060
APPLICATIONS APPROVED, NOT ACCEPTED
1
$82,900
2
$156,775
0
$0
0
$0
APPLICATIONS DENIED
1
$115,870
3
$177,087
1
$17,100
0
$0
APPLICATIONS WITHDRAWN
1
$85,640
2
$206,875
0
$0
0
$0
FILES CLOSED FOR INCOMPLETENESS
0
$0
1
$177,630
0
$0
0
$0
Aggregated Statistics For Year 2002 (Based on 2 partial tracts)
B) Conventional Home Purchase Loans
C) Refinancings
F) Non-occupant Loans on < 5 Family Dwellings (A B C & D)
Number
Average Value
Number
Average Value
Number
Average Value
LOANS ORIGINATED
6
$139,537
14
$145,037
1
$163,270
APPLICATIONS APPROVED, NOT ACCEPTED
0
$0
2
$89,465
0
$0
APPLICATIONS DENIED
1
$103,490
3
$119,427
0
$0
APPLICATIONS WITHDRAWN
1
$124,280
1
$157,730
0
$0
FILES CLOSED FOR INCOMPLETENESS
0
$0
1
$71,340
0
$0
Aggregated Statistics For Year 2001 (Based on 2 partial tracts)
B) Conventional Home Purchase Loans
C) Refinancings
D) Home Improvement Loans
F) Non-occupant Loans on < 5 Family Dwellings (A B C & D)
Number
Average Value
Number
Average Value
Number
Average Value
Number
Average Value
LOANS ORIGINATED
5
$169,920
12
$129,942
1
$32,280
1
$122,300
APPLICATIONS APPROVED, NOT ACCEPTED
0
$0
1
$184,890
0
$0
0
$0
APPLICATIONS DENIED
1
$61,290
2
$152,190
0
$0
0
$0
APPLICATIONS WITHDRAWN
0
$0
1
$150,000
0
$0
0
$0
FILES CLOSED FOR INCOMPLETENESS
0
$0
0
$0
0
$0
0
$0
Aggregated Statistics For Year 2000 (Based on 2 partial tracts)
B) Conventional Home Purchase Loans
C) Refinancings
D) Home Improvement Loans
Number
Average Value
Number
Average Value
Number
Average Value
LOANS ORIGINATED
4
$145,862
3
$109,077
1
$13,820
APPLICATIONS APPROVED, NOT ACCEPTED
0
$0
1
$95,620
0
$0
APPLICATIONS DENIED
1
$40,360
1
$100,550
0
$0
APPLICATIONS WITHDRAWN
0
$0
1
$59,990
0
$0
FILES CLOSED FOR INCOMPLETENESS
0
$0
0
$0
0
$0
Aggregated Statistics For Year 1999 (Based on 1 partial tract)

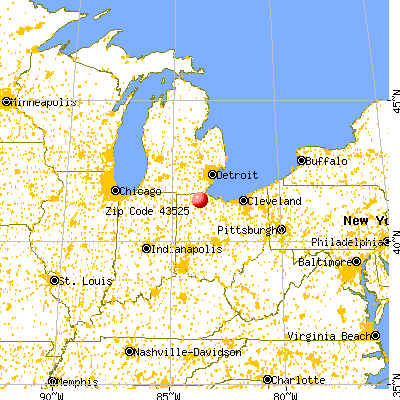


 Nearest zip codes: 43566, 43565, 43402, 43537, 43403, 43542.