Estimated zip code population in 2022: 2,324 Zip code population in 2010: 2,456 Zip code population in 2000: 2,448
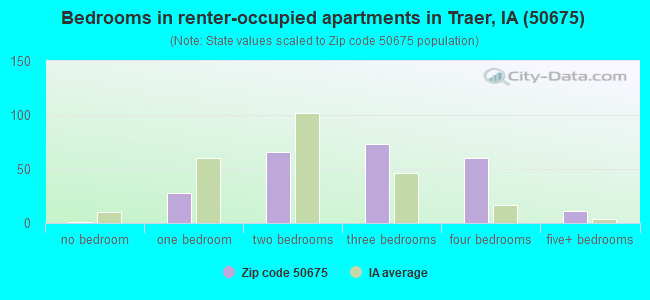
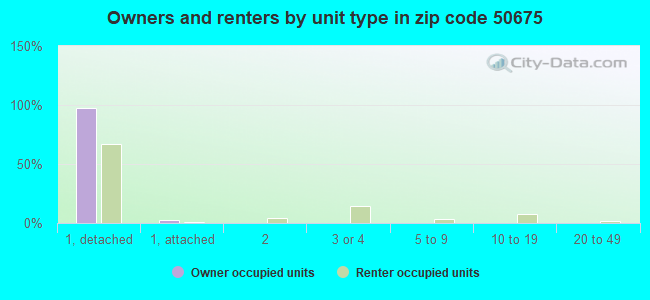
Houses and condos: 1,033 Renter-occupied apartments: 239
% of renters here:
25%
State:
28%
March 2022 cost of living index in zip code 50675: 82.7 (low, U.S. average is 100)
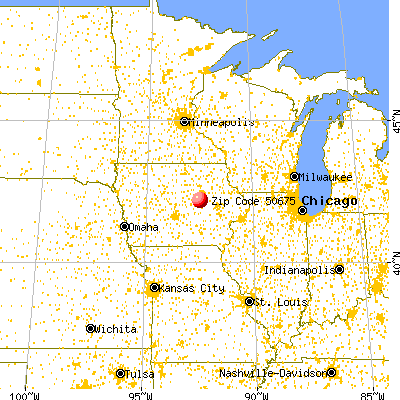
Land area: 110.8 sq. mi. Water area: 0.1 sq. mi.
Population density: 21 people per square mile
(very low).
OSM Map
General Map
Google Map
MSN Map
OSM Map
General Map
Google Map
MSN Map
OSM Map
General Map
Google Map
MSN Map
OSM Map
General Map
Google Map
MSN Map
Please wait while loading the map...
Real estate property taxes paid for housing units in 2022:
This zip code:
1.4% ($2,004)
Iowa:
1.4% ($2,724)
Median real estate property taxes paid for housing units with mortgages in 2022: $2,032 (1.3%) Median real estate property taxes paid for housing units with no mortgage in 2022: $1,977 (1.6%)
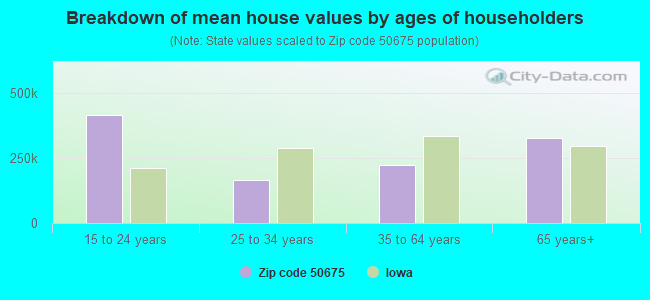
Estimated median house/condo value in 2022: $145,521
50675:
$145,521
Iowa:
$194,600
According to our research of Iowa and other state lists, there were 3 registered sex offenders living in 50675 zip code as of May 23, 2024. The ratio of all residents to sex offenders in zip code 50675 is 805 to 1. The ratio of registered sex offenders to all residents in this zip code is lower than the state average.
Median resident age:
This zip code:
43.9 years
Iowa median age:
38.9 years
Average household size:
This zip code:
2.4 people
Iowa:
2.3 people
Averages for the 2020 tax year for zip code 50675, filed in 2021:
Average Adjusted Gross Income (AGI) in 2020: $61,816 (Individual Income Tax Returns)
Here:
$61,816
State:
$71,087
Salary/wage: $50,266 (reported on 79.1% of returns)
Here:
$50,266
State:
$57,361
(% of AGI for various income ranges: 1317.2% for AGIs below $25k, 3742.5% for AGIs $25k-50k, 6252.3% for AGIs $50k-75k, 10581.2% for AGIs $75k-100k, 19202.2% for AGIs $100k-200k)
Taxable interest for individuals: $2,102 (reported on 42.7% of returns)
This zip code:
$2,102
Iowa:
$1,633
(% of AGI for various income ranges: 47.2% for AGIs below $25k, 76.0% for AGIs $25k-50k, 115.4% for AGIs $50k-75k, 87.5% for AGIs $75k-100k, 501.1% for AGIs $100k-200k)
Ordinary dividends: $3,800 (reported on 23.6% of returns)
Here:
$3,800
State:
$5,432
(% of AGI for various income ranges: 21.1% for AGIs below $25k, 70.0% for AGIs $25k-50k, 147.7% for AGIs $50k-75k, 113.8% for AGIs $75k-100k, 585.6% for AGIs $100k-200k)
Net capital gain/loss in AGI: +$10,167 (reported on 19.1% of returns)
Here:
+$10,167
State:
+$15,243
(% of AGI for various income ranges: 17.2% for AGIs below $25k, 43.0% for AGIs $25k-50k, 52.3% for AGIs $50k-75k, 176.2% for AGIs $75k-100k, 2010.0% for AGIs $100k-200k)
Profit/loss from business: +$8,213 (reported on 13.6% of returns)
Here:
+$8,213
State:
+$11,763
(% of AGI for various income ranges: 44.4% for AGIs below $25k, 136.0% for AGIs $25k-50k, 178.8% for AGIs $75k-100k, 818.9% for AGIs $100k-200k)
Taxable individual retirement arrangement distribution: $9,512 (reported on 15.5% of returns)
50675:
$9,512
Iowa:
$17,324
(% of AGI for various income ranges: 126.7% for AGIs below $25k, 99.0% for AGIs $25k-50k, 470.0% for AGIs $50k-75k, 644.4% for AGIs $100k-200k)
Total itemized deductions: $34,250 (reported on 5.5% of returns)
Here:
$34,250
State:
$33,775
(% of AGI for various income ranges: 500.0% for AGIs $25k-50k, 1318.8% for AGIs $75k-100k)
Charity contributions: $6,500 (reported on 2.7% of returns)
Here:
$6,500
State:
$13,075
(% of AGI for various income ranges: 150.0% for AGIs $50k-75k)
Taxes paid: $6,475 (reported on 3.6% of returns)
50675:
$6,475
State:
$7,704
(% of AGI for various income ranges: 35.0% for AGIs below $25k, 245.0% for AGIs $75k-100k)
Earned income credit: $2,069 (reported on 11.8% of returns)
Here:
$2,069
State:
$2,195
(% of AGI for various income ranges: 84.4% for AGIs below $25k, 58.5% for AGIs $25k-50k)
Percentage of individuals using paid preparers for their 2020 taxes: 95.5%
Here:
95%
State:
95%
(% for various income ranges: 90.0% for AGIs below $25k, 100.0% for AGIs $25k-50k, 94.7% for AGIs $50k-75k, 100.0% for AGIs $75k-100k, 94.4% for AGIs $100k-200k, 100.0% for AGIs over 200k)
Averages for the 2012 tax year for zip code 50675, filed in 2013:
Average Adjusted Gross Income (AGI) in 2012: $55,333 (Individual Income Tax Returns)
Here:
$55,333
State:
$58,860
Salary/wage: $43,385 (reported on 77.3% of returns)
Here:
$43,385
State:
$46,659
(% of AGI for various income ranges: 59.8% for AGIs below $25k, 65.8% for AGIs $25k-50k, 71.6% for AGIs $50k-75k, 71.6% for AGIs $75k-100k, 66.6% for AGIs $100k-200k)
Taxable interest for individuals: $1,991 (reported on 51.8% of returns)
This zip code:
$1,991
Iowa:
$1,537
(% of AGI for various income ranges: 4.1% for AGIs below $25k, 2.4% for AGIs $25k-50k, 0.8% for AGIs $50k-75k, 1.3% for AGIs $75k-100k, 2.4% for AGIs $100k-200k, 1.4% for AGIs over 200k)
Ordinary dividends: $5,593 (reported on 27.3% of returns)
Here:
$5,593
State:
$4,542
(% of AGI for various income ranges: 1.8% for AGIs below $25k, 2.1% for AGIs $25k-50k, 1.0% for AGIs $50k-75k, 1.2% for AGIs $75k-100k, 7.1% for AGIs $100k-200k)
Net capital gain/loss in AGI: +$2,678 (reported on 20.9% of returns)
Here:
+$2,678
State:
+$11,802
(% of AGI for various income ranges: 0.3% for AGIs below $25k, 0.2% for AGIs $25k-50k, 0.6% for AGIs $50k-75k, 3.1% for AGIs $100k-200k)
Profit/loss from business: +$6,447 (reported on 17.3% of returns)
Here:
+$6,447
State:
+$10,509
(% of AGI for various income ranges: 4.1% for AGIs below $25k, 3.4% for AGIs $25k-50k, 1.2% for AGIs $50k-75k, 1.8% for AGIs $75k-100k, 2.3% for AGIs $100k-200k)
Taxable individual retirement arrangement distribution: $7,694 (reported on 16.4% of returns)
50675:
$7,694
Iowa:
$11,773
(% of AGI for various income ranges: 4.0% for AGIs below $25k, 2.3% for AGIs $25k-50k, 1.9% for AGIs $50k-75k, 2.8% for AGIs $75k-100k, 2.6% for AGIs $100k-200k)
Total itemized deductions: $18,352 (21% of AGI, reported on 30.0% of returns)
Here:
$18,352
State:
$21,278
Here:
20.8% of AGI
State:
18.9% of AGI
(% of AGI for various income ranges: 15.2% for AGIs below $25k, 10.7% for AGIs $25k-50k, 10.0% for AGIs $50k-75k, 8.1% for AGIs $75k-100k, 9.9% for AGIs $100k-200k, 8.4% for AGIs over 200k)
Charity contributions: $3,165 (reported on 23.6% of returns)
Here:
$3,165
State:
$4,044
(% of AGI for various income ranges: 0.6% for AGIs below $25k, 0.5% for AGIs $25k-50k, 1.1% for AGIs $50k-75k, 1.1% for AGIs $75k-100k, 3.0% for AGIs $100k-200k)
Taxes paid: $6,515 (reported on 30.0% of returns)
50675:
$6,515
State:
$8,846
(% of AGI for various income ranges: 1.9% for AGIs below $25k, 2.1% for AGIs $25k-50k, 2.9% for AGIs $50k-75k, 3.7% for AGIs $75k-100k, 4.4% for AGIs $100k-200k, 5.3% for AGIs over 200k)
Earned income credit: $1,880 (reported on 13.6% of returns)
Here:
$1,880
State:
$2,098
(% of AGI for various income ranges: 4.0% for AGIs below $25k, 1.0% for AGIs $25k-50k)
Percentage of individuals using paid preparers for their 2012 taxes: 77.3%
Here:
77%
State:
65%
(% for various income ranges: 70.3% for AGIs below $25k, 76.0% for AGIs $25k-50k, 81.0% for AGIs $50k-75k, 76.9% for AGIs $75k-100k, 91.7% for AGIs $100k-200k, 100.0% for AGIs over 200k)
Averages for the 2004 tax year for zip code 50675, filed in 2005:
Average Adjusted Gross Income (AGI) in 2004: $37,924 (Individual Income Tax Returns)
Here:
$37,924
State:
$43,875
Salary/wage: $34,294 (reported on 78.0% of returns)
Here:
$34,294
State:
$38,265
(% of AGI for various income ranges: 58.5% for AGIs $10k-25k, 71.7% for AGIs $25k-50k, 75.8% for AGIs $50k-75k, 73.7% for AGIs $75k-100k, 49.9% for AGIs over 100k)
Taxable interest for individuals: $2,105 (reported on 62.4% of returns)
This zip code:
$2,105
Iowa:
$1,768
(% of AGI for various income ranges: 7.1% for AGIs $10k-25k, 2.9% for AGIs $25k-50k, 1.8% for AGIs $50k-75k, 3.8% for AGIs $75k-100k, 3.4% for AGIs over 100k)
Taxable dividends: $2,285 (reported on 32.0% of returns)
Here:
$2,285
State:
$2,510
(% of AGI for various income ranges: 1.9% for AGIs $10k-25k, 1.3% for AGIs $25k-50k, 0.9% for AGIs $50k-75k, 3.7% for AGIs $75k-100k, 2.7% for AGIs over 100k)
Net capital gain/loss: +$3,030 (reported on 21.6% of returns)
Here:
+$3,030
State:
+$6,139
(% of AGI for various income ranges: 1.1% for AGIs $10k-25k, 0.9% for AGIs $25k-50k, 1.2% for AGIs $50k-75k, 2.0% for AGIs $75k-100k, 4.5% for AGIs over 100k)
Profit/loss from business: +$8,337 (reported on 17.3% of returns)
Here:
+$8,337
State:
+$8,574
(% of AGI for various income ranges: 3.1% for AGIs $10k-25k, 1.7% for AGIs $25k-50k, 5.0% for AGIs $50k-75k, 1.5% for AGIs $75k-100k, 7.2% for AGIs over 100k)
Profit/loss from farming: +$471 (reported on 10.8% of returns)
Here:
+$471
State:
-$74
(% of AGI for various income ranges: -0.5% for AGIs $10k-25k, 2.3% for AGIs $25k-50k, -0.9% for AGIs $50k-75k, 0.2% for AGIs $75k-100k)
IRA payment deduction: $3,020 (reported on 4.5% of returns)
50675:
$3,020
Iowa:
$2,970
Total itemized deductions: $15,232 (26% of AGI, reported on 25.5% of returns)
Here:
$15,232
State:
$16,976
Here:
25.7% of AGI
State:
20.8% of AGI
(% of AGI for various income ranges: 17.5% for AGIs $10k-25k, 9.9% for AGIs $25k-50k, 8.0% for AGIs $50k-75k, 9.9% for AGIs $75k-100k, 9.9% for AGIs over 100k)
Charity contributions deductions: $2,234 (4% of AGI, reported on 21.1% of returns)
Here:
$2,234
State:
$3,089
Here:
3.6% of AGI
State:
3.6% of AGI
(% of AGI for various income ranges: 0.9% for AGIs $10k-25k, 1.2% for AGIs $25k-50k, 0.9% for AGIs $50k-75k, 1.1% for AGIs $75k-100k, 2.2% for AGIs over 100k)
Total tax: $4,457 (reported on 80.0% of returns)
50675:
$4,457
State:
$6,177
(% of AGI for various income ranges: 4.0% for AGIs $10k-25k, 6.6% for AGIs $25k-50k, 8.9% for AGIs $50k-75k, 11.0% for AGIs $75k-100k, 16.7% for AGIs over 100k)
Earned income credit: $1,537 (reported on 11.0% of returns)
Here:
$1,537
State:
$1,540
Percentage of individuals using paid preparers for their 2004 taxes: 78.9%
Here:
79%
State:
70%
(% for various income ranges: 71.0% for AGIs below $10k, 82.3% for AGIs $10k-25k, 77.3% for AGIs $25k-50k, 83.2% for AGIs $50k-75k, 77.0% for AGIs $75k-100k, 87.5% for AGIs over 100k)
Likely homosexual households (counted as self-reported same-sex unmarried-partner households)
Lesbian couples: 0.3% of all households
Gay men: 0.0% of all households
Household received Food Stamps/SNAP in the past 12 months: 36 Household did not receive Food Stamps/SNAP in the past 12 months: 916
Women who had a birth in the past 12 months: 104 (89 now married, 16 unmarried) Women who did not have a birth in the past 12 months: 414 (159 now married, 255 unmarried)
Housing units in zip code 50675 with a mortgage: 405 (77 second mortgage, 68 both second mortgage and home equity loan) Median monthly owner costs for units with a mortgage: $1,290 Median monthly owner costs for units without a mortgage: $544
Residents with income below the poverty level in 2022:
This zip code:
12.5%
Whole state:
11.0%
Residents with income below 50% of the poverty level in 2022:
This zip code:
5.6%
Whole state:
5.5%
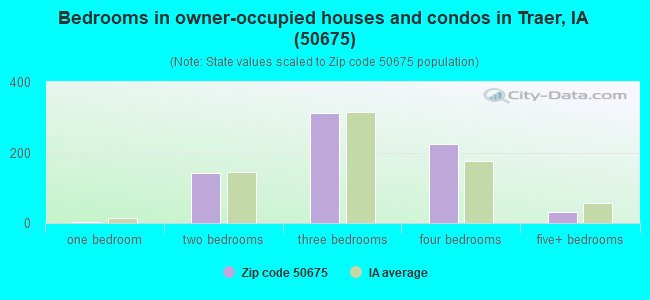
Median number of rooms in houses and condos:
Here:
7.1
State:
6.8
Median number of rooms in apartments:
Here:
6.1
State:
4.2
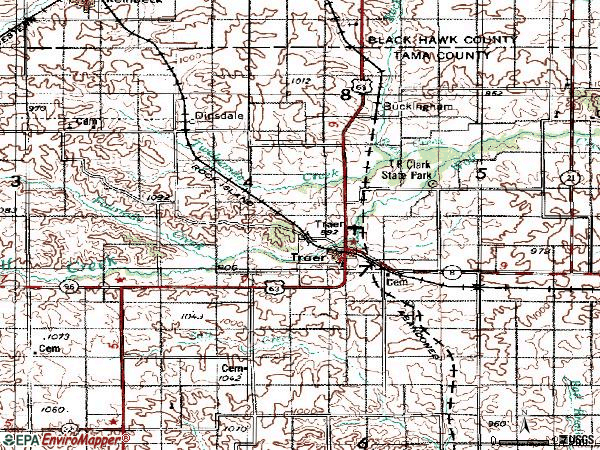
Notable locations in this zip code not listed on our city pages
Notable locations in zip code 50675: Collins Grove (A), Traer Ambulance Service (B), Traer Fire Department (C), Traer Public Library (D), Traer City Hall (E). Display/hide their locations on the map
Churches in zip code 50675 include: United Presbyterian Church (A), Ripley United Church of Christ (B), Saint Luke Evangelical Lutheran Church (C), Traer United Methodist Church (D), Saint Paul Church (E). Display/hide their locations on the map
Cemeteries: Bakers Grove Cemetery (1), Buckingham Cemetery (2), Saint Paul's Catholic Cemetery (3), Dinsdale Cemetery (4), West Union Cemetery (5). Display/hide their locations on the map
Parks in zip code 50675 include: T F Clark State Park (1), Taylor Park (2), James 'Tame Jim' Wilson State Historical Marker (3). Display/hide their locations on the map
341 married couples with children.
87 single-parent households (31 men, 56 women).
96.3% of residents of 50675 zip code speak English at home.
4.2% of residents speak Spanish at home (97% very well, 2% well, 1% not well).
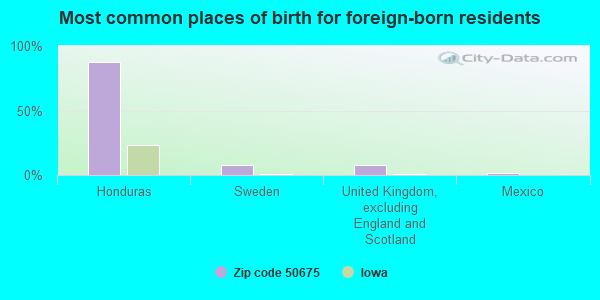
Foreign born population: 84 (3.7%) (97.5% of them are naturalized citizens)
This zip code:
3.7%
Whole state:
6.0%
87%Honduras
8%Sweden
8%United Kingdom, excluding England and Scotland
1%Mexico
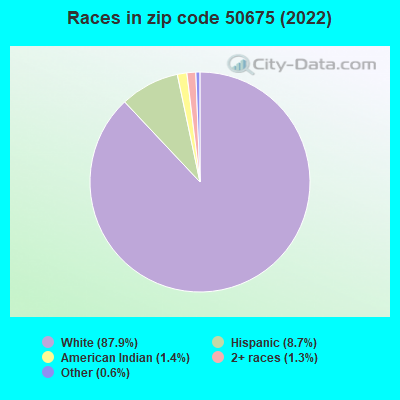
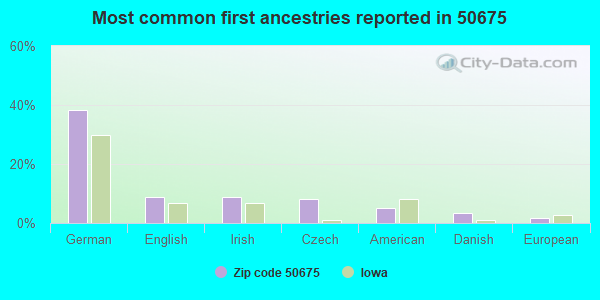
38%German
9%English
9%Irish
8%Czech
5%American
3%Danish
2%European
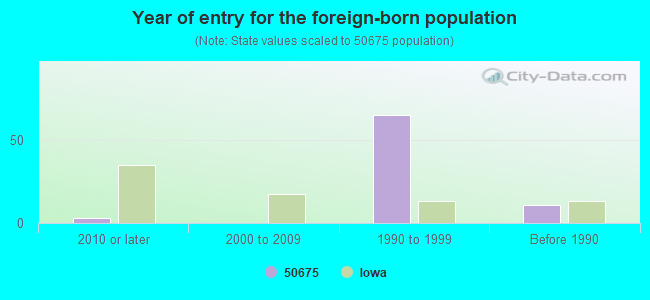
Year of entry for the foreign-born population
32010 or later
02000 to 2009
651990 to 1999
11Before 1990
Facilities with environmental interests located in this zip code:
TRAER MUNICIPAL WATER PLANT (649 2ND STREET in TRAER, IA)
AIR SYNTHETIC MINOR (AIRS/AFS) STATE MASTER (Iowa emission factors information) - SDWIS-IA8681030, DRINKING WATER SYSTEM COMPLIANCE ACTIVITY (Tracking inspections of insecticide, fungicide, and rodenticide, and toxic substances) National Pollutant Discharge Elimination System NON-MAJOR (Tracking pollutant discharge elimination systems) - permit COMMUNITY WATER SYSTEM (SDWIS) Business SIC classification: ELECTRIC SERVICES; SEWERAGE SYSTEMS Organizations: TRAER MUNICIPAL UTILITIES (CONTACT/OWNER)
Alternative names: TRAER CITY OF STP, TRAER MUNIC UTILITIES, TRAER MUNICIPAL UTILITIES, TRAER MUNICIPAL UTILIES, TRAER MUNICIPAL WATER PLANT C/O UTILITIES OFFICE
NORTH TAMA HIGH SCHOOL (605 WALNUT in TRAER, IA)
(Geographic Names Information System) COMPLIANCE ACTIVITY (Tracking inspections of insecticide, fungicide, and rodenticide, and toxic substances) (National Center for Education Statistics) - STATE ID-864785 109 (Resource Conservation and Recovery Act (tracking hazardous waste)) Organizations: NORTH TAMA COUNTY COMM SCHOOL DISTRICT (SCHOOL DISTRICT)
Alternative names: NORTH TAMA C S D, NORTH TAMA COUNTY COMM, NORTH TAMA COUNTY SCHOOL DIST
DIEOMATIC INCORPORATED (1525 SOUTH MAIN STREET in TRAER, IA)
AIR MINOR (AIRS/AFS) CRITERIA AND HAZARDOUS AIR POLLUTANT INVENTORY (Inventory of air pollution sources) Conditionally Exempt Small Quantity Generators, less than 100 kg/month of hazardous waste (Resource Conservation and Recovery Act (tracking hazardous waste)) TRI REPORTER (Tracking of toxic chemicals releasing facilities) Business SIC classification: AUTOMOTIVE STAMPINGS Organizations: TRAER MANUFACTURING INC (CONTACT/OPERATOR)
Alternative names: TRAER MANUFACTURING INC
TRAER ELEMENTARY SCHOOL (605 WALNUT in TRAER, IA)
(National Center for Education Statistics) - STATE ID-864785 418 Organizations: NORTH TAMA COUNTY COMM SCHOOL DISTRICT (SCHOOL DISTRICT)
A & M OIL CO (1/4 MI E OF TRAER ON HWY 8 in TRAER, IA)
COMPLIANCE ACTIVITY (Tracking inspections of insecticide, fungicide, and rodenticide, and toxic substances) (Resource Conservation and Recovery Act (tracking hazardous waste))
CENTRAL COUNTY COOP (216 SOUTH MAIN STREET in TRAER, IA)
AIR MINOR (AIRS/AFS) Business SIC classification: GRAIN AND FIELD BEANS Alternative names: TRAER FARMERS ELEV
CORN BEEF LIMITED (1856 HIGHWAY 63 in TRAER, IA)
National Pollutant Discharge Elimination System NON-MAJOR (Tracking pollutant discharge elimination systems) - permit Business SIC classification: BEEF CATTLE FEEDLOTS
AMOCO FERTILIZER PLANT-FORMER SITE OF (1/4 MI E OF TRAER ON HWY 8 in TRAER, IA)
(Resource Conservation and Recovery Act (tracking hazardous waste))
SEALOCK AG SERV (517 1ST ST in TRAER, IA)
COMPLIANCE ACTIVITY (Tracking inspections of insecticide, fungicide, and rodenticide, and toxic substances)
Housing units lacking complete plumbing facilities: 0.2% Housing units lacking complete kitchen facilities: 3.9%
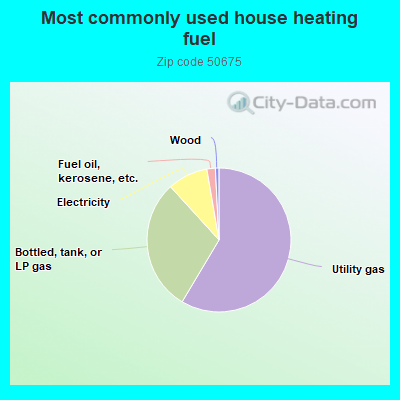
58.8%Utility gas
29.8%Bottled, tank, or LP gas
9.1%Electricity
1.9%Fuel oil, kerosene, etc.
0.8%Wood
Population in 1990: 2,064. Population change in the 1990s: +384 (+18.6%).
Place of birth for U.S.-born residents:
This state: 1,890
Northeast: 17
Midwest: 163
South: 73
West: 95
67% of the 50675 zip code residents lived in the same house 5 years ago. Out of people who lived in different houses, 58% lived in this county. Out of people who lived in different counties, 50% lived in Iowa.
86% of the 50675 zip code residents lived in the same house 1 year ago. Out of people who lived in different houses, 29% moved from this county. Out of people who lived in different houses, 33% moved from different county within same state. Out of people who lived in different houses, 37% moved from different state. Out of people who lived in different houses, 0% moved from abroad.
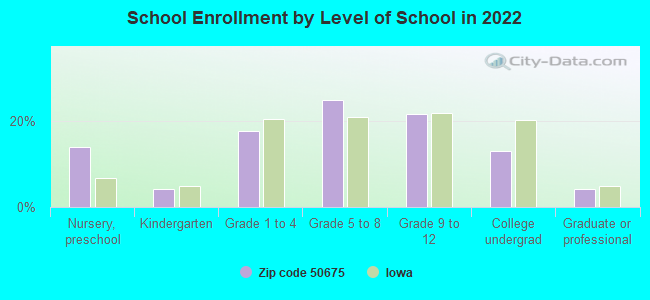
Private vs. public school enrollment:
Students in private schools in grades 1 to 8 (elementary and middle school): 4
Here:
2.4%
Iowa:
10.6%
Students in private schools in grades 9 to 12 (high school): 8
Here:
8.8%
Iowa:
7.9%
Students in private undergraduate colleges: 6
Here:
11.2%
Iowa:
23.9%
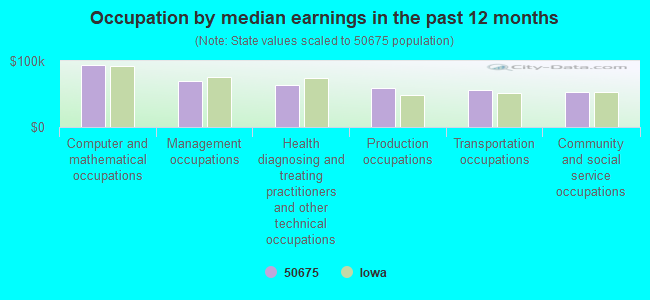
Occupation by median earnings in the past 12 months ($)
93,597Computer and mathematical occupations
69,511Management occupations
63,788Health diagnosing and treating practitioners and other technical occupations
59,292Production occupations
56,529Transportation occupations
52,794Community and social service occupations
Top industries in this zip code by the number of employees in 2005:
Health Care and Social Assistance: Nursing Care Facilities (50-99 employees: 1 establishment)
Health Care and Social Assistance: Child Day Care Services (20-49: 1)
Professional, Scientific, and Technical Services: Payroll Services (20-49: 1)
Finance and Insurance: Insurance Agencies and Brokerages (5-9: 2, 1-4: 3)
Finance and Insurance: Commercial Banking (10-19: 1, 1-4: 2)
People in group quarters in 2010:
74 people in nursing facilities/skilled-nursing facilities
People in group quarters in 2000:
78 people in nursing homes
Fatal accident statistics in 2014:
Fatal accident count: 2
Vehicles involved in fatal accidents: 4
Fatal accidents caused by drunken drivers: 0
Fatalities: 2
Persons involved in fatal accidents: 5
Pedestrians involved in fatal accidents: 0
Fatal accident statistics in 2011:
Fatal accident count: 1
Vehicles involved in fatal accidents: 1
Fatal accidents caused by drunken drivers: 0
Fatalities: 1
Persons involved in fatal accidents: 1
Pedestrians involved in fatal accidents: 0
2002 - 2017 National Fire Incident Reporting System (NFIRS) incidents
Based on the data from the years 2002 - 2017 the average number of fire incidents per year is 7. The highest number of reported fire incidents - 24 took place in 2003, and the least - 0 in 2006. The data has a decreasing trend.
When looking into fire subcategories, the most incidents belonged to: Outside Fires (47.6%), and Structure Fires (35.2%).
Fire incident types reported to NFIRS in Zip Code 50675


+$471
-$74
(% of AGI for various income ranges: -0.5% for AGIs $10k-25k, 2.3% for AGIs $25k-50k, -0.9% for AGIs $50k-75k, 0.2% for AGIs $75k-100k) Nearest zip codes: 52342, 50612, 52217, 50643, 50669, 50635.
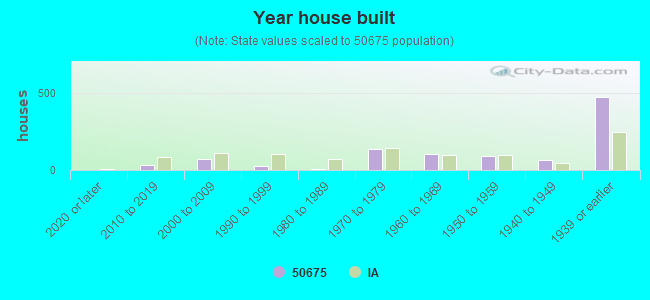


 Based on the data from the years 2002 - 2017 the average number of fire incidents per year is 7. The highest number of reported fire incidents - 24 took place in 2003, and the least - 0 in 2006. The data has a decreasing trend.
 When looking into fire subcategories, the most incidents belonged to: Outside Fires (47.6%), and Structure Fires (35.2%).