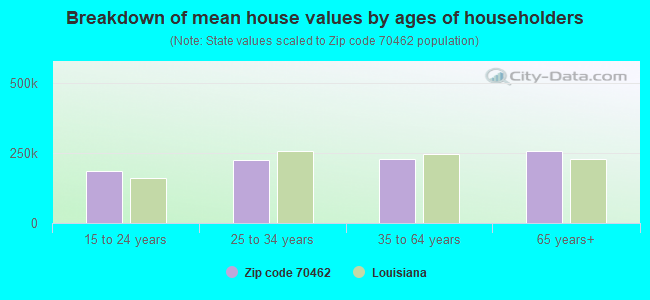
Estimated median house/condo value in 2022: $201,604
70462:
$201,604
Louisiana:
$209,200
According to our research of Louisiana and other state lists, there were 18 registered sex offenders living in 70462 zip code as of May 07, 2024. The ratio of all residents to sex offenders in zip code 70462 is 321 to 1. The ratio of registered sex offenders to all residents in this zip code is near the state average.
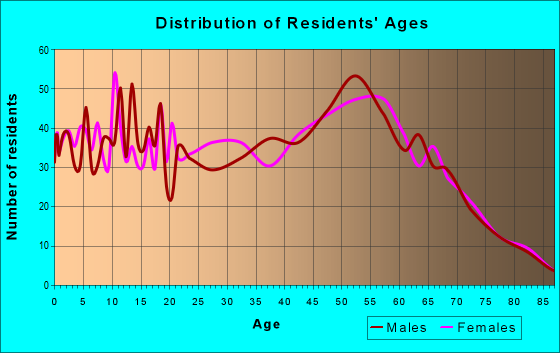
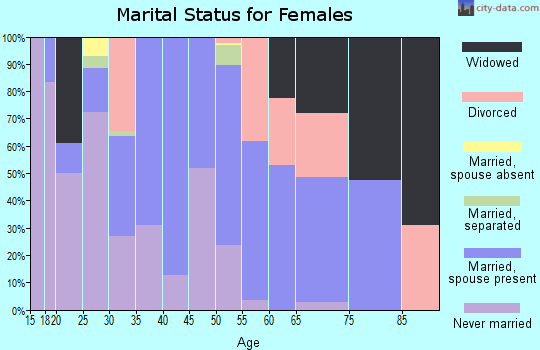
Median resident age:
This zip code:
48.2 years
Louisiana median age:
38.2 years
Average household size:
This zip code:
2.3 people
Louisiana:
2.5 people
Averages for the 2020 tax year for zip code 70462, filed in 2021:
Average Adjusted Gross Income (AGI) in 2020: $62,838 (Individual Income Tax Returns)
Here:
$62,838
State:
$60,757
Salary/wage: $55,037 (reported on 83.3% of returns)
Here:
$55,037
State:
$50,882
(% of AGI for various income ranges: 1082.3% for AGIs below $25k, 3391.6% for AGIs $25k-50k, 7022.6% for AGIs $50k-75k, 8938.8% for AGIs $75k-100k, 18220.0% for AGIs $100k-200k, 64706.7% for AGIs over 200k)
Taxable interest for individuals: $937 (reported on 20.9% of returns)
This zip code:
$937
Louisiana:
$1,576
(% of AGI for various income ranges: 8.9% for AGIs below $25k, 14.1% for AGIs $25k-50k, 20.9% for AGIs $50k-75k, 52.5% for AGIs $75k-100k, 63.3% for AGIs $100k-200k, 286.7% for AGIs over 200k)
Ordinary dividends: $3,709 (reported on 12.4% of returns)
Here:
$3,709
State:
$7,743
(% of AGI for various income ranges: 8.3% for AGIs below $25k, 31.6% for AGIs $25k-50k, 124.8% for AGIs $50k-75k, 99.4% for AGIs $75k-100k, 107.5% for AGIs $100k-200k, 886.7% for AGIs over 200k)
Net capital gain/loss in AGI: +$16,793 (reported on 11.6% of returns)
Here:
+$16,793
State:
+$16,917
(% of AGI for various income ranges: 4.8% for AGIs below $25k, 13.1% for AGIs $25k-50k, 71.7% for AGIs $50k-75k, 286.9% for AGIs $75k-100k, 457.9% for AGIs $100k-200k, 10716.7% for AGIs over 200k)
Profit/loss from business: +$6,091 (reported on 17.8% of returns)
Here:
+$6,091
State:
+$7,679
(% of AGI for various income ranges: 96.0% for AGIs below $25k, 61.8% for AGIs $25k-50k, 58.7% for AGIs $50k-75k, 109.4% for AGIs $75k-100k, 612.1% for AGIs $100k-200k)
Taxable individual retirement arrangement distribution: $27,353 (reported on 7.4% of returns)
70462:
$27,353
Louisiana:
$20,716
(% of AGI for various income ranges: 26.8% for AGIs below $25k, 150.6% for AGIs $25k-50k, 350.6% for AGIs $75k-100k, 1540.4% for AGIs $100k-200k)
Total itemized deductions: $35,336 (reported on 5.4% of returns)
Here:
$35,336
State:
$36,265
(% of AGI for various income ranges: 657.0% for AGIs $50k-75k, 743.3% for AGIs $100k-200k, 5506.7% for AGIs over 200k)
Charity contributions: $13,645 (reported on 4.3% of returns)
Here:
$13,645
State:
$13,106
(% of AGI for various income ranges: 133.9% for AGIs $50k-75k, 243.8% for AGIs $100k-200k, 2026.7% for AGIs over 200k)
Taxes paid: $6,579 (reported on 5.4% of returns)
70462:
$6,579
State:
$6,643
(% of AGI for various income ranges: 78.3% for AGIs $50k-75k, 166.7% for AGIs $100k-200k, 1136.7% for AGIs over 200k)
Earned income credit: $2,726 (reported on 22.1% of returns)
Here:
$2,726
State:
$2,671
(% of AGI for various income ranges: 150.5% for AGIs below $25k, 86.7% for AGIs $25k-50k)
Percentage of individuals using paid preparers for their 2020 taxes: 94.6%
Here:
95%
State:
92%
(% for various income ranges: 94.6% for AGIs below $25k, 95.0% for AGIs $25k-50k, 91.2% for AGIs $50k-75k, 95.5% for AGIs $75k-100k, 95.0% for AGIs $100k-200k, 100.0% for AGIs over 200k)
Averages for the 2012 tax year for zip code 70462, filed in 2013:
Average Adjusted Gross Income (AGI) in 2012: $58,682 (Individual Income Tax Returns)
Here:
$58,682
State:
$56,730
Salary/wage: $48,127 (reported on 85.2% of returns)
Here:
$48,127
State:
$45,545
(% of AGI for various income ranges: 76.4% for AGIs below $25k, 81.3% for AGIs $25k-50k, 83.7% for AGIs $50k-75k, 81.7% for AGIs $75k-100k, 80.5% for AGIs $100k-200k, 37.7% for AGIs over 200k)
Taxable interest for individuals: $1,109 (reported on 23.3% of returns)
This zip code:
$1,109
Louisiana:
$1,804
(% of AGI for various income ranges: 0.6% for AGIs below $25k, 0.5% for AGIs $25k-50k, 0.5% for AGIs $50k-75k, 0.6% for AGIs $75k-100k, 0.3% for AGIs $100k-200k, 0.4% for AGIs over 200k)
Ordinary dividends: $17,693 (reported on 12.7% of returns)
Here:
$17,693
State:
$7,610
(% of AGI for various income ranges: 0.7% for AGIs below $25k, 0.3% for AGIs $25k-50k, 0.2% for AGIs $50k-75k, 0.3% for AGIs $75k-100k, 0.6% for AGIs $100k-200k, 13.7% for AGIs over 200k)
Net capital gain/loss in AGI: +$18,532 (reported on 10.6% of returns)
Here:
+$18,532
State:
+$17,096
(% of AGI for various income ranges: 0.7% for AGIs $50k-75k, 0.2% for AGIs $75k-100k, 0.5% for AGIs $100k-200k, 12.2% for AGIs over 200k)
Profit/loss from business: +$10,942 (reported on 18.2% of returns)
Here:
+$10,942
State:
+$12,088
(% of AGI for various income ranges: 9.1% for AGIs below $25k, 1.9% for AGIs $25k-50k, 1.3% for AGIs $50k-75k, 1.2% for AGIs $75k-100k, 7.9% for AGIs $100k-200k)
Taxable individual retirement arrangement distribution: $15,000 (reported on 6.8% of returns)
70462:
$15,000
Louisiana:
$16,085
(% of AGI for various income ranges: 1.8% for AGIs below $25k, 1.9% for AGIs $25k-50k, 3.5% for AGIs $50k-75k, 3.4% for AGIs $100k-200k)
Total itemized deductions: $28,897 (22% of AGI, reported on 25.8% of returns)
Here:
$28,897
State:
$23,585
Here:
22.2% of AGI
State:
18.1% of AGI
(% of AGI for various income ranges: 9.4% for AGIs below $25k, 10.3% for AGIs $25k-50k, 11.9% for AGIs $50k-75k, 13.3% for AGIs $75k-100k, 12.7% for AGIs $100k-200k, 15.4% for AGIs over 200k)
Charity contributions: $5,969 (reported on 17.8% of returns)
Here:
$5,969
State:
$5,533
(% of AGI for various income ranges: 0.5% for AGIs below $25k, 1.2% for AGIs $25k-50k, 1.1% for AGIs $50k-75k, 1.2% for AGIs $75k-100k, 1.5% for AGIs $100k-200k, 3.7% for AGIs over 200k)
Taxes paid: $5,670 (reported on 25.8% of returns)
70462:
$5,670
State:
$6,282
(% of AGI for various income ranges: 0.7% for AGIs below $25k, 1.0% for AGIs $25k-50k, 1.6% for AGIs $50k-75k, 2.2% for AGIs $75k-100k, 3.1% for AGIs $100k-200k, 4.1% for AGIs over 200k)
Earned income credit: $2,469 (reported on 27.1% of returns)
Here:
$2,469
State:
$2,633
(% of AGI for various income ranges: 10.6% for AGIs below $25k, 1.0% for AGIs $25k-50k)
Percentage of individuals using paid preparers for their 2012 taxes: 58.9%
Here:
59%
State:
57%
(% for various income ranges: 54.5% for AGIs below $25k, 56.6% for AGIs $25k-50k, 66.7% for AGIs $50k-75k, 61.9% for AGIs $75k-100k, 65.4% for AGIs $100k-200k, 80.0% for AGIs over 200k)
Averages for the 2004 tax year for zip code 70462, filed in 2005:
Average Adjusted Gross Income (AGI) in 2004: $35,269 (Individual Income Tax Returns)
Here:
$35,269
State:
$39,411
Salary/wage: $32,709 (reported on 85.2% of returns)
Here:
$32,709
State:
$34,434
(% of AGI for various income ranges: 92.7% for AGIs below $10k, 78.9% for AGIs $10k-25k, 82.1% for AGIs $25k-50k, 84.9% for AGIs $50k-75k, 82.6% for AGIs $75k-100k, 67.3% for AGIs over 100k)
Taxable interest for individuals: $1,255 (reported on 29.7% of returns)
This zip code:
$1,255
Louisiana:
$1,606
(% of AGI for various income ranges: 3.5% for AGIs below $10k, 1.8% for AGIs $10k-25k, 1.0% for AGIs $25k-50k, 0.6% for AGIs $50k-75k, 0.9% for AGIs $75k-100k, 0.9% for AGIs over 100k)
Taxable dividends: $1,509 (reported on 13.5% of returns)
Here:
$1,509
State:
$3,235
(% of AGI for various income ranges: 0.7% for AGIs below $10k, 0.7% for AGIs $10k-25k, 0.4% for AGIs $25k-50k, 0.3% for AGIs $50k-75k, 0.3% for AGIs $75k-100k, 1.2% for AGIs over 100k)
Net capital gain/loss: +$3,983 (reported on 10.8% of returns)
Here:
+$3,983
State:
+$8,531
(% of AGI for various income ranges: -0.5% for AGIs below $10k, 0.1% for AGIs $10k-25k, 0.7% for AGIs $25k-50k, 0.3% for AGIs $50k-75k, 2.7% for AGIs $75k-100k, 2.7% for AGIs over 100k)
Profit/loss from business: +$5,980 (reported on 18.6% of returns)
Here:
+$5,980
State:
+$9,128
(% of AGI for various income ranges: 16.9% for AGIs below $10k, 6.6% for AGIs $10k-25k, 2.9% for AGIs $25k-50k, 1.5% for AGIs $50k-75k, 1.8% for AGIs $75k-100k, 2.0% for AGIs over 100k)
Profit/loss from farming: +$182 (reported on 1.0% of returns)
Here:
+$182
State:
-$6,401
IRA payment deduction: $2,972 (reported on 1.7% of returns)
70462:
$2,972
Louisiana:
$3,055
Total itemized deductions: $17,028 (24% of AGI, reported on 23.5% of returns)
Here:
$17,028
State:
$18,222
Here:
24.4% of AGI
State:
20.3% of AGI
(% of AGI for various income ranges: 5.3% for AGIs $10k-25k, 12.2% for AGIs $25k-50k, 14.8% for AGIs $50k-75k, 15.9% for AGIs $75k-100k, 10.0% for AGIs over 100k)
Charity contributions deductions: $2,912 (4% of AGI, reported on 19.1% of returns)
Here:
$2,912
State:
$4,190
Here:
3.9% of AGI
State:
4.4% of AGI
(% of AGI for various income ranges: 0.4% for AGIs $10k-25k, 1.3% for AGIs $25k-50k, 1.8% for AGIs $50k-75k, 2.6% for AGIs $75k-100k, 2.1% for AGIs over 100k)
Total tax: $4,923 (reported on 66.7% of returns)
70462:
$4,923
State:
$6,529
(% of AGI for various income ranges: 4.3% for AGIs below $10k, 3.1% for AGIs $10k-25k, 5.6% for AGIs $25k-50k, 7.9% for AGIs $50k-75k, 10.1% for AGIs $75k-100k, 18.5% for AGIs over 100k)
Earned income credit: $2,095 (reported on 31.9% of returns)
Here:
$2,095
State:
$2,103
Percentage of individuals using paid preparers for their 2004 taxes: 62.5%
Here:
63%
State:
61%
(% for various income ranges: 60.9% for AGIs below $10k, 60.6% for AGIs $10k-25k, 62.1% for AGIs $25k-50k, 68.7% for AGIs $50k-75k, 67.9% for AGIs $75k-100k, 63.2% for AGIs over 100k)
Household received Food Stamps/SNAP in the past 12 months: 225 Household did not receive Food Stamps/SNAP in the past 12 months: 1,892
Women who had a birth in the past 12 months: 21 (20 now married, 0 unmarried) Women who did not have a birth in the past 12 months: 1,207 (375 now married, 834 unmarried)
Housing units in zip code 70462 with a mortgage: 841 (16 second mortgage, 15 both second mortgage and home equity loan) Houses without a mortgage: 4
Median monthly owner costs for units with a mortgage: $1,347 Median monthly owner costs for units without a mortgage: $405
Residents with income below the poverty level in 2022:
This zip code:
6.6%
Whole state:
18.6%
Residents with income below 50% of the poverty level in 2022:
This zip code:
3.8%
Whole state:
10.1%
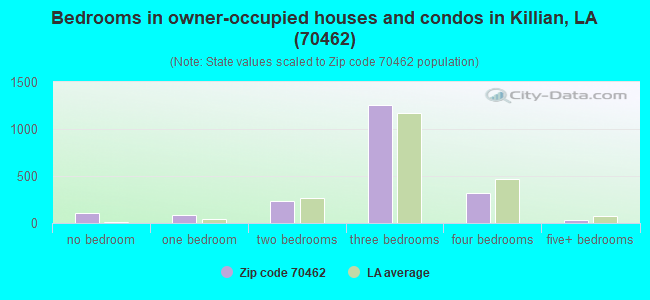
Median number of rooms in houses and condos:
Here:
5.8
State:
6.2
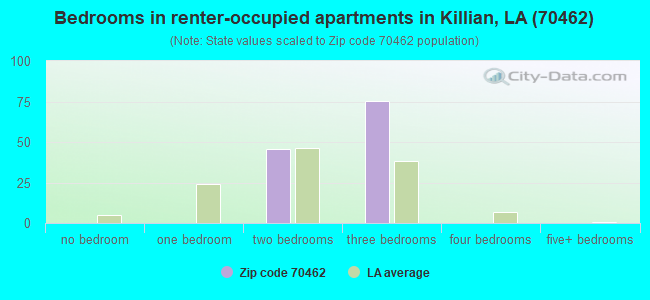
Median number of rooms in apartments:
Here:
4.9
State:
4.4
Notable locations in this zip code not listed on our city pages
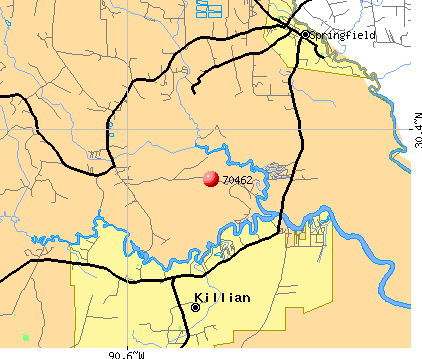
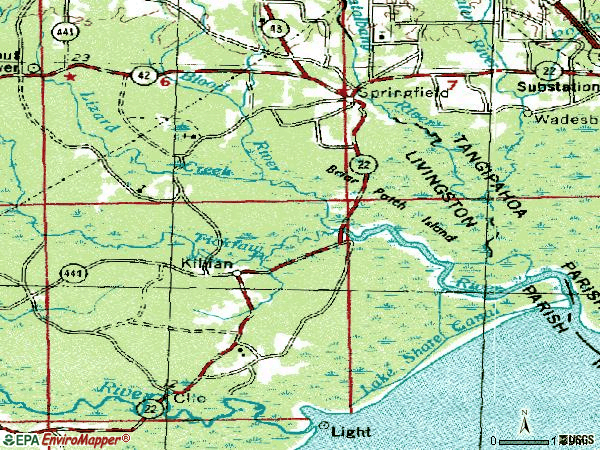
Notable locations in zip code 70462: Carter Plantation Golf Course (A), Tucker Landing (B), Smiley Landing (C), Cullom Landing (D), Carter Plantation (E), Carter Landing (F), Booth Shell Bank (G), Blockade Landing (H), Springfield Police Department (I), Springfield Volunteer Fire Department (J). Display/hide their locations on the map
Churches in zip code 70462 include: Woodland Baptist Church (A), First United Methodist Church of Springfield (B), Blood River Church (C), Huff Chapel United Methodist Church (D), Galilee Baptist Church (E), Holly Church (F), Killian Church (G), Bethlehem Baptist Church (H), Saint James Church (I). Display/hide their locations on the map
Cemeteries: Schroeder Cemetery (1), Bethlehem Cemetery (2), Cullom Cemetery (3), Redding Cemetery (4), Springfield Cemetery (5), Pennington Cemetery (6), McKinney Cemetery (7). Display/hide their locations on the map
Size of family households: 953 2-persons, 259 3-persons, 227 4-persons, 103 5-persons
Size of nonfamily households: 521 1-person, 71 2-persons, 6 4-persons
438 married couples with children.
202 single-parent households (105 men, 97 women).
99.1% of residents of 70462 zip code speak English at home.
1.1% of residents speak Spanish at home (54% very well, 2% well, 44% not well).
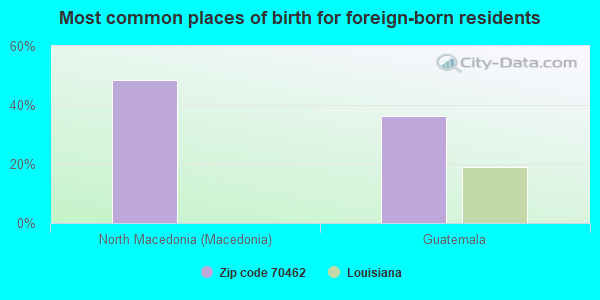
Foreign born population: 32 (0.7%) (68.3% of them are naturalized citizens)
This zip code:
0.7%
Whole state:
4.2%
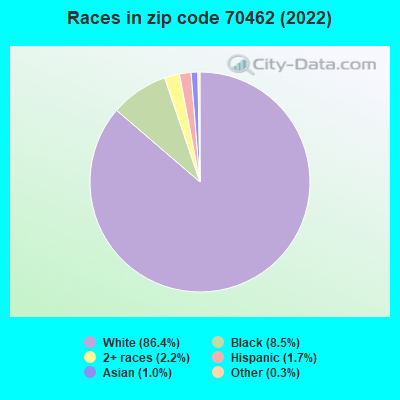
48%North Macedonia (Macedonia)
36%Guatemala
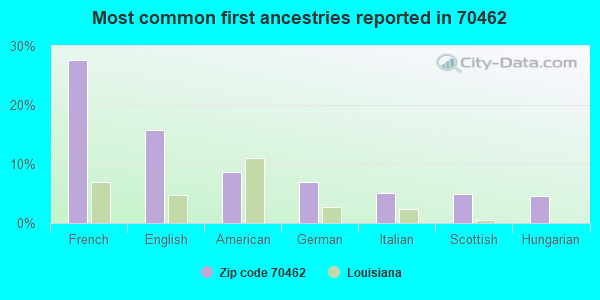
28%French
16%English
9%American
7%German
5%Italian
5%Scottish
5%Hungarian
Year of entry for the foreign-born population
222010 or later
02000 to 2009
01990 to 1999
26Before 1990
Facilities with environmental interests located in this zip code:
ALBANY-SPRINGFIELD HIGH SCHOOL (32000 HIGHWAY 42 in SPRINGFIELD, LA)
(Geographic Names Information System) (National Center for Education Statistics) - STATE ID-032023 Organizations: LIVINGSTON PARISH SCHOOL BOARD (SCHOOL DISTRICT)
A TRUCK ENTERPRISES INC (25519 HWY 43 in SPRINGFIELD, LA)
A&A SUPER CARWASH (27126 HIGHWAY 22 in SPRINGFIELD, LA)
National Pollutant Discharge Elimination System NON-MAJOR (Tracking pollutant discharge elimination systems) - permit Business SIC classification: CARWASHES
BIG BS ( in , LA)
National Pollutant Discharge Elimination System NON-MAJOR (Tracking pollutant discharge elimination systems) - permit Business SIC classification: SEWERAGE SYSTEMS Alternative names: BIG BS SEAFOOD RESTAURANT & BA
MO-DAD UTILITIES, INC (RIVERSIDE RIDGE SUBD in KILLIAN, LA)
National Pollutant Discharge Elimination System NON-MAJOR (Tracking pollutant discharge elimination systems) - permit
OFFICE OF STATE PARKS TICKFAW STATE PARK (27225 PATTERSON ROAD in SPRINGFIELD, LA)
National Pollutant Discharge Elimination System NON-MAJOR (Tracking pollutant discharge elimination systems) - permit Business SIC classification: SEWERAGE SYSTEMS Alternative names: OFFICE OF STATE PAR-TICKFAW ST
POINTE COUPEE PARISH/LEGONIER (LEGONIER STOP in SPRINGFIELD, LA)
National Pollutant Discharge Elimination System NON-MAJOR (Tracking pollutant discharge elimination systems) - permit Business SIC classification: SEWERAGE SYSTEMS Alternative names: POINTE COUPEE PARISH POLICE JR
GAINEY'S CONCRETE P- ( in , LA)
National Pollutant Discharge Elimination System NON-MAJOR (Tracking pollutant discharge elimination systems) - permit Business SIC classification: CONSTRUCTION SAND AND GRAVEL Alternative names: GAINEY'S CONCRETE PRODUCTS, IN
CHARLIE'S RESTAURANT OF (SPRINGFIELD in SPRINGFIELD, LA)
National Pollutant Discharge Elimination System NON-MAJOR (Tracking pollutant discharge elimination systems) - permit Business SIC classification: EATING PLACES
NEWSTROM BATTERY COMPANY LLC (23685 MENZER RD in SPRINGFIELD, LA)
(Resource Conservation and Recovery Act (tracking hazardous waste)) Business NAICS classification: OTHER WASTE COLLECTION. Organizations: NEWSTROM TERRY (CONTACT/OWNER)
Housing units lacking complete plumbing facilities: 4.4% Housing units lacking complete kitchen facilities: 6.2%
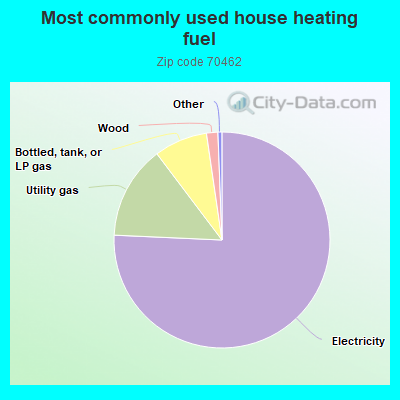
75.8%Electricity
14.0%Utility gas
8.0%Bottled, tank, or LP gas
1.7%Wood
Population in 1990: 5,597.
Place of birth for U.S.-born residents:
This state: 3,973
Northeast: 35
Midwest: 49
South: 569
West: 152
66% of the 70462 zip code residents lived in the same house 5 years ago. Out of people who lived in different houses, 59% lived in this county. Out of people who lived in different counties, 50% lived in Louisiana.
97% of the 70462 zip code residents lived in the same house 1 year ago. Out of people who lived in different houses, 71% moved from this county. Out of people who lived in different houses, 11% moved from different county within same state. Out of people who lived in different houses, 25% moved from different state. Out of people who lived in different houses, 5% moved from abroad.
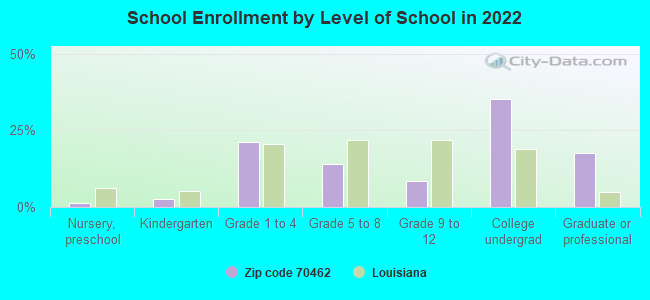
Private vs. public school enrollment:
Students in private schools in grades 1 to 8 (elementary and middle school):
Here:
0.0%
Louisiana:
19.6%
Students in private schools in grades 9 to 12 (high school):
Here:
0.0%
Louisiana:
18.3%
Students in private undergraduate colleges:
Here:
0.0%
Louisiana:
17.4%
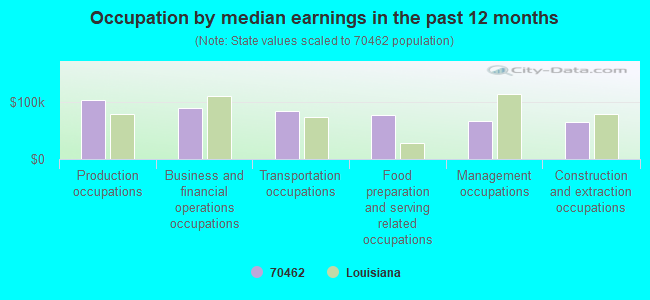
Occupation by median earnings in the past 12 months ($)
102,501Production occupations
88,609Business and financial operations occupations
83,610Transportation occupations
76,266Food preparation and serving related occupations
67,341Management occupations
64,218Construction and extraction occupations
Companies with federal contracts located in this zip code:
BFC MARINE INC (26844 HWY 1037 in SPRINGFIELD, LA; small business)
$5,385 with Army for Small Craft. Taking place in GA. Signed on 2003-05-01. Completion date: 2003-06-02.
Top industries in this zip code by the number of employees in 2005:
Arts, Entertainment, and Recreation: All Other Amusement and Recreation Industries (100-249 employees: 1 establishment)
Health Care and Social Assistance: Child Day Care Services (20-49: 1)
Accommodation and Food Services: Full-Service Restaurants (10-19: 1, 1-4: 1)
Other Services (except Public Administration): Religious Organizations (1-4: 7)
Health Care and Social Assistance: Other Individual and Family Services (5-9: 1)
Finance and Insurance: Insurance Agencies and Brokerages (5-9: 1)
Fatal accident statistics in 2014:
Fatal accident count: 1
Vehicles involved in fatal accidents: 1
Fatal accidents caused by drunken drivers: 0
Fatalities: 1
Persons involved in fatal accidents: 1
Pedestrians involved in fatal accidents: 0
Fatal accident statistics in 2012:
Fatal accident count: 1
Vehicles involved in fatal accidents: 2
Fatal accidents caused by drunken drivers: 0
Fatalities: 1
Persons involved in fatal accidents: 2
Pedestrians involved in fatal accidents: 0
Home Mortgage Disclosure Act Aggregated Statistics For Year 2009 (Based on 4 partial tracts)
A) FHA, FSA/RHS & VA Home Purchase Loans
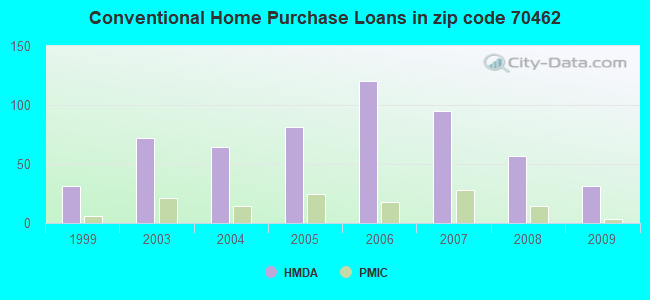
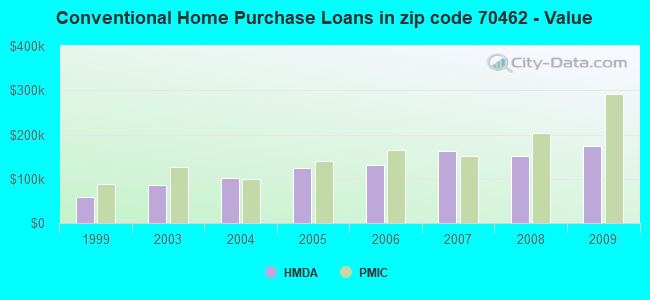
B) Conventional Home Purchase Loans
C) Refinancings
D) Home Improvement Loans
E) Loans on Dwellings For 5+ Families
F) Non-occupant Loans on < 5 Family Dwellings (A B C & D)
G) Loans On Manufactured Home Dwelling (A B C & D)
Number
Average Value
Number
Average Value
Number
Average Value
Number
Average Value
Number
Average Value
Number
Average Value
Number
Average Value
LOANS ORIGINATED
19
$142,578
31
$175,015
117
$170,157
17
$28,501
1
$925,410
25
$173,445
16
$36,401
APPLICATIONS APPROVED, NOT ACCEPTED
1
$74,830
10
$127,361
13
$131,914
0
$0
0
$0
3
$199,263
8
$54,026
APPLICATIONS DENIED
11
$141,054
19
$131,963
48
$168,372
12
$21,737
0
$0
6
$134,240
16
$48,767
APPLICATIONS WITHDRAWN
2
$93,540
9
$114,799
34
$159,311
1
$45,670
0
$0
2
$64,075
5
$85,088
FILES CLOSED FOR INCOMPLETENESS
1
$88,800
2
$204,110
10
$161,385
1
$67,510
0
$0
1
$292,180
1
$95,640
Aggregated Statistics For Year 2008 (Based on 4 partial tracts)
A) FHA, FSA/RHS & VA Home Purchase Loans
B) Conventional Home Purchase Loans
C) Refinancings
D) Home Improvement Loans
F) Non-occupant Loans on < 5 Family Dwellings (A B C & D)
G) Loans On Manufactured Home Dwelling (A B C & D)
Number
Average Value
Number
Average Value
Number
Average Value
Number
Average Value
Number
Average Value
Number
Average Value
LOANS ORIGINATED
17
$122,902
57
$152,442
101
$164,964
21
$48,031
35
$183,171
29
$64,683
APPLICATIONS APPROVED, NOT ACCEPTED
4
$124,298
16
$114,894
11
$167,715
1
$31,210
4
$122,642
11
$74,567
APPLICATIONS DENIED
7
$145,883
32
$78,545
47
$138,774
21
$42,470
9
$139,369
25
$42,137
APPLICATIONS WITHDRAWN
3
$134,913
13
$158,684
23
$182,227
2
$30,860
4
$289,885
3
$62,647
FILES CLOSED FOR INCOMPLETENESS
0
$0
3
$108,257
5
$190,664
0
$0
1
$222,820
0
$0
Aggregated Statistics For Year 2007 (Based on 4 partial tracts)
A) FHA, FSA/RHS & VA Home Purchase Loans
B) Conventional Home Purchase Loans
C) Refinancings
D) Home Improvement Loans
F) Non-occupant Loans on < 5 Family Dwellings (A B C & D)
G) Loans On Manufactured Home Dwelling (A B C & D)
Number
Average Value
Number
Average Value
Number
Average Value
Number
Average Value
Number
Average Value
Number
Average Value
LOANS ORIGINATED
9
$114,219
95
$162,229
84
$151,771
30
$46,800
36
$160,878
31
$59,643
APPLICATIONS APPROVED, NOT ACCEPTED
1
$92,120
13
$149,145
18
$123,391
6
$81,355
2
$271,665
6
$66,302
APPLICATIONS DENIED
6
$99,598
43
$126,760
44
$131,481
30
$40,008
6
$201,983
34
$51,190
APPLICATIONS WITHDRAWN
0
$0
13
$177,558
23
$139,969
3
$86,717
4
$118,918
2
$28,470
FILES CLOSED FOR INCOMPLETENESS
0
$0
3
$276,983
11
$142,460
1
$56,260
1
$309,410
0
$0
Aggregated Statistics For Year 2006 (Based on 4 partial tracts)
A) FHA, FSA/RHS & VA Home Purchase Loans
B) Conventional Home Purchase Loans
C) Refinancings
D) Home Improvement Loans
F) Non-occupant Loans on < 5 Family Dwellings (A B C & D)
G) Loans On Manufactured Home Dwelling (A B C & D)
Number
Average Value
Number
Average Value
Number
Average Value
Number
Average Value
Number
Average Value
Number
Average Value
LOANS ORIGINATED
5
$83,700
120
$130,310
90
$115,537
41
$30,279
32
$128,273
36
$47,068
APPLICATIONS APPROVED, NOT ACCEPTED
1
$75,640
25
$111,275
26
$122,320
3
$53,947
4
$94,455
15
$44,065
APPLICATIONS DENIED
4
$60,380
50
$78,115
63
$103,915
24
$50,079
6
$90,597
38
$41,990
APPLICATIONS WITHDRAWN
0
$0
13
$139,242
28
$125,518
5
$67,992
2
$138,270
5
$70,848
FILES CLOSED FOR INCOMPLETENESS
1
$62,580
3
$68,890
19
$144,111
0
$0
0
$0
1
$62,580
Aggregated Statistics For Year 2005 (Based on 4 partial tracts)
A) FHA, FSA/RHS & VA Home Purchase Loans
B) Conventional Home Purchase Loans
C) Refinancings
D) Home Improvement Loans
F) Non-occupant Loans on < 5 Family Dwellings (A B C & D)
G) Loans On Manufactured Home Dwelling (A B C & D)
Number
Average Value
Number
Average Value
Number
Average Value
Number
Average Value
Number
Average Value
Number
Average Value
LOANS ORIGINATED
7
$102,329
81
$123,907
102
$109,906
18
$30,503
31
$149,860
22
$47,924
APPLICATIONS APPROVED, NOT ACCEPTED
2
$56,230
14
$76,938
27
$114,195
1
$52,080
2
$33,665
7
$40,177
APPLICATIONS DENIED
5
$63,526
41
$72,240
84
$97,769
16
$31,870
7
$129,310
39
$45,207
APPLICATIONS WITHDRAWN
3
$76,967
14
$116,351
50
$103,979
3
$103,137
3
$108,207
6
$65,400
FILES CLOSED FOR INCOMPLETENESS
1
$52,040
6
$99,893
14
$139,343
0
$0
1
$145,880
1
$70,930
Aggregated Statistics For Year 2004 (Based on 4 partial tracts)
A) FHA, FSA/RHS & VA Home Purchase Loans
B) Conventional Home Purchase Loans
C) Refinancings
D) Home Improvement Loans
F) Non-occupant Loans on < 5 Family Dwellings (A B C & D)
G) Loans On Manufactured Home Dwelling (A B C & D)
Number
Average Value
Number
Average Value
Number
Average Value
Number
Average Value
Number
Average Value
Number
Average Value
LOANS ORIGINATED
5
$92,678
64
$102,737
116
$99,996
23
$23,991
21
$98,738
27
$44,613
APPLICATIONS APPROVED, NOT ACCEPTED
0
$0
9
$82,141
29
$74,881
3
$26,483
2
$98,985
7
$46,840
APPLICATIONS DENIED
1
$152,130
29
$64,673
103
$87,750
23
$18,819
4
$57,335
28
$42,569
APPLICATIONS WITHDRAWN
0
$0
7
$91,700
53
$112,595
3
$43,890
2
$96,480
2
$47,505
FILES CLOSED FOR INCOMPLETENESS
0
$0
3
$84,250
9
$106,571
0
$0
1
$88,970
1
$57,620
Aggregated Statistics For Year 2003 (Based on 4 partial tracts)
A) FHA, FSA/RHS & VA Home Purchase Loans
B) Conventional Home Purchase Loans
C) Refinancings
D) Home Improvement Loans
F) Non-occupant Loans on < 5 Family Dwellings (A B C & D)
Number
Average Value
Number
Average Value
Number
Average Value
Number
Average Value
Number
Average Value
LOANS ORIGINATED
11
$104,399
72
$86,898
169
$97,639
23
$20,977
25
$92,205
APPLICATIONS APPROVED, NOT ACCEPTED
2
$110,755
17
$53,169
44
$86,549
4
$16,928
3
$50,020
APPLICATIONS DENIED
9
$52,049
50
$54,110
93
$78,853
19
$16,546
7
$89,523
APPLICATIONS WITHDRAWN
2
$67,155
11
$81,532
41
$95,408
3
$30,280
2
$43,155
FILES CLOSED FOR INCOMPLETENESS
1
$206,740
4
$63,815
4
$109,550
0
$0
0
$0
Aggregated Statistics For Year 1999 (Based on 1 partial tract)
A) FHA, FSA/RHS & VA Home Purchase Loans
B) Conventional Home Purchase Loans
C) Refinancings
D) Home Improvement Loans
F) Non-occupant Loans on < 5 Family Dwellings (A B C & D)
Detailed PMIC statistics for the following Tracts:0409.01
, 0409.02
2002 - 2018 National Fire Incident Reporting System (NFIRS) incidents
According to the data from the years 2002 - 2018 the average number of fire incidents per year is 30. The highest number of fire incidents - 200 took place in 2006, and the least - 0 in 2007. The data has a dropping trend.
When looking into fire subcategories, the most reports belonged to: Outside Fires (54.4%), and Structure Fires (36.9%).
Fire incident types reported to NFIRS in Zip Code 70462


+$182
-$6,401
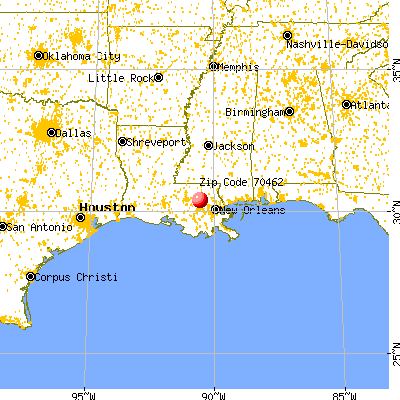
 Nearest zip codes: 70449, 70403, 70711, 70754, 70402, 70451.


 According to the data from the years 2002 - 2018 the average number of fire incidents per year is 30. The highest number of fire incidents - 200 took place in 2006, and the least - 0 in 2007. The data has a dropping trend.
 When looking into fire subcategories, the most reports belonged to: Outside Fires (54.4%), and Structure Fires (36.9%).