Estimated zip code population in 2022: 4,688 Zip code population in 2010: 4,831 Zip code population in 2000: 5,054
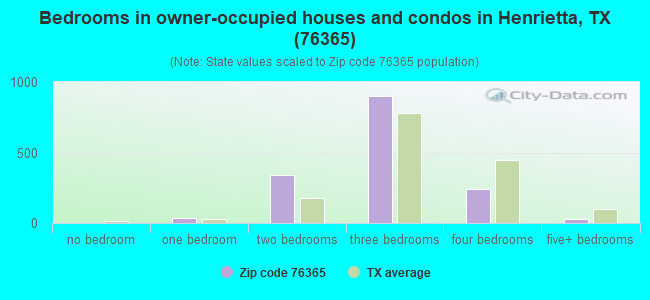
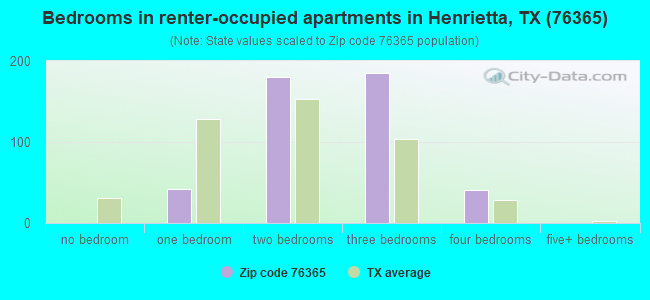
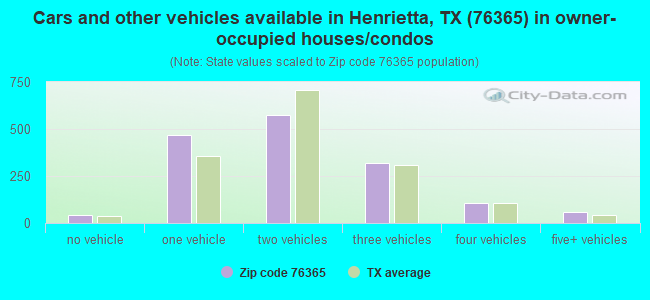
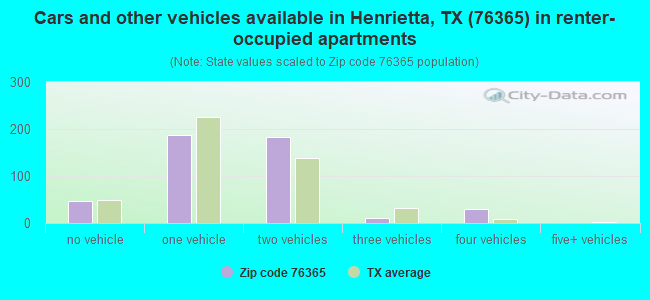
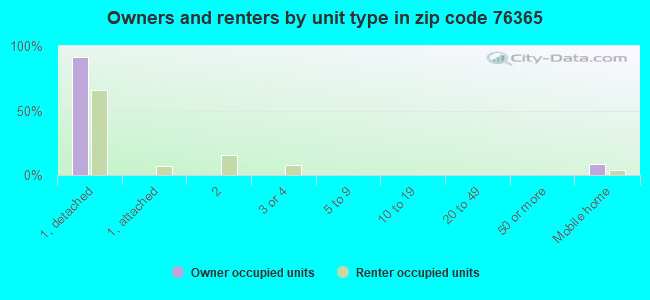
Houses and condos: 2,422 Renter-occupied apartments: 456
% of renters here:
23%
State:
38%
March 2022 cost of living index in zip code 76365: 82.0 (low, U.S. average is 100)
Land area: 532.3 sq. mi. Water area: 15.5 sq. mi.
Population density: 9 people per square mile
(very low).
OSM Map
General Map
Google Map
MSN Map
OSM Map
General Map
Google Map
MSN Map
OSM Map
General Map
Google Map
MSN Map
OSM Map
General Map
Google Map
MSN Map
Please wait while loading the map...
Real estate property taxes paid for housing units in 2022:
This zip code:
1.4% ($2,198)
Texas:
1.5% ($4,050)
Median real estate property taxes paid for housing units with mortgages in 2022: $3,174 (1.9%) Median real estate property taxes paid for housing units with no mortgage in 2022: $1,551 (1.2%)
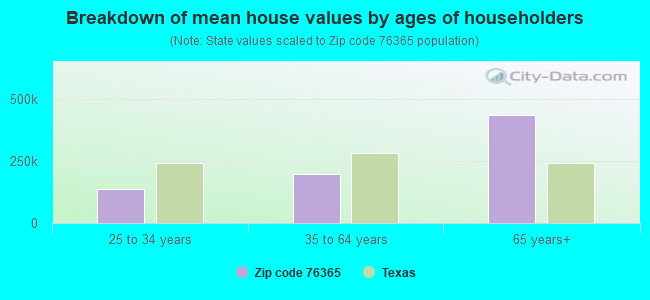
Estimated median house/condo value in 2022: $155,404
76365:
$155,404
Texas:
$275,400
According to our research of Texas and other state lists, there were 12 registered sex offenders living in 76365 zip code as of May 13, 2024. The ratio of all residents to sex offenders in zip code 76365 is 384 to 1. The ratio of registered sex offenders to all residents in this zip code is near the state average.
Median resident age:
This zip code:
46.0 years
Texas median age:
35.6 years
Average household size:
This zip code:
2.3 people
Texas:
2.6 people
Averages for the 2020 tax year for zip code 76365, filed in 2021:
Average Adjusted Gross Income (AGI) in 2020: $60,682 (Individual Income Tax Returns)
Here:
$60,682
State:
$77,054
Salary/wage: $51,906 (reported on 80.2% of returns)
Here:
$51,906
State:
$62,766
(% of AGI for various income ranges: 1131.7% for AGIs below $25k, 3311.0% for AGIs $25k-50k, 6048.3% for AGIs $50k-75k, 10065.6% for AGIs $75k-100k, 15632.0% for AGIs $100k-200k)
Taxable interest for individuals: $1,003 (reported on 28.1% of returns)
This zip code:
$1,003
Texas:
$2,665
(% of AGI for various income ranges: 14.8% for AGIs below $25k, 29.2% for AGIs $25k-50k, 44.2% for AGIs $50k-75k, 41.9% for AGIs $75k-100k, 79.0% for AGIs $100k-200k)
Ordinary dividends: $2,982 (reported on 15.7% of returns)
Here:
$2,982
State:
$10,044
(% of AGI for various income ranges: 24.0% for AGIs below $25k, 31.3% for AGIs $25k-50k, 70.4% for AGIs $50k-75k, 65.6% for AGIs $75k-100k, 149.5% for AGIs $100k-200k)
Net capital gain/loss in AGI: +$9,822 (reported on 14.7% of returns)
Here:
+$9,822
State:
+$39,590
(% of AGI for various income ranges: 46.2% for AGIs below $25k, 79.7% for AGIs $25k-50k, 143.8% for AGIs $50k-75k, 155.0% for AGIs $75k-100k, 566.5% for AGIs $100k-200k)
Profit/loss from business: +$12,588 (reported on 18.4% of returns)
Here:
+$12,588
State:
+$10,888
(% of AGI for various income ranges: 175.8% for AGIs below $25k, 225.1% for AGIs $25k-50k, 307.5% for AGIs $50k-75k, 309.4% for AGIs $75k-100k, 554.5% for AGIs $100k-200k)
Taxable individual retirement arrangement distribution: $16,100 (reported on 10.1% of returns)
76365:
$16,100
Texas:
$24,740
(% of AGI for various income ranges: 46.9% for AGIs below $25k, 71.8% for AGIs $25k-50k, 182.9% for AGIs $50k-75k, 346.2% for AGIs $75k-100k, 1012.5% for AGIs $100k-200k)
Total itemized deductions: $45,325 (reported on 3.7% of returns)
Here:
$45,325
State:
$40,428
(% of AGI for various income ranges: 294.9% for AGIs $25k-50k, 1238.0% for AGIs $100k-200k)
Charity contributions: $9,200 (reported on 2.8% of returns)
Here:
$9,200
State:
$18,201
(% of AGI for various income ranges: 47.7% for AGIs $25k-50k, 183.0% for AGIs $100k-200k)
Taxes paid: $4,762 (reported on 3.7% of returns)
76365:
$4,762
State:
$7,821
(% of AGI for various income ranges: 32.3% for AGIs $25k-50k, 127.5% for AGIs $100k-200k)
Earned income credit: $2,176 (reported on 15.7% of returns)
Here:
$2,176
State:
$2,584
(% of AGI for various income ranges: 92.5% for AGIs below $25k, 66.4% for AGIs $25k-50k)
Percentage of individuals using paid preparers for their 2020 taxes: 91.7%
Here:
92%
State:
92%
(% for various income ranges: 90.3% for AGIs below $25k, 92.0% for AGIs $25k-50k, 93.9% for AGIs $50k-75k, 91.7% for AGIs $75k-100k, 93.9% for AGIs $100k-200k, 80.0% for AGIs over 200k)
Averages for the 2012 tax year for zip code 76365, filed in 2013:
Average Adjusted Gross Income (AGI) in 2012: $50,620 (Individual Income Tax Returns)
Here:
$50,620
State:
$65,384
Salary/wage: $43,277 (reported on 80.8% of returns)
Here:
$43,277
State:
$52,524
(% of AGI for various income ranges: 70.8% for AGIs below $25k, 75.1% for AGIs $25k-50k, 80.3% for AGIs $50k-75k, 72.6% for AGIs $75k-100k, 68.3% for AGIs $100k-200k, 35.8% for AGIs over 200k)
Taxable interest for individuals: $1,197 (reported on 32.2% of returns)
This zip code:
$1,197
Texas:
$2,372
(% of AGI for various income ranges: 1.1% for AGIs below $25k, 0.9% for AGIs $25k-50k, 0.7% for AGIs $50k-75k, 0.6% for AGIs $75k-100k, 1.1% for AGIs $100k-200k, 0.1% for AGIs over 200k)
Ordinary dividends: $2,952 (reported on 14.9% of returns)
Here:
$2,952
State:
$9,721
(% of AGI for various income ranges: 1.1% for AGIs below $25k, 1.0% for AGIs $25k-50k, 0.6% for AGIs $50k-75k, 0.8% for AGIs $75k-100k, 0.5% for AGIs $100k-200k, 1.7% for AGIs over 200k)
Net capital gain/loss in AGI: +$15,261 (reported on 13.5% of returns)
Here:
+$15,261
State:
+$35,319
(% of AGI for various income ranges: 0.2% for AGIs below $25k, 0.6% for AGIs $25k-50k, 0.5% for AGIs $50k-75k, 1.7% for AGIs $75k-100k, 2.3% for AGIs $100k-200k, 24.7% for AGIs over 200k)
Profit/loss from business: +$13,883 (reported on 20.2% of returns)
Here:
+$13,883
State:
+$13,732
(% of AGI for various income ranges: 7.1% for AGIs below $25k, 3.8% for AGIs $25k-50k, 3.4% for AGIs $50k-75k, 4.2% for AGIs $75k-100k, 12.3% for AGIs $100k-200k)
Taxable individual retirement arrangement distribution: $10,791 (reported on 11.1% of returns)
76365:
$10,791
Texas:
$19,511
(% of AGI for various income ranges: 3.6% for AGIs below $25k, 2.7% for AGIs $25k-50k, 1.3% for AGIs $50k-75k, 3.0% for AGIs $75k-100k, 3.4% for AGIs $100k-200k)
Total itemized deductions: $20,850 (22% of AGI, reported on 20.2% of returns)
Here:
$20,850
State:
$24,724
Here:
22.4% of AGI
State:
15.9% of AGI
(% of AGI for various income ranges: 6.6% for AGIs below $25k, 8.3% for AGIs $25k-50k, 9.0% for AGIs $50k-75k, 9.0% for AGIs $75k-100k, 8.9% for AGIs $100k-200k, 6.4% for AGIs over 200k)
Charity contributions: $6,139 (reported on 14.9% of returns)
Here:
$6,139
State:
$6,808
(% of AGI for various income ranges: 0.7% for AGIs below $25k, 1.1% for AGIs $25k-50k, 1.4% for AGIs $50k-75k, 2.1% for AGIs $75k-100k, 2.2% for AGIs $100k-200k, 3.2% for AGIs over 200k)
Taxes paid: $4,798 (reported on 19.7% of returns)
76365:
$4,798
State:
$6,921
(% of AGI for various income ranges: 0.8% for AGIs below $25k, 1.8% for AGIs $25k-50k, 2.3% for AGIs $50k-75k, 2.0% for AGIs $75k-100k, 1.9% for AGIs $100k-200k, 1.7% for AGIs over 200k)
Earned income credit: $2,141 (reported on 17.8% of returns)
Here:
$2,141
State:
$2,570
(% of AGI for various income ranges: 6.4% for AGIs below $25k, 1.0% for AGIs $25k-50k)
Percentage of individuals using paid preparers for their 2012 taxes: 50.0%
Here:
50%
State:
51%
(% for various income ranges: 41.0% for AGIs below $25k, 50.0% for AGIs $25k-50k, 54.3% for AGIs $50k-75k, 54.5% for AGIs $75k-100k, 68.4% for AGIs $100k-200k, 75.0% for AGIs over 200k)
Averages for the 2004 tax year for zip code 76365, filed in 2005:
Average Adjusted Gross Income (AGI) in 2004: $34,933 (Individual Income Tax Returns)
Here:
$34,933
State:
$47,881
Salary/wage: $32,559 (reported on 81.9% of returns)
Here:
$32,559
State:
$41,947
(% of AGI for various income ranges: 140.7% for AGIs below $10k, 73.2% for AGIs $10k-25k, 79.9% for AGIs $25k-50k, 82.1% for AGIs $50k-75k, 79.6% for AGIs $75k-100k, 56.1% for AGIs over 100k)
Taxable interest for individuals: $2,175 (reported on 39.0% of returns)
This zip code:
$2,175
Texas:
$2,255
(% of AGI for various income ranges: 10.9% for AGIs below $10k, 2.4% for AGIs $10k-25k, 1.7% for AGIs $25k-50k, 1.9% for AGIs $50k-75k, 2.1% for AGIs $75k-100k, 3.7% for AGIs over 100k)
Taxable dividends: $1,324 (reported on 16.5% of returns)
Here:
$1,324
State:
$4,261
(% of AGI for various income ranges: 2.8% for AGIs below $10k, 1.0% for AGIs $10k-25k, 0.4% for AGIs $25k-50k, 0.4% for AGIs $50k-75k, 0.4% for AGIs $75k-100k, 0.9% for AGIs over 100k)
Net capital gain/loss: +$2,389 (reported on 16.4% of returns)
Here:
+$2,389
State:
+$16,110
(% of AGI for various income ranges: -2.3% for AGIs below $10k, 0.6% for AGIs $10k-25k, 0.8% for AGIs $25k-50k, 0.8% for AGIs $50k-75k, 0.7% for AGIs $75k-100k, 3.2% for AGIs over 100k)
Profit/loss from business: +$9,108 (reported on 18.7% of returns)
Here:
+$9,108
State:
+$11,013
(% of AGI for various income ranges: 7.9% for AGIs below $10k, 6.9% for AGIs $10k-25k, 3.7% for AGIs $25k-50k, 3.1% for AGIs $50k-75k, 4.2% for AGIs $75k-100k, 7.9% for AGIs over 100k)
IRA payment deduction: $3,613 (reported on 2.7% of returns)
76365:
$3,613
Texas:
$3,120
(% of AGI for various income ranges: 0.4% for AGIs $25k-50k, 0.2% for AGIs $50k-75k, 0.3% for AGIs $75k-100k, 0.4% for AGIs over 100k)
Total itemized deductions: $15,909 (24% of AGI, reported on 14.8% of returns)
Here:
$15,909
State:
$19,631
Here:
24.2% of AGI
State:
18.9% of AGI
(% of AGI for various income ranges: 7.3% for AGIs $10k-25k, 5.5% for AGIs $25k-50k, 6.4% for AGIs $50k-75k, 6.8% for AGIs $75k-100k, 9.6% for AGIs over 100k)
Charity contributions deductions: $4,538 (6% of AGI, reported on 11.4% of returns)
Here:
$4,538
State:
$4,753
Here:
6.3% of AGI
State:
4.2% of AGI
(% of AGI for various income ranges: 1.2% for AGIs $10k-25k, 0.8% for AGIs $25k-50k, 1.3% for AGIs $50k-75k, 1.6% for AGIs $75k-100k, 3.0% for AGIs over 100k)
Total tax: $4,567 (reported on 72.7% of returns)
76365:
$4,567
State:
$9,058
(% of AGI for various income ranges: 5.7% for AGIs below $10k, 4.1% for AGIs $10k-25k, 6.7% for AGIs $25k-50k, 8.5% for AGIs $50k-75k, 11.4% for AGIs $75k-100k, 18.5% for AGIs over 100k)
Earned income credit: $1,829 (reported on 18.0% of returns)
Here:
$1,829
State:
$2,024
Percentage of individuals using paid preparers for their 2004 taxes: 58.5%
Here:
58%
State:
57%
(% for various income ranges: 50.7% for AGIs below $10k, 59.7% for AGIs $10k-25k, 59.1% for AGIs $25k-50k, 59.7% for AGIs $50k-75k, 63.9% for AGIs $75k-100k, 73.0% for AGIs over 100k)
Household received Food Stamps/SNAP in the past 12 months: 217 Household did not receive Food Stamps/SNAP in the past 12 months: 1,793
Women who had a birth in the past 12 months: 97 (41 now married, 54 unmarried) Women who did not have a birth in the past 12 months: 923 (534 now married, 385 unmarried)
Housing units in zip code 76365 with a mortgage: 678 (25 second mortgage, 27 both second mortgage and home equity loan) Houses without a mortgage: 56
Median monthly owner costs for units with a mortgage: $1,297 Median monthly owner costs for units without a mortgage: $552
Residents with income below the poverty level in 2022:
This zip code:
9.3%
Whole state:
14.0%
Residents with income below 50% of the poverty level in 2022:
This zip code:
5.6%
Whole state:
7.4%
Median number of rooms in houses and condos:
Here:
6.2
State:
6.3
Median number of rooms in apartments:
Here:
4.6
State:
4.0
Notable locations in this zip code not listed on our city pages
Notable locations in zip code 76365: Edwards Ranch (A), Hapgood Ranch (B), Warren Ranch (C), Bluegrove Volunteer Fire Department (D), Joy Volunteer Fire Department (E), Lake Arrowhead Volunteer Fire Department West Side Station (F), Henrietta Volunteer Fire Department (G). Display/hide their locations on the map
Churches in zip code 76365 include: Trinity Episcopal Church (A), Church of Christ of Henrietta (B), Henrietta Primitive Baptist Church (C), Grace Temple Baptist Church (D), First Baptist Church (E). Display/hide their locations on the map
Cemeteries: Prospect Cemetery (1), Hurnville Cemetery (2), Cambridge Cemetery (3), Shannon Cemetery (4), Halsell Cemetery (5), Cullers Cemetery (6), Antelope Cemetery (7). Display/hide their locations on the map
Lakes and reservoirs: Henrietta Lake (A), Clay County Country Club Lake (B), Whitley Lake (C), Burns Lake (D), Fields Lake (E), Scaling Lake (F), Halsell Lake (G), Clay Unknown Lake Number 1 (H). Display/hide their locations on the map
Rivers and creeks: Turkey Creek (A), Bennett Creek (B), Willow Creek (C), Smith Creek (D), Little Pecan Creek (E), Lake Creek (F), Dry Fork Little Wichita River (G), Deer Creek (H), Russell Creek (I). Display/hide their locations on the map
Parks in zip code 76365 include: Little Post Oak Creek Park (1), Nocatee Park (2), North Park (3), Tonkawa Park (4), Hapgood Field (5), Delaware Trail Park (6), Crow Trace Point Park (7), Crow Trace Park (8), Deer Creek Park (9). Display/hide their locations on the map
In group quarters: 87 (-1 institutionalized population)
Size of family households: 631 2-persons, 311 3-persons, 171 4-persons, 126 5-persons, 1 6-persons, 40 7-or-more-persons
Size of nonfamily households: 687 1-person, 48 2-persons, 3 5-persons
529 married couples with children.
296 single-parent households (61 men, 235 women).
96.1% of residents of 76365 zip code speak English at home.
3.8% of residents speak Spanish at home (46% very well, 41% well, 5% not well, 8% not at all).
0.2% of residents speak Asian or Pacific Island language at home (100% very well).
0.2% of residents speak other language at home (100% very well).
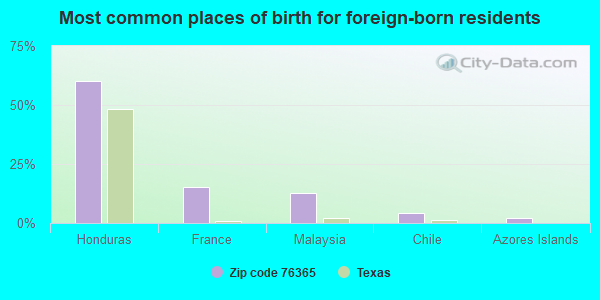
Foreign born population: 93 (2.0%) (44.8% of them are naturalized citizens)
This zip code:
2.0%
Whole state:
17.2%
60%Honduras
15%France
13%Malaysia
4%Chile
2%Azores Islands
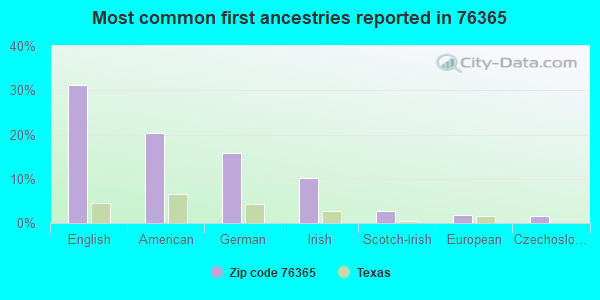
31%English
20%American
16%German
10%Irish
3%Scotch-Irish
2%European
2%Czechoslovakian
Year of entry for the foreign-born population
242010 or later
342000 to 2009
11990 to 1999
54Before 1990
Housing units lacking complete plumbing facilities: 8.3% Housing units lacking complete kitchen facilities: 2.6%
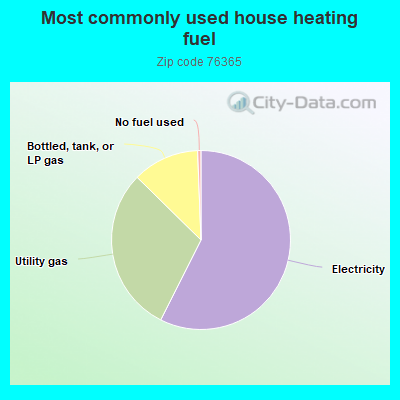
57.2%Electricity
29.8%Utility gas
12.0%Bottled, tank, or LP gas
0.6%No fuel used
Population in 1990: 6,020.
Place of birth for U.S.-born residents:
This state: 3,716
Northeast: 63
Midwest: 116
South: 283
West: 365
57% of the 76365 zip code residents lived in the same house 5 years ago. Out of people who lived in different houses, 44% lived in this county. Out of people who lived in different counties, 50% lived in Texas.
87% of the 76365 zip code residents lived in the same house 1 year ago. Out of people who lived in different houses, 30% moved from this county. Out of people who lived in different houses, 71% moved from different county within same state.
Private vs. public school enrollment:
Students in private schools in grades 1 to 8 (elementary and middle school): 11
Here:
2.2%
Texas:
8.8%
Students in private schools in grades 9 to 12 (high school):
Here:
0.0%
Texas:
8.0%
Students in private undergraduate colleges:
Here:
0.0%
Texas:
16.2%
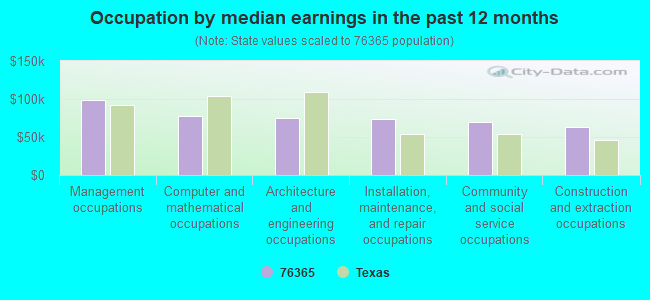
Occupation by median earnings in the past 12 months ($)
99,208Management occupations
77,762Computer and mathematical occupations
74,649Architecture and engineering occupations
73,299Installation, maintenance, and repair occupations
69,206Community and social service occupations
63,632Construction and extraction occupations
Companies with federal contracts located in this zip code:
AIRCO PLUMBING & SHEET METAL I (916 E OMEGA ST in HENRIETTA, TX; small business) : $99,792 in 6 contractsfrom 2004 to 2005
Contracts for Maintenance, Repair or Alteration of Real Property -- Miscellaneous Buildings by Air Force Signed by year:2000: $0; 2001: $0; 2002: $0; 2003: $0; 2004: $51,071; 2005: $48,721; 2006: $0.
Biggest contracts:
$45,492 with Air Force for Maintenance, Repair or Alteration of Real Property -- Miscellaneous Buildings. Signed on 2005-09-19. Completion date: 2006-01-31.
$19,960, same as above.Signed on 2004-08-04. Completion date: 2004-10-10.
$15,907, same as above.Signed on 2004-05-17. Completion date: 2004-06-24.
$8,741, same as above.Signed on 2004-09-28. Completion date: 2004-10-10.
Top industries in this zip code by the number of employees in 2005:
Administrative and Support and Waste Management and Remediation Services: Professional Employer Organizations (100-249 employees: 1 establishment)
Health Care and Social Assistance: Nursing Care Facilities (50-99: 1)
Health Care and Social Assistance: General Medical and Surgical Hospitals (50-99: 1)
Other Services (except Public Administration): Religious Organizations (20-49: 1, 10-19: 1, 5-9: 2, 1-4: 3)
Construction: Plumbing, Heating, and Air-Conditioning Contractors (20-49: 1, 5-9: 1)
Construction: Power and Communication Line and Related Structures Construction (20-49: 1)
People in group quarters in 2010:
45 people in nursing facilities/skilled-nursing facilities
25 people in local jails and other municipal confinement facilities
People in group quarters in 2000:
61 people in nursing homes
25 people in local jails and other confinement facilities (including police lockups)
8 people in other noninstitutional group quarters
Fatal accident statistics in 2013:
Fatal accident count: 2
Vehicles involved in fatal accidents: 3
Fatal accidents caused by drunken drivers: 1
Fatalities: 2
Persons involved in fatal accidents: 3
Pedestrians involved in fatal accidents: 0
Fatal accident statistics in 2012:
Fatal accident count: 1
Vehicles involved in fatal accidents: 1
Fatal accidents caused by drunken drivers: 0
Fatalities: 1
Persons involved in fatal accidents: 1
Pedestrians involved in fatal accidents: 0
2002 - 2018 National Fire Incident Reporting System (NFIRS) incidents
Based on the data from the years 2002 - 2018 the average number of fires per year is 37. The highest number of reported fires - 110 took place in 2008, and the least - 4 in 2004. The data has an increasing trend.
When looking into fire subcategories, the most reports belonged to: Outside Fires (80.5%), and Structure Fires (11.5%).
Fire incident types reported to NFIRS in Zip Code 76365

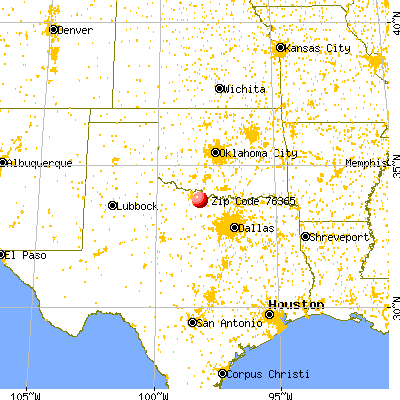


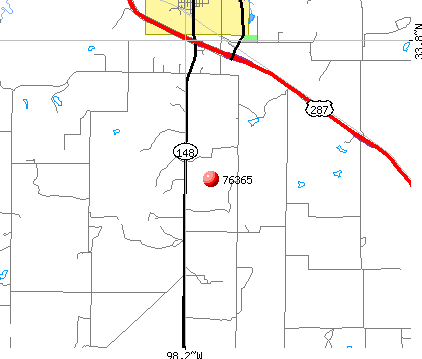 Nearest zip codes: 76228, 76261, 76377, 76379, 76302, 76305.


 : $99,792 in 6 contracts from 2004 to 2005

 Based on the data from the years 2002 - 2018 the average number of fires per year is 37. The highest number of reported fires - 110 took place in 2008, and the least - 4 in 2004. The data has an increasing trend.
 When looking into fire subcategories, the most reports belonged to: Outside Fires (80.5%), and Structure Fires (11.5%).