Estimated zip code population in 2022: 2,090 Zip code population in 2010: 1,774 Zip code population in 2000: 1,386
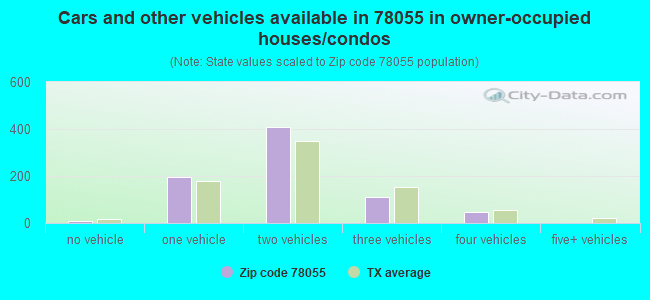
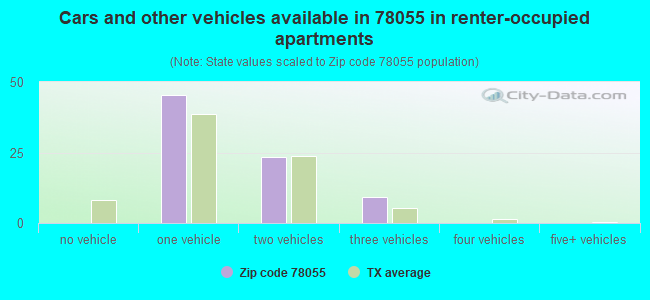
Houses and condos: 1,209 Renter-occupied apartments: 78
% of renters here:
9%
State:
38%
March 2022 cost of living index in zip code 78055: 80.3 (low, U.S. average is 100)
Land area: 237.0 sq. mi. Water area: 0.8 sq. mi.
Population density: 9 people per square mile
(very low).
OSM Map
General Map
Google Map
MSN Map
OSM Map
General Map
Google Map
MSN Map
OSM Map
General Map
Google Map
MSN Map
OSM Map
General Map
Google Map
MSN Map
Please wait while loading the map...
Real estate property taxes paid for housing units in 2022:
This zip code:
1.0% ($2,550)
Texas:
1.5% ($4,050)
Median real estate property taxes paid for housing units with mortgages in 2022: $2,485 (0.9%) Median real estate property taxes paid for housing units with no mortgage in 2022: $2,657 (1.1%)
Estimated median house/condo value in 2022: $248,786
78055:
$248,786
Texas:
$275,400
According to our research of Texas and other state lists, there were 5 registered sex offenders living in 78055 zip code as of April 29, 2024. The ratio of all residents to sex offenders in zip code 78055 is 406 to 1. The ratio of registered sex offenders to all residents in this zip code is near the state average.
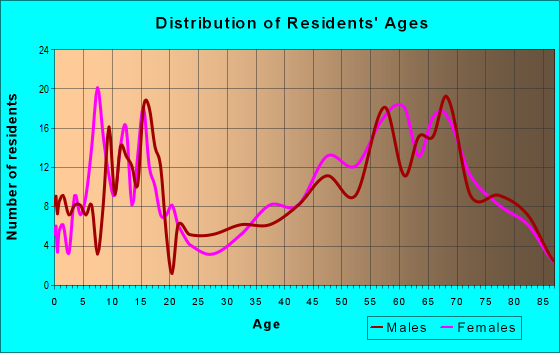
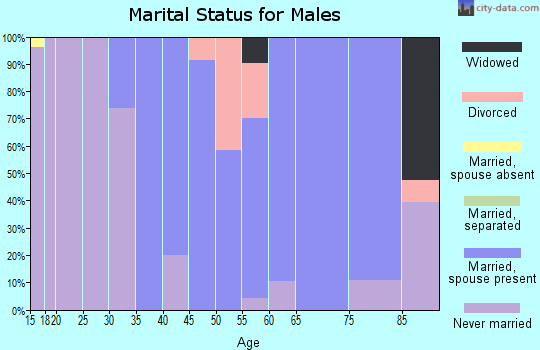
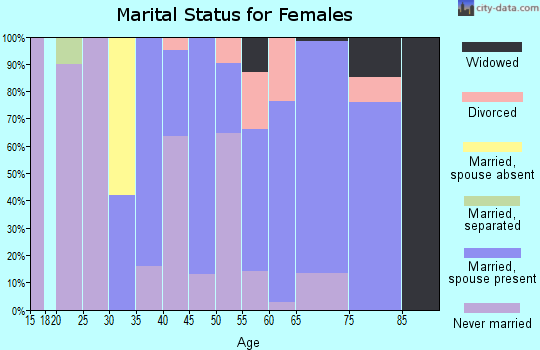
Median resident age:
This zip code:
56.4 years
Texas median age:
35.6 years
Average household size:
This zip code:
2.1 people
Texas:
2.6 people
Averages for the 2020 tax year for zip code 78055, filed in 2021:
Average Adjusted Gross Income (AGI) in 2020: $75,155 (Individual Income Tax Returns)
Here:
$75,155
State:
$77,054
Salary/wage: $50,683 (reported on 60.0% of returns)
Here:
$50,683
State:
$62,766
(% of AGI for various income ranges: 1110.6% for AGIs below $25k, 3121.5% for AGIs $25k-50k, 6385.7% for AGIs $50k-75k, 8270.0% for AGIs $75k-100k, 12266.7% for AGIs $100k-200k)
Taxable interest for individuals: $2,561 (reported on 38.8% of returns)
This zip code:
$2,561
Texas:
$2,665
(% of AGI for various income ranges: 32.4% for AGIs below $25k, 54.6% for AGIs $25k-50k, 145.7% for AGIs $50k-75k, 243.3% for AGIs $75k-100k, 270.0% for AGIs $100k-200k)
Ordinary dividends: $14,419 (reported on 26.2% of returns)
Here:
$14,419
State:
$10,044
(% of AGI for various income ranges: 67.1% for AGIs below $25k, 217.7% for AGIs $25k-50k, 281.4% for AGIs $50k-75k, 523.3% for AGIs $75k-100k, 1306.7% for AGIs $100k-200k)
Net capital gain/loss in AGI: +$34,900 (reported on 25.0% of returns)
Here:
+$34,900
State:
+$39,590
(% of AGI for various income ranges: 19.4% for AGIs below $25k, 40.0% for AGIs $25k-50k, 255.7% for AGIs $50k-75k, 1081.7% for AGIs $100k-200k)
Profit/loss from business: +$13,990 (reported on 26.2% of returns)
Here:
+$13,990
State:
+$10,888
(% of AGI for various income ranges: 399.4% for AGIs below $25k, 613.1% for AGIs $25k-50k, 425.7% for AGIs $50k-75k, 1940.0% for AGIs $100k-200k)
Taxable individual retirement arrangement distribution: $27,917 (reported on 15.0% of returns)
78055:
$27,917
Texas:
$24,740
(% of AGI for various income ranges: 105.9% for AGIs below $25k, 254.6% for AGIs $25k-50k, 708.6% for AGIs $50k-75k, 3905.0% for AGIs $100k-200k)
Total itemized deductions: $37,150 (reported on 5.0% of returns)
Here:
$37,150
State:
$40,428
(% of AGI for various income ranges: 2476.7% for AGIs $100k-200k)
Charity contributions: $19,900 (reported on 2.5% of returns)
Here:
$19,900
State:
$18,201
(% of AGI for various income ranges: 306.2% for AGIs $25k-50k)
Taxes paid: $6,100 (reported on 5.0% of returns)
78055:
$6,100
State:
$7,821
(% of AGI for various income ranges: 406.7% for AGIs $100k-200k)
Earned income credit: $2,600 (reported on 15.0% of returns)
Here:
$2,600
State:
$2,584
(% of AGI for various income ranges: 130.0% for AGIs below $25k, 70.0% for AGIs $25k-50k)
Percentage of individuals using paid preparers for their 2020 taxes: 93.8%
Here:
94%
State:
92%
(% for various income ranges: 89.3% for AGIs below $25k, 94.4% for AGIs $25k-50k, 92.3% for AGIs $50k-75k, 100.0% for AGIs $75k-100k, 100.0% for AGIs $100k-200k, 100.0% for AGIs over 200k)
Averages for the 2012 tax year for zip code 78055, filed in 2013:
Average Adjusted Gross Income (AGI) in 2012: $73,012 (Individual Income Tax Returns)
Here:
$73,012
State:
$65,384
Salary/wage: $42,614 (reported on 69.4% of returns)
Here:
$42,614
State:
$52,524
(% of AGI for various income ranges: 67.2% for AGIs below $25k, 61.9% for AGIs $25k-50k, 63.8% for AGIs $50k-75k, 53.8% for AGIs $75k-100k, 116.9% for AGIs $100k-200k)
Taxable interest for individuals: $2,014 (reported on 40.3% of returns)
This zip code:
$2,014
Texas:
$2,372
(% of AGI for various income ranges: 2.4% for AGIs below $25k, 0.8% for AGIs $25k-50k, 1.1% for AGIs $50k-75k, 0.7% for AGIs $75k-100k, 1.6% for AGIs $100k-200k, 1.0% for AGIs over 200k)
Ordinary dividends: $10,141 (reported on 23.6% of returns)
Here:
$10,141
State:
$9,721
(% of AGI for various income ranges: 3.2% for AGIs below $25k, 2.4% for AGIs $25k-50k, 3.4% for AGIs $50k-75k, 3.9% for AGIs $100k-200k, 4.0% for AGIs over 200k)
Net capital gain/loss in AGI: +$46,462 (reported on 18.1% of returns)
Here:
+$46,462
State:
+$35,319
(% of AGI for various income ranges: 3.1% for AGIs $50k-75k, 5.5% for AGIs $100k-200k, 22.7% for AGIs over 200k)
Profit/loss from business: +$12,284 (reported on 26.4% of returns)
Here:
+$12,284
State:
+$13,732
(% of AGI for various income ranges: 14.6% for AGIs below $25k, 6.0% for AGIs $25k-50k, 9.1% for AGIs $50k-75k, 12.4% for AGIs $100k-200k)
Taxable individual retirement arrangement distribution: $16,820 (reported on 13.9% of returns)
78055:
$16,820
Texas:
$19,511
(% of AGI for various income ranges: 4.6% for AGIs below $25k, 9.4% for AGIs $25k-50k, 17.5% for AGIs $75k-100k)
Total itemized deductions: $26,118 (20% of AGI, reported on 23.6% of returns)
Here:
$26,118
State:
$24,724
Here:
20.5% of AGI
State:
15.9% of AGI
(% of AGI for various income ranges: 11.0% for AGIs below $25k, 10.1% for AGIs $25k-50k, 8.9% for AGIs $50k-75k, 9.1% for AGIs $75k-100k, 15.6% for AGIs $100k-200k, 5.3% for AGIs over 200k)
Charity contributions: $8,918 (reported on 15.3% of returns)
Here:
$8,918
State:
$6,808
(% of AGI for various income ranges: 1.6% for AGIs $25k-50k, 2.2% for AGIs $50k-75k, 3.3% for AGIs $100k-200k, 2.1% for AGIs over 200k)
Taxes paid: $6,831 (reported on 22.2% of returns)
78055:
$6,831
State:
$6,921
(% of AGI for various income ranges: 1.9% for AGIs below $25k, 2.2% for AGIs $25k-50k, 2.2% for AGIs $50k-75k, 2.6% for AGIs $75k-100k, 4.4% for AGIs $100k-200k, 1.3% for AGIs over 200k)
Earned income credit: $1,992 (reported on 18.1% of returns)
Here:
$1,992
State:
$2,570
(% of AGI for various income ranges: 5.6% for AGIs below $25k, 1.1% for AGIs $25k-50k)
Percentage of individuals using paid preparers for their 2012 taxes: 55.6%
Here:
56%
State:
51%
(% for various income ranges: 53.3% for AGIs below $25k, 52.9% for AGIs $25k-50k, 54.5% for AGIs $50k-75k, 66.7% for AGIs $75k-100k, 60.0% for AGIs $100k-200k, 66.7% for AGIs over 200k)
Averages for the 2004 tax year for zip code 78055, filed in 2005:
Average Adjusted Gross Income (AGI) in 2004: $46,184 (Individual Income Tax Returns)
Here:
$46,184
State:
$47,881
Salary/wage: $33,335 (reported on 74.0% of returns)
Here:
$33,335
State:
$41,947
(% of AGI for various income ranges: 72.0% for AGIs below $10k, 68.8% for AGIs $10k-25k, 68.8% for AGIs $25k-50k, 67.0% for AGIs $50k-75k, 55.7% for AGIs $75k-100k, 36.7% for AGIs over 100k)
Taxable interest for individuals: $2,683 (reported on 45.7% of returns)
This zip code:
$2,683
Texas:
$2,255
(% of AGI for various income ranges: 6.6% for AGIs below $10k, 3.9% for AGIs $10k-25k, 1.8% for AGIs $25k-50k, 1.4% for AGIs $50k-75k, 0.3% for AGIs $75k-100k, 3.5% for AGIs over 100k)
Taxable dividends: $4,669 (reported on 24.3% of returns)
Here:
$4,669
State:
$4,261
(% of AGI for various income ranges: 2.9% for AGIs below $10k, 1.5% for AGIs $10k-25k, 1.6% for AGIs $25k-50k, 0.3% for AGIs $50k-75k, 1.4% for AGIs $75k-100k, 4.0% for AGIs over 100k)
Net capital gain/loss: +$27,980 (reported on 22.5% of returns)
Here:
+$27,980
State:
+$16,110
(% of AGI for various income ranges: 9.4% for AGIs below $10k, 0.2% for AGIs $10k-25k, 0.0% for AGIs $25k-50k, 0.2% for AGIs $50k-75k, 3.7% for AGIs $75k-100k, 30.1% for AGIs over 100k)
Profit/loss from business: +$7,505 (reported on 28.1% of returns)
Here:
+$7,505
State:
+$11,013
(% of AGI for various income ranges: 22.1% for AGIs below $10k, 10.8% for AGIs $10k-25k, 6.8% for AGIs $25k-50k, 7.0% for AGIs $50k-75k, 1.3% for AGIs over 100k)
IRA payment deduction: $2,895 (reported on 2.8% of returns)
78055:
$2,895
Texas:
$3,120
Total itemized deductions: $18,371 (17% of AGI, reported on 19.7% of returns)
Here:
$18,371
State:
$19,631
Here:
17.1% of AGI
State:
18.9% of AGI
(% of AGI for various income ranges: 11.6% for AGIs $10k-25k, 8.5% for AGIs $25k-50k, 7.9% for AGIs $50k-75k, 8.7% for AGIs $75k-100k, 6.8% for AGIs over 100k)
Charity contributions deductions: $4,276 (4% of AGI, reported on 15.7% of returns)
Here:
$4,276
State:
$4,753
Here:
3.8% of AGI
State:
4.2% of AGI
(% of AGI for various income ranges: 1.3% for AGIs $10k-25k, 1.4% for AGIs $25k-50k, 1.7% for AGIs $50k-75k, 1.0% for AGIs $75k-100k, 1.6% for AGIs over 100k)
Total tax: $7,383 (reported on 75.5% of returns)
78055:
$7,383
State:
$9,058
(% of AGI for various income ranges: 4.6% for AGIs below $10k, 4.9% for AGIs $10k-25k, 6.5% for AGIs $25k-50k, 9.5% for AGIs $50k-75k, 11.2% for AGIs $75k-100k, 17.6% for AGIs over 100k)
Earned income credit: $1,693 (reported on 19.0% of returns)
Here:
$1,693
State:
$2,024
Percentage of individuals using paid preparers for their 2004 taxes: 52.7%
Here:
53%
State:
57%
(% for various income ranges: 46.4% for AGIs below $10k, 47.8% for AGIs $10k-25k, 55.6% for AGIs $25k-50k, 52.3% for AGIs $50k-75k, 62.5% for AGIs $75k-100k, 77.1% for AGIs over 100k)
Household received Food Stamps/SNAP in the past 12 months: 40 Household did not receive Food Stamps/SNAP in the past 12 months: 807
Women who had a birth in the past 12 months: 8 (0 now married, 7 unmarried) Women who did not have a birth in the past 12 months: 411 (141 now married, 270 unmarried)
Housing units in zip code 78055 with a mortgage: 260 Median monthly owner costs for units with a mortgage: $1,256 Median monthly owner costs for units without a mortgage: $477
Residents with income below the poverty level in 2022:
This zip code:
20.0%
Whole state:
14.0%
Residents with income below 50% of the poverty level in 2022:
This zip code:
12.7%
Whole state:
7.4%
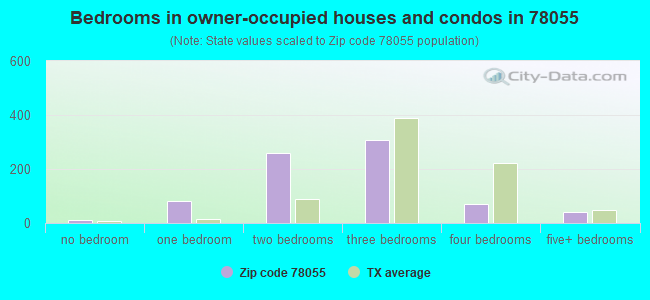
Median number of rooms in houses and condos:
Here:
5.1
State:
6.3
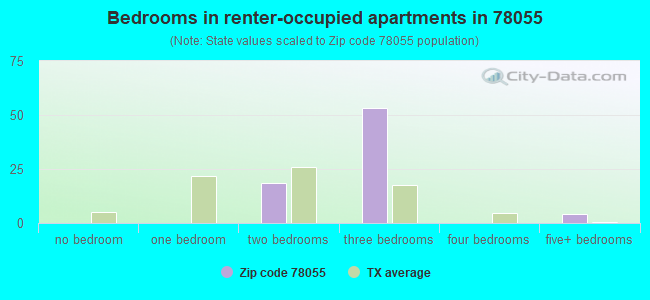
Median number of rooms in apartments:
Here:
6.4
State:
4.0
Notable locations in this zip code not listed on our city pages
Notable locations in zip code 78055: Circle R Sky Ranch (A), Cripple Creek Ranch (B), Honey Creek Ranch (C), Horse Valley Ranch (D), Pecan Ranch (E), Rock Chimney Ranch (F), Rocky River Ranch (G), Echo Hill Ranch (H), El Paraiso Ranch (I), Porter Ranch (J), Reed Ranch (K), White Ranch (L), A Bar A Ranch (M), Anchor T Ranch (N), Medina Volunteer Fire Department (O), Medina Childrens Home (P). Display/hide their locations on the map
Cemeteries: Means Cemetery (1), Honey Creek Cemetery (2), Hillman Cemetery (3), West Prong Cemetery (4), Baker Cemetery (5), Goodman Cemetery (6), Bauerlein Cemetery (7). Display/hide their locations on the map
Reservoirs: Voss Lake (A), Gallant Lake (B), Thompson Lake (C), Garrison Lake (D), Tatum Lake (E), Johnson Lake (F), Brewington Creek Ranch Lake (G), Falls Lake (H). Display/hide their locations on the map
Streams, rivers, and creeks: Bottle Springs Creek (A), Big Armidge Creek (B), Bauerlein Creek (C), Benton Creek (D), West Prong Medina River (E), Slippery Creek (F), Slideoff Creek (G), Ryle Creek (H), Robinson Creek (I). Display/hide their locations on the map
In group quarters: 309 (-1 institutionalized population)
Size of family households: 338 2-persons, 95 3-persons, 161 4-persons, 2 6-persons, 1 7-or-more-persons
Size of nonfamily households: 231 1-person, 21 2-persons
164 married couples with children.
66 single-parent households (66 women).
94.5% of residents of 78055 zip code speak English at home.
5.9% of residents speak Spanish at home (60% very well, 40% well).
0.2% of residents speak other Indo-European language at home (100% very well).
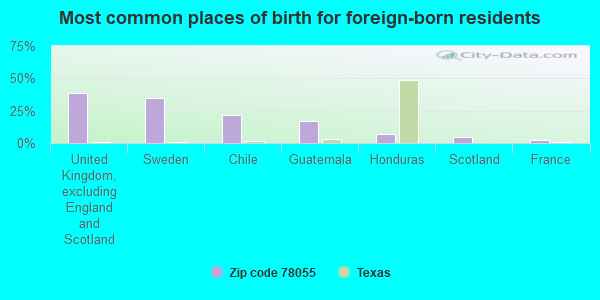
Foreign born population: 165 (7.9%) (55.8% of them are naturalized citizens)
This zip code:
7.9%
Whole state:
17.2%
39%United Kingdom, excluding England and Scotland
35%Sweden
21%Chile
17%Guatemala
7%Honduras
4%Scotland
2%France
17%English
13%American
10%German
9%Irish
3%French Canadian
2%Italian
2%Russian
Year of entry for the foreign-born population
632010 or later
822000 to 2009
01990 to 1999
73Before 1990
Housing units lacking complete plumbing facilities: 5.1% Housing units lacking complete kitchen facilities: 3.5%
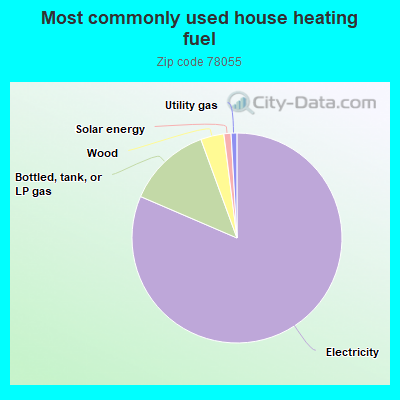
81.8%Electricity
13.0%Bottled, tank, or LP gas
3.6%Wood
1.1%Solar energy
0.9%Utility gas
Population in 1990: 1,590.
Place of birth for U.S.-born residents:
This state: 1,353
Northeast: 89
Midwest: 242
South: 124
West: 50
50% of the 78055 zip code residents lived in the same house 5 years ago. Out of people who lived in different houses, 26% lived in this county. Out of people who lived in different counties, 50% lived in Texas.
89% of the 78055 zip code residents lived in the same house 1 year ago. Out of people who lived in different houses, 37% moved from this county. Out of people who lived in different houses, 52% moved from different county within same state. Out of people who lived in different houses, 12% moved from abroad.
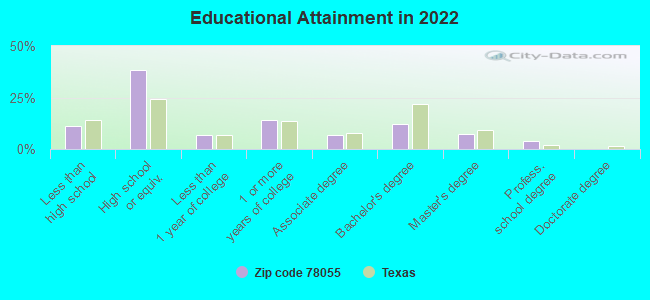
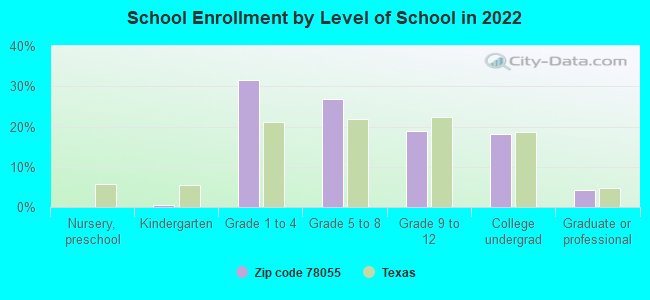
Private vs. public school enrollment:
Students in private schools in grades 1 to 8 (elementary and middle school): 22
Here:
14.8%
Texas:
8.8%
Students in private schools in grades 9 to 12 (high school): 2
Here:
4.4%
Texas:
8.0%
Students in private undergraduate colleges:
Here:
0.0%
Texas:
16.2%
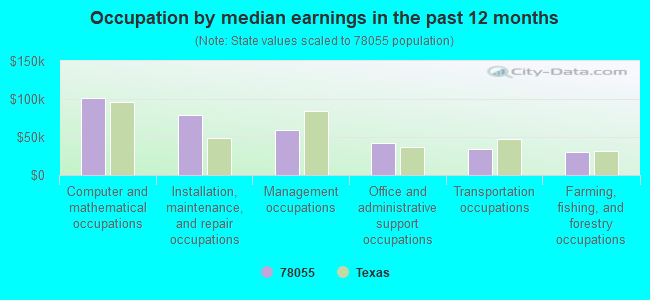
Occupation by median earnings in the past 12 months ($)
101,054Computer and mathematical occupations
78,304Installation, maintenance, and repair occupations
58,756Management occupations
41,893Office and administrative support occupations
33,611Transportation occupations
30,578Farming, fishing, and forestry occupations
Companies with federal contracts located in this zip code:
THOMPSON, PATTY (1616 MICKLE CREEK RD in MEDINA, TX; small business)
$4,426 with Defense Logistics Agency for Fastening Device. Signed on 2005-04-23. Completion date: 2005-06-09.
Top industries in this zip code by the number of employees in 2005:
Health Care and Social Assistance: Other Residential Care Facilities (50-99 employees: 1 establishment)
Accommodation and Food Services: Full-Service Restaurants (10-19: 1)
Real Estate and Rental and Leasing: Lessors of Miniwarehouses and Self-Storage Units (10-19: 1)
Other Services (except Public Administration): Religious Organizations (5-9: 1, 1-4: 1)
Construction: New Single-Family Housing Construction (except Operative Builders) (5-9: 1)
Wholesale Trade: Petroleum Bulk Stations and Terminals (5-9: 1)
Construction: Other Foundation, Structure, and Building Exterior Contractors (5-9: 1)
118 people in group homes for juveniles (non-correctional)
34 people in workers' group living quarters and job corps centers
People in group quarters in 2000:
121 people in other noninstitutional group quarters
3 people in agriculture workers' dormitories on farms
Fatal accident statistics in 2014:
Fatal accident count: 1
Vehicles involved in fatal accidents: 1
Fatal accidents caused by drunken drivers: 0
Fatalities: 1
Persons involved in fatal accidents: 1
Pedestrians involved in fatal accidents: 0
Fatal accident statistics in 2011:
Fatal accident count: 1
Vehicles involved in fatal accidents: 1
Fatal accidents caused by drunken drivers: 1
Fatalities: 1
Persons involved in fatal accidents: 2
Pedestrians involved in fatal accidents: 0
2002 - 2017 National Fire Incident Reporting System (NFIRS) incidents
Based on the data from the years 2002 - 2017 the average number of fire incidents per year is 16. The highest number of fire incidents - 39 took place in 2006, and the least - 0 in 2003. The data has a declining trend.
When looking into fire subcategories, the most reports belonged to: Outside Fires (84.4%), and Structure Fires (9.6%).
Fire incident types reported to NFIRS in Zip Code 78055


 Nearest zip codes: 78883, 78885, 78025, 78884, 78028, 78003.


 Based on the data from the years 2002 - 2017 the average number of fire incidents per year is 16. The highest number of fire incidents - 39 took place in 2006, and the least - 0 in 2003. The data has a declining trend.
 When looking into fire subcategories, the most reports belonged to: Outside Fires (84.4%), and Structure Fires (9.6%).