Estimated zip code population in 2022: 3,993 Zip code population in 2010: 3,380 Zip code population in 2000: 3,386
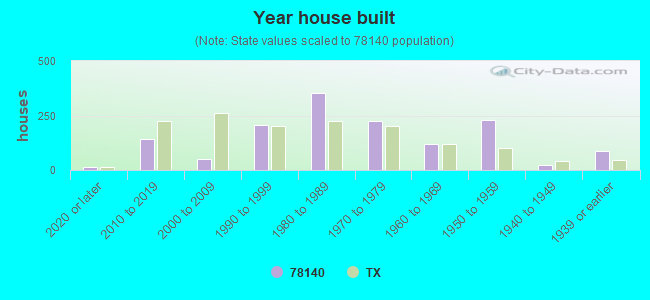
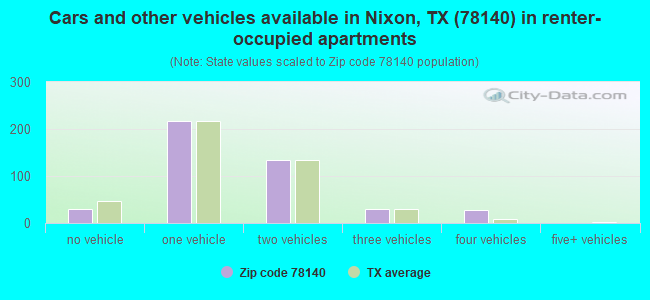
Houses and condos: 1,531 Renter-occupied apartments: 440
% of renters here:
33%
State:
38%
March 2022 cost of living index in zip code 78140: 77.9 (low, U.S. average is 100)
Land area: 145.0 sq. mi. Water area: 0.6 sq. mi.
Population density: 28 people per square mile
(very low).
OSM Map
General Map
Google Map
MSN Map
OSM Map
General Map
Google Map
MSN Map
OSM Map
General Map
Google Map
MSN Map
OSM Map
General Map
Google Map
MSN Map
Please wait while loading the map...
Real estate property taxes paid for housing units in 2022:
This zip code:
1.2% ($1,298)
Texas:
1.5% ($4,050)
Median real estate property taxes paid for housing units with mortgages in 2022: $1,149 (1.5%) Median real estate property taxes paid for housing units with no mortgage in 2022: $1,391 (1.1%)
Averages for the 2020 tax year for zip code 78140, filed in 2021:
Average Adjusted Gross Income (AGI) in 2020: $51,075 (Individual Income Tax Returns)
Here:
$51,075
State:
$77,054
Salary/wage: $39,798 (reported on 86.0% of returns)
Here:
$39,798
State:
$62,766
(% of AGI for various income ranges: 1334.4% for AGIs below $25k, 4050.3% for AGIs $25k-50k, 7694.7% for AGIs $50k-75k, 10491.4% for AGIs $75k-100k, 13408.6% for AGIs $100k-200k)
Taxable interest for individuals: $1,738 (reported on 18.5% of returns)
This zip code:
$1,738
Texas:
$2,665
(% of AGI for various income ranges: 3.8% for AGIs below $25k, 7.2% for AGIs $25k-50k, 11.3% for AGIs $50k-75k, 20.0% for AGIs $75k-100k, 165.7% for AGIs $100k-200k)
Ordinary dividends: $3,008 (reported on 8.3% of returns)
Here:
$3,008
State:
$10,044
(% of AGI for various income ranges: 4.4% for AGIs below $25k, 10.3% for AGIs $25k-50k, 38.7% for AGIs $50k-75k, 55.7% for AGIs $75k-100k, 334.3% for AGIs $100k-200k)
Net capital gain/loss in AGI: +$10,258 (reported on 7.6% of returns)
Here:
+$10,258
State:
+$39,590
(% of AGI for various income ranges: 14.4% for AGIs below $25k, 109.3% for AGIs $50k-75k, 1431.4% for AGIs $100k-200k)
Profit/loss from business: +$13,380 (reported on 12.7% of returns)
Here:
+$13,380
State:
+$10,888
(% of AGI for various income ranges: 177.6% for AGIs below $25k, 109.0% for AGIs $25k-50k, 331.3% for AGIs $50k-75k, 1364.3% for AGIs $100k-200k)
Taxable individual retirement arrangement distribution: $14,400 (reported on 3.2% of returns)
78140:
$14,400
Texas:
$24,740
(% of AGI for various income ranges: 46.2% for AGIs below $25k, 731.4% for AGIs $75k-100k)
Total itemized deductions: $39,350 (reported on 1.3% of returns)
Here:
$39,350
State:
$40,428
(% of AGI for various income ranges: 524.7% for AGIs $50k-75k)
Taxes paid: $6,700 (reported on 1.3% of returns)
78140:
$6,700
State:
$7,821
(% of AGI for various income ranges: 89.3% for AGIs $50k-75k)
Earned income credit: $2,595 (reported on 26.1% of returns)
Here:
$2,595
State:
$2,584
(% of AGI for various income ranges: 143.6% for AGIs below $25k, 107.2% for AGIs $25k-50k)
Percentage of individuals using paid preparers for their 2020 taxes: 93.6%
Here:
94%
State:
92%
(% for various income ranges: 93.1% for AGIs below $25k, 92.2% for AGIs $25k-50k, 95.5% for AGIs $50k-75k, 100.0% for AGIs $75k-100k, 91.7% for AGIs $100k-200k, 100.0% for AGIs over 200k)
Averages for the 2012 tax year for zip code 78140, filed in 2013:
Average Adjusted Gross Income (AGI) in 2012: $47,759 (Individual Income Tax Returns)
Here:
$47,759
State:
$65,384
Salary/wage: $34,846 (reported on 90.7% of returns)
Here:
$34,846
State:
$52,524
(% of AGI for various income ranges: 87.0% for AGIs below $25k, 91.3% for AGIs $25k-50k, 81.4% for AGIs $50k-75k, 87.1% for AGIs $75k-100k, 100.4% for AGIs $100k-200k)
Taxable interest for individuals: $1,500 (reported on 15.7% of returns)
This zip code:
$1,500
Texas:
$2,372
(% of AGI for various income ranges: 0.4% for AGIs below $25k, 0.1% for AGIs $25k-50k, 0.6% for AGIs $50k-75k, 0.4% for AGIs $100k-200k, 1.0% for AGIs over 200k)
Ordinary dividends: $1,790 (reported on 7.1% of returns)
Here:
$1,790
State:
$9,721
(% of AGI for various income ranges: 0.2% for AGIs below $25k, 0.4% for AGIs $50k-75k, 1.2% for AGIs $100k-200k)
Net capital gain/loss in AGI: +$11,525 (reported on 5.7% of returns)
Here:
+$11,525
State:
+$35,319
Profit/loss from business: +$18,524 (reported on 12.1% of returns)
Here:
+$18,524
State:
+$13,732
(% of AGI for various income ranges: 5.7% for AGIs below $25k, 2.4% for AGIs $25k-50k, 2.6% for AGIs $50k-75k, 21.0% for AGIs $100k-200k)
Taxable individual retirement arrangement distribution: $7,520 (reported on 3.6% of returns)
78140:
$7,520
Texas:
$19,511
Total itemized deductions: $19,033 (18% of AGI, reported on 8.6% of returns)
Here:
$19,033
State:
$24,724
Here:
17.6% of AGI
State:
15.9% of AGI
(% of AGI for various income ranges: 3.4% for AGIs $25k-50k, 9.1% for AGIs $50k-75k, 8.9% for AGIs $100k-200k)
Charity contributions: $4,233 (reported on 4.3% of returns)
Here:
$4,233
State:
$6,808
Taxes paid: $3,891 (reported on 7.9% of returns)
78140:
$3,891
State:
$6,921
(% of AGI for various income ranges: 0.5% for AGIs $25k-50k, 1.7% for AGIs $50k-75k, 1.9% for AGIs $100k-200k)
Earned income credit: $2,476 (reported on 30.0% of returns)
Here:
$2,476
State:
$2,570
(% of AGI for various income ranges: 8.8% for AGIs below $25k, 1.8% for AGIs $25k-50k)
Percentage of individuals using paid preparers for their 2012 taxes: 57.9%
Here:
58%
State:
51%
(% for various income ranges: 48.4% for AGIs below $25k, 61.0% for AGIs $25k-50k, 64.7% for AGIs $50k-75k, 71.4% for AGIs $75k-100k, 75.0% for AGIs $100k-200k, 100.0% for AGIs over 200k)
Averages for the 2004 tax year for zip code 78140, filed in 2005:
Average Adjusted Gross Income (AGI) in 2004: $30,949 (Individual Income Tax Returns)
Here:
$30,949
State:
$47,881
Salary/wage: $27,571 (reported on 87.8% of returns)
Here:
$27,571
State:
$41,947
(% of AGI for various income ranges: 141.5% for AGIs below $10k, 88.7% for AGIs $10k-25k, 90.6% for AGIs $25k-50k, 83.1% for AGIs $50k-75k, 75.3% for AGIs $75k-100k, 47.8% for AGIs over 100k)
Taxable interest for individuals: $2,623 (reported on 24.6% of returns)
This zip code:
$2,623
Texas:
$2,255
(% of AGI for various income ranges: 5.1% for AGIs below $10k, 1.1% for AGIs $10k-25k, 1.0% for AGIs $25k-50k, 1.1% for AGIs $50k-75k, 3.2% for AGIs $75k-100k, 4.0% for AGIs over 100k)
Taxable dividends: $1,226 (reported on 10.8% of returns)
Here:
$1,226
State:
$4,261
(% of AGI for various income ranges: 1.2% for AGIs below $10k, 0.4% for AGIs $10k-25k, 0.4% for AGIs $25k-50k, 0.1% for AGIs $50k-75k, 0.7% for AGIs $75k-100k, 0.6% for AGIs over 100k)
Net capital gain/loss: +$7,867 (reported on 9.8% of returns)
Here:
+$7,867
State:
+$16,110
(% of AGI for various income ranges: 1.9% for AGIs below $10k, -0.2% for AGIs $10k-25k, 0.1% for AGIs $25k-50k, 0.2% for AGIs $50k-75k, 0.9% for AGIs $75k-100k, 9.6% for AGIs over 100k)
Profit/loss from business: +$5,404 (reported on 11.1% of returns)
Here:
+$5,404
State:
+$11,013
(% of AGI for various income ranges: 13.6% for AGIs below $10k, 2.2% for AGIs $10k-25k, 2.0% for AGIs $25k-50k, 1.6% for AGIs $50k-75k, 1.6% for AGIs over 100k)
Total itemized deductions: $15,409 (25% of AGI, reported on 5.4% of returns)
Here:
$15,409
State:
$19,631
Here:
25.2% of AGI
State:
18.9% of AGI
(% of AGI for various income ranges: 14.0% for AGIs below $10k, 3.2% for AGIs $25k-50k, 3.6% for AGIs $50k-75k, 9.1% for AGIs $75k-100k)
Charity contributions deductions: $2,872 (5% of AGI, reported on 3.2% of returns)
Here:
$2,872
State:
$4,753
Here:
4.5% of AGI
State:
4.2% of AGI
Total tax: $5,297 (reported on 57.1% of returns)
78140:
$5,297
State:
$9,058
(% of AGI for various income ranges: 4.0% for AGIs below $10k, 2.6% for AGIs $10k-25k, 5.2% for AGIs $25k-50k, 8.3% for AGIs $50k-75k, 12.1% for AGIs $75k-100k, 21.4% for AGIs over 100k)
Earned income credit: $2,073 (reported on 34.7% of returns)
Here:
$2,073
State:
$2,024
Percentage of individuals using paid preparers for their 2004 taxes: 64.4%
Here:
64%
State:
57%
(% for various income ranges: 60.8% for AGIs below $10k, 64.4% for AGIs $10k-25k, 61.4% for AGIs $25k-50k, 70.8% for AGIs $50k-75k, 74.5% for AGIs $75k-100k, 82.1% for AGIs over 100k)
Household received Food Stamps/SNAP in the past 12 months: 195 Household did not receive Food Stamps/SNAP in the past 12 months: 1,159
Women who had a birth in the past 12 months: 112 (81 now married, 31 unmarried) Women who did not have a birth in the past 12 months: 786 (308 now married, 479 unmarried)
Housing units in zip code 78140 with a mortgage: 359 Median monthly owner costs for units with a mortgage: $879 Median monthly owner costs for units without a mortgage: $407
Residents with income below the poverty level in 2022:
This zip code:
7.2%
Whole state:
14.0%
Residents with income below 50% of the poverty level in 2022:
This zip code:
5.2%
Whole state:
7.4%
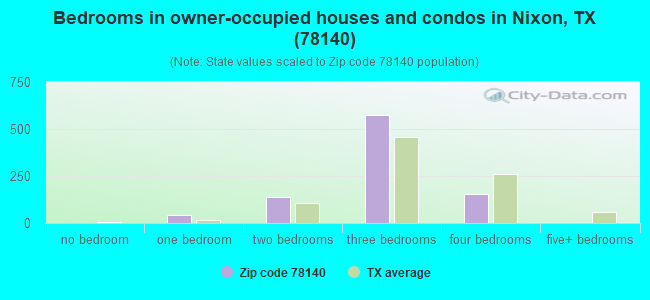
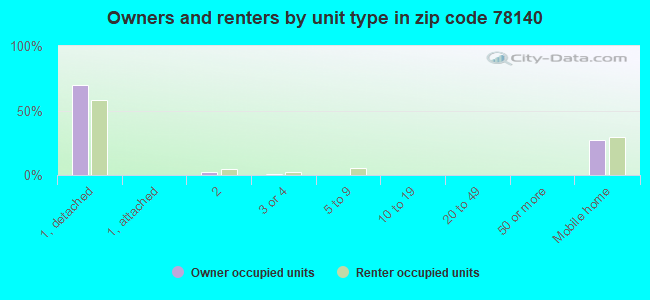
Median number of rooms in houses and condos:
Here:
5.3
State:
6.3
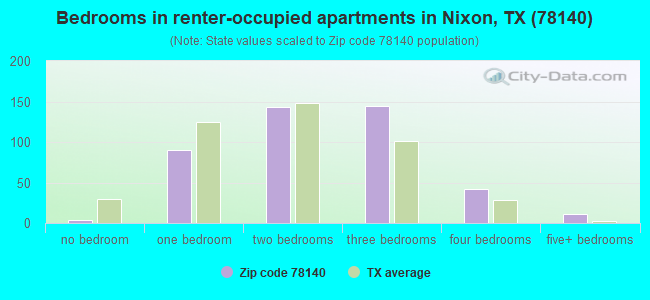
Median number of rooms in apartments:
Here:
4.5
State:
4.0
Notable locations in this zip code not listed on our city pages
Notable locations in zip code 78140: El Negro Ranch (A), Nixon Volunteer Fire Department (B), Gonzales County Emergency Medical Services / Rescue Station 2 (C). Display/hide their locations on the map
Churches in zip code 78140 include: Union Valley Church (A), Macedonia Baptist Church (B), First Assembly of God Church (C), Camp Valley Church (D), First Temple Assembly of God Church (E), Oak Valley Church (F). Display/hide their locations on the map
Cemeteries: Antioch Cemetery (1), Dewville Cemetery (2), Nixon Cemetery (3), White Rancho Cemetery (4), Demmer Cemetery (5), Union Hill Cemetery (6), Sandy Chapel Cemetery (7). Display/hide their locations on the map
Reservoirs: Lake Pruett (A), Weinert Reservoir (B), Coates Estate Lake Number 1 (C), Coates Estate Lake Number 2 (D), Weinert Ranch Reservoir (E), El Negro Ranch Lake (F). Display/hide their locations on the map
Streams, rivers, and creeks: Yow Branch (A), Clear Fork Creek (B), Red Branch (C), O'Neal Creek (D), Tally Branch (E), Nose Creek (F), Murray Branch (G). Display/hide their locations on the map
870 married couples with children.
387 single-parent households (60 men, 327 women).
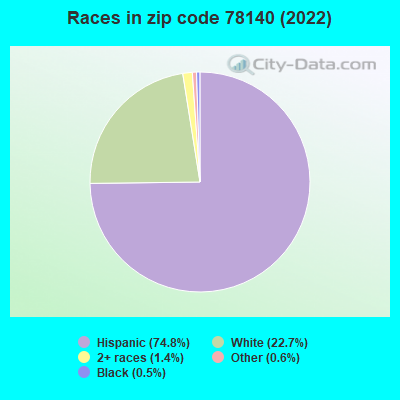
48.6% of residents of 78140 zip code speak English at home.
50.7% of residents speak Spanish at home (53% very well, 17% well, 17% not well, 12% not at all).
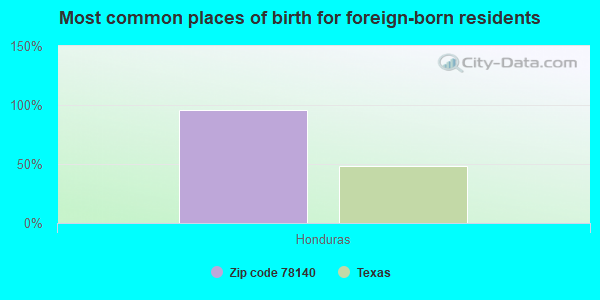
Foreign born population: 820 (20.6%) (24.3% of them are naturalized citizens)
This zip code:
20.6%
Whole state:
17.2%
95%Honduras
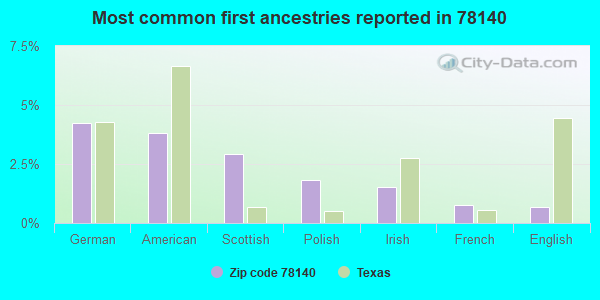
4%German
4%American
3%Scottish
2%Polish
2%Irish
1%French
1%English
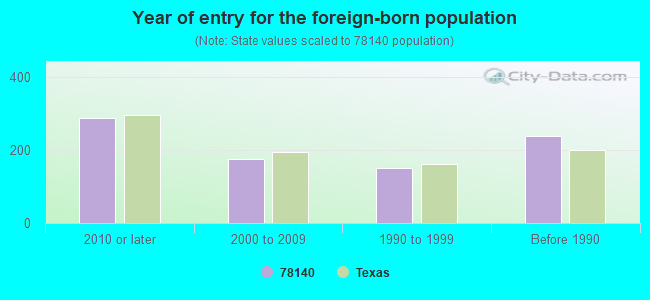
Year of entry for the foreign-born population
2892010 or later
1752000 to 2009
1511990 to 1999
238Before 1990
Housing units lacking complete plumbing facilities: 3.1% Housing units lacking complete kitchen facilities: 3.1%
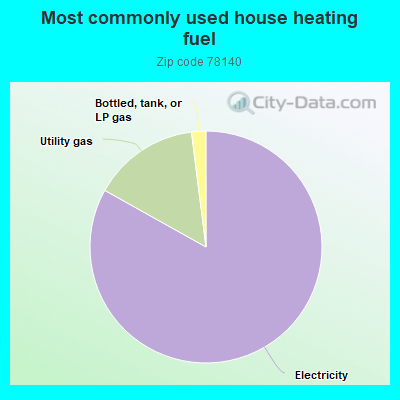
83.2%Electricity
14.9%Utility gas
2.0%Bottled, tank, or LP gas
Population in 1990: 2,953. Population change in the 1990s: +433 (+14.7%).
Place of birth for U.S.-born residents:
This state: 2,783
Northeast: 4
Midwest: 176
South: 8
West: 143
60% of the 78140 zip code residents lived in the same house 5 years ago. Out of people who lived in different houses, 66% lived in this county. Out of people who lived in different counties, 50% lived in Texas.
94% of the 78140 zip code residents lived in the same house 1 year ago. Out of people who lived in different houses, 8% moved from this county. Out of people who lived in different houses, 79% moved from different county within same state. Out of people who lived in different houses, 21% moved from different state. Out of people who lived in different houses, 1% moved from abroad.
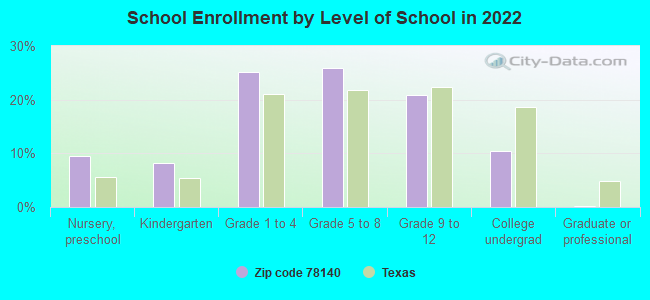
Private vs. public school enrollment:
Students in private schools in grades 1 to 8 (elementary and middle school):
Here:
0.0%
Texas:
8.8%
Students in private schools in grades 9 to 12 (high school):
Here:
0.0%
Texas:
8.0%
Students in private undergraduate colleges: 25
Here:
23.7%
Texas:
16.2%
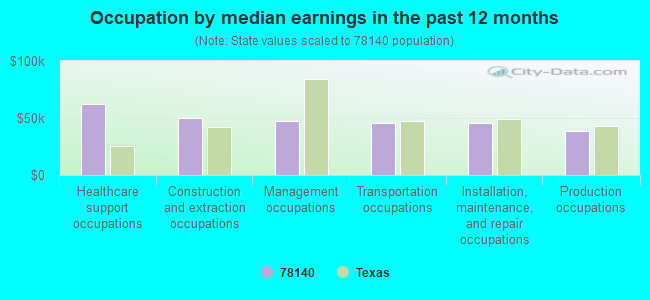
Occupation by median earnings in the past 12 months ($)
62,605Healthcare support occupations
50,239Construction and extraction occupations
47,695Management occupations
45,592Transportation occupations
45,362Installation, maintenance, and repair occupations
38,762Production occupations
Top industries in this zip code by the number of employees in 2005:
Health Care and Social Assistance: Child Day Care Services (50-99 employees: 1 establishment)
Wholesale Trade: Poultry and Poultry Product Merchant Wholesalers (20-49: 1)
Wholesale Trade: Wholesale Trade Agents and Brokers (20-49: 1)
Construction: Site Preparation Contractors (10-19: 1, 1-4: 1)
Accommodation and Food Services: Limited-Service Restaurants (10-19: 1, 1-4: 1)
People in group quarters in 2010:
6 people in group homes intended for adults
People in group quarters in 2000:
113 people in nursing homes
Fatal accident statistics in 2014:
Fatal accident count: 1
Vehicles involved in fatal accidents: 1
Fatal accidents caused by drunken drivers: 0
Fatalities: 1
Persons involved in fatal accidents: 3
Pedestrians involved in fatal accidents: 0
Fatal accident statistics in 2013:
Fatal accident count: 2
Vehicles involved in fatal accidents: 2
Fatal accidents caused by drunken drivers: 2
Fatalities: 2
Persons involved in fatal accidents: 3
Pedestrians involved in fatal accidents: 0
Home Mortgage Disclosure Act Aggregated Statistics For Year 2009 (Based on 2 partial tracts)
A) FHA, FSA/RHS & VA Home Purchase Loans
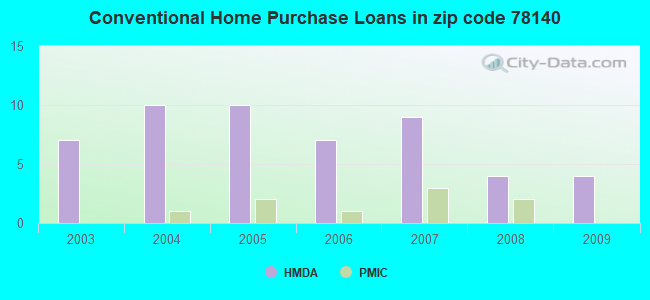
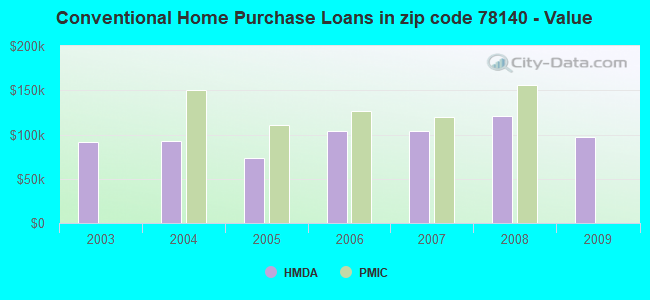
B) Conventional Home Purchase Loans
C) Refinancings
D) Home Improvement Loans
F) Non-occupant Loans on < 5 Family Dwellings (A B C & D)
G) Loans On Manufactured Home Dwelling (A B C & D)
Number
Average Value
Number
Average Value
Number
Average Value
Number
Average Value
Number
Average Value
Number
Average Value
LOANS ORIGINATED
3
$137,567
4
$97,312
6
$131,178
2
$28,315
0
$0
3
$56,723
APPLICATIONS APPROVED, NOT ACCEPTED
0
$0
1
$92,090
2
$60,775
0
$0
1
$20,880
1
$22,880
APPLICATIONS DENIED
0
$0
2
$115,545
3
$171,980
2
$8,725
0
$0
2
$57,200
APPLICATIONS WITHDRAWN
0
$0
0
$0
3
$89,803
0
$0
0
$0
1
$10,010
FILES CLOSED FOR INCOMPLETENESS
0
$0
0
$0
0
$0
0
$0
0
$0
0
$0
Aggregated Statistics For Year 2008 (Based on 2 partial tracts)
A) FHA, FSA/RHS & VA Home Purchase Loans
B) Conventional Home Purchase Loans
C) Refinancings
D) Home Improvement Loans
F) Non-occupant Loans on < 5 Family Dwellings (A B C & D)
G) Loans On Manufactured Home Dwelling (A B C & D)
Number
Average Value
Number
Average Value
Number
Average Value
Number
Average Value
Number
Average Value
Number
Average Value
LOANS ORIGINATED
2
$74,790
4
$120,762
6
$120,502
2
$61,490
2
$80,080
2
$55,915
APPLICATIONS APPROVED, NOT ACCEPTED
0
$0
2
$83,940
2
$110,110
1
$12,870
0
$0
2
$57,200
APPLICATIONS DENIED
0
$0
3
$72,453
5
$102,330
3
$49,953
0
$0
2
$70,500
APPLICATIONS WITHDRAWN
0
$0
1
$82,940
1
$107,820
0
$0
0
$0
0
$0
FILES CLOSED FOR INCOMPLETENESS
0
$0
0
$0
1
$120,980
0
$0
0
$0
0
$0
Aggregated Statistics For Year 2007 (Based on 2 partial tracts)
A) FHA, FSA/RHS & VA Home Purchase Loans
B) Conventional Home Purchase Loans
C) Refinancings
D) Home Improvement Loans
F) Non-occupant Loans on < 5 Family Dwellings (A B C & D)
G) Loans On Manufactured Home Dwelling (A B C & D)
Number
Average Value
Number
Average Value
Number
Average Value
Number
Average Value
Number
Average Value
Number
Average Value
LOANS ORIGINATED
1
$116,120
9
$104,104
4
$106,535
3
$54,913
1
$82,080
2
$72,785
APPLICATIONS APPROVED, NOT ACCEPTED
0
$0
3
$98,383
1
$99,530
1
$26,030
0
$0
1
$43,470
APPLICATIONS DENIED
0
$0
5
$101,530
7
$117,056
3
$54,817
0
$0
4
$45,045
APPLICATIONS WITHDRAWN
1
$59,490
1
$61,490
2
$159,730
1
$65,210
0
$0
1
$30,030
FILES CLOSED FOR INCOMPLETENESS
0
$0
0
$0
1
$141,860
0
$0
0
$0
0
$0
Aggregated Statistics For Year 2006 (Based on 2 partial tracts)
A) FHA, FSA/RHS & VA Home Purchase Loans
B) Conventional Home Purchase Loans
C) Refinancings
D) Home Improvement Loans
F) Non-occupant Loans on < 5 Family Dwellings (A B C & D)
G) Loans On Manufactured Home Dwelling (A B C & D)
Number
Average Value
Number
Average Value
Number
Average Value
Number
Average Value
Number
Average Value
Number
Average Value
LOANS ORIGINATED
1
$225,370
7
$103,614
6
$126,030
4
$44,188
2
$134,275
3
$48,907
APPLICATIONS APPROVED, NOT ACCEPTED
0
$0
2
$132,130
2
$101,245
0
$0
0
$0
1
$54,630
APPLICATIONS DENIED
0
$0
3
$106,200
8
$80,831
5
$53,654
0
$0
2
$53,195
APPLICATIONS WITHDRAWN
0
$0
3
$107,440
7
$140,916
1
$111,540
1
$31,460
1
$35,750
FILES CLOSED FOR INCOMPLETENESS
0
$0
1
$19,730
1
$124,980
0
$0
0
$0
0
$0
Aggregated Statistics For Year 2005 (Based on 2 partial tracts)
A) FHA, FSA/RHS & VA Home Purchase Loans
B) Conventional Home Purchase Loans
C) Refinancings
D) Home Improvement Loans
F) Non-occupant Loans on < 5 Family Dwellings (A B C & D)
G) Loans On Manufactured Home Dwelling (A B C & D)
Number
Average Value
Number
Average Value
Number
Average Value
Number
Average Value
Number
Average Value
Number
Average Value
LOANS ORIGINATED
1
$120,410
10
$73,302
7
$95,606
1
$47,760
1
$20,020
3
$81,607
APPLICATIONS APPROVED, NOT ACCEPTED
0
$0
5
$42,672
1
$173,320
0
$0
0
$0
3
$49,953
APPLICATIONS DENIED
0
$0
11
$49,270
13
$80,740
1
$37,470
1
$55,770
9
$43,821
APPLICATIONS WITHDRAWN
0
$0
2
$90,090
7
$144,267
1
$68,930
1
$93,520
1
$84,940
FILES CLOSED FOR INCOMPLETENESS
0
$0
0
$0
3
$124,220
0
$0
0
$0
0
$0
Aggregated Statistics For Year 2004 (Based on 2 partial tracts)
A) FHA, FSA/RHS & VA Home Purchase Loans
B) Conventional Home Purchase Loans
C) Refinancings
D) Home Improvement Loans
F) Non-occupant Loans on < 5 Family Dwellings (A B C & D)
G) Loans On Manufactured Home Dwelling (A B C & D)
Number
Average Value
Number
Average Value
Number
Average Value
Number
Average Value
Number
Average Value
Number
Average Value
LOANS ORIGINATED
1
$122,120
10
$92,206
12
$86,872
1
$61,490
0
$0
5
$53,710
APPLICATIONS APPROVED, NOT ACCEPTED
1
$73,220
2
$54,485
4
$76,290
1
$28,030
0
$0
3
$33,177
APPLICATIONS DENIED
1
$39,180
7
$51,847
10
$68,669
2
$52,340
1
$35,750
7
$34,443
APPLICATIONS WITHDRAWN
1
$44,040
0
$0
7
$81,143
1
$28,600
0
$0
1
$52,910
FILES CLOSED FOR INCOMPLETENESS
1
$47,760
0
$0
3
$83,417
0
$0
0
$0
0
$0
Aggregated Statistics For Year 2003 (Based on 2 partial tracts)
A) FHA, FSA/RHS & VA Home Purchase Loans
B) Conventional Home Purchase Loans
C) Refinancings
D) Home Improvement Loans
F) Non-occupant Loans on < 5 Family Dwellings (A B C & D)

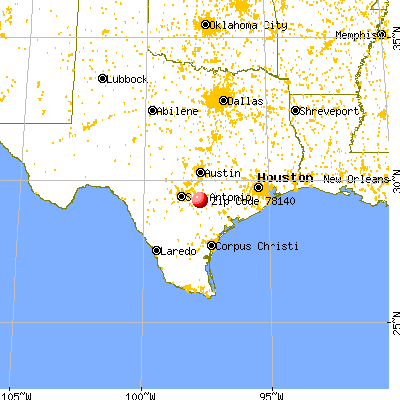


 Nearest zip codes: 78122, 78143, 78160, 78677, 78614, 78159.