Estimated zip code population in 2022: 2,893 Zip code population in 2010: 2,395 Zip code population in 2000: 1,836
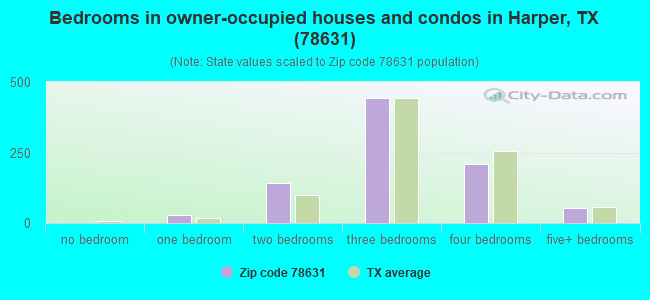
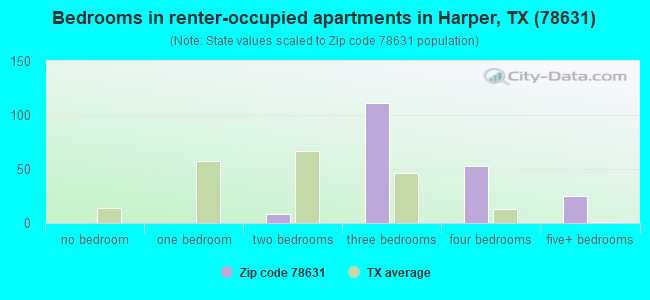
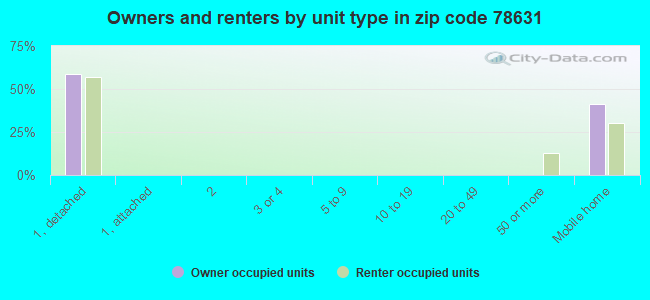
Houses and condos: 1,525 Renter-occupied apartments: 199
% of renters here:
18%
State:
38%
March 2022 cost of living index in zip code 78631: 82.6 (low, U.S. average is 100)
Land area: 325.1 sq. mi. Water area: 0.2 sq. mi.
Population density: 9 people per square mile
(very low).
OSM Map
General Map
Google Map
MSN Map
OSM Map
General Map
Google Map
MSN Map
OSM Map
General Map
Google Map
MSN Map
OSM Map
General Map
Google Map
MSN Map
Please wait while loading the map...
Real estate property taxes paid for housing units in 2022:
This zip code:
0.5% ($1,971)
Texas:
1.5% ($4,050)
Median real estate property taxes paid for housing units with mortgages in 2022: $2,272 (0.7%) Median real estate property taxes paid for housing units with no mortgage in 2022: $1,439 (0.3%)
Averages for the 2020 tax year for zip code 78631, filed in 2021:
Average Adjusted Gross Income (AGI) in 2020: $65,212 (Individual Income Tax Returns)
Here:
$65,212
State:
$77,054
Salary/wage: $51,744 (reported on 71.6% of returns)
Here:
$51,744
State:
$62,766
(% of AGI for various income ranges: 1154.6% for AGIs below $25k, 3555.8% for AGIs $25k-50k, 6060.0% for AGIs $50k-75k, 9044.0% for AGIs $75k-100k, 14179.2% for AGIs $100k-200k)
Taxable interest for individuals: $1,316 (reported on 36.2% of returns)
This zip code:
$1,316
Texas:
$2,665
(% of AGI for various income ranges: 43.8% for AGIs below $25k, 25.8% for AGIs $25k-50k, 35.7% for AGIs $50k-75k, 31.0% for AGIs $75k-100k, 237.5% for AGIs $100k-200k)
Ordinary dividends: $5,590 (reported on 20.6% of returns)
Here:
$5,590
State:
$10,044
(% of AGI for various income ranges: 45.8% for AGIs below $25k, 52.5% for AGIs $25k-50k, 103.6% for AGIs $50k-75k, 118.0% for AGIs $75k-100k, 425.0% for AGIs $100k-200k)
Net capital gain/loss in AGI: +$27,941 (reported on 22.7% of returns)
Here:
+$27,941
State:
+$39,590
(% of AGI for various income ranges: 12.3% for AGIs below $25k, 99.6% for AGIs $25k-50k, 140.7% for AGIs $50k-75k, 388.0% for AGIs $75k-100k, 1198.3% for AGIs $100k-200k)
Profit/loss from business: +$10,682 (reported on 27.0% of returns)
Here:
+$10,682
State:
+$10,888
(% of AGI for various income ranges: 397.3% for AGIs below $25k, 327.5% for AGIs $25k-50k, 428.6% for AGIs $50k-75k, 492.0% for AGIs $75k-100k, 956.7% for AGIs $100k-200k)
Taxable individual retirement arrangement distribution: $28,280 (reported on 10.6% of returns)
78631:
$28,280
Texas:
$24,740
(% of AGI for various income ranges: 154.2% for AGIs below $25k, 176.7% for AGIs $25k-50k, 472.9% for AGIs $50k-75k, 2295.8% for AGIs $100k-200k)
Total itemized deductions: $35,375 (reported on 5.7% of returns)
Here:
$35,375
State:
$40,428
(% of AGI for various income ranges: 928.6% for AGIs $50k-75k, 1275.0% for AGIs $100k-200k)
Charity contributions: $8,933 (reported on 4.3% of returns)
Here:
$8,933
State:
$18,201
(% of AGI for various income ranges: 85.0% for AGIs $50k-75k, 347.5% for AGIs $100k-200k)
Taxes paid: $5,675 (reported on 5.7% of returns)
78631:
$5,675
State:
$7,821
(% of AGI for various income ranges: 138.6% for AGIs $50k-75k, 216.7% for AGIs $100k-200k)
Earned income credit: $2,475 (reported on 14.2% of returns)
Here:
$2,475
State:
$2,584
(% of AGI for various income ranges: 111.5% for AGIs below $25k, 85.4% for AGIs $25k-50k)
Percentage of individuals using paid preparers for their 2020 taxes: 90.8%
Here:
91%
State:
92%
(% for various income ranges: 87.5% for AGIs below $25k, 93.9% for AGIs $25k-50k, 85.7% for AGIs $50k-75k, 100.0% for AGIs $75k-100k, 90.0% for AGIs $100k-200k, 100.0% for AGIs over 200k)
Averages for the 2012 tax year for zip code 78631, filed in 2013:
Average Adjusted Gross Income (AGI) in 2012: $49,915 (Individual Income Tax Returns)
Here:
$49,915
State:
$65,384
Salary/wage: $40,677 (reported on 73.9% of returns)
Here:
$40,677
State:
$52,524
(% of AGI for various income ranges: 75.0% for AGIs below $25k, 71.6% for AGIs $25k-50k, 67.8% for AGIs $50k-75k, 68.4% for AGIs $75k-100k, 82.6% for AGIs $100k-200k)
Taxable interest for individuals: $1,352 (reported on 37.0% of returns)
This zip code:
$1,352
Texas:
$2,372
(% of AGI for various income ranges: 2.2% for AGIs below $25k, 1.4% for AGIs $25k-50k, 1.1% for AGIs $50k-75k, 0.4% for AGIs $75k-100k, 0.9% for AGIs $100k-200k, 0.6% for AGIs over 200k)
Ordinary dividends: $6,543 (reported on 19.3% of returns)
Here:
$6,543
State:
$9,721
(% of AGI for various income ranges: 2.8% for AGIs below $25k, 0.7% for AGIs $25k-50k, 0.8% for AGIs $50k-75k, 2.2% for AGIs $75k-100k, 7.5% for AGIs $100k-200k)
Net capital gain/loss in AGI: +$11,305 (reported on 18.5% of returns)
Here:
+$11,305
State:
+$35,319
(% of AGI for various income ranges: 0.2% for AGIs $25k-50k, 1.9% for AGIs $50k-75k, 1.9% for AGIs $75k-100k, 16.4% for AGIs $100k-200k)
Profit/loss from business: +$8,006 (reported on 27.7% of returns)
Here:
+$8,006
State:
+$13,732
(% of AGI for various income ranges: 13.6% for AGIs below $25k, 5.7% for AGIs $25k-50k, 4.8% for AGIs $50k-75k, 1.3% for AGIs $75k-100k, 5.0% for AGIs $100k-200k)
Taxable individual retirement arrangement distribution: $27,600 (reported on 13.4% of returns)
78631:
$27,600
Texas:
$19,511
(% of AGI for various income ranges: 6.3% for AGIs below $25k, 2.9% for AGIs $25k-50k, 4.7% for AGIs $50k-75k, 5.7% for AGIs $75k-100k, 21.2% for AGIs $100k-200k)
Total itemized deductions: $20,973 (21% of AGI, reported on 21.8% of returns)
Here:
$20,973
State:
$24,724
Here:
21.1% of AGI
State:
15.9% of AGI
(% of AGI for various income ranges: 10.0% for AGIs below $25k, 7.8% for AGIs $25k-50k, 10.3% for AGIs $50k-75k, 9.7% for AGIs $75k-100k, 11.0% for AGIs $100k-200k, 6.5% for AGIs over 200k)
Charity contributions: $3,810 (reported on 17.6% of returns)
Here:
$3,810
State:
$6,808
(% of AGI for various income ranges: 1.0% for AGIs below $25k, 0.9% for AGIs $25k-50k, 0.9% for AGIs $50k-75k, 1.6% for AGIs $75k-100k, 3.2% for AGIs $100k-200k)
Taxes paid: $4,658 (reported on 21.8% of returns)
78631:
$4,658
State:
$6,921
(% of AGI for various income ranges: 2.0% for AGIs below $25k, 1.2% for AGIs $25k-50k, 1.8% for AGIs $50k-75k, 1.8% for AGIs $75k-100k, 3.1% for AGIs $100k-200k, 2.1% for AGIs over 200k)
Earned income credit: $2,246 (reported on 20.2% of returns)
Here:
$2,246
State:
$2,570
(% of AGI for various income ranges: 6.2% for AGIs below $25k, 1.4% for AGIs $25k-50k)
Percentage of individuals using paid preparers for their 2012 taxes: 54.6%
Here:
55%
State:
51%
(% for various income ranges: 48.0% for AGIs below $25k, 60.0% for AGIs $25k-50k, 57.1% for AGIs $50k-75k, 58.3% for AGIs $75k-100k, 60.0% for AGIs $100k-200k, 66.7% for AGIs over 200k)
Averages for the 2004 tax year for zip code 78631, filed in 2005:
Average Adjusted Gross Income (AGI) in 2004: $37,873 (Individual Income Tax Returns)
Here:
$37,873
State:
$47,881
Salary/wage: $34,181 (reported on 74.2% of returns)
Here:
$34,181
State:
$41,947
(% of AGI for various income ranges: 214.9% for AGIs below $10k, 69.1% for AGIs $10k-25k, 76.9% for AGIs $25k-50k, 73.8% for AGIs $50k-75k, 78.1% for AGIs $75k-100k, 41.5% for AGIs over 100k)
Taxable interest for individuals: $1,960 (reported on 47.6% of returns)
This zip code:
$1,960
Texas:
$2,255
(% of AGI for various income ranges: 30.2% for AGIs below $10k, 4.8% for AGIs $10k-25k, 1.6% for AGIs $25k-50k, 1.3% for AGIs $50k-75k, 1.2% for AGIs $75k-100k, 2.7% for AGIs over 100k)
Taxable dividends: $2,009 (reported on 22.2% of returns)
Here:
$2,009
State:
$4,261
(% of AGI for various income ranges: 20.7% for AGIs below $10k, 0.6% for AGIs $10k-25k, 0.8% for AGIs $25k-50k, 0.4% for AGIs $50k-75k, 0.3% for AGIs $75k-100k, 2.1% for AGIs over 100k)
Net capital gain/loss: +$7,764 (reported on 23.8% of returns)
Here:
+$7,764
State:
+$16,110
(% of AGI for various income ranges: -15.1% for AGIs below $10k, 2.0% for AGIs $10k-25k, 0.8% for AGIs $25k-50k, 1.3% for AGIs $50k-75k, 6.8% for AGIs $75k-100k, 12.7% for AGIs over 100k)
Profit/loss from business: +$6,069 (reported on 24.9% of returns)
Here:
+$6,069
State:
+$11,013
(% of AGI for various income ranges: 18.8% for AGIs below $10k, 9.5% for AGIs $10k-25k, 4.0% for AGIs $25k-50k, 5.5% for AGIs $50k-75k, 3.6% for AGIs $75k-100k)
IRA payment deduction: $3,133 (reported on 1.5% of returns)
78631:
$3,133
Texas:
$3,120
Total itemized deductions: $16,843 (21% of AGI, reported on 17.3% of returns)
Here:
$16,843
State:
$19,631
Here:
20.7% of AGI
State:
18.9% of AGI
(% of AGI for various income ranges: 10.8% for AGIs $10k-25k, 7.5% for AGIs $25k-50k, 6.4% for AGIs $50k-75k, 10.2% for AGIs $75k-100k, 6.9% for AGIs over 100k)
Charity contributions deductions: $2,859 (3% of AGI, reported on 12.9% of returns)
Here:
$2,859
State:
$4,753
Here:
3.1% of AGI
State:
4.2% of AGI
(% of AGI for various income ranges: 0.9% for AGIs $10k-25k, 0.9% for AGIs $25k-50k, 0.8% for AGIs $50k-75k, 1.2% for AGIs $75k-100k, 1.2% for AGIs over 100k)
Total tax: $5,878 (reported on 72.6% of returns)
78631:
$5,878
State:
$9,058
(% of AGI for various income ranges: 8.2% for AGIs below $10k, 4.1% for AGIs $10k-25k, 6.2% for AGIs $25k-50k, 8.1% for AGIs $50k-75k, 10.5% for AGIs $75k-100k, 21.9% for AGIs over 100k)
Earned income credit: $1,820 (reported on 16.8% of returns)
Here:
$1,820
State:
$2,024
Percentage of individuals using paid preparers for their 2004 taxes: 64.3%
Here:
64%
State:
57%
(% for various income ranges: 57.9% for AGIs below $10k, 67.4% for AGIs $10k-25k, 67.4% for AGIs $25k-50k, 61.4% for AGIs $50k-75k, 58.0% for AGIs $75k-100k, 76.7% for AGIs over 100k)
Household received Food Stamps/SNAP in the past 12 months: 61 Household did not receive Food Stamps/SNAP in the past 12 months: 1,014
Women who had a birth in the past 12 months: 35 (26 now married, 8 unmarried) Women who did not have a birth in the past 12 months: 354 (238 now married, 113 unmarried)
Housing units in zip code 78631 with a mortgage: 414 (21 second mortgage, 7 both second mortgage and home equity loan) Houses without a mortgage: 6
Median monthly owner costs for units with a mortgage: $1,764 Median monthly owner costs for units without a mortgage: $481
Residents with income below the poverty level in 2022:
This zip code:
10.9%
Whole state:
14.0%
Residents with income below 50% of the poverty level in 2022:
This zip code:
7.5%
Whole state:
7.4%
Median number of rooms in houses and condos:
Here:
6.3
State:
6.3
Median number of rooms in apartments:
Here:
5.9
State:
4.0
Notable locations in this zip code not listed on our city pages
Notable locations in zip code 78631: Dicks Hollow Windmill (A), Falls Prong Windmill (B), North Trap Windmill (C), North Windmill (D), Rodgers Trap Windmill (E), Section Windmill (F), South Trap Windmill (G), Bur Oak Windmill (H), Daisy Windmill (I), Draw Windmill (J), Hilltop Windmill (K), New Windmill (L), Priess Pasture Windmill (M), South Windmill (N), Back Pasture Windmill (O), East Windmill (P), Eclipse Windmill (Q), Field Windmill (R), Old Noxville (S), Other Windmill (T). Display/hide their locations on the map
Streams, rivers, and creeks: Walnut Creek (A), Stuckens Branch (B), Stevens Creek (C), Pecan Creek (D), White Oak Creek (E), Shin Oak Creek (F), Grays Branch (G), Pecan Spring Branch (H), Maverick Spring Branch (I). Display/hide their locations on the map
Size of family households: 461 2-persons, 113 3-persons, 151 4-persons, 19 5-persons, 71 6-persons, 47 7-or-more-persons
Size of nonfamily households: 144 1-person, 49 2-persons, 18 3-persons
497 married couples with children.
133 single-parent households (38 men, 95 women).
97.8% of residents of 78631 zip code speak English at home.
1.9% of residents speak Spanish at home (41% very well, 11% well, 48% not at all).
0.7% of residents speak other Indo-European language at home (100% very well).
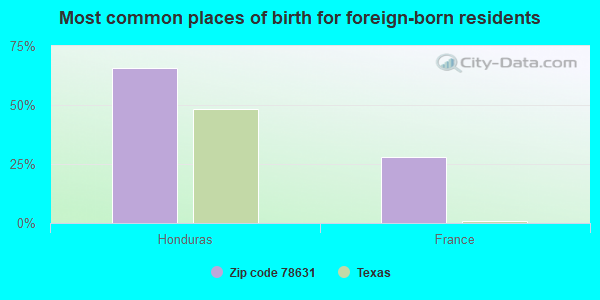
Foreign born population: 63 (2.2%) (32.9% of them are naturalized citizens)
This zip code:
2.2%
Whole state:
17.2%
66%Honduras
28%France
29%German
15%Irish
12%Scottish
11%American
10%English
6%Finnish
3%Scotch-Irish
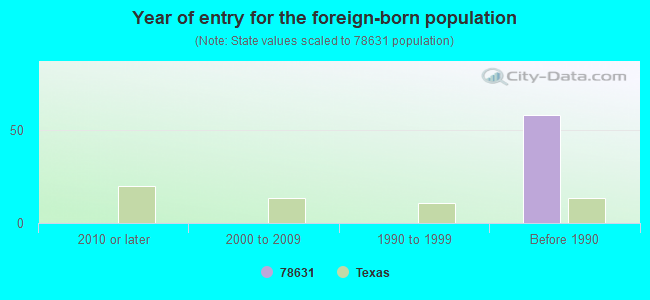
Year of entry for the foreign-born population
02010 or later
02000 to 2009
01990 to 1999
58Before 1990
Facilities with environmental interests located in this zip code:
AMERICAN TELEPHONE AND TELEGRAPH COMPANY (HIGHWAY 479 5 MI SW OF in HARPER, TX)
(Resource Conservation and Recovery Act (tracking hazardous waste)) Alternative names: AMERICAN TEL & TEL CO LONG LINES
Housing units lacking complete plumbing facilities: 4.4% Housing units lacking complete kitchen facilities: 5.1%
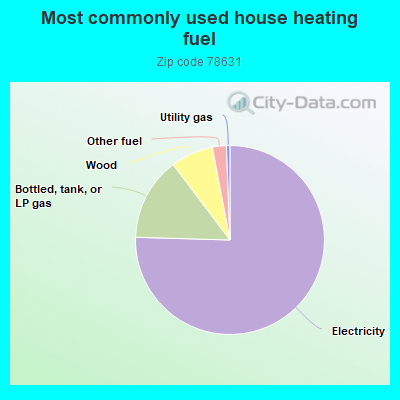
75.7%Electricity
14.3%Bottled, tank, or LP gas
7.3%Wood
2.4%Other fuel
0.6%Utility gas
Population in 1990: 1,144. Population change in the 1990s: +692 (+60.5%).
Place of birth for U.S.-born residents:
This state: 2,265
Northeast: 106
Midwest: 161
South: 107
West: 173
64% of the 78631 zip code residents lived in the same house 5 years ago. Out of people who lived in different houses, 17% lived in this county. Out of people who lived in different counties, 50% lived in Texas.
94% of the 78631 zip code residents lived in the same house 1 year ago. Out of people who lived in different houses, 25% moved from this county. Out of people who lived in different houses, 50% moved from different county within same state. Out of people who lived in different houses, 31% moved from different state.
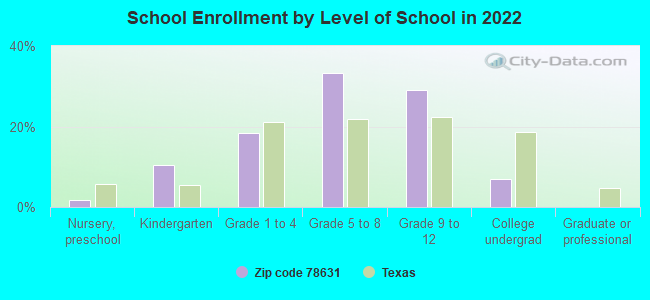
Private vs. public school enrollment:
Students in private schools in grades 1 to 8 (elementary and middle school):
Here:
0.0%
Texas:
8.8%
Students in private schools in grades 9 to 12 (high school): 51
Here:
26.2%
Texas:
8.0%
Students in private undergraduate colleges:
Here:
0.0%
Texas:
16.2%
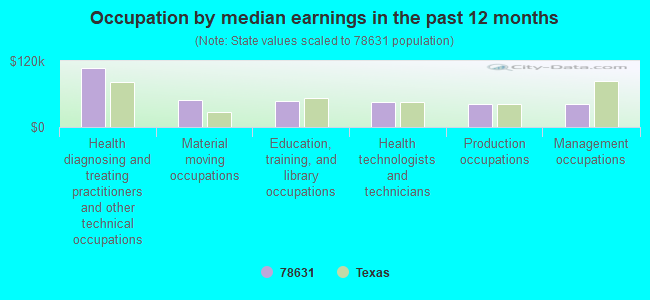
Occupation by median earnings in the past 12 months ($)
108,123Health diagnosing and treating practitioners and other technical occupations
49,445Material moving occupations
47,390Education, training, and library occupations
45,731Health technologists and technicians
42,422Production occupations
41,700Management occupations
Companies with federal contracts located in this zip code:
SANDERS FARM & RANCH CENTER IN (23247 HWY 290 W in HARPER, TX; small business)
$4,095 with Army for Saddlery, Harness, Whips, and Related Animal Furnishings. Taking place in KY. Signed on 2003-03-13. Completion date: 2003-04-01.
Top industries in this zip code by the number of employees in 2005:
Other Services (except Public Administration): Religious Organizations (5-9 employees: 2 establishments, 1-4 employees: 2 establishments)
Accommodation and Food Services: Recreational and Vacation Camps (except Campgrounds) (10-19: 1)
Accommodation and Food Services: Full-Service Restaurants (5-9: 1, 1-4: 3)
Mining: All Other Nonmetallic Mineral Mining (5-9: 1)
Construction: Highway, Street, and Bridge Construction (5-9: 1)
Other Services (except Public Administration): Automotive Oil Change and Lubrication Shops (5-9: 1)
Finance and Insurance: Commercial Banking (5-9: 1)
Health Care and Social Assistance: Child Day Care Services (5-9: 1)
Fatal accident statistics in 2013:
Fatal accident count: 1
Vehicles involved in fatal accidents: 1
Fatal accidents caused by drunken drivers: 0
Fatalities: 1
Persons involved in fatal accidents: 1
Pedestrians involved in fatal accidents: 0
2003 - 2018 National Fire Incident Reporting System (NFIRS) incidents
Based on the data from the years 2003 - 2018 the average number of fire incidents per year is 26. The highest number of reported fires - 65 took place in 2005, and the least - 2 in 2003. The data has an increasing trend.
When looking into fire subcategories, the most incidents belonged to: Outside Fires (73.8%), and Structure Fires (18.2%).
Fire incident types reported to NFIRS in Zip Code 78631
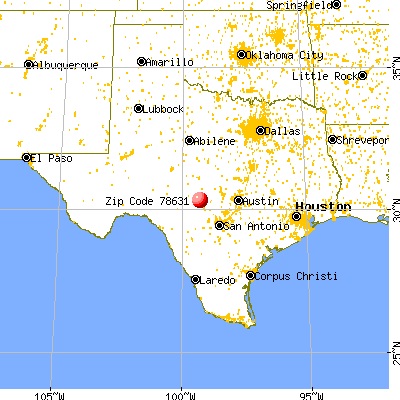


 Nearest zip codes: 78029, 78618, 78025, 78028, 76856, 78024.


 Based on the data from the years 2003 - 2018 the average number of fire incidents per year is 26. The highest number of reported fires - 65 took place in 2005, and the least - 2 in 2003. The data has an increasing trend.
 When looking into fire subcategories, the most incidents belonged to: Outside Fires (73.8%), and Structure Fires (18.2%).