Estimated zip code population in 2022: 15,784 Zip code population in 2010: 19,801 Zip code population in 2000: 17,009
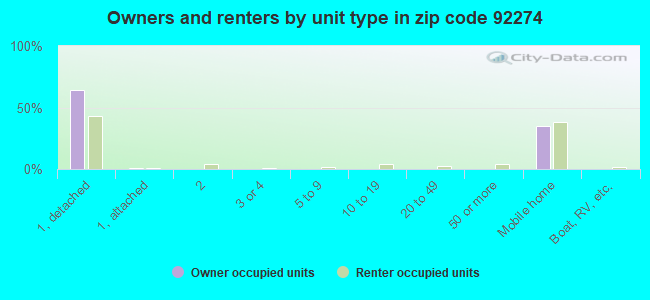
Houses and condos: 7,610 Renter-occupied apartments: 825
% of renters here:
14%
State:
44%
March 2022 cost of living index in zip code 92274: 73.1 (low, U.S. average is 100)
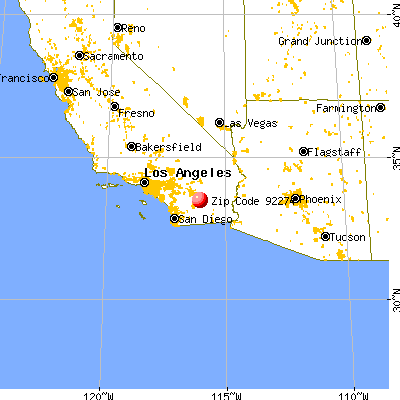
Land area: 178.9 sq. mi. Water area: 32.7 sq. mi.
Population density: 88 people per square mile
(very low).
OSM Map
General Map
Google Map
MSN Map
OSM Map
General Map
Google Map
MSN Map
OSM Map
General Map
Google Map
MSN Map
OSM Map
General Map
Google Map
MSN Map
Please wait while loading the map...
Real estate property taxes paid for housing units in 2022:
This zip code:
1.3% ($1,842)
California:
0.7% ($4,831)
Median real estate property taxes paid for housing units with mortgages in 2022: $2,406 (1.3%) Median real estate property taxes paid for housing units with no mortgage in 2022: $1,567 (1.3%)
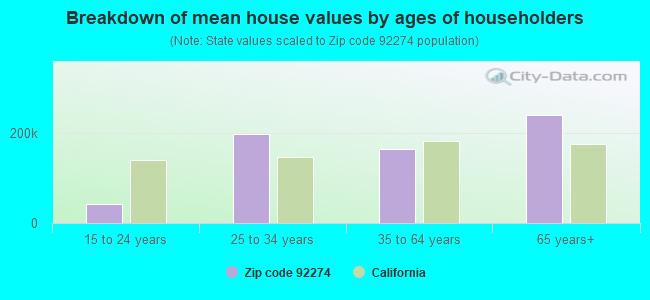
Estimated median house/condo value in 2022: $139,857
92274:
$139,857
California:
$715,900
According to our research of California and other state lists, there were 19 registered sex offenders living in 92274 zip code as of May 10, 2024. The ratio of all residents to sex offenders in zip code 92274 is 1,032 to 1. The ratio of registered sex offenders to all residents in this zip code is lower than the state average.
Median resident age:
This zip code:
40.4 years
California median age:
37.9 years
Average household size:
This zip code:
2.6 people
California:
2.8 people
Averages for the 2020 tax year for zip code 92274, filed in 2021:
Average Adjusted Gross Income (AGI) in 2020: $33,009 (Individual Income Tax Returns)
Here:
$33,009
State:
$95,910
Salary/wage: $27,773 (reported on 90.0% of returns)
Here:
$27,773
State:
$77,331
(% of AGI for various income ranges: 1691.7% for AGIs below $25k, 4402.1% for AGIs $25k-50k, 8221.3% for AGIs $50k-75k, 11465.3% for AGIs $75k-100k, 18921.2% for AGIs $100k-200k)
Taxable interest for individuals: $328 (reported on 11.5% of returns)
This zip code:
$328
California:
$2,294
(% of AGI for various income ranges: 1.7% for AGIs below $25k, 2.7% for AGIs $25k-50k, 7.5% for AGIs $50k-75k, 8.7% for AGIs $75k-100k, 77.5% for AGIs $100k-200k)
Ordinary dividends: $1,844 (reported on 2.2% of returns)
Here:
$1,844
State:
$10,949
(% of AGI for various income ranges: 2.3% for AGIs below $25k, 2.6% for AGIs $25k-50k, 6.4% for AGIs $50k-75k, 246.2% for AGIs $100k-200k)
Net capital gain/loss in AGI: +$10,405 (reported on 2.6% of returns)
Here:
+$10,405
State:
+$49,306
(% of AGI for various income ranges: 1.2% for AGIs below $25k, 1.7% for AGIs $25k-50k, 32.8% for AGIs $50k-75k, 130.0% for AGIs $75k-100k, 2197.5% for AGIs $100k-200k)
Profit/loss from business: +$9,144 (reported on 11.6% of returns)
Here:
+$9,144
State:
+$15,671
(% of AGI for various income ranges: 152.9% for AGIs below $25k, 115.7% for AGIs $25k-50k, 180.4% for AGIs $50k-75k, 580.0% for AGIs $75k-100k, 1460.0% for AGIs $100k-200k)
Taxable individual retirement arrangement distribution: $8,300 (reported on 0.9% of returns)
92274:
$8,300
California:
$23,505
(% of AGI for various income ranges: 16.4% for AGIs $25k-50k, 50.4% for AGIs $50k-75k)
Total itemized deductions: $25,424 (reported on 2.6% of returns)
Here:
$25,424
State:
$39,517
(% of AGI for various income ranges: 28.2% for AGIs below $25k, 79.0% for AGIs $25k-50k, 224.3% for AGIs $50k-75k, 504.7% for AGIs $75k-100k, 1566.2% for AGIs $100k-200k)
Charity contributions: $4,821 (reported on 1.7% of returns)
Here:
$4,821
State:
$12,598
(% of AGI for various income ranges: 9.6% for AGIs $25k-50k, 29.6% for AGIs $50k-75k, 55.3% for AGIs $75k-100k, 313.8% for AGIs $100k-200k)
Taxes paid: $6,343 (reported on 2.6% of returns)
92274:
$6,343
State:
$8,807
(% of AGI for various income ranges: 3.8% for AGIs below $25k, 16.3% for AGIs $25k-50k, 64.3% for AGIs $50k-75k, 156.0% for AGIs $75k-100k, 448.8% for AGIs $100k-200k)
Earned income credit: $2,616 (reported on 37.1% of returns)
Here:
$2,616
State:
$2,074
(% of AGI for various income ranges: 209.3% for AGIs below $25k, 166.0% for AGIs $25k-50k, 6.4% for AGIs $50k-75k)
Percentage of individuals using paid preparers for their 2020 taxes: 84.1%
Here:
84%
State:
92%
(% for various income ranges: 80.5% for AGIs below $25k, 85.7% for AGIs $25k-50k, 88.8% for AGIs $50k-75k, 92.3% for AGIs $75k-100k, 93.8% for AGIs $100k-200k, 100.0% for AGIs over 200k)
Averages for the 2012 tax year for zip code 92274, filed in 2013:
Average Adjusted Gross Income (AGI) in 2012: $25,085 (Individual Income Tax Returns)
Here:
$25,085
State:
$72,726
Salary/wage: $22,485 (reported on 91.3% of returns)
Here:
$22,485
State:
$59,079
(% of AGI for various income ranges: 82.6% for AGIs below $25k, 88.7% for AGIs $25k-50k, 77.6% for AGIs $50k-75k, 70.1% for AGIs $75k-100k, 58.0% for AGIs $100k-200k)
Taxable interest for individuals: $706 (reported on 9.4% of returns)
This zip code:
$706
California:
$2,146
(% of AGI for various income ranges: 0.2% for AGIs below $25k, 0.5% for AGIs $50k-75k, 0.1% for AGIs $75k-100k, 1.5% for AGIs $100k-200k)
Ordinary dividends: $2,450 (reported on 2.0% of returns)
Here:
$2,450
State:
$9,308
(% of AGI for various income ranges: 0.3% for AGIs $50k-75k, 2.1% for AGIs $75k-100k)
Net capital gain/loss in AGI: +$1,617 (reported on 1.7% of returns)
Here:
+$1,617
State:
+$30,460
(% of AGI for various income ranges: 0.9% for AGIs $50k-75k, 0.3% for AGIs $100k-200k)
Profit/loss from business: +$8,003 (reported on 12.6% of returns)
Here:
+$8,003
State:
+$17,064
(% of AGI for various income ranges: 7.3% for AGIs below $25k, 2.1% for AGIs $25k-50k, 3.0% for AGIs $50k-75k, 1.3% for AGIs $75k-100k)
Taxable individual retirement arrangement distribution: $10,340 (reported on 1.4% of returns)
92274:
$10,340
California:
$19,557
(% of AGI for various income ranges: 0.5% for AGIs below $25k, 1.5% for AGIs $50k-75k, 4.3% for AGIs $75k-100k)
Total itemized deductions: $18,702 (32% of AGI, reported on 7.6% of returns)
Here:
$18,702
State:
$34,004
Here:
31.9% of AGI
State:
22.7% of AGI
(% of AGI for various income ranges: 1.9% for AGIs below $25k, 4.1% for AGIs $25k-50k, 11.5% for AGIs $50k-75k, 15.6% for AGIs $75k-100k, 17.4% for AGIs $100k-200k)
Charity contributions: $2,767 (reported on 5.1% of returns)
Here:
$2,767
State:
$4,659
(% of AGI for various income ranges: 0.4% for AGIs $25k-50k, 1.3% for AGIs $50k-75k, 1.6% for AGIs $75k-100k, 2.2% for AGIs $100k-200k)
Taxes paid: $5,267 (reported on 7.2% of returns)
92274:
$5,267
State:
$14,448
(% of AGI for various income ranges: 0.3% for AGIs below $25k, 0.8% for AGIs $25k-50k, 2.8% for AGIs $50k-75k, 4.3% for AGIs $75k-100k, 7.6% for AGIs $100k-200k)
Earned income credit: $2,990 (reported on 40.5% of returns)
Here:
$2,990
State:
$2,286
(% of AGI for various income ranges: 10.0% for AGIs below $25k, 2.5% for AGIs $25k-50k)
Percentage of individuals using paid preparers for their 2012 taxes: 67.4%
Here:
67%
State:
64%
(% for various income ranges: 64.9% for AGIs below $25k, 70.5% for AGIs $25k-50k, 78.1% for AGIs $50k-75k, 72.7% for AGIs $75k-100k, 77.8% for AGIs $100k-200k)
Averages for the 2004 tax year for zip code 92274, filed in 2005:
Average Adjusted Gross Income (AGI) in 2004: $25,120 (Individual Income Tax Returns)
Here:
$25,120
State:
$58,600
Salary/wage: $21,206 (reported on 92.2% of returns)
Here:
$21,206
State:
$49,455
(% of AGI for various income ranges: 125.9% for AGIs below $10k, 84.8% for AGIs $10k-25k, 89.0% for AGIs $25k-50k, 81.6% for AGIs $50k-75k, 77.6% for AGIs $75k-100k, 29.5% for AGIs over 100k)
Taxable interest for individuals: $1,628 (reported on 14.7% of returns)
This zip code:
$1,628
California:
$2,365
(% of AGI for various income ranges: 1.6% for AGIs below $10k, 0.3% for AGIs $10k-25k, 0.4% for AGIs $25k-50k, 0.7% for AGIs $50k-75k, 0.7% for AGIs $75k-100k, 3.6% for AGIs over 100k)
Taxable dividends: $2,348 (reported on 4.0% of returns)
Here:
$2,348
State:
$4,746
(% of AGI for various income ranges: 1.0% for AGIs below $10k, 0.2% for AGIs $10k-25k, 0.1% for AGIs $25k-50k, 0.2% for AGIs $50k-75k, 0.4% for AGIs $75k-100k, 1.3% for AGIs over 100k)
Net capital gain/loss: +$14,855 (reported on 3.7% of returns)
Here:
+$14,855
State:
+$23,418
(% of AGI for various income ranges: -0.8% for AGIs below $10k, 0.2% for AGIs $10k-25k, 0.3% for AGIs $25k-50k, 2.4% for AGIs $50k-75k, 10.9% for AGIs over 100k)
Profit/loss from business: +$8,466 (reported on 9.8% of returns)
Here:
+$8,466
State:
+$16,826
(% of AGI for various income ranges: 16.3% for AGIs below $10k, 3.7% for AGIs $10k-25k, 2.1% for AGIs $25k-50k, 5.3% for AGIs $50k-75k, 1.4% for AGIs $75k-100k, 1.7% for AGIs over 100k)
Profit/loss from farming: +$300 (reported on 1.1% of returns)
Here:
+$300
State:
-$7,562
(% of AGI for various income ranges: -0.4% for AGIs below $10k, -0.2% for AGIs $10k-25k, -0.6% for AGIs $50k-75k, 0.9% for AGIs over 100k)
IRA payment deduction: $3,893 (reported on 0.6% of returns)
92274:
$3,893
California:
$3,192
Total itemized deductions: $18,429 (25% of AGI, reported on 8.8% of returns)
Here:
$18,429
State:
$28,113
Here:
25.4% of AGI
State:
25.3% of AGI
(% of AGI for various income ranges: 3.5% for AGIs below $10k, 1.9% for AGIs $10k-25k, 6.2% for AGIs $25k-50k, 12.2% for AGIs $50k-75k, 15.6% for AGIs $75k-100k, 9.9% for AGIs over 100k)
Charity contributions deductions: $2,504 (3% of AGI, reported on 7.2% of returns)
Here:
$2,504
State:
$3,923
Here:
3.3% of AGI
State:
3.3% of AGI
(% of AGI for various income ranges: 0.2% for AGIs $10k-25k, 0.6% for AGIs $25k-50k, 1.5% for AGIs $50k-75k, 2.1% for AGIs $75k-100k, 1.3% for AGIs over 100k)
Total tax: $4,010 (reported on 41.1% of returns)
92274:
$4,010
State:
$10,761
(% of AGI for various income ranges: 3.7% for AGIs below $10k, 1.8% for AGIs $10k-25k, 3.1% for AGIs $25k-50k, 7.2% for AGIs $50k-75k, 11.1% for AGIs $75k-100k, 21.9% for AGIs over 100k)
Earned income credit: $2,206 (reported on 50.2% of returns)
Here:
$2,206
State:
$1,763
Percentage of individuals using paid preparers for their 2004 taxes: 77.2%
Here:
77%
State:
66%
(% for various income ranges: 71.5% for AGIs below $10k, 75.8% for AGIs $10k-25k, 83.8% for AGIs $25k-50k, 79.0% for AGIs $50k-75k, 75.0% for AGIs $75k-100k, 87.2% for AGIs over 100k)
Household received Food Stamps/SNAP in the past 12 months: 1,359 Household did not receive Food Stamps/SNAP in the past 12 months: 4,852
Women who had a birth in the past 12 months: 126 (116 now married, 9 unmarried) Women who did not have a birth in the past 12 months: 3,656 (1,503 now married, 2,150 unmarried)
Housing units in zip code 92274 with a mortgage: 1,106 (50 second mortgage, 12 both second mortgage and home equity loan) Houses without a mortgage: 6
Median monthly owner costs for units with a mortgage: $1,353 Median monthly owner costs for units without a mortgage: $492
Residents with income below the poverty level in 2022:
This zip code:
21.6%
Whole state:
12.2%
Residents with income below 50% of the poverty level in 2022:
This zip code:
16.5%
Whole state:
6.2%
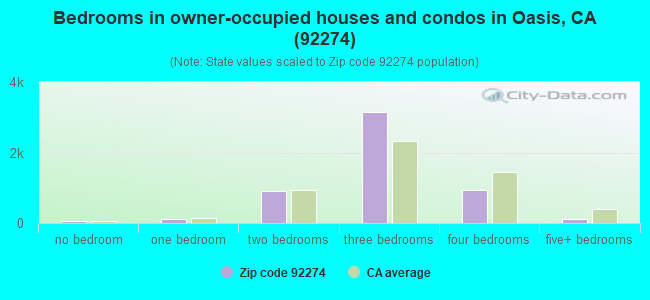
Median number of rooms in houses and condos:
Here:
5.1
State:
6.0
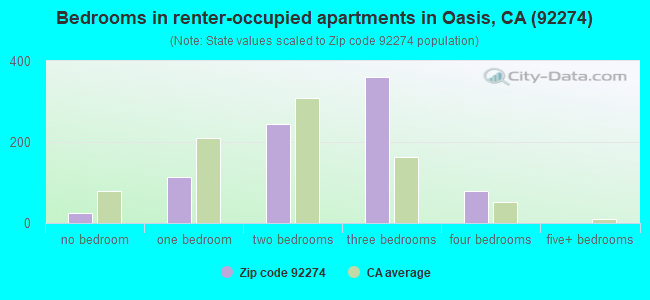
Median number of rooms in apartments:
Here:
4.5
State:
3.9
Notable locations in this zip code not listed on our city pages
Notable locations in zip code 92274: Torres Martinez Indian Reservation Headquarters (A), Oriols Service Station (B), Oasis Maintenance Station (C), Salton Sea Service Station (D), Water Reclamation Plant Number 4 (E), Salton Sea Beach Marina (F), Torres (G), Early Indian Fish Traps (H), American Medical Response Thermal (I), West Shore Ambulance Service (J), Riverside County Fire Department Station 39 Thermal (K), Salton Sea Beach Volunteer Fire Department (L), Riverside County Fire Department Station 42 Oasis (M). Display/hide their locations on the map
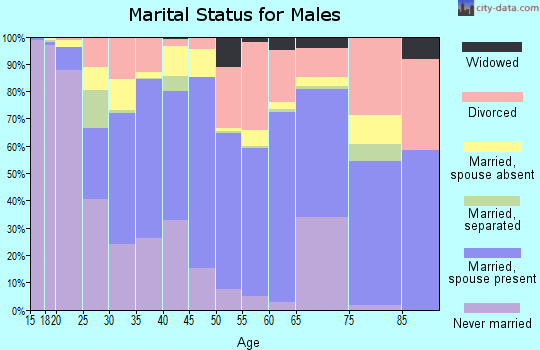
1,779 married couples with children.
775 single-parent households (78 men, 697 women).
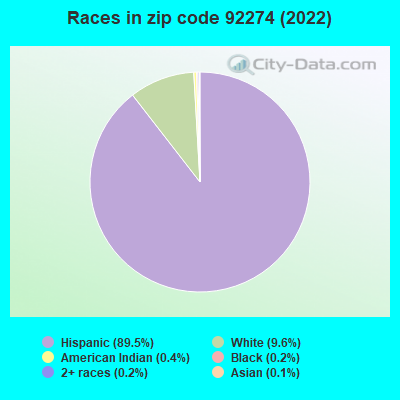
23.4% of residents of 92274 zip code speak English at home.
77.7% of residents speak Spanish at home (41% very well, 7% well, 12% not well, 40% not at all).
0.2% of residents speak other Indo-European language at home (97% very well, 3% well).
0.1% of residents speak Asian or Pacific Island language at home (12% well, 88% not well).
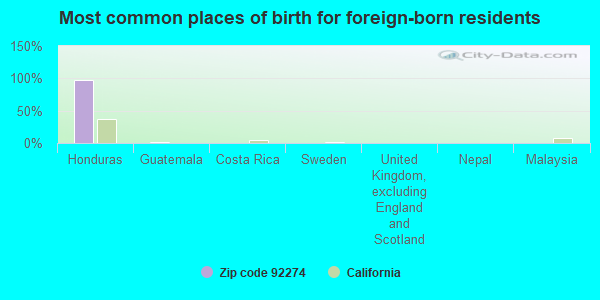
Foreign born population: 7,320 (46.4%) (24.7% of them are naturalized citizens)
This zip code:
46.4%
Whole state:
26.7%
97%Honduras
1%Guatemala
0%Costa Rica
0%Sweden
0%United Kingdom, excluding England and Scotland
0%Nepal
0%Malaysia
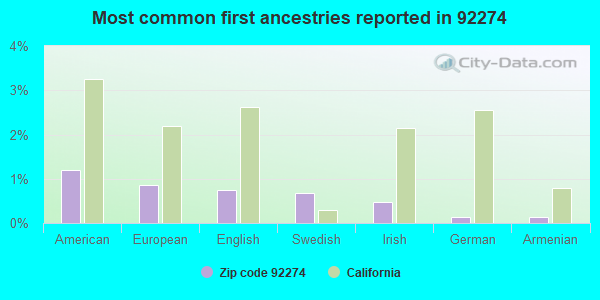
1%American
1%European
1%English
1%Swedish
0%Irish
0%German
0%Armenian
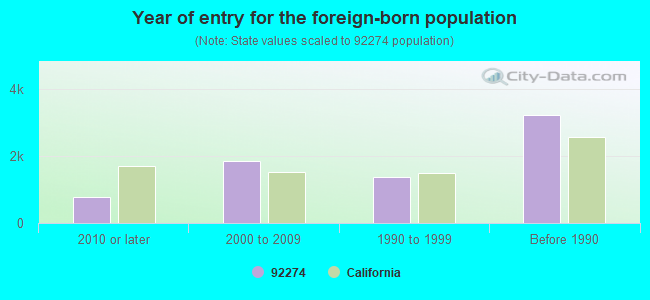
Year of entry for the foreign-born population
7872010 or later
1,8602000 to 2009
1,3871990 to 1999
3,232Before 1990
Facilities with environmental interests located in this zip code:
GOLDEN ACRES (87821 AVE 62 in THERMAL, CA)
STATE MASTER (California - Hazardous Waste Tracking) - HAZARDOU WASTE PROGRAM Small Quantity Generators, between 100 kg and 1000 kg of hazardous waste/month (Resource Conservation and Recovery Act (tracking hazardous waste)) - notification Organizations: GOLDEN ACRES INC (CONTACT/OWNER)
CALIFORNIA REDIDATE L L C (87500 AVE 56 in THERMAL, CA)
STATE MASTER (California - Hazardous Waste Tracking) - HAZARDOU WASTE PROGRAM Small Quantity Generators, between 100 kg and 1000 kg of hazardous waste/month (Resource Conservation and Recovery Act (tracking hazardous waste)) - notification Organizations: CALIFORNIA REDI DATE L L C (CONTACT/OWNER)
Alternative names: CALIFORNIA REDIDATE LLC
JOHN KELLEY ELEMENTARY (87-163 CENTER ST. in THERMAL, CA)
(National Center for Education Statistics) - STATE ID-6032833 Organizations: COACHELLA VALLEY UNIFIED (SCHOOL DISTRICT)
LA FAMILIA CONTINUATION HIGH (56-615 OLIVE ST. in THERMAL, CA)
(National Center for Education Statistics) - STATE ID-3330032 Organizations: COACHELLA VALLEY UNIFIED (SCHOOL DISTRICT)
CHAVEZ (CESAR) ELEMENTARY (49-601 AVENIDA DE ORO in THERMAL, CA)
(National Center for Education Statistics) - STATE ID-6108906 Organizations: COACHELLA VALLEY UNIFIED (SCHOOL DISTRICT)
LAWSON BROTHERS FACILITY (ALLOTMENT 314 T-M in THERMAL, CA)
(Integrated Compliance Information System) - ICIS-09-2003-0044, FORMAL ENFORCEMENT ACTION, ICIS-09-2003-0076, Business SIC classification: REFUSE SYSTEMS
EDS HYDRAULICS (55755 TYLER ST in THERMAL, CA)
Small Quantity Generators, between 100 kg and 1000 kg of hazardous waste/month (Resource Conservation and Recovery Act (tracking hazardous waste)) - notification Organizations: EFREN CASTRO (CONTACT/OWNER)
AGGREGATE PRODUCTS INC. (100 W BRAWLEY AVE in SALTON SEA BEACH, CA)
CRITERIA AND HAZARDOUS AIR POLLUTANT INVENTORY (Inventory of air pollution sources) Business SIC classification: CONSTRUCTION SAND AND GRAVEL; ASPHALT PAVING MIXTURES AND BLOCKS
Housing units lacking complete plumbing facilities: 5.7% Housing units lacking complete kitchen facilities: 5.6%
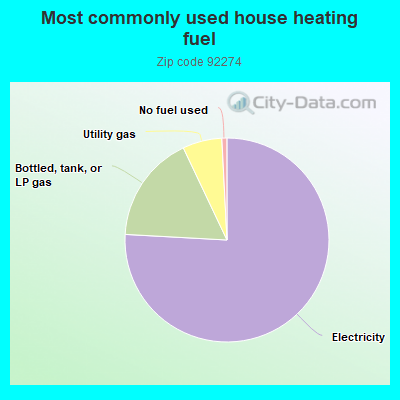
75.5%Electricity
17.0%Bottled, tank, or LP gas
6.2%Utility gas
0.8%No fuel used
Population in 1990: 19,112.
Place of birth for U.S.-born residents:
This state: 7,754
Northeast: 152
Midwest: 241
South: 91
West: 176
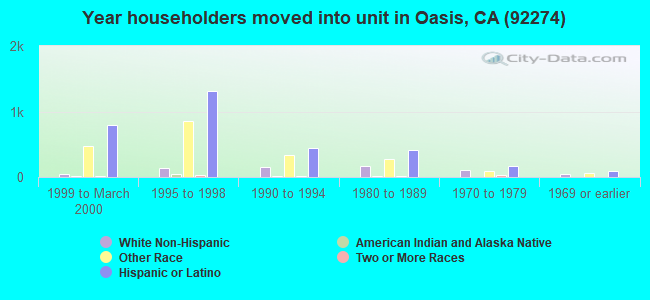
57% of the 92274 zip code residents lived in the same house 5 years ago. Out of people who lived in different houses, 79% lived in this county. Out of people who lived in different counties, 50% lived in California.
97% of the 92274 zip code residents lived in the same house 1 year ago. Out of people who lived in different houses, 50% moved from this county. Out of people who lived in different houses, 62% moved from different county within same state. Out of people who lived in different houses, 1% moved from different state. Out of people who lived in different houses, 5% moved from abroad.
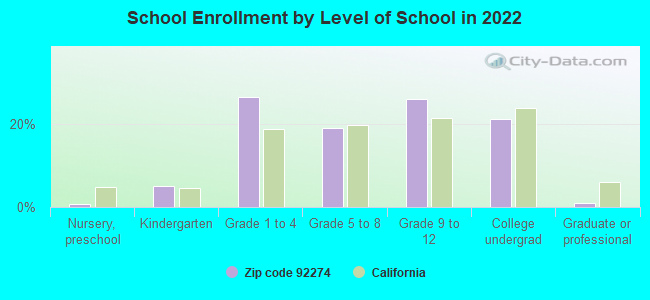
Private vs. public school enrollment:
Students in private schools in grades 1 to 8 (elementary and middle school): 13
Here:
1.0%
California:
10.5%
Students in private schools in grades 9 to 12 (high school): 33
Here:
4.2%
California:
8.5%
Students in private undergraduate colleges: 57
Here:
9.0%
California:
15.9%
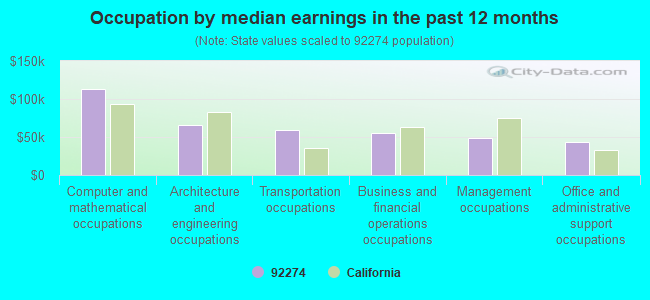
Occupation by median earnings in the past 12 months ($)
112,885Computer and mathematical occupations
65,181Architecture and engineering occupations
58,630Transportation occupations
54,653Business and financial operations occupations
48,053Management occupations
43,323Office and administrative support occupations
Companies with federal contracts located in this zip code:
CALIFORNIA REDI-DATE CO INC (87-500 AVE 56 in THERMAL, CA; small business) : $36,251,432 in 6 contractsfrom 2001 to 2003
Contracts for Fruits and Vegetables by Agricultural Marketing Service, Agricultural Marketing Service (disused code) Signed by year:2000: $0; 2001: $12,827,000; 2002: $15,734,831; 2003: $7,689,601; 2004: $0; 2005: $0; 2006: $0.
Biggest contracts:
$11,122,922 with Agricultural Marketing Service for Fruits and Vegetables. Signed on 2002-10-15. Completion date: 2003-06-15.
$7,689,601, same as above.Signed on 2003-02-15. Completion date: 2003-06-15.
$5,236,000 with Agricultural Marketing Service (disused code) for Fruits and Vegetables. Signed on 2001-05-15. Completion date: 2001-12-15.
$4,692,000, same as above.Signed on 2001-09-15. Completion date: 2002-06-15.
Top industries in this zip code by the number of employees in 2005:
Administrative and Support and Waste Management and Remediation Services: Landscaping Services (100-249 employees: 1 establishment, 50-99 employees: 1 establishment, 10-19 employees: 1 establishment, 1-4 employees: 8 establishments)
Construction: Poured Concrete Foundation and Structure Contractors (50-99: 1, 1-4: 1)
Mining: Construction Sand and Gravel Mining (50-99: 1)
Construction: Water and Sewer Line and Related Structures Construction (20-49: 2)
Construction: All Other Specialty Trade Contractors (20-49: 1, 1-4: 2)
People in group quarters in 2010:
30 people in workers' group living quarters and job corps centers
People in group quarters in 2000:
445 people in agriculture workers' dormitories on farms
65 people in unknown juvenile institutions
Fatal accident statistics in 2014:
Fatal accident count: 5
Vehicles involved in fatal accidents: 9
Fatal accidents caused by drunken drivers: 1
Fatalities: 10
Persons involved in fatal accidents: 19
Pedestrians involved in fatal accidents: 1
Fatal accident statistics in 2012:
Fatal accident count: 6
Vehicles involved in fatal accidents: 10
Fatal accidents caused by drunken drivers: 5
Fatalities: 6
Persons involved in fatal accidents: 16
Pedestrians involved in fatal accidents: 0
Home Mortgage Disclosure Act Aggregated Statistics For Year 2009 (Based on 4 partial tracts)
A) FHA, FSA/RHS & VA Home Purchase Loans
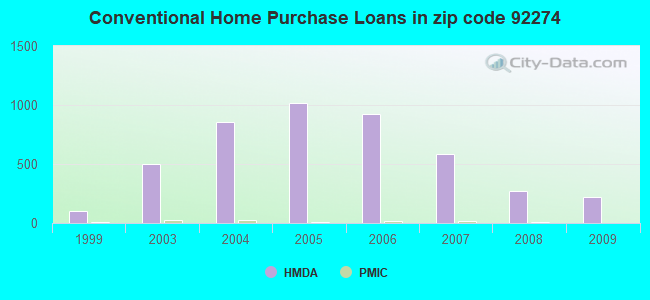
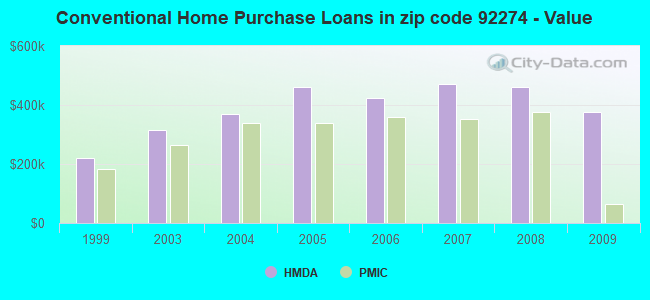
B) Conventional Home Purchase Loans
C) Refinancings
D) Home Improvement Loans
F) Non-occupant Loans on < 5 Family Dwellings (A B C & D)
G) Loans On Manufactured Home Dwelling (A B C & D)
Number
Average Value
Number
Average Value
Number
Average Value
Number
Average Value
Number
Average Value
Number
Average Value
LOANS ORIGINATED
53
$210,656
218
$374,913
491
$354,295
8
$600,832
373
$376,459
3
$210,400
APPLICATIONS APPROVED, NOT ACCEPTED
3
$293,370
33
$372,434
65
$318,592
2
$139,895
44
$338,155
1
$189,740
APPLICATIONS DENIED
14
$138,637
48
$369,531
204
$415,717
15
$129,985
122
$406,620
7
$46,451
APPLICATIONS WITHDRAWN
8
$269,180
32
$404,367
107
$422,342
3
$323,387
53
$364,858
0
$0
FILES CLOSED FOR INCOMPLETENESS
2
$142,575
8
$650,358
20
$413,692
2
$161,870
8
$308,334
0
$0
Aggregated Statistics For Year 2008 (Based on 4 partial tracts)
A) FHA, FSA/RHS & VA Home Purchase Loans
B) Conventional Home Purchase Loans
C) Refinancings
D) Home Improvement Loans
F) Non-occupant Loans on < 5 Family Dwellings (A B C & D)
G) Loans On Manufactured Home Dwelling (A B C & D)
Number
Average Value
Number
Average Value
Number
Average Value
Number
Average Value
Number
Average Value
Number
Average Value
LOANS ORIGINATED
25
$221,690
270
$460,060
235
$470,184
12
$121,767
285
$486,020
2
$255,130
APPLICATIONS APPROVED, NOT ACCEPTED
2
$121,670
46
$469,143
47
$484,944
5
$39,192
43
$434,648
4
$105,845
APPLICATIONS DENIED
6
$187,243
71
$375,185
153
$432,845
26
$192,003
89
$414,699
16
$105,452
APPLICATIONS WITHDRAWN
3
$154,367
44
$423,014
67
$363,666
5
$219,116
46
$448,781
5
$170,208
FILES CLOSED FOR INCOMPLETENESS
0
$0
12
$471,685
26
$428,237
4
$56,375
14
$491,282
0
$0
Aggregated Statistics For Year 2007 (Based on 4 partial tracts)
A) FHA, FSA/RHS & VA Home Purchase Loans
B) Conventional Home Purchase Loans
C) Refinancings
D) Home Improvement Loans
E) Loans on Dwellings For 5+ Families
F) Non-occupant Loans on < 5 Family Dwellings (A B C & D)
G) Loans On Manufactured Home Dwelling (A B C & D)
Number
Average Value
Number
Average Value
Number
Average Value
Number
Average Value
Number
Average Value
Number
Average Value
Number
Average Value
LOANS ORIGINATED
3
$397,347
584
$472,604
417
$556,250
36
$425,179
1
$546,720
456
$553,276
7
$159,331
APPLICATIONS APPROVED, NOT ACCEPTED
0
$0
126
$378,124
118
$535,911
17
$153,274
1
$478,110
100
$512,226
3
$137,217
APPLICATIONS DENIED
0
$0
151
$486,042
270
$490,461
35
$202,673
0
$0
120
$537,707
14
$109,544
APPLICATIONS WITHDRAWN
2
$220,295
79
$437,566
112
$633,179
10
$205,914
0
$0
63
$588,116
3
$172,900
FILES CLOSED FOR INCOMPLETENESS
0
$0
25
$626,791
29
$344,876
4
$258,135
0
$0
11
$451,720
0
$0
Aggregated Statistics For Year 2006 (Based on 4 partial tracts)
A) FHA, FSA/RHS & VA Home Purchase Loans
B) Conventional Home Purchase Loans
C) Refinancings
D) Home Improvement Loans
E) Loans on Dwellings For 5+ Families
F) Non-occupant Loans on < 5 Family Dwellings (A B C & D)
G) Loans On Manufactured Home Dwelling (A B C & D)
Number
Average Value
Number
Average Value
Number
Average Value
Number
Average Value
Number
Average Value
Number
Average Value
Number
Average Value
LOANS ORIGINATED
0
$0
924
$422,428
520
$495,554
43
$299,643
0
$0
568
$500,621
4
$158,752
APPLICATIONS APPROVED, NOT ACCEPTED
0
$0
175
$383,155
106
$407,144
6
$213,150
0
$0
86
$451,640
3
$43,593
APPLICATIONS DENIED
2
$48,555
241
$394,542
259
$485,045
39
$161,440
1
$554,220
126
$449,656
14
$116,104
APPLICATIONS WITHDRAWN
1
$225,120
198
$383,103
132
$430,593
12
$249,151
0
$0
70
$501,091
2
$37,520
FILES CLOSED FOR INCOMPLETENESS
0
$0
21
$408,047
35
$350,792
1
$64,320
0
$0
17
$442,235
0
$0
Aggregated Statistics For Year 2005 (Based on 4 partial tracts)
A) FHA, FSA/RHS & VA Home Purchase Loans
B) Conventional Home Purchase Loans
C) Refinancings
D) Home Improvement Loans
E) Loans on Dwellings For 5+ Families
F) Non-occupant Loans on < 5 Family Dwellings (A B C & D)
G) Loans On Manufactured Home Dwelling (A B C & D)
Number
Average Value
Number
Average Value
Number
Average Value
Number
Average Value
Number
Average Value
Number
Average Value
Number
Average Value
LOANS ORIGINATED
1
$152,220
1,015
$459,857
483
$429,043
52
$321,305
2
$1,179,735
668
$471,022
4
$93,050
APPLICATIONS APPROVED, NOT ACCEPTED
0
$0
161
$414,529
94
$390,119
14
$214,630
0
$0
74
$434,263
6
$110,247
APPLICATIONS DENIED
0
$0
248
$412,400
162
$359,547
40
$173,416
0
$0
121
$458,556
34
$113,655
APPLICATIONS WITHDRAWN
0
$0
214
$391,184
130
$337,573
9
$231,433
0
$0
91
$453,061
3
$107,050
FILES CLOSED FOR INCOMPLETENESS
0
$0
36
$468,597
44
$370,993
3
$184,027
0
$0
19
$477,743
3
$136,660
Aggregated Statistics For Year 2004 (Based on 4 partial tracts)
A) FHA, FSA/RHS & VA Home Purchase Loans
B) Conventional Home Purchase Loans
C) Refinancings
D) Home Improvement Loans
F) Non-occupant Loans on < 5 Family Dwellings (A B C & D)
G) Loans On Manufactured Home Dwelling (A B C & D)
Number
Average Value
Number
Average Value
Number
Average Value
Number
Average Value
Number
Average Value
Number
Average Value
LOANS ORIGINATED
2
$117,385
856
$369,057
436
$360,336
24
$192,829
604
$367,100
0
$0
APPLICATIONS APPROVED, NOT ACCEPTED
0
$0
99
$340,339
96
$274,764
9
$149,608
58
$347,571
8
$100,291
APPLICATIONS DENIED
0
$0
165
$332,260
132
$288,556
34
$125,929
88
$369,450
19
$48,258
APPLICATIONS WITHDRAWN
2
$65,015
116
$338,494
115
$300,372
15
$146,147
65
$355,477
2
$123,280
FILES CLOSED FOR INCOMPLETENESS
0
$0
16
$339,355
37
$191,584
2
$66,465
11
$304,545
0
$0
Aggregated Statistics For Year 2003 (Based on 4 partial tracts)
A) FHA, FSA/RHS & VA Home Purchase Loans
B) Conventional Home Purchase Loans
C) Refinancings
D) Home Improvement Loans
F) Non-occupant Loans on < 5 Family Dwellings (A B C & D)
Number
Average Value
Number
Average Value
Number
Average Value
Number
Average Value
Number
Average Value
LOANS ORIGINATED
25
$107,071
496
$313,801
692
$309,548
9
$40,379
569
$303,199
APPLICATIONS APPROVED, NOT ACCEPTED
1
$126,500
40
$318,532
81
$302,609
1
$85,760
51
$300,715
APPLICATIONS DENIED
2
$173,665
66
$286,412
147
$252,705
18
$47,048
57
$342,164
APPLICATIONS WITHDRAWN
0
$0
47
$277,099
118
$261,575
3
$63,607
41
$328,764
FILES CLOSED FOR INCOMPLETENESS
0
$0
11
$285,095
31
$297,447
0
$0
15
$266,533
Aggregated Statistics For Year 1999 (Based on 2 partial tracts)
A) FHA, FSA/RHS & VA Home Purchase Loans
B) Conventional Home Purchase Loans
C) Refinancings
D) Home Improvement Loans
F) Non-occupant Loans on < 5 Family Dwellings (A B C & D)
Detailed PMIC statistics for the following Tracts:0456.03
, 0456.05
2005 - 2018 National Fire Incident Reporting System (NFIRS) incidents
Based on the data from the years 2005 - 2018 the average number of fires per year is 104. The highest number of fire incidents - 234 took place in 2007, and the least - 18 in 2005. The data has a growing trend.
When looking into fire subcategories, the most reports belonged to: Outside Fires (55.7%), and Mobile Property/Vehicle Fires (26.5%).
Fire incident types reported to NFIRS in Zip Code 92274


+$300
-$7,562
(% of AGI for various income ranges: -0.4% for AGIs below $10k, -0.2% for AGIs $10k-25k, -0.6% for AGIs $50k-75k, 0.9% for AGIs over 100k) Nearest zip codes: 92254, 92236, 92253, 92201, 92275, 92004.


 Based on the data from the years 2005 - 2018 the average number of fires per year is 104. The highest number of fire incidents - 234 took place in 2007, and the least - 18 in 2005. The data has a growing trend.
 When looking into fire subcategories, the most reports belonged to: Outside Fires (55.7%), and Mobile Property/Vehicle Fires (26.5%).