Estimated zip code population in 2022: 16,526
Zip code population in 2010: 15,455
Zip code population in 2000: 14,007
Houses and condos: 5,352
Renter-occupied apartments: 1,580
% of renters here:
30%State:
44%
March 2022 cost of living index in zip code 95673: 100.4
(near average, U.S. average is 100)
Land area: 16.2
sq. mi.
Water area: 0.1
sq. mi.
Population density: 1,019 people per square mile (low).
OSM Map
General Map
Google Map
MSN Map
OSM Map
General Map
Google Map
MSN Map
OSM Map
General Map
Google Map
MSN Map
OSM Map
General Map
Google Map
MSN Map
Please wait while loading the map...
Real estate property taxes paid for housing units in 2022:
This zip code:
0.6% ($2,598)California:
0.7% ($4,831)
Median real estate property taxes paid for housing units with mortgages in 2022: $2,779 (0.6%)
Median real estate property taxes paid for housing units with no mortgage in 2022: $2,144 (0.5%)
Profiles of local businesses
Business Search - 14 Million verified businesses
Males: 7,875 Females: 8,651
For population 25 years and over in 95673:
High school or higher: 87.8%Bachelor's degree or higher: 14.6%Graduate or professional degree: 2.7%Unemployed: 4.1%Mean travel time to work (commute): 32.1 minutes
For population 15 years and over in 95673:
Never married: 31.2%Now married: 52.5%Separated: 1.8%Widowed: 5.5%Divorced: 9.0%
Zip code 95673 compared to state average:
Median house value below state average. Black race population percentage below state average. Hispanic race population percentage below state average. Foreign-born population percentage below state average. Length of stay since moving in significantly above state average. Percentage of population with a bachelor's degree or higher significantly below state average. 10,606 64.2% White 3,737 22.6% Hispanic or Latino 1,067 6.5% Asian 598 3.6% Two or more races 404 2.4% Black 78 0.5% Some other race 20 0.1% Native Hawaiian and Other 12 0.07% American Indian
Data:
Median household income ($)
Median household income (% change since 2000)
Household income diversity
Ratio of average income to average house value (%)
Ratio of average income to average rent
Median household income ($) - White
Median household income ($) - Black or African American
Median household income ($) - Asian
Median household income ($) - Hispanic or Latino
Median household income ($) - American Indian and Alaska Native
Median household income ($) - Multirace
Median household income ($) - Other Race
Median household income for houses/condos with a mortgage ($)
Median household income for apartments without a mortgage ($)
Races - White alone (%)
Races - White alone (% change since 2000)
Races - Black alone (%)
Races - Black alone (% change since 2000)
Races - American Indian alone (%)
Races - American Indian alone (% change since 2000)
Races - Asian alone (%)
Races - Asian alone (% change since 2000)
Races - Hispanic (%)
Races - Hispanic (% change since 2000)
Races - Native Hawaiian and Other Pacific Islander alone (%)
Races - Native Hawaiian and Other Pacific Islander alone (% change since 2000)
Races - Two or more races (%)
Races - Two or more races (% change since 2000)
Races - Other race alone (%)
Races - Other race alone (% change since 2000)
Racial diversity
Unemployment (%)
Unemployment (% change since 2000)
Unemployment (%) - White
Unemployment (%) - Black or African American
Unemployment (%) - Asian
Unemployment (%) - Hispanic or Latino
Unemployment (%) - American Indian and Alaska Native
Unemployment (%) - Multirace
Unemployment (%) - Other Race
Population density (people per square mile)
Population - Males (%)
Population - Females (%)
Population - Males (%) - White
Population - Males (%) - Black or African American
Population - Males (%) - Asian
Population - Males (%) - Hispanic or Latino
Population - Males (%) - American Indian and Alaska Native
Population - Males (%) - Multirace
Population - Males (%) - Other Race
Population - Females (%) - White
Population - Females (%) - Black or African American
Population - Females (%) - Asian
Population - Females (%) - Hispanic or Latino
Population - Females (%) - American Indian and Alaska Native
Population - Females (%) - Multirace
Population - Females (%) - Other Race
Coronavirus confirmed cases (Apr 25, 2024)
Deaths caused by coronavirus (Apr 25, 2024)
Coronavirus confirmed cases (per 100k population) (Apr 25, 2024)
Deaths caused by coronavirus (per 100k population) (Apr 25, 2024)
Daily increase in number of cases (Apr 25, 2024)
Weekly increase in number of cases (Apr 25, 2024)
Cases doubled (in days) (Apr 25, 2024)
Hospitalized patients (Apr 18, 2022)
Negative test results (Apr 18, 2022)
Total test results (Apr 18, 2022)
COVID Vaccine doses distributed (per 100k population) (Sep 19, 2023)
COVID Vaccine doses administered (per 100k population) (Sep 19, 2023)
COVID Vaccine doses distributed (Sep 19, 2023)
COVID Vaccine doses administered (Sep 19, 2023)
Likely homosexual households (%)
Likely homosexual households (% change since 2000)
Likely homosexual households - Lesbian couples (%)
Likely homosexual households - Lesbian couples (% change since 2000)
Likely homosexual households - Gay men (%)
Likely homosexual households - Gay men (% change since 2000)
Cost of living index
Median gross rent ($)
Median contract rent ($)
Median monthly housing costs ($)
Median house or condo value ($)
Median house or condo value ($ change since 2000)
Mean house or condo value by units in structure - 1, detached ($)
Mean house or condo value by units in structure - 1, attached ($)
Mean house or condo value by units in structure - 2 ($)
Mean house or condo value by units in structure by units in structure - 3 or 4 ($)
Mean house or condo value by units in structure - 5 or more ($)
Mean house or condo value by units in structure - Boat, RV, van, etc. ($)
Mean house or condo value by units in structure - Mobile home ($)
Median house or condo value ($) - White
Median house or condo value ($) - Black or African American
Median house or condo value ($) - Asian
Median house or condo value ($) - Hispanic or Latino
Median house or condo value ($) - American Indian and Alaska Native
Median house or condo value ($) - Multirace
Median house or condo value ($) - Other Race
Median resident age
Resident age diversity
Median resident age - Males
Median resident age - Females
Median resident age - White
Median resident age - Black or African American
Median resident age - Asian
Median resident age - Hispanic or Latino
Median resident age - American Indian and Alaska Native
Median resident age - Multirace
Median resident age - Other Race
Median resident age - Males - White
Median resident age - Males - Black or African American
Median resident age - Males - Asian
Median resident age - Males - Hispanic or Latino
Median resident age - Males - American Indian and Alaska Native
Median resident age - Males - Multirace
Median resident age - Males - Other Race
Median resident age - Females - White
Median resident age - Females - Black or African American
Median resident age - Females - Asian
Median resident age - Females - Hispanic or Latino
Median resident age - Females - American Indian and Alaska Native
Median resident age - Females - Multirace
Median resident age - Females - Other Race
Commute - mean travel time to work (minutes)
Travel time to work - Less than 5 minutes (%)
Travel time to work - Less than 5 minutes (% change since 2000)
Travel time to work - 5 to 9 minutes (%)
Travel time to work - 5 to 9 minutes (% change since 2000)
Travel time to work - 10 to 19 minutes (%)
Travel time to work - 10 to 19 minutes (% change since 2000)
Travel time to work - 20 to 29 minutes (%)
Travel time to work - 20 to 29 minutes (% change since 2000)
Travel time to work - 30 to 39 minutes (%)
Travel time to work - 30 to 39 minutes (% change since 2000)
Travel time to work - 40 to 59 minutes (%)
Travel time to work - 40 to 59 minutes (% change since 2000)
Travel time to work - 60 to 89 minutes (%)
Travel time to work - 60 to 89 minutes (% change since 2000)
Travel time to work - 90 or more minutes (%)
Travel time to work - 90 or more minutes (% change since 2000)
Marital status - Never married (%)
Marital status - Now married (%)
Marital status - Separated (%)
Marital status - Widowed (%)
Marital status - Divorced (%)
Median family income ($)
Median family income (% change since 2000)
Median non-family income ($)
Median non-family income (% change since 2000)
Median per capita income ($)
Median per capita income (% change since 2000)
Median family income ($) - White
Median family income ($) - Black or African American
Median family income ($) - Asian
Median family income ($) - Hispanic or Latino
Median family income ($) - American Indian and Alaska Native
Median family income ($) - Multirace
Median family income ($) - Other Race
Median year house/condo built
Median year apartment built
Year house built - Built 2005 or later (%)
Year house built - Built 2000 to 2004 (%)
Year house built - Built 1990 to 1999 (%)
Year house built - Built 1980 to 1989 (%)
Year house built - Built 1970 to 1979 (%)
Year house built - Built 1960 to 1969 (%)
Year house built - Built 1950 to 1959 (%)
Year house built - Built 1940 to 1949 (%)
Year house built - Built 1939 or earlier (%)
Average household size
Household density (households per square mile)
Average household size - White
Average household size - Black or African American
Average household size - Asian
Average household size - Hispanic or Latino
Average household size - American Indian and Alaska Native
Average household size - Multirace
Average household size - Other Race
Occupied housing units (%)
Vacant housing units (%)
Owner occupied housing units (%)
Renter occupied housing units (%)
Vacancy status - For rent (%)
Vacancy status - For sale only (%)
Vacancy status - Rented or sold, not occupied (%)
Vacancy status - For seasonal, recreational, or occasional use (%)
Vacancy status - For migrant workers (%)
Vacancy status - Other vacant (%)
Residents with income below the poverty level (%)
Residents with income below 50% of the poverty level (%)
Children below poverty level (%)
Poor families by family type - Married-couple family (%)
Poor families by family type - Male, no wife present (%)
Poor families by family type - Female, no husband present (%)
Poverty status for native-born residents (%)
Poverty status for foreign-born residents (%)
Poverty among high school graduates not in families (%)
Poverty among people who did not graduate high school not in families (%)
Residents with income below the poverty level (%) - White
Residents with income below the poverty level (%) - Black or African American
Residents with income below the poverty level (%) - Asian
Residents with income below the poverty level (%) - Hispanic or Latino
Residents with income below the poverty level (%) - American Indian and Alaska Native
Residents with income below the poverty level (%) - Multirace
Residents with income below the poverty level (%) - Other Race
Air pollution - Air Quality Index (AQI)
Air pollution - CO
Air pollution - NO2
Air pollution - SO2
Air pollution - Ozone
Air pollution - PM10
Air pollution - PM25
Air pollution - Pb
Crime - Murders per 100,000 population
Crime - Rapes per 100,000 population
Crime - Robberies per 100,000 population
Crime - Assaults per 100,000 population
Crime - Burglaries per 100,000 population
Crime - Thefts per 100,000 population
Crime - Auto thefts per 100,000 population
Crime - Arson per 100,000 population
Crime - City-data.com crime index
Crime - Violent crime index
Crime - Property crime index
Crime - Murders per 100,000 population (5 year average)
Crime - Rapes per 100,000 population (5 year average)
Crime - Robberies per 100,000 population (5 year average)
Crime - Assaults per 100,000 population (5 year average)
Crime - Burglaries per 100,000 population (5 year average)
Crime - Thefts per 100,000 population (5 year average)
Crime - Auto thefts per 100,000 population (5 year average)
Crime - Arson per 100,000 population (5 year average)
Crime - City-data.com crime index (5 year average)
Crime - Violent crime index (5 year average)
Crime - Property crime index (5 year average)
1996 Presidential Elections Results (%) - Democratic Party (Clinton)
1996 Presidential Elections Results (%) - Republican Party (Dole)
1996 Presidential Elections Results (%) - Other
2000 Presidential Elections Results (%) - Democratic Party (Gore)
2000 Presidential Elections Results (%) - Republican Party (Bush)
2000 Presidential Elections Results (%) - Other
2004 Presidential Elections Results (%) - Democratic Party (Kerry)
2004 Presidential Elections Results (%) - Republican Party (Bush)
2004 Presidential Elections Results (%) - Other
2008 Presidential Elections Results (%) - Democratic Party (Obama)
2008 Presidential Elections Results (%) - Republican Party (McCain)
2008 Presidential Elections Results (%) - Other
2012 Presidential Elections Results (%) - Democratic Party (Obama)
2012 Presidential Elections Results (%) - Republican Party (Romney)
2012 Presidential Elections Results (%) - Other
2016 Presidential Elections Results (%) - Democratic Party (Clinton)
2016 Presidential Elections Results (%) - Republican Party (Trump)
2016 Presidential Elections Results (%) - Other
2020 Presidential Elections Results (%) - Democratic Party (Biden)
2020 Presidential Elections Results (%) - Republican Party (Trump)
2020 Presidential Elections Results (%) - Other
Ancestries Reported - Arab (%)
Ancestries Reported - Czech (%)
Ancestries Reported - Danish (%)
Ancestries Reported - Dutch (%)
Ancestries Reported - English (%)
Ancestries Reported - French (%)
Ancestries Reported - French Canadian (%)
Ancestries Reported - German (%)
Ancestries Reported - Greek (%)
Ancestries Reported - Hungarian (%)
Ancestries Reported - Irish (%)
Ancestries Reported - Italian (%)
Ancestries Reported - Lithuanian (%)
Ancestries Reported - Norwegian (%)
Ancestries Reported - Polish (%)
Ancestries Reported - Portuguese (%)
Ancestries Reported - Russian (%)
Ancestries Reported - Scotch-Irish (%)
Ancestries Reported - Scottish (%)
Ancestries Reported - Slovak (%)
Ancestries Reported - Subsaharan African (%)
Ancestries Reported - Swedish (%)
Ancestries Reported - Swiss (%)
Ancestries Reported - Ukrainian (%)
Ancestries Reported - United States (%)
Ancestries Reported - Welsh (%)
Ancestries Reported - West Indian (%)
Ancestries Reported - Other (%)
Educational Attainment - No schooling completed (%)
Educational Attainment - Less than high school (%)
Educational Attainment - High school or equivalent (%)
Educational Attainment - Less than 1 year of college (%)
Educational Attainment - 1 or more years of college (%)
Educational Attainment - Associate degree (%)
Educational Attainment - Bachelor's degree (%)
Educational Attainment - Master's degree (%)
Educational Attainment - Professional school degree (%)
Educational Attainment - Doctorate degree (%)
School Enrollment - Nursery, preschool (%)
School Enrollment - Kindergarten (%)
School Enrollment - Grade 1 to 4 (%)
School Enrollment - Grade 5 to 8 (%)
School Enrollment - Grade 9 to 12 (%)
School Enrollment - College undergrad (%)
School Enrollment - Graduate or professional (%)
School Enrollment - Not enrolled in school (%)
School enrollment - Public schools (%)
School enrollment - Private schools (%)
School enrollment - Not enrolled (%)
Median number of rooms in houses and condos
Median number of rooms in apartments
Housing units lacking complete plumbing facilities (%)
Housing units lacking complete kitchen facilities (%)
Density of houses
Urban houses (%)
Rural houses (%)
Households with people 60 years and over (%)
Households with people 65 years and over (%)
Households with people 75 years and over (%)
Households with one or more nonrelatives (%)
Households with no nonrelatives (%)
Population in households (%)
Family households (%)
Nonfamily households (%)
Population in families (%)
Family households with own children (%)
Median number of bedrooms in owner occupied houses
Mean number of bedrooms in owner occupied houses
Median number of bedrooms in renter occupied houses
Mean number of bedrooms in renter occupied houses
Median number of vehichles in owner occupied houses
Mean number of vehichles in owner occupied houses
Median number of vehichles in renter occupied houses
Mean number of vehichles in renter occupied houses
Mortgage status - with mortgage (%)
Mortgage status - with second mortgage (%)
Mortgage status - with home equity loan (%)
Mortgage status - with both second mortgage and home equity loan (%)
Mortgage status - without a mortgage (%)
Average family size
Average family size - White
Average family size - Black or African American
Average family size - Asian
Average family size - Hispanic or Latino
Average family size - American Indian and Alaska Native
Average family size - Multirace
Average family size - Other Race
Geographical mobility - Same house 1 year ago (%)
Geographical mobility - Moved within same county (%)
Geographical mobility - Moved from different county within same state (%)
Geographical mobility - Moved from different state (%)
Geographical mobility - Moved from abroad (%)
Place of birth - Born in state of residence (%)
Place of birth - Born in other state (%)
Place of birth - Native, outside of US (%)
Place of birth - Foreign born (%)
Housing units in structures - 1, detached (%)
Housing units in structures - 1, attached (%)
Housing units in structures - 2 (%)
Housing units in structures - 3 or 4 (%)
Housing units in structures - 5 to 9 (%)
Housing units in structures - 10 to 19 (%)
Housing units in structures - 20 to 49 (%)
Housing units in structures - 50 or more (%)
Housing units in structures - Mobile home (%)
Housing units in structures - Boat, RV, van, etc. (%)
House/condo owner moved in on average (years ago)
Renter moved in on average (years ago)
Year householder moved into unit - Moved in 1999 to March 2000 (%)
Year householder moved into unit - Moved in 1995 to 1998 (%)
Year householder moved into unit - Moved in 1990 to 1994 (%)
Year householder moved into unit - Moved in 1980 to 1989 (%)
Year householder moved into unit - Moved in 1970 to 1979 (%)
Year householder moved into unit - Moved in 1969 or earlier (%)
Means of transportation to work - Drove car alone (%)
Means of transportation to work - Carpooled (%)
Means of transportation to work - Public transportation (%)
Means of transportation to work - Bus or trolley bus (%)
Means of transportation to work - Streetcar or trolley car (%)
Means of transportation to work - Subway or elevated (%)
Means of transportation to work - Railroad (%)
Means of transportation to work - Ferryboat (%)
Means of transportation to work - Taxicab (%)
Means of transportation to work - Motorcycle (%)
Means of transportation to work - Bicycle (%)
Means of transportation to work - Walked (%)
Means of transportation to work - Other means (%)
Working at home (%)
Industry diversity
Most Common Industries - Agriculture, forestry, fishing and hunting, and mining (%)
Most Common Industries - Agriculture, forestry, fishing and hunting (%)
Most Common Industries - Mining, quarrying, and oil and gas extraction (%)
Most Common Industries - Construction (%)
Most Common Industries - Manufacturing (%)
Most Common Industries - Wholesale trade (%)
Most Common Industries - Retail trade (%)
Most Common Industries - Transportation and warehousing, and utilities (%)
Most Common Industries - Transportation and warehousing (%)
Most Common Industries - Utilities (%)
Most Common Industries - Information (%)
Most Common Industries - Finance and insurance, and real estate and rental and leasing (%)
Most Common Industries - Finance and insurance (%)
Most Common Industries - Real estate and rental and leasing (%)
Most Common Industries - Professional, scientific, and management, and administrative and waste management services (%)
Most Common Industries - Professional, scientific, and technical services (%)
Most Common Industries - Management of companies and enterprises (%)
Most Common Industries - Administrative and support and waste management services (%)
Most Common Industries - Educational services, and health care and social assistance (%)
Most Common Industries - Educational services (%)
Most Common Industries - Health care and social assistance (%)
Most Common Industries - Arts, entertainment, and recreation, and accommodation and food services (%)
Most Common Industries - Arts, entertainment, and recreation (%)
Most Common Industries - Accommodation and food services (%)
Most Common Industries - Other services, except public administration (%)
Most Common Industries - Public administration (%)
Occupation diversity
Most Common Occupations - Management, business, science, and arts occupations (%)
Most Common Occupations - Management, business, and financial occupations (%)
Most Common Occupations - Management occupations (%)
Most Common Occupations - Business and financial operations occupations (%)
Most Common Occupations - Computer, engineering, and science occupations (%)
Most Common Occupations - Computer and mathematical occupations (%)
Most Common Occupations - Architecture and engineering occupations (%)
Most Common Occupations - Life, physical, and social science occupations (%)
Most Common Occupations - Education, legal, community service, arts, and media occupations (%)
Most Common Occupations - Community and social service occupations (%)
Most Common Occupations - Legal occupations (%)
Most Common Occupations - Education, training, and library occupations (%)
Most Common Occupations - Arts, design, entertainment, sports, and media occupations (%)
Most Common Occupations - Healthcare practitioners and technical occupations (%)
Most Common Occupations - Health diagnosing and treating practitioners and other technical occupations (%)
Most Common Occupations - Health technologists and technicians (%)
Most Common Occupations - Service occupations (%)
Most Common Occupations - Healthcare support occupations (%)
Most Common Occupations - Protective service occupations (%)
Most Common Occupations - Fire fighting and prevention, and other protective service workers including supervisors (%)
Most Common Occupations - Law enforcement workers including supervisors (%)
Most Common Occupations - Food preparation and serving related occupations (%)
Most Common Occupations - Building and grounds cleaning and maintenance occupations (%)
Most Common Occupations - Personal care and service occupations (%)
Most Common Occupations - Sales and office occupations (%)
Most Common Occupations - Sales and related occupations (%)
Most Common Occupations - Office and administrative support occupations (%)
Most Common Occupations - Natural resources, construction, and maintenance occupations (%)
Most Common Occupations - Farming, fishing, and forestry occupations (%)
Most Common Occupations - Construction and extraction occupations (%)
Most Common Occupations - Installation, maintenance, and repair occupations (%)
Most Common Occupations - Production, transportation, and material moving occupations (%)
Most Common Occupations - Production occupations (%)
Most Common Occupations - Transportation occupations (%)
Most Common Occupations - Material moving occupations (%)
People in Group quarters - Institutionalized population (%)
People in Group quarters - Correctional institutions (%)
People in Group quarters - Federal prisons and detention centers (%)
People in Group quarters - Halfway houses (%)
People in Group quarters - Local jails and other confinement facilities (including police lockups) (%)
People in Group quarters - Military disciplinary barracks (%)
People in Group quarters - State prisons (%)
People in Group quarters - Other types of correctional institutions (%)
People in Group quarters - Nursing homes (%)
People in Group quarters - Hospitals/wards, hospices, and schools for the handicapped (%)
People in Group quarters - Hospitals/wards and hospices for chronically ill (%)
People in Group quarters - Hospices or homes for chronically ill (%)
People in Group quarters - Military hospitals or wards for chronically ill (%)
People in Group quarters - Other hospitals or wards for chronically ill (%)
People in Group quarters - Hospitals or wards for drug/alcohol abuse (%)
People in Group quarters - Mental (Psychiatric) hospitals or wards (%)
People in Group quarters - Schools, hospitals, or wards for the mentally retarded (%)
People in Group quarters - Schools, hospitals, or wards for the physically handicapped (%)
People in Group quarters - Institutions for the deaf (%)
People in Group quarters - Institutions for the blind (%)
People in Group quarters - Orthopedic wards and institutions for the physically handicapped (%)
People in Group quarters - Wards in general hospitals for patients who have no usual home elsewhere (%)
People in Group quarters - Wards in military hospitals for patients who have no usual home elsewhere (%)
People in Group quarters - Juvenile institutions (%)
People in Group quarters - Long-term care (%)
People in Group quarters - Homes for abused, dependent, and neglected children (%)
People in Group quarters - Residential treatment centers for emotionally disturbed children (%)
People in Group quarters - Training schools for juvenile delinquents (%)
People in Group quarters - Short-term care, detention or diagnostic centers for delinquent children (%)
People in Group quarters - Type of juvenile institution unknown (%)
People in Group quarters - Noninstitutionalized population (%)
People in Group quarters - College dormitories (includes college quarters off campus) (%)
People in Group quarters - Military quarters (%)
People in Group quarters - On base (%)
People in Group quarters - Barracks, unaccompanied personnel housing (UPH), (Enlisted/Officer), ;and similar group living quarters for military personnel (%)
People in Group quarters - Transient quarters for temporary residents (%)
People in Group quarters - Military ships (%)
People in Group quarters - Group homes (%)
People in Group quarters - Homes or halfway houses for drug/alcohol abuse (%)
People in Group quarters - Homes for the mentally ill (%)
People in Group quarters - Homes for the mentally retarded (%)
People in Group quarters - Homes for the physically handicapped (%)
People in Group quarters - Other group homes (%)
People in Group quarters - Religious group quarters (%)
People in Group quarters - Dormitories (%)
People in Group quarters - Agriculture workers' dormitories on farms (%)
People in Group quarters - Job Corps and vocational training facilities (%)
People in Group quarters - Other workers' dormitories (%)
People in Group quarters - Crews of maritime vessels (%)
People in Group quarters - Other nonhousehold living situations (%)
People in Group quarters - Other noninstitutional group quarters (%)
Residents speaking English at home (%)
Residents speaking English at home - Born in the United States (%)
Residents speaking English at home - Native, born elsewhere (%)
Residents speaking English at home - Foreign born (%)
Residents speaking Spanish at home (%)
Residents speaking Spanish at home - Born in the United States (%)
Residents speaking Spanish at home - Native, born elsewhere (%)
Residents speaking Spanish at home - Foreign born (%)
Residents speaking other language at home (%)
Residents speaking other language at home - Born in the United States (%)
Residents speaking other language at home - Native, born elsewhere (%)
Residents speaking other language at home - Foreign born (%)
Class of Workers - Employee of private company (%)
Class of Workers - Self-employed in own incorporated business (%)
Class of Workers - Private not-for-profit wage and salary workers (%)
Class of Workers - Local government workers (%)
Class of Workers - State government workers (%)
Class of Workers - Federal government workers (%)
Class of Workers - Self-employed workers in own not incorporated business and Unpaid family workers (%)
House heating fuel used in houses and condos - Utility gas (%)
House heating fuel used in houses and condos - Bottled, tank, or LP gas (%)
House heating fuel used in houses and condos - Electricity (%)
House heating fuel used in houses and condos - Fuel oil, kerosene, etc. (%)
House heating fuel used in houses and condos - Coal or coke (%)
House heating fuel used in houses and condos - Wood (%)
House heating fuel used in houses and condos - Solar energy (%)
House heating fuel used in houses and condos - Other fuel (%)
House heating fuel used in houses and condos - No fuel used (%)
House heating fuel used in apartments - Utility gas (%)
House heating fuel used in apartments - Bottled, tank, or LP gas (%)
House heating fuel used in apartments - Electricity (%)
House heating fuel used in apartments - Fuel oil, kerosene, etc. (%)
House heating fuel used in apartments - Coal or coke (%)
House heating fuel used in apartments - Wood (%)
House heating fuel used in apartments - Solar energy (%)
House heating fuel used in apartments - Other fuel (%)
House heating fuel used in apartments - No fuel used (%)
Armed forces status - In Armed Forces (%)
Armed forces status - Civilian (%)
Armed forces status - Civilian - Veteran (%)
Armed forces status - Civilian - Nonveteran (%)
Fatal accidents locations in years 2005-2021
Fatal accidents locations in 2005
Fatal accidents locations in 2006
Fatal accidents locations in 2007
Fatal accidents locations in 2008
Fatal accidents locations in 2009
Fatal accidents locations in 2010
Fatal accidents locations in 2011
Fatal accidents locations in 2012
Fatal accidents locations in 2013
Fatal accidents locations in 2014
Fatal accidents locations in 2015
Fatal accidents locations in 2016
Fatal accidents locations in 2017
Fatal accidents locations in 2018
Fatal accidents locations in 2019
Fatal accidents locations in 2020
Fatal accidents locations in 2021
Alcohol use - People drinking some alcohol every month (%)
Alcohol use - People not drinking at all (%)
Alcohol use - Average days/month drinking alcohol
Alcohol use - Average drinks/week
Alcohol use - Average days/year people drink much
Audiometry - Average condition of hearing (%)
Audiometry - People that can hear a whisper from across a quiet room (%)
Audiometry - People that can hear normal voice from across a quiet room (%)
Audiometry - Ears ringing, roaring, buzzing (%)
Audiometry - Had a job exposure to loud noise (%)
Audiometry - Had off-work exposure to loud noise (%)
Blood Pressure & Cholesterol - Has high blood pressure (%)
Blood Pressure & Cholesterol - Checking blood pressure at home (%)
Blood Pressure & Cholesterol - Frequently checking blood cholesterol (%)
Blood Pressure & Cholesterol - Has high cholesterol level (%)
Consumer Behavior - Money monthly spent on food at supermarket/grocery store
Consumer Behavior - Money monthly spent on food at other stores
Consumer Behavior - Money monthly spent on eating out
Consumer Behavior - Money monthly spent on carryout/delivered foods
Consumer Behavior - Income spent on food at supermarket/grocery store (%)
Consumer Behavior - Income spent on food at other stores (%)
Consumer Behavior - Income spent on eating out (%)
Consumer Behavior - Income spent on carryout/delivered foods (%)
Current Health Status - General health condition (%)
Current Health Status - Blood donors (%)
Current Health Status - Has blood ever tested for HIV virus (%)
Current Health Status - Left-handed people (%)
Dermatology - People using sunscreen (%)
Diabetes - Diabetics (%)
Diabetes - Had a blood test for high blood sugar (%)
Diabetes - People taking insulin (%)
Diet Behavior & Nutrition - Diet health (%)
Diet Behavior & Nutrition - Milk product consumption (# of products/month)
Diet Behavior & Nutrition - Meals not home prepared (#/week)
Diet Behavior & Nutrition - Meals from fast food or pizza place (#/week)
Diet Behavior & Nutrition - Ready-to-eat foods (#/month)
Diet Behavior & Nutrition - Frozen meals/pizza (#/month)
Drug Use - People that ever used marijuana or hashish (%)
Drug Use - Ever used hard drugs (%)
Drug Use - Ever used any form of cocaine (%)
Drug Use - Ever used heroin (%)
Drug Use - Ever used methamphetamine (%)
Health Insurance - People covered by health insurance (%)
Kidney Conditions-Urology - Avg. # of times urinating at night
Medical Conditions - People with asthma (%)
Medical Conditions - People with anemia (%)
Medical Conditions - People with psoriasis (%)
Medical Conditions - People with overweight (%)
Medical Conditions - Elderly people having difficulties in thinking or remembering (%)
Medical Conditions - People who ever received blood transfusion (%)
Medical Conditions - People having trouble seeing even with glass/contacts (%)
Medical Conditions - People with arthritis (%)
Medical Conditions - People with gout (%)
Medical Conditions - People with congestive heart failure (%)
Medical Conditions - People with coronary heart disease (%)
Medical Conditions - People with angina pectoris (%)
Medical Conditions - People who ever had heart attack (%)
Medical Conditions - People who ever had stroke (%)
Medical Conditions - People with emphysema (%)
Medical Conditions - People with thyroid problem (%)
Medical Conditions - People with chronic bronchitis (%)
Medical Conditions - People with any liver condition (%)
Medical Conditions - People who ever had cancer or malignancy (%)
Mental Health - People who have little interest in doing things (%)
Mental Health - People feeling down, depressed, or hopeless (%)
Mental Health - People who have trouble sleeping or sleeping too much (%)
Mental Health - People feeling tired or having little energy (%)
Mental Health - People with poor appetite or overeating (%)
Mental Health - People feeling bad about themself (%)
Mental Health - People who have trouble concentrating on things (%)
Mental Health - People moving or speaking slowly or too fast (%)
Mental Health - People having thoughts they would be better off dead (%)
Oral Health - Average years since last visit a dentist
Oral Health - People embarrassed because of mouth (%)
Oral Health - People with gum disease (%)
Oral Health - General health of teeth and gums (%)
Oral Health - Average days a week using dental floss/device
Oral Health - Average days a week using mouthwash for dental problem
Oral Health - Average number of teeth
Pesticide Use - Households using pesticides to control insects (%)
Pesticide Use - Households using pesticides to kill weeds (%)
Physical Activity - People doing vigorous-intensity work activities (%)
Physical Activity - People doing moderate-intensity work activities (%)
Physical Activity - People walking or bicycling (%)
Physical Activity - People doing vigorous-intensity recreational activities (%)
Physical Activity - People doing moderate-intensity recreational activities (%)
Physical Activity - Average hours a day doing sedentary activities
Physical Activity - Average hours a day watching TV or videos
Physical Activity - Average hours a day using computer
Physical Functioning - People having limitations keeping them from working (%)
Physical Functioning - People limited in amount of work they can do (%)
Physical Functioning - People that need special equipment to walk (%)
Physical Functioning - People experiencing confusion/memory problems (%)
Physical Functioning - People requiring special healthcare equipment (%)
Prescription Medications - Average number of prescription medicines taking
Preventive Aspirin Use - Adults 40+ taking low-dose aspirin (%)
Reproductive Health - Vaginal deliveries (%)
Reproductive Health - Cesarean deliveries (%)
Reproductive Health - Deliveries resulted in a live birth (%)
Reproductive Health - Pregnancies resulted in a delivery (%)
Reproductive Health - Women breastfeeding newborns (%)
Reproductive Health - Women that had a hysterectomy (%)
Reproductive Health - Women that had both ovaries removed (%)
Reproductive Health - Women that have ever taken birth control pills (%)
Reproductive Health - Women taking birth control pills (%)
Reproductive Health - Women that have ever used Depo-Provera or injectables (%)
Reproductive Health - Women that have ever used female hormones (%)
Sexual Behavior - People 18+ that ever had sex (vaginal, anal, or oral) (%)
Sexual Behavior - Males 18+ that ever had vaginal sex with a woman (%)
Sexual Behavior - Males 18+ that ever performed oral sex on a woman (%)
Sexual Behavior - Males 18+ that ever had anal sex with a woman (%)
Sexual Behavior - Males 18+ that ever had any sex with a man (%)
Sexual Behavior - Females 18+ that ever had vaginal sex with a man (%)
Sexual Behavior - Females 18+ that ever performed oral sex on a man (%)
Sexual Behavior - Females 18+ that ever had anal sex with a man (%)
Sexual Behavior - Females 18+ that ever had any kind of sex with a woman (%)
Sexual Behavior - Average age people first had sex
Sexual Behavior - Average number of female sex partners in lifetime (males 18+)
Sexual Behavior - Average number of female vaginal sex partners in lifetime (males 18+)
Sexual Behavior - Average age people first performed oral sex on a woman (18+)
Sexual Behavior - Average number of woman performed oral sex on in lifetime (18+)
Sexual Behavior - Average number of male sex partners in lifetime (males 18+)
Sexual Behavior - Average number of male anal sex partners in lifetime (males 18+)
Sexual Behavior - Average age people first performed oral sex on a man (18+)
Sexual Behavior - Average number of male oral sex partners in lifetime (18+)
Sexual Behavior - People using protection when performing oral sex (%)
Sexual Behavior - Average number of times people have vaginal or anal sex a year
Sexual Behavior - People having sex without condom (%)
Sexual Behavior - Average number of male sex partners in lifetime (females 18+)
Sexual Behavior - Average number of male vaginal sex partners in lifetime (females 18+)
Sexual Behavior - Average number of female sex partners in lifetime (females 18+)
Sexual Behavior - Circumcised males 18+ (%)
Sleep Disorders - Average hours sleeping at night
Sleep Disorders - People that has trouble sleeping (%)
Smoking-Cigarette Use - People smoking cigarettes (%)
Taste & Smell - People 40+ having problems with smell (%)
Taste & Smell - People 40+ having problems with taste (%)
Taste & Smell - People 40+ that ever had wisdom teeth removed (%)
Taste & Smell - People 40+ that ever had tonsils teeth removed (%)
Taste & Smell - People 40+ that ever had a loss of consciousness because of a head injury (%)
Taste & Smell - People 40+ that ever had a broken nose or other serious injury to face or skull (%)
Taste & Smell - People 40+ that ever had two or more sinus infections (%)
Weight - Average height (inches)
Weight - Average weight (pounds)
Weight - Average BMI
Weight - People that are obese (%)
Weight - People that ever were obese (%)
Weight - People trying to lose weight (%)
Urban population: 16,462
Rural population: 63
Estimated median house/condo value in 2022: $424,241
95673:
$424,241California:
$715,900
Median resident age: This zip code:
37.2 yearsCalifornia median age:
37.9 years
Average household size: This zip code:
3.2 peopleCalifornia:
2.8 people
Averages for the 2020 tax year for zip code 95673, filed in 2021:
Average Adjusted Gross Income (AGI) in 2020: $55,424 (Individual Income Tax Returns) Here:
$55,424State:
$95,910
Salary/wage: $49,724 (reported on 80.1% of returns )Here:
$49,724State:
$77,331
(% of AGI for various income ranges: 1190.9% for AGIs below $25k , 3682.2% for AGIs $25k-50k , 6904.7% for AGIs $50k-75k , 10174.9% for AGIs $75k-100k , 19234.3% for AGIs $100k-200k , 101895.0% for AGIs over 200k ) Taxable interest for individuals: $417 (reported on 31.7% of returns )This zip code:
$417California:
$2,294
(% of AGI for various income ranges: 4.9% for AGIs below $25k , 8.6% for AGIs $25k-50k , 28.4% for AGIs $50k-75k , 40.6% for AGIs $75k-100k , 50.6% for AGIs $100k-200k , 445.0% for AGIs over 200k ) Ordinary dividends: $2,064 (reported on 7.8% of returns )(% of AGI for various income ranges: 10.0% for AGIs below $25k , 7.4% for AGIs $25k-50k , 23.6% for AGIs $50k-75k , 20.2% for AGIs $75k-100k , 91.5% for AGIs $100k-200k , 915.0% for AGIs over 200k ) Net capital gain/loss in AGI: +$9,995 (reported on 8.3% of returns )Here:
+$9,995State:
+$49,306
(% of AGI for various income ranges: 9.5% for AGIs below $25k , 9.1% for AGIs $25k-50k , 39.1% for AGIs $50k-75k , 99.2% for AGIs $75k-100k , 417.7% for AGIs $100k-200k , 15540.0% for AGIs over 200k ) Profit/loss from business: +$13,018 (reported on 16.3% of returns )Here:
+$13,018State:
+$15,671
(% of AGI for various income ranges: 173.2% for AGIs below $25k , 258.9% for AGIs $25k-50k , 289.0% for AGIs $50k-75k , 386.7% for AGIs $75k-100k , 629.1% for AGIs $100k-200k , 8580.0% for AGIs over 200k ) Taxable individual retirement arrangement distribution: $15,394 (reported on 4.7% of returns )95673:
$15,394California:
$23,505
(% of AGI for various income ranges: 25.9% for AGIs below $25k , 49.9% for AGIs $25k-50k , 122.9% for AGIs $50k-75k , 130.4% for AGIs $75k-100k , 527.0% for AGIs $100k-200k ) Total itemized deductions: $27,391 (reported on 9.4% of returns )Here:
$27,391State:
$39,517
(% of AGI for various income ranges: 49.9% for AGIs below $25k , 139.7% for AGIs $25k-50k , 426.0% for AGIs $50k-75k , 736.3% for AGIs $75k-100k , 1228.9% for AGIs $100k-200k , 15335.0% for AGIs over 200k ) Charity contributions: $4,604 (reported on 6.8% of returns )(% of AGI for various income ranges: 2.3% for AGIs below $25k , 12.6% for AGIs $25k-50k , 44.9% for AGIs $50k-75k , 92.4% for AGIs $75k-100k , 207.0% for AGIs $100k-200k , 1465.0% for AGIs over 200k ) Taxes paid: $7,357 (reported on 9.4% of returns )(% of AGI for various income ranges: 12.1% for AGIs below $25k , 31.1% for AGIs $25k-50k , 115.7% for AGIs $50k-75k , 223.7% for AGIs $75k-100k , 390.9% for AGIs $100k-200k , 2590.0% for AGIs over 200k ) Earned income credit: $2,132 (reported on 17.8% of returns )(% of AGI for various income ranges: 100.6% for AGIs below $25k , 78.6% for AGIs $25k-50k , 1.3% for AGIs $50k-75k ) Percentage of individuals using paid preparers for their 2020 taxes: 91.7%(% for various income ranges: 91.0% for AGIs below $25k , 92.6% for AGIs $25k-50k , 91.6% for AGIs $50k-75k , 92.2% for AGIs $75k-100k , 91.2% for AGIs $100k-200k , 91.7% for AGIs over 200k )
Averages for the 2012 tax year for zip code 95673, filed in 2013:
Average Adjusted Gross Income (AGI) in 2012: $42,333 (Individual Income Tax Returns) Here:
$42,333State:
$72,726
Salary/wage: $38,843 (reported on 81.2% of returns )Here:
$38,843State:
$59,079
(% of AGI for various income ranges: 67.7% for AGIs below $25k , 77.3% for AGIs $25k-50k , 74.9% for AGIs $50k-75k , 76.0% for AGIs $75k-100k , 77.1% for AGIs $100k-200k , 51.6% for AGIs over 200k ) Taxable interest for individuals: $425 (reported on 32.9% of returns )This zip code:
$425California:
$2,146
(% of AGI for various income ranges: 0.6% for AGIs below $25k , 0.2% for AGIs $25k-50k , 0.4% for AGIs $50k-75k , 0.3% for AGIs $75k-100k , 0.2% for AGIs $100k-200k , 0.6% for AGIs over 200k ) Ordinary dividends: $1,919 (reported on 8.4% of returns )(% of AGI for various income ranges: 0.6% for AGIs below $25k , 0.2% for AGIs $25k-50k , 0.4% for AGIs $50k-75k , 0.4% for AGIs $75k-100k , 0.5% for AGIs $100k-200k ) Net capital gain/loss in AGI: +$3,105 (reported on 6.5% of returns )Here:
+$3,105State:
+$30,460
(% of AGI for various income ranges: 0.6% for AGIs $75k-100k , 1.9% for AGIs $100k-200k ) Profit/loss from business: +$10,816 (reported on 16.5% of returns )Here:
+$10,816State:
+$17,064
(% of AGI for various income ranges: 12.1% for AGIs below $25k , 4.6% for AGIs $25k-50k , 2.9% for AGIs $50k-75k , 1.6% for AGIs $75k-100k , 3.3% for AGIs $100k-200k ) Taxable individual retirement arrangement distribution: $11,188 (reported on 5.3% of returns )95673:
$11,188California:
$19,557
(% of AGI for various income ranges: 1.5% for AGIs below $25k , 0.8% for AGIs $25k-50k , 1.3% for AGIs $50k-75k , 1.8% for AGIs $75k-100k , 2.0% for AGIs $100k-200k ) Total itemized deductions: $19,055 (27% of AGI, reported on 30.4% of returns )Here:
$19,055State:
$34,004
Here:
26.5% of AGIState:
22.7% of AGI
(% of AGI for various income ranges: 8.4% for AGIs below $25k , 10.7% for AGIs $25k-50k , 14.5% for AGIs $50k-75k , 15.0% for AGIs $75k-100k , 17.4% for AGIs $100k-200k , 19.4% for AGIs over 200k ) Charity contributions: $2,210 (reported on 23.1% of returns )(% of AGI for various income ranges: 0.5% for AGIs below $25k , 0.7% for AGIs $25k-50k , 1.3% for AGIs $50k-75k , 1.7% for AGIs $75k-100k , 1.7% for AGIs $100k-200k , 1.4% for AGIs over 200k ) Taxes paid: $5,386 (reported on 30.2% of returns )95673:
$5,386State:
$14,448
(% of AGI for various income ranges: 1.7% for AGIs below $25k , 2.2% for AGIs $25k-50k , 3.7% for AGIs $50k-75k , 4.4% for AGIs $75k-100k , 6.3% for AGIs $100k-200k , 7.1% for AGIs over 200k ) Earned income credit: $2,436 (reported on 24.6% of returns )(% of AGI for various income ranges: 8.5% for AGIs below $25k , 1.5% for AGIs $25k-50k ) Percentage of individuals using paid preparers for their 2012 taxes: 54.2%(% for various income ranges: 51.9% for AGIs below $25k , 54.3% for AGIs $25k-50k , 57.4% for AGIs $50k-75k , 55.2% for AGIs $75k-100k , 55.8% for AGIs $100k-200k , 100.0% for AGIs over 200k )
Averages for the 2004 tax year for zip code 95673, filed in 2005:
Average Adjusted Gross Income (AGI) in 2004: $39,036 (Individual Income Tax Returns) Here:
$39,036State:
$58,600
Salary/wage: $37,237 (reported on 84.8% of returns )Here:
$37,237State:
$49,455
(% of AGI for various income ranges: 160.5% for AGIs below $10k , 74.4% for AGIs $10k-25k , 82.3% for AGIs $25k-50k , 83.6% for AGIs $50k-75k , 86.2% for AGIs $75k-100k , 68.1% for AGIs over 100k ) Taxable interest for individuals: $753 (reported on 43.2% of returns )This zip code:
$753California:
$2,365
(% of AGI for various income ranges: 6.6% for AGIs below $10k , 1.1% for AGIs $10k-25k , 0.7% for AGIs $25k-50k , 0.7% for AGIs $50k-75k , 0.4% for AGIs $75k-100k , 1.3% for AGIs over 100k ) Taxable dividends: $1,021 (reported on 11.7% of returns )(% of AGI for various income ranges: 2.4% for AGIs below $10k , 0.3% for AGIs $10k-25k , 0.2% for AGIs $25k-50k , 0.4% for AGIs $50k-75k , 0.1% for AGIs $75k-100k , 0.4% for AGIs over 100k ) Net capital gain/loss: +$8,325 (reported on 9.8% of returns )Here:
+$8,325State:
+$23,418
(% of AGI for various income ranges: 2.7% for AGIs below $10k , 0.1% for AGIs $10k-25k , 0.5% for AGIs $25k-50k , 0.4% for AGIs $50k-75k , 1.1% for AGIs $75k-100k , 9.5% for AGIs over 100k ) Profit/loss from business: +$10,273 (reported on 15.1% of returns )Here:
+$10,273State:
+$16,826
(% of AGI for various income ranges: -1.6% for AGIs below $10k , 7.1% for AGIs $10k-25k , 2.9% for AGIs $25k-50k , 2.7% for AGIs $50k-75k , 2.1% for AGIs $75k-100k , 8.1% for AGIs over 100k ) IRA payment deduction: $2,612 (reported on 1.7% of returns )95673:
$2,612California:
$3,192
(% of AGI for various income ranges: 0.1% for AGIs $10k-25k , 0.2% for AGIs $25k-50k , 0.1% for AGIs $50k-75k , 0.1% for AGIs $75k-100k ) Self-employed pension: $8,364 (reported on 0.6% of returns )Here:
$8,364California:
$17,688
Total itemized deductions: $18,063 (29% of AGI, reported on 39.7% of returns )Here:
$18,063State:
$28,113
Here:
29.3% of AGIState:
25.3% of AGI
(% of AGI for various income ranges: 32.4% for AGIs below $10k , 13.0% for AGIs $10k-25k , 17.3% for AGIs $25k-50k , 20.6% for AGIs $50k-75k , 20.2% for AGIs $75k-100k , 17.3% for AGIs over 100k ) Charity contributions deductions: $1,946 (3% of AGI, reported on 33.1% of returns )Here:
3.1% of AGIState:
3.3% of AGI
(% of AGI for various income ranges: 1.2% for AGIs below $10k , 1.0% for AGIs $10k-25k , 1.4% for AGIs $25k-50k , 2.0% for AGIs $50k-75k , 2.0% for AGIs $75k-100k , 1.7% for AGIs over 100k ) Total tax: $4,440 (reported on 75.2% of returns )95673:
$4,440State:
$10,761
(% of AGI for various income ranges: 5.9% for AGIs below $10k , 4.2% for AGIs $10k-25k , 6.3% for AGIs $25k-50k , 7.7% for AGIs $50k-75k , 9.6% for AGIs $75k-100k , 15.2% for AGIs over 100k ) Earned income credit: $1,717 (reported on 16.9% of returns )Percentage of individuals using paid preparers for their 2004 taxes: 59.1%(% for various income ranges: 51.1% for AGIs below $10k , 58.8% for AGIs $10k-25k , 59.1% for AGIs $25k-50k , 61.2% for AGIs $50k-75k , 63.9% for AGIs $75k-100k , 73.9% for AGIs over 100k )
Estimated median household income in 2022: This zip code:
$88,524California:
$91,551
Nearest zip codes: 95626 ,
95838 ,
95652 ,
95835 ,
95660 ,
95834 .
Sacramento Zip Code Map
Percentage of family households: This zip code:
55.6%California:
46.8%
Percentage of households with unmarried partners: This zip code:
7.8%California:
48.1%
Likely homosexual households (counted as self-reported same-sex unmarried-partner households)
Lesbian couples: 0.5% of all households Gay men: 0.0% of all households
Household received Food Stamps/SNAP in the past 12 months: 873Household did not receive Food Stamps/SNAP in the past 12 months: 4,390
Women who had a birth in the past 12 months: 347 (237 now married , 109 unmarried) Women who did not have a birth in the past 12 months: 3,447 (1,632 now married , 1,803 unmarried)
Housing units in zip code 95673 with a mortgage: 2,577 (213
second mortgage , 28
home equity loan , 171
both second mortgage and home equity loan )
Houses without a mortgage: 64
Median monthly owner costs for units with a mortgage: $2,000
Median monthly owner costs for units without a mortgage: $602
Residents with income below the poverty level in 2022:
This zip code:
13.4%Whole state:
12.2%
Residents with income below 50% of the poverty level in 2022:
This zip code:
5.3%Whole state:
6.2%
Median number of rooms in houses and condos: Median number of rooms in apartments: Notable locations in this zip code not listed on our city pages
Click to draw/clear zip code borders Notable locations in zip code 95673: (A) , Rio Linda Neighborhood Library (B) , Sacramento Metropolitan Fire District Station 111 (C) . Display/hide their locations on the map
Shopping Center: (1) . Display/hide its location on the map
Churches in zip code 95673 include: (A) , Calvary Lutheran Church (B) , First Apostolic Church of Rio Linda (C) , First Baptist Church of Rio Linda (D) , First Fijian Church of God (E) , First Southern Baptist Church (F) , Full Gospel Community Church of Rio Linda (G) , New Life Church of God (H) , Pentecostal Church of God (I) . Display/hide their locations on the map
Parks in zip code 95673 include: (1) , Babe Park (2) , Depot Park (3) , Linda Creek Park (4) , Westside Park (5) , Cherry Island Soccer Complex (6) . Display/hide their locations on the map
Year house built (houses)
0 2020 or later31 2010 to 2019590 2000 to 2009496 1990 to 19991,095 1980 to 1989568 1970 to 1979706 1960 to 19691,171 1950 to 1959280 1940 to 1949294 1939 or earlier
Zip code 95673 household income distribution in 2022 253 Less than $10,000183 $10,000 to $14,99968 $15,000 to $19,999213 $20,000 to $24,99975 $25,000 to $29,999141 $30,000 to $34,999150 $35,000 to $39,999137 $40,000 to $44,999166 $45,000 to $49,999233 $50,000 to $59,999422 $60,000 to $74,999888 $75,000 to $99,999748 $100,000 to $124,999598 $125,000 to $149,999586 $150,000 to $199,999342 $200,000 or moreEstimate of home value of owner-occupied houses/condos in 2022 in zip code 95673 13 Less than $10,0009 $30,000 to $34,9997 $35,000 to $39,99936 $40,000 to $49,99917 $60,000 to $69,99931 $100,000 to $124,9995 $125,000 to $149,99967 $150,000 to $174,99969 $175,000 to $199,999196 $200,000 to $249,999199 $250,000 to $299,999858 $300,000 to $399,999596 $400,000 to $499,999783 $500,000 to $749,999227 $750,000 to $999,99951 $1,000,000 to $1,499,999Rent paid by renters in 2022 in zip code 95673 69 $200 to $24910 $400 to $44953 $500 to $5495 $550 to $59910 $600 to $6495 $700 to $74916 $750 to $799110 $800 to $899155 $900 to $999186 $1,000 to $1,249188 $1,250 to $1,499563 $1,500 to $1,99923 $2,000 to $2,49954 $3,000 to $3,499158 No cash rent
Median gross rent in 2022: $1,666.
Median price asked for vacant for-sale houses and condos in 2022: $1,743,920.
Estimated median house (or condo) value in 2022 for: White Non-Hispanic householders: $422,775Black or African American householders: $494,581American Indian or Alaska Native householders: $412,151Asian householders: $544,406Some other race householders: $396,031Two or more races householders: $470,402Hispanic or Latino householders: $368,554Estimated median house or condo value in 2022: $424,241
95673:
$424,241California:
$715,900
Lower value quartile - upper value quartile: $334,806 - $588,700
Mean price in 2022: Detached houses: $400,113Here:
$400,113State:
$988,808
Townhouses or other attached units: $431,703Here:
$431,703State:
$838,546
Mobile homes: $122,644Here:
$122,644State:
$184,506
Housing units in structures:
One, detached: 4,872One, attached: 136Two: 545 to 9: 410 to 19: 7220 to 49: 4850 or more: 28Mobile homes: 124Unemployment : 4.1%
Means of transportation to work in zip code 95673 75.5% 5,460 Drove a car alone7.5% 544 Carpooled0.4% 30 Bus or trolley bus0.2% 18 Railroad0.2% 11 Taxi0.1% 10 Motorcycle0.5% 34 Walked0.5% 35 Other means14.7% 1,064 Worked at homeTravel time to work (commute) in zip code 95673 60 Less than 5 minutes223 5 to 9 minutes503 10 to 14 minutes667 15 to 19 minutes1,067 20 to 24 minutes466 25 to 29 minutes1,244 30 to 34 minutes314 35 to 39 minutes261 40 to 44 minutes562 45 to 59 minutes415 60 to 89 minutes340 90 or more minutes
Neighborhoods in zip code 95673: Percentage of zip code residents living and working in this county: 77.1%
Household type by relationship:
Households: 16,526
Male householders: 2,389 (419 living alone ), Female householders: 2,835 (423 living alone )2,901 spouses (2,852 opposite-sex spouses ), 447 unmarried partners , (427 opposite-sex unmarried partners ), 4,895 children (4,794 natural , 70 adopted , 34 stepchildren ), 724 grandchildren , 403 brothers or sisters , 359 parents , 0 foster children , 956 other relatives , 488 non-relatives In group quarters: 108 (-1 institutionalized population )
Size of family households: 1,236 2-persons , 1,121 3-persons , 641 4-persons , 498 5-persons , 265 6-persons , 282 7-or-more-persons
Size of nonfamily households: 841 1-person , 289 2-persons , 27 3-persons
2,025 married couples with children. single-parent households (193 men , 754 women ).
73.9% of residents of 95673 zip code speak English at home. of residents speak Spanish at home (67% very well, 15% well, 12% not well, 5% not at all ).of residents speak other Indo-European language at home (45% very well, 30% well, 25% not well ).of residents speak Asian or Pacific Island language at home (65% very well, 23% well, 11% not well, 1% not at all ).of residents speak other language at home (64% very well, 36% not well ).
Foreign born population: 2,341 (14.2%)
(60.0%
of them are naturalized citizens )
This zip code:
14.2%Whole state:
26.7%
35% Honduras 15% Romania 13% Serbia 6% Indonesia 6% Malaysia 3% Japan 3% Azerbaijan 6% Russian 4% German 4% Ukrainian 3% English 3% European 3% American 2% Irish
Year of entry for the foreign-born population
573 2010 or later 502 2000 to 2009 900 1990 to 1999 482 Before 1990
Facilities with environmental interests located in this zip code:
CAPITAL AUTO PARTS/TOWING (6721 26TH ST in RIO LINDA, CA)
ENFORCEMENT/COMPLIANCE ACTIVITY (Integrated Compliance Information System) National Pollutant Discharge Elimination System NON-MAJOR (Tracking pollutant discharge elimination systems) - permit
NELLA OIL #68 FLYERS (732 M STREET in RIO LINDA, CA)
Conditionally Exempt Small Quantity Generators, less than 100 kg/month of hazardous waste (Resource Conservation and Recovery Act (tracking hazardous waste)) Organizations: NELLA OIL COMPANY (CONTACT/OPERATOR)
JOHN TAYLOR FERTILIZERS, INC. - RIO LINDA (841 WEST ELKHORN BOULEVARD in RIO LINDA, CA)
COMPLIANCE ACTIVITY (Tracking inspections of insecticide, fungicide, and rodenticide, and toxic substances)
NELSON'S AUTO/TRUCK DISMANTLER (6801 WEST 6TH STREET in RIO LINDA, CA)
ENFORCEMENT/COMPLIANCE ACTIVITY (Integrated Compliance Information System)
CALIFORNIA AUTO RECYCLING (815B STRAUGH ROAD in RIO LINDA, CA)
ENFORCEMENT/COMPLIANCE ACTIVITY (Integrated Compliance Information System)
Housing units lacking complete plumbing facilities: 1.6%
Housing units lacking complete kitchen facilities: 1.7%
64.3% Utility gas 29.1% Electricity 3.5% Bottled, tank, or LP gas 1.7% Wood 0.6% No fuel used 0.5% Fuel oil, kerosene, etc.
Population in 1990: 12,756. Population change in the 1990s: +1,251 (+9.8%).
Place of birth for U.S.-born residents:
This state: 11,060Northeast: 527Midwest: 569South: 747West: 1,136
55% of the 95673 zip code residents lived in the same house 5 years ago.
Out of people who lived in different houses, 79% lived in this county.
Out of people who lived in different counties, 50% lived in California.
90% of the 95673 zip code residents lived in the same house 1 year ago.
Out of people who lived in different houses, 68% moved from this county.
Out of people who lived in different houses, 13% moved from different county within same state.
Out of people who lived in different houses, 4% moved from different state.
Out of people who lived in different houses, 14% moved from abroad.
Private vs. public school enrollment:
Students in private schools in grades 1 to 8 (elementary and middle school): 181
Here:
10.9%California:
10.5%
Students in private schools in grades 9 to 12 (high school): 60
Students in private undergraduate colleges: 110
Here:
18.2%California:
15.9%
Occupation by median earnings in the past 12 months ($)
131,962 Life, physical, and social science occupations 101,725 Health diagnosing and treating practitioners and other technical occupations 77,312 Management occupations 74,815 Health technologists and technicians 74,163 Architecture and engineering occupations 64,608 Construction and extraction occupations
Top industries in this zip code by the number of employees in 2005:
Wholesale Trade: Wholesale Trade Agents and Brokers (250-499 employees: 1 establishment, 1-4 employees: 1 establishment)Construction: Plumbing, Heating, and Air-Conditioning Contractors (50-99: 2, 10-19: 1, 5-9: 2, 1-4: 2)Accommodation and Food Services: Limited-Service Restaurants (50-99: 1, 20-49: 2, 10-19: 1, 5-9: 1, 1-4: 4)Administrative and Support and Waste Management and Remediation Services: Exterminating and Pest Control Services (20-49: 1, 1-4: 2)Wholesale Trade: Farm Supplies Merchant Wholesalers (20-49: 1)Construction: Masonry Contractors (20-49: 1)
People in group quarters in 2010:
31 people in group homes intended for adults
13 people in residential treatment centers for adults
7 people in workers' group living quarters and job corps centers
2 people in other noninstitutional facilities
People in group quarters in 2000:
14 people in homes or halfway houses for drug/alcohol abuse
14 people in homes for the mentally retarded
13 people in nursing homes
11 people in schools, hospitals, or wards for the intellectually disabled
8 people in other noninstitutional group quarters
4 people in homes for the physically handicapped
Fatal accident statistics in 2013:
Fatal accident count: 2Vehicles involved in fatal accidents: 3Fatal accidents caused by drunken drivers: 1Fatalities: 2Persons involved in fatal accidents: 4Pedestrians involved in fatal accidents: 0
Fatal accident statistics in 2010:
Fatal accident count: 2Vehicles involved in fatal accidents: 3Fatal accidents caused by drunken drivers: 0Fatalities: 2Persons involved in fatal accidents: 7Pedestrians involved in fatal accidents: 1
Home Mortgage Disclosure Act Aggregated Statistics For Year 2009(Based on 5 full and 4 partial tracts) A) FHA, FSA/RHS & VA B) Conventional C) Refinancings D) Home Improvement Loans F) Non-occupant Loans on G) Loans On Manufactured Number Average Value Number Average Value Number Average Value Number Average Value Number Average Value Number Average Value
LOANS ORIGINATED 212 $153,856 126 $132,353 248 $161,544 15 $108,699 48 $108,141 7 $101,411 APPLICATIONS APPROVED, NOT ACCEPTED 12 $229,202 31 $162,900 40 $179,760 5 $83,714 7 $89,697 1 $166,520 APPLICATIONS DENIED 55 $181,004 55 $163,575 192 $211,290 31 $99,644 28 $157,294 5 $72,588 APPLICATIONS WITHDRAWN 37 $163,376 24 $147,675 92 $195,533 9 $126,688 18 $132,187 2 $58,990 FILES CLOSED FOR INCOMPLETENESS 1 $203,380 9 $98,279 20 $230,120 1 $19,800 2 $56,890 0 $0
Aggregated Statistics For Year 2008(Based on 5 full and 4 partial tracts) A) FHA, FSA/RHS & VA B) Conventional C) Refinancings D) Home Improvement Loans E) Loans on Dwellings For 5+ Families F) Non-occupant Loans on G) Loans On Manufactured Number Average Value Number Average Value Number Average Value Number Average Value Number Average Value Number Average Value Number Average Value
LOANS ORIGINATED 142 $175,461 200 $149,296 202 $186,502 44 $69,643 0 $0 73 $123,677 8 $180,925 APPLICATIONS APPROVED, NOT ACCEPTED 18 $167,597 43 $152,628 57 $225,499 11 $80,781 0 $0 16 $150,416 1 $70,000 APPLICATIONS DENIED 32 $198,253 88 $179,324 303 $241,451 80 $78,811 1 $173,620 58 $149,653 8 $97,019 APPLICATIONS WITHDRAWN 18 $189,213 35 $159,814 131 $237,397 23 $118,338 0 $0 14 $182,202 1 $108,150 FILES CLOSED FOR INCOMPLETENESS 3 $170,217 12 $204,189 20 $273,045 2 $308,875 0 $0 4 $166,110 2 $329,375
Aggregated Statistics For Year 2007(Based on 5 full and 4 partial tracts) A) FHA, FSA/RHS & VA B) Conventional C) Refinancings D) Home Improvement Loans F) Non-occupant Loans on G) Loans On Manufactured Number Average Value Number Average Value Number Average Value Number Average Value Number Average Value Number Average Value
LOANS ORIGINATED 9 $236,987 305 $245,968 677 $219,768 103 $142,870 93 $220,852 12 $199,747 APPLICATIONS APPROVED, NOT ACCEPTED 0 $0 68 $245,537 170 $247,806 28 $91,631 18 $266,649 6 $168,250 APPLICATIONS DENIED 4 $248,578 210 $246,983 645 $259,587 157 $138,049 86 $217,084 30 $289,415 APPLICATIONS WITHDRAWN 0 $0 70 $284,136 275 $246,249 37 $152,471 24 $215,158 3 $343,763 FILES CLOSED FOR INCOMPLETENESS 0 $0 11 $277,606 86 $298,621 6 $130,522 2 $187,645 3 $148,317
Aggregated Statistics For Year 2006(Based on 5 full and 4 partial tracts) A) FHA, FSA/RHS & VA B) Conventional C) Refinancings D) Home Improvement Loans F) Non-occupant Loans on G) Loans On Manufactured Number Average Value Number Average Value Number Average Value Number Average Value Number Average Value Number Average Value
LOANS ORIGINATED 3 $206,227 547 $220,999 1,238 $229,252 233 $133,718 140 $199,452 19 $236,527 APPLICATIONS APPROVED, NOT ACCEPTED 1 $209,140 152 $238,707 261 $251,605 45 $147,964 39 $220,857 12 $213,740 APPLICATIONS DENIED 2 $106,420 282 $235,091 675 $247,030 192 $118,195 64 $237,395 35 $163,848 APPLICATIONS WITHDRAWN 0 $0 139 $225,570 485 $245,977 60 $177,451 23 $262,388 3 $125,203 FILES CLOSED FOR INCOMPLETENESS 1 $397,700 36 $239,871 121 $272,819 8 $130,031 2 $249,780 5 $171,448
Aggregated Statistics For Year 2005(Based on 5 full and 4 partial tracts) A) FHA, FSA/RHS & VA B) Conventional C) Refinancings D) Home Improvement Loans E) Loans on Dwellings For 5+ Families F) Non-occupant Loans on G) Loans On Manufactured Number Average Value Number Average Value Number Average Value Number Average Value Number Average Value Number Average Value Number Average Value
LOANS ORIGINATED 7 $274,389 863 $206,801 1,743 $215,965 245 $151,761 1 $361,450 197 $227,357 36 $208,029 APPLICATIONS APPROVED, NOT ACCEPTED 1 $280,000 195 $207,711 272 $226,665 53 $113,795 0 $0 35 $166,637 29 $148,007 APPLICATIONS DENIED 6 $257,147 330 $225,163 771 $226,050 174 $116,454 0 $0 64 $240,245 29 $143,723 APPLICATIONS WITHDRAWN 1 $312,000 204 $202,900 625 $216,968 97 $165,062 0 $0 55 $221,345 9 $137,594 FILES CLOSED FOR INCOMPLETENESS 0 $0 54 $210,476 221 $229,607 14 $201,399 0 $0 13 $202,433 5 $240,156
Aggregated Statistics For Year 2004(Based on 5 full and 4 partial tracts) A) FHA, FSA/RHS & VA B) Conventional C) Refinancings D) Home Improvement Loans E) Loans on Dwellings For 5+ Families F) Non-occupant Loans on G) Loans On Manufactured Number Average Value Number Average Value Number Average Value Number Average Value Number Average Value Number Average Value Number Average Value
LOANS ORIGINATED 23 $222,028 731 $175,279 1,654 $175,200 209 $122,318 0 $0 203 $168,348 38 $162,631 APPLICATIONS APPROVED, NOT ACCEPTED 2 $322,730 131 $183,888 301 $181,200 32 $76,818 1 $323,570 26 $196,824 13 $159,622 APPLICATIONS DENIED 11 $192,386 259 $183,076 661 $178,326 152 $76,737 0 $0 50 $192,335 33 $122,442 APPLICATIONS WITHDRAWN 0 $0 122 $190,136 594 $174,457 67 $106,370 0 $0 32 $241,639 8 $156,636 FILES CLOSED FOR INCOMPLETENESS 0 $0 35 $187,651 244 $175,290 9 $48,899 0 $0 12 $179,165 3 $132,913
Aggregated Statistics For Year 2003(Based on 5 full and 4 partial tracts) A) FHA, FSA/RHS & VA B) Conventional C) Refinancings D) Home Improvement Loans E) Loans on Dwellings For 5+ Families F) Non-occupant Loans on Number Average Value Number Average Value Number Average Value Number Average Value Number Average Value Number Average Value
LOANS ORIGINATED 94 $183,327 541 $146,394 2,224 $142,555 99 $37,584 1 $650,000 177 $133,534 APPLICATIONS APPROVED, NOT ACCEPTED 11 $178,116 74 $147,674 319 $147,972 29 $42,807 0 $0 31 $138,448 APPLICATIONS DENIED 15 $183,425 145 $138,336 743 $146,959 88 $28,963 0 $0 48 $152,386 APPLICATIONS WITHDRAWN 13 $176,126 93 $155,736 654 $141,466 13 $56,676 0 $0 27 $136,331 FILES CLOSED FOR INCOMPLETENESS 3 $173,310 19 $159,875 95 $143,131 6 $41,403 0 $0 5 $100,802
Aggregated Statistics For Year 2002(Based on 2 full and 2 partial tracts) A) FHA, FSA/RHS & VA B) Conventional C) Refinancings D) Home Improvement Loans E) Loans on Dwellings For 5+ Families F) Non-occupant Loans on Number Average Value Number Average Value Number Average Value Number Average Value Number Average Value Number Average Value
LOANS ORIGINATED 54 $144,947 190 $133,689 480 $135,236 26 $37,332 2 $2,395,440 42 $117,682 APPLICATIONS APPROVED, NOT ACCEPTED 3 $183,540 59 $92,778 86 $105,724 5 $28,252 0 $0 9 $129,128 APPLICATIONS DENIED 6 $130,558 66 $126,363 229 $142,061 33 $35,454 0 $0 14 $142,501 APPLICATIONS WITHDRAWN 4 $211,270 29 $136,761 180 $139,611 4 $41,565 0 $0 6 $130,488 FILES CLOSED FOR INCOMPLETENESS 0 $0 4 $132,440 36 $138,179 0 $0 0 $0 4 $118,915
Aggregated Statistics For Year 2001(Based on 2 full and 2 partial tracts) A) FHA, FSA/RHS & VA B) Conventional C) Refinancings D) Home Improvement Loans F) Non-occupant Loans on Number Average Value Number Average Value Number Average Value Number Average Value Number Average Value
LOANS ORIGINATED 48 $129,843 131 $125,790 432 $120,507 10 $19,459 43 $94,691 APPLICATIONS APPROVED, NOT ACCEPTED 4 $118,548 31 $127,732 65 $132,879 1 $65,520 4 $97,192 APPLICATIONS DENIED 0 $0 35 $126,040 244 $123,294 15 $33,615 25 $102,033 APPLICATIONS WITHDRAWN 2 $106,300 34 $124,630 140 $111,834 9 $29,377 9 $66,928 FILES CLOSED FOR INCOMPLETENESS 0 $0 5 $74,708 42 $120,070 2 $24,955 3 $88,543
Aggregated Statistics For Year 2000(Based on 2 full and 2 partial tracts) A) FHA, FSA/RHS & VA B) Conventional C) Refinancings D) Home Improvement Loans E) Loans on Dwellings For 5+ Families F) Non-occupant Loans on Number Average Value Number Average Value Number Average Value Number Average Value Number Average Value Number Average Value
LOANS ORIGINATED 65 $111,525 118 $111,846 109 $94,190 22 $36,941 1 $125,860 15 $92,623 APPLICATIONS APPROVED, NOT ACCEPTED 4 $111,472 19 $104,614 20 $109,590 15 $31,536 0 $0 4 $96,462 APPLICATIONS DENIED 8 $104,296 41 $88,472 92 $84,389 30 $30,503 0 $0 13 $88,263 APPLICATIONS WITHDRAWN 3 $156,200 21 $93,042 59 $80,820 3 $8,837 0 $0 4 $37,592 FILES CLOSED FOR INCOMPLETENESS 0 $0 3 $97,707 33 $95,651 0 $0 0 $0 6 $73,882
Aggregated Statistics For Year 1999(Based on 2 full and 2 partial tracts) A) FHA, FSA/RHS & VA B) Conventional C) Refinancings D) Home Improvement Loans E) Loans on Dwellings For 5+ Families F) Non-occupant Loans on Number Average Value Number Average Value Number Average Value Number Average Value Number Average Value Number Average Value
LOANS ORIGINATED 115 $102,599 102 $93,334 248 $89,805 43 $27,459 3 $114,420 35 $72,445 APPLICATIONS APPROVED, NOT ACCEPTED 4 $105,410 12 $105,445 67 $84,516 23 $23,297 0 $0 7 $79,891 APPLICATIONS DENIED 11 $96,565 32 $84,179 158 $79,175 55 $25,400 2 $86,450 7 $62,620 APPLICATIONS WITHDRAWN 15 $112,481 24 $116,049 100 $94,797 3 $36,530 2 $170,895 6 $60,893 FILES CLOSED FOR INCOMPLETENESS 2 $137,875 8 $103,961 35 $91,661 0 $0 0 $0 4 $87,425
Private Mortgage Insurance Companies Aggregated Statistics For Year 2009(Based on 5 full and 4 partial tracts) A) Conventional B) Refinancings Number Average Value Number Average Value
LOANS ORIGINATED 18 $160,159 0 $0 APPLICATIONS APPROVED, NOT ACCEPTED 7 $155,216 2 $529,990 APPLICATIONS DENIED 2 $185,460 0 $0 APPLICATIONS WITHDRAWN 0 $0 0 $0 FILES CLOSED FOR INCOMPLETENESS 2 $309,410 0 $0
Aggregated Statistics For Year 2008(Based on 5 full and 4 partial tracts) A) Conventional B) Refinancings C) Non-occupant Loans on Number Average Value Number Average Value Number Average Value
LOANS ORIGINATED 77 $209,314 17 $264,652 2 $171,500 APPLICATIONS APPROVED, NOT ACCEPTED 42 $275,599 21 $297,144 2 $333,410 APPLICATIONS DENIED 4 $148,765 5 $336,924 0 $0 APPLICATIONS WITHDRAWN 3 $182,800 1 $181,520 0 $0 FILES CLOSED FOR INCOMPLETENESS 2 $255,140 2 $287,940 3 $276,627
Aggregated Statistics For Year 2007(Based on 5 full and 4 partial tracts) A) Conventional B) Refinancings C) Non-occupant Loans on Number Average Value Number Average Value Number Average Value
LOANS ORIGINATED 82 $283,240 56 $324,094 2 $312,025 APPLICATIONS APPROVED, NOT ACCEPTED 11 $267,432 19 $299,525 1 $163,360 APPLICATIONS DENIED 1 $272,000 1 $366,310 0 $0 APPLICATIONS WITHDRAWN 4 $404,420 5 $279,542 0 $0 FILES CLOSED FOR INCOMPLETENESS 0 $0 0 $0 0 $0
Aggregated Statistics For Year 2006(Based on 5 full and 4 partial tracts) A) Conventional B) Refinancings Number Average Value Number Average Value
LOANS ORIGINATED 15 $340,974 29 $342,253 APPLICATIONS APPROVED, NOT ACCEPTED 2 $323,340 11 $309,160 APPLICATIONS DENIED 0 $0 0 $0 APPLICATIONS WITHDRAWN 0 $0 3 $296,330 FILES CLOSED FOR INCOMPLETENESS 0 $0 0 $0
Aggregated Statistics For Year 2005(Based on 5 full and 4 partial tracts) A) Conventional B) Refinancings C) Non-occupant Loans on D) Loans On Manufactured Number Average Value Number Average Value Number Average Value Number Average Value
LOANS ORIGINATED 27 $272,197 38 $304,784 3 $248,633 2 $357,320 APPLICATIONS APPROVED, NOT ACCEPTED 8 $288,298 19 $264,388 2 $304,420 0 $0 APPLICATIONS DENIED 0 $0 0 $0 0 $0 0 $0 APPLICATIONS WITHDRAWN 2 $312,130 6 $302,298 2 $285,945 0 $0 FILES CLOSED FOR INCOMPLETENESS 0 $0 0 $0 0 $0 0 $0
Aggregated Statistics For Year 2004(Based on 5 full and 4 partial tracts) A) Conventional B) Refinancings C) Non-occupant Loans on D) Loans On Manufactured Number Average Value Number Average Value Number Average Value Number Average Value
LOANS ORIGINATED 48 $224,442 37 $233,769 7 $184,713 3 $197,723 APPLICATIONS APPROVED, NOT ACCEPTED 10 $156,430 22 $190,774 1 $162,000 0 $0 APPLICATIONS DENIED 0 $0 0 $0 0 $0 0 $0 APPLICATIONS WITHDRAWN 3 $192,753 3 $239,190 0 $0 0 $0 FILES CLOSED FOR INCOMPLETENESS 11 $284,455 7 $209,480 0 $0 0 $0
Aggregated Statistics For Year 2003(Based on 5 full and 4 partial tracts) A) Conventional B) Refinancings C) Non-occupant Loans on Number Average Value Number Average Value Number Average Value
LOANS ORIGINATED 86 $192,811 89 $177,767 13 $161,083 APPLICATIONS APPROVED, NOT ACCEPTED 23 $192,989 46 $168,022 1 $126,000 APPLICATIONS DENIED 3 $236,867 4 $198,755 0 $0 APPLICATIONS WITHDRAWN 0 $0 7 $168,926 0 $0 FILES CLOSED FOR INCOMPLETENESS 0 $0 0 $0 0 $0
Aggregated Statistics For Year 2002(Based on 2 full and 2 partial tracts) A) Conventional B) Refinancings C) Non-occupant Loans on Number Average Value Number Average Value Number Average Value
LOANS ORIGINATED 37 $174,283 28 $168,723 0 $0 APPLICATIONS APPROVED, NOT ACCEPTED 6 $211,942 13 $149,958 0 $0 APPLICATIONS DENIED 2 $78,850 0 $0 2 $78,850 APPLICATIONS WITHDRAWN 0 $0 0 $0 0 $0 FILES CLOSED FOR INCOMPLETENESS 0 $0 2 $119,770 0 $0
Aggregated Statistics For Year 2001(Based on 2 full and 2 partial tracts) A) Conventional B) Refinancings C) Non-occupant Loans on Number Average Value Number Average Value Number Average Value
LOANS ORIGINATED 45 $148,289 33 $151,416 1 $69,770 APPLICATIONS APPROVED, NOT ACCEPTED 5 $104,934 14 $149,089 0 $0 APPLICATIONS DENIED 0 $0 2 $206,445 0 $0 APPLICATIONS WITHDRAWN 0 $0 2 $177,415 0 $0 FILES CLOSED FOR INCOMPLETENESS 0 $0 0 $0 0 $0
Aggregated Statistics For Year 2000(Based on 2 full and 2 partial tracts) A) Conventional B) Refinancings C) Non-occupant Loans on Number Average Value Number Average Value Number Average Value
LOANS ORIGINATED 38 $119,443 15 $125,688 5 $98,980 APPLICATIONS APPROVED, NOT ACCEPTED 11 $173,616 0 $0 0 $0 APPLICATIONS DENIED 2 $194,630 0 $0 0 $0 APPLICATIONS WITHDRAWN 0 $0 0 $0 0 $0 FILES CLOSED FOR INCOMPLETENESS 0 $0 0 $0 0 $0
Aggregated Statistics For Year 1999(Based on 2 full and 2 partial tracts) A) Conventional B) Refinancings C) Non-occupant Loans on Number Average Value Number Average Value Number Average Value
LOANS ORIGINATED 33 $110,724 25 $113,359 7 $67,706 APPLICATIONS APPROVED, NOT ACCEPTED 6 $125,825 8 $104,659 0 $0 APPLICATIONS DENIED 0 $0 1 $106,130 0 $0 APPLICATIONS WITHDRAWN 0 $0 0 $0 0 $0 FILES CLOSED FOR INCOMPLETENESS 2 $117,370 1 $96,940 0 $0
2005 - 2018 National Fire Incident Reporting System (NFIRS) incidents See full 2006 National Fire Incident Reporting System statistics for zip code 95673, California
Most common first names in zip code 95673 among deceased individuals Name Count Lived (average)
John 88 72.1 years James 66 68.2 years William 62 71.0 years Robert 60 68.6 years Mary 47 75.6 years George 38 73.4 years Charles 37 67.7 years Edward 27 64.9 years Joseph 27 68.3 years Walter 24 73.9 years
Most common last names in zip code 95673 among deceased individuals Last name Count Lived (average)
Smith 33 68.7 years Brown 26 72.7 years Johnson 24 81.2 years Green 20 69.3 years Williams 18 75.6 years Jones 16 72.4 years Clark 15 75.1 years Davis 15 70.4 years Cox 12 69.2 years Wilson 12 73.3 years
Businesses in zip code 95673
Name Count Name Count
7-Eleven 1 Subway 1 KFC 1 True Value 1 McDonald's 1 UPS 1

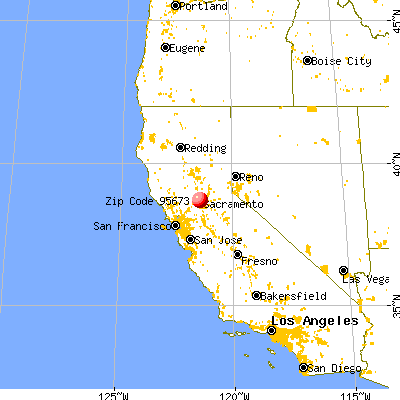


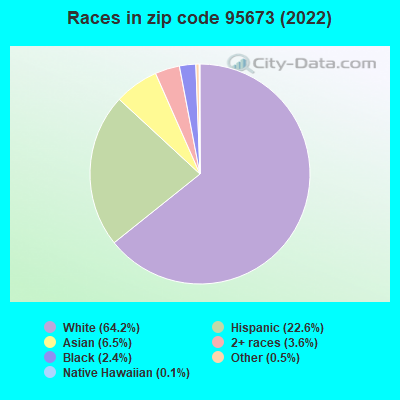


 Nearest zip codes: 95626, 95838, 95652, 95835, 95660, 95834.
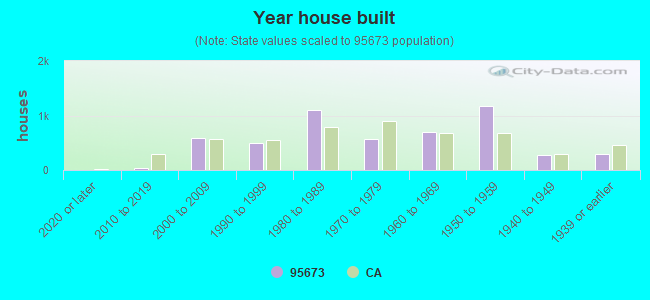
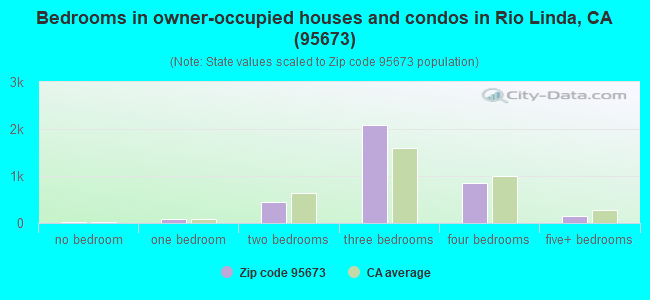
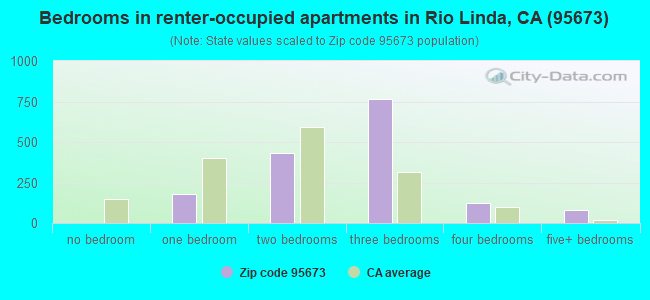
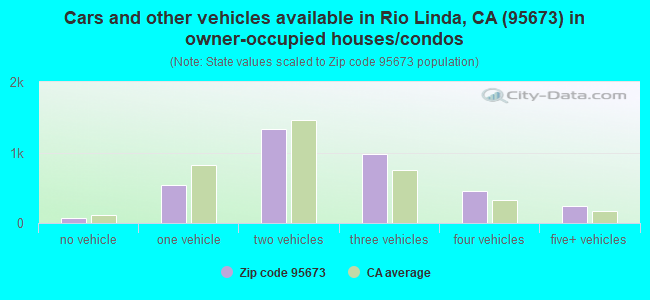


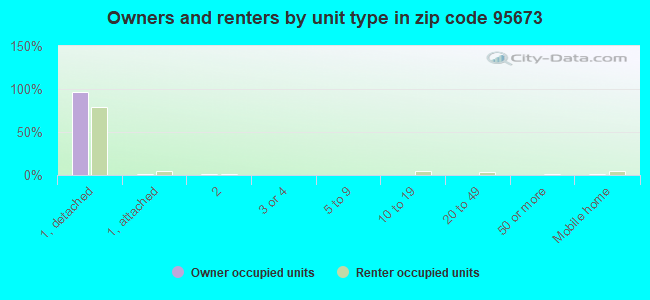


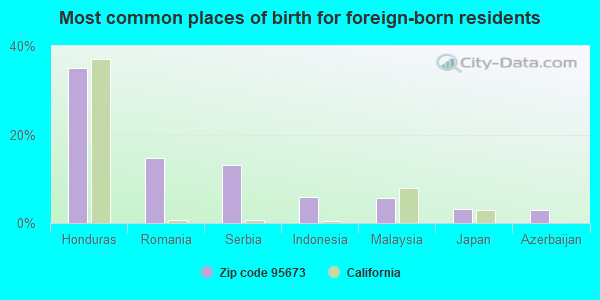
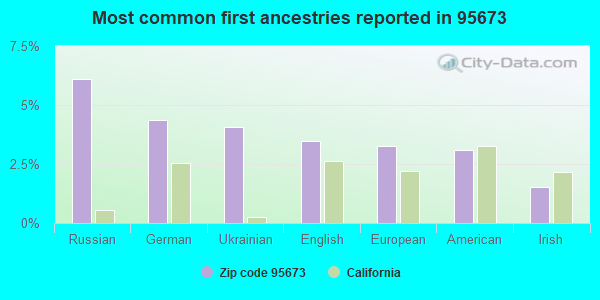
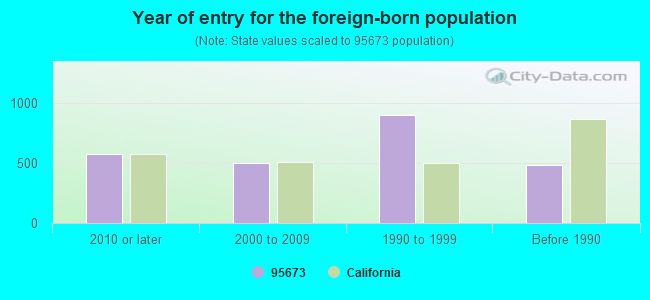
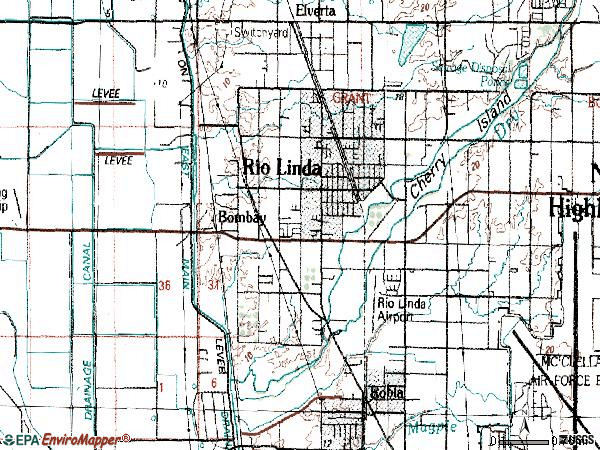


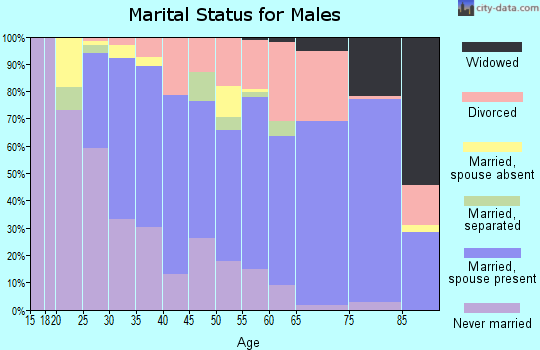
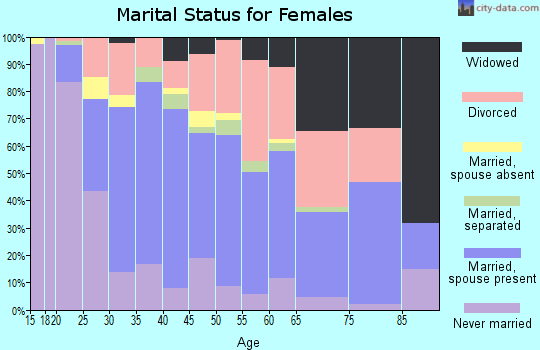
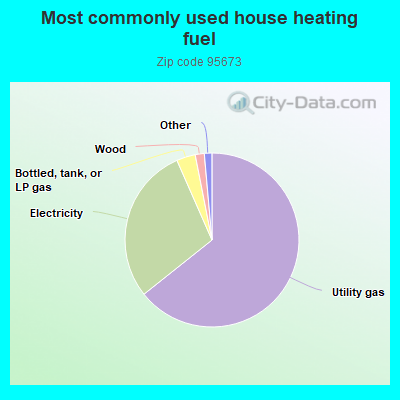
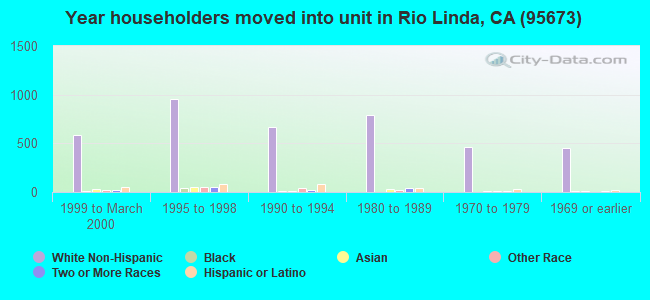
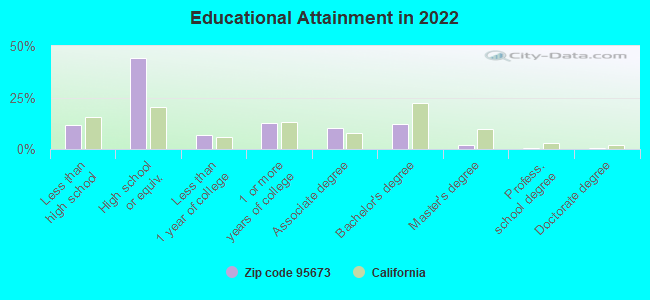
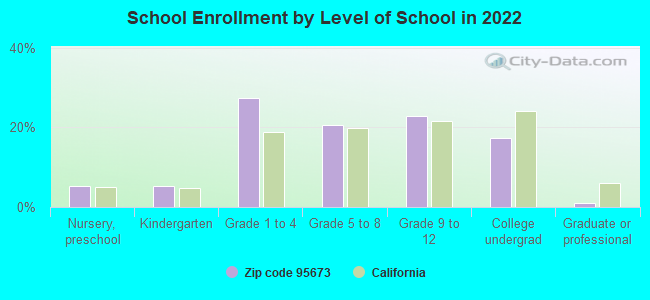
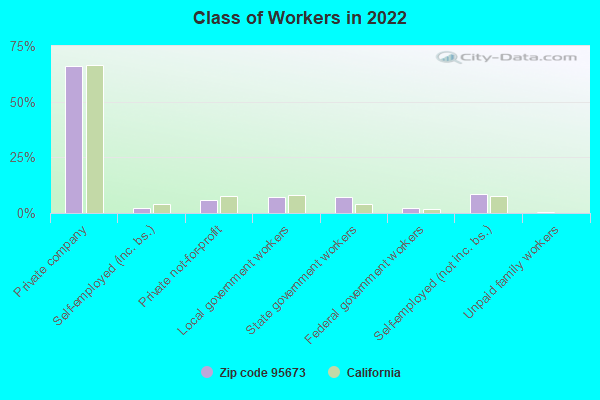
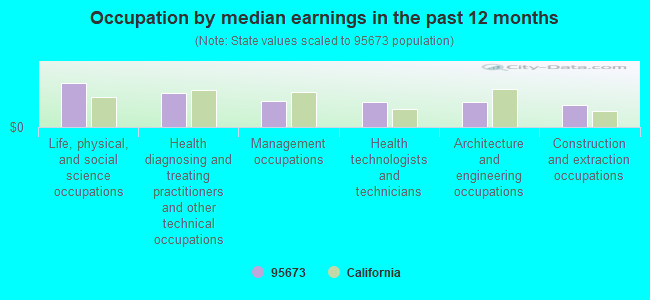
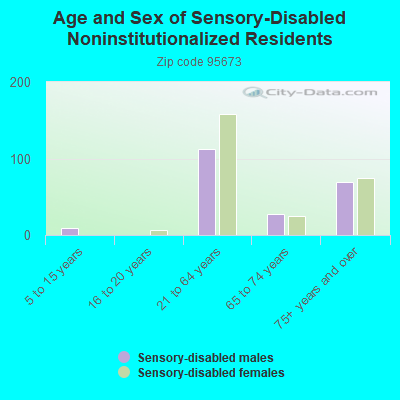
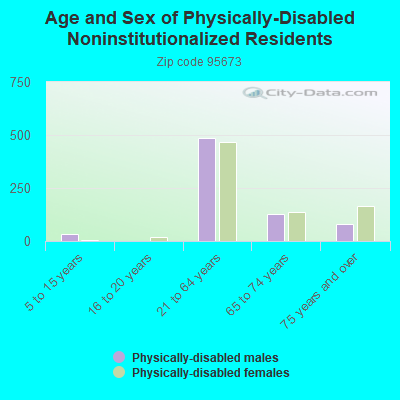
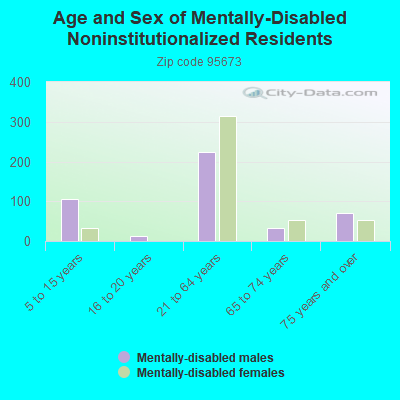
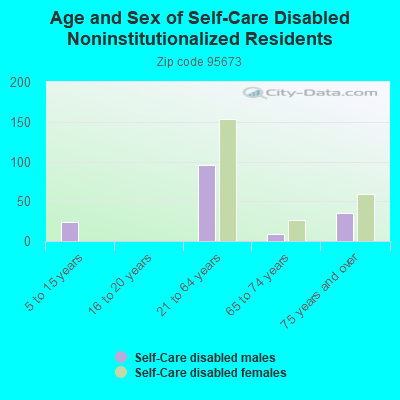
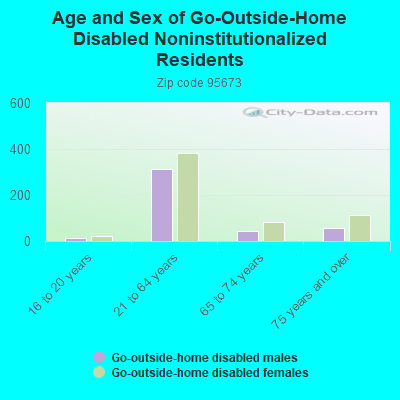
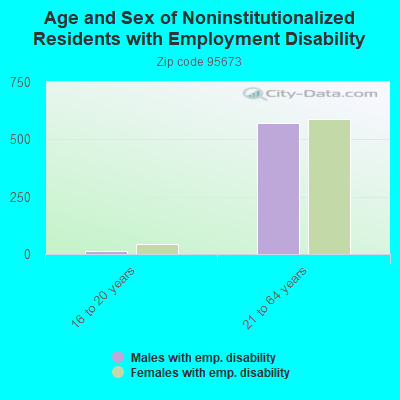
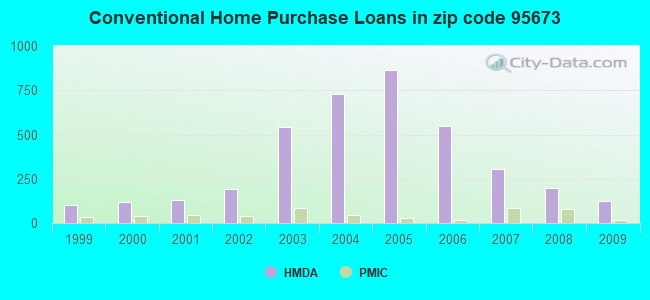
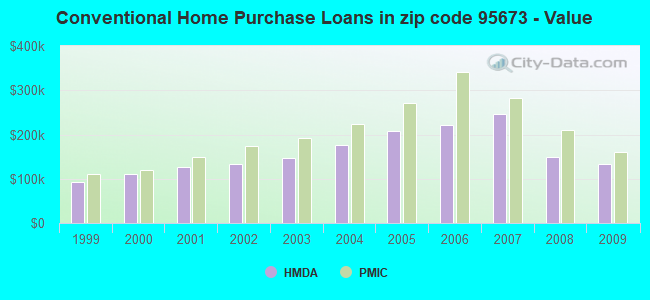
 Based on the data from the years 2005 - 2018 the average number of fires per year is 52. The highest number of reported fire incidents - 70 took place in 2010, and the least - 23 in 2006. The data has a rising trend.
 When looking into fire subcategories, the most incidents belonged to: Outside Fires (61.8%), and Structure Fires (17.9%).