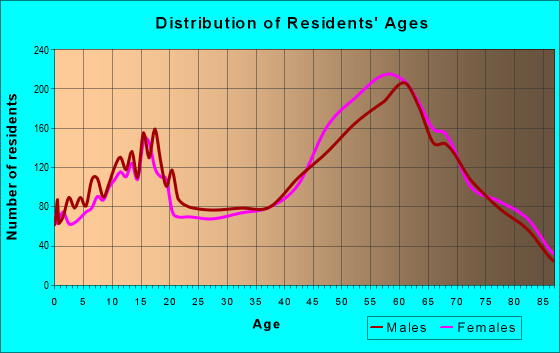
Estimated zip code population in 2022: 21,055 Zip code population in 2010: 19,741 Zip code population in 2000: 17,909
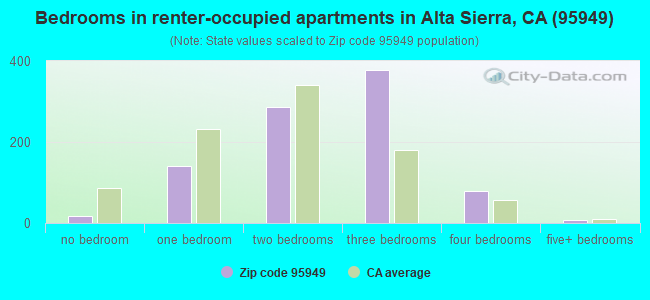
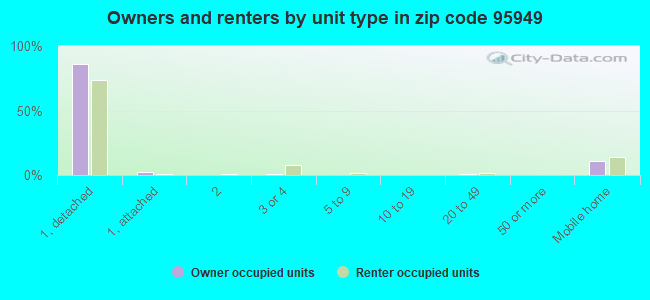
Houses and condos: 8,912 Renter-occupied apartments: 913
% of renters here:
11%
State:
44%
March 2022 cost of living index in zip code 95949: 97.9 (near average, U.S. average is 100)
Land area: 139.6 sq. mi. Water area: 0.2 sq. mi.
Population density: 151 people per square mile
(very low).
OSM Map
General Map
Google Map
MSN Map
OSM Map
General Map
Google Map
MSN Map
OSM Map
General Map
Google Map
MSN Map
OSM Map
General Map
Google Map
MSN Map
Please wait while loading the map...
Real estate property taxes paid for housing units in 2022:
This zip code:
0.7% ($4,033)
California:
0.7% ($4,831)
Median real estate property taxes paid for housing units with mortgages in 2022: $4,281 (0.8%) Median real estate property taxes paid for housing units with no mortgage in 2022: $3,637 (0.7%)
Averages for the 2020 tax year for zip code 95949, filed in 2021:
Average Adjusted Gross Income (AGI) in 2020: $81,971 (Individual Income Tax Returns)
Here:
$81,971
State:
$95,910
Salary/wage: $66,721 (reported on 64.5% of returns)
Here:
$66,721
State:
$77,331
(% of AGI for various income ranges: 1037.0% for AGIs below $25k, 3162.3% for AGIs $25k-50k, 5915.8% for AGIs $50k-75k, 8826.1% for AGIs $75k-100k, 17433.9% for AGIs $100k-200k, 65267.5% for AGIs over 200k)
Taxable interest for individuals: $1,156 (reported on 49.5% of returns)
This zip code:
$1,156
California:
$2,294
(% of AGI for various income ranges: 34.9% for AGIs below $25k, 55.2% for AGIs $25k-50k, 109.9% for AGIs $50k-75k, 139.3% for AGIs $75k-100k, 154.1% for AGIs $100k-200k, 771.2% for AGIs over 200k)
Ordinary dividends: $5,605 (reported on 26.6% of returns)
Here:
$5,605
State:
$10,949
(% of AGI for various income ranges: 78.9% for AGIs below $25k, 133.7% for AGIs $25k-50k, 258.7% for AGIs $50k-75k, 242.6% for AGIs $75k-100k, 440.2% for AGIs $100k-200k, 2560.0% for AGIs over 200k)
Net capital gain/loss in AGI: +$22,000 (reported on 25.6% of returns)
Here:
+$22,000
State:
+$49,306
(% of AGI for various income ranges: 35.1% for AGIs below $25k, 78.9% for AGIs $25k-50k, 225.0% for AGIs $50k-75k, 384.4% for AGIs $75k-100k, 884.0% for AGIs $100k-200k, 25326.9% for AGIs over 200k)
Profit/loss from business: +$17,900 (reported on 20.7% of returns)
Here:
+$17,900
State:
+$15,671
(% of AGI for various income ranges: 242.8% for AGIs below $25k, 423.4% for AGIs $25k-50k, 703.4% for AGIs $50k-75k, 664.2% for AGIs $75k-100k, 1074.9% for AGIs $100k-200k, 4756.2% for AGIs over 200k)
Taxable individual retirement arrangement distribution: $21,287 (reported on 15.3% of returns)
95949:
$21,287
California:
$23,505
(% of AGI for various income ranges: 119.4% for AGIs below $25k, 238.4% for AGIs $25k-50k, 509.5% for AGIs $50k-75k, 769.1% for AGIs $75k-100k, 1267.9% for AGIs $100k-200k, 4128.1% for AGIs over 200k)
Self-employed (Keogh) retirement plans: $22,650 (reported on 0.6% of returns)
95949:
$22,650
California:
$30,163
(% of AGI for various income ranges: 11.6% for AGIs below $25k, 130.6% for AGIs $100k-200k)
Total itemized deductions: $31,380 (reported on 16.5% of returns)
Here:
$31,380
State:
$39,517
(% of AGI for various income ranges: 200.2% for AGIs below $25k, 343.9% for AGIs $25k-50k, 793.0% for AGIs $50k-75k, 1162.8% for AGIs $75k-100k, 1941.4% for AGIs $100k-200k, 7545.6% for AGIs over 200k)
Charity contributions: $6,846 (reported on 12.4% of returns)
Here:
$6,846
State:
$12,598
(% of AGI for various income ranges: 9.4% for AGIs below $25k, 24.2% for AGIs $25k-50k, 77.1% for AGIs $50k-75k, 122.3% for AGIs $75k-100k, 310.4% for AGIs $100k-200k, 2265.6% for AGIs over 200k)
Taxes paid: $8,099 (reported on 16.4% of returns)
95949:
$8,099
State:
$8,807
(% of AGI for various income ranges: 35.7% for AGIs below $25k, 75.0% for AGIs $25k-50k, 192.1% for AGIs $50k-75k, 324.7% for AGIs $75k-100k, 588.0% for AGIs $100k-200k, 1643.8% for AGIs over 200k)
Earned income credit: $1,732 (reported on 9.6% of returns)
Here:
$1,732
State:
$2,074
(% of AGI for various income ranges: 60.7% for AGIs below $25k, 51.5% for AGIs $25k-50k)
Percentage of individuals using paid preparers for their 2020 taxes: 93.0%
Here:
93%
State:
92%
(% for various income ranges: 90.6% for AGIs below $25k, 92.2% for AGIs $25k-50k, 93.4% for AGIs $50k-75k, 94.3% for AGIs $75k-100k, 95.1% for AGIs $100k-200k, 96.7% for AGIs over 200k)
Averages for the 2012 tax year for zip code 95949, filed in 2013:
Average Adjusted Gross Income (AGI) in 2012: $63,611 (Individual Income Tax Returns)
Here:
$63,611
State:
$72,726
Salary/wage: $52,118 (reported on 67.2% of returns)
Here:
$52,118
State:
$59,079
(% of AGI for various income ranges: 55.9% for AGIs below $25k, 55.4% for AGIs $25k-50k, 56.5% for AGIs $50k-75k, 56.8% for AGIs $75k-100k, 63.8% for AGIs $100k-200k, 38.7% for AGIs over 200k)
Taxable interest for individuals: $1,431 (reported on 51.2% of returns)
This zip code:
$1,431
California:
$2,146
(% of AGI for various income ranges: 2.5% for AGIs below $25k, 1.4% for AGIs $25k-50k, 1.4% for AGIs $50k-75k, 1.2% for AGIs $75k-100k, 0.8% for AGIs $100k-200k, 0.9% for AGIs over 200k)
Ordinary dividends: $6,321 (reported on 29.3% of returns)
Here:
$6,321
State:
$9,308
(% of AGI for various income ranges: 4.0% for AGIs below $25k, 2.9% for AGIs $25k-50k, 2.4% for AGIs $50k-75k, 2.5% for AGIs $75k-100k, 1.8% for AGIs $100k-200k, 5.1% for AGIs over 200k)
Net capital gain/loss in AGI: +$11,981 (reported on 26.4% of returns)
Here:
+$11,981
State:
+$30,460
(% of AGI for various income ranges: 0.7% for AGIs $50k-75k, 1.0% for AGIs $75k-100k, 1.2% for AGIs $100k-200k, 21.9% for AGIs over 200k)
Profit/loss from business: +$14,394 (reported on 22.0% of returns)
Here:
+$14,394
State:
+$17,064
(% of AGI for various income ranges: 13.2% for AGIs below $25k, 7.9% for AGIs $25k-50k, 5.4% for AGIs $50k-75k, 3.4% for AGIs $75k-100k, 4.1% for AGIs $100k-200k, 2.8% for AGIs over 200k)
Taxable individual retirement arrangement distribution: $18,051 (reported on 18.5% of returns)
95949:
$18,051
California:
$19,557
(% of AGI for various income ranges: 6.3% for AGIs below $25k, 6.2% for AGIs $25k-50k, 5.2% for AGIs $50k-75k, 6.3% for AGIs $75k-100k, 5.2% for AGIs $100k-200k, 3.6% for AGIs over 200k)
Self-employment retirement plans: $18,157 (reported on 0.8% of returns)
95949:
$18,157
California:
$24,530
Total itemized deductions: $26,992 (27% of AGI, reported on 46.6% of returns)
Here:
$26,992
State:
$34,004
Here:
27.2% of AGI
State:
22.7% of AGI
(% of AGI for various income ranges: 24.8% for AGIs below $25k, 19.3% for AGIs $25k-50k, 19.0% for AGIs $50k-75k, 18.3% for AGIs $75k-100k, 19.1% for AGIs $100k-200k, 21.2% for AGIs over 200k)
Charity contributions: $2,944 (reported on 38.6% of returns)
Here:
$2,944
State:
$4,659
(% of AGI for various income ranges: 1.2% for AGIs below $25k, 1.6% for AGIs $25k-50k, 1.8% for AGIs $50k-75k, 1.7% for AGIs $75k-100k, 2.0% for AGIs $100k-200k, 1.8% for AGIs over 200k)
Taxes paid: $8,526 (reported on 46.5% of returns)
95949:
$8,526
State:
$14,448
(% of AGI for various income ranges: 5.0% for AGIs below $25k, 4.2% for AGIs $25k-50k, 4.9% for AGIs $50k-75k, 5.4% for AGIs $75k-100k, 7.2% for AGIs $100k-200k, 8.0% for AGIs over 200k)
Earned income credit: $1,765 (reported on 11.9% of returns)
Here:
$1,765
State:
$2,286
(% of AGI for various income ranges: 3.9% for AGIs below $25k, 0.7% for AGIs $25k-50k)
Percentage of individuals using paid preparers for their 2012 taxes: 57.1%
Here:
57%
State:
64%
(% for various income ranges: 46.4% for AGIs below $25k, 58.7% for AGIs $25k-50k, 61.4% for AGIs $50k-75k, 64.3% for AGIs $75k-100k, 65.6% for AGIs $100k-200k, 76.9% for AGIs over 200k)
Averages for the 2004 tax year for zip code 95949, filed in 2005:
Average Adjusted Gross Income (AGI) in 2004: $53,687 (Individual Income Tax Returns)
Here:
$53,687
State:
$58,600
Salary/wage: $44,764 (reported on 69.3% of returns)
Here:
$44,764
State:
$49,455
(% of AGI for various income ranges: 288.4% for AGIs below $10k, 52.9% for AGIs $10k-25k, 57.9% for AGIs $25k-50k, 62.8% for AGIs $50k-75k, 67.0% for AGIs $75k-100k, 50.1% for AGIs over 100k)
Taxable interest for individuals: $1,906 (reported on 62.1% of returns)
This zip code:
$1,906
California:
$2,365
(% of AGI for various income ranges: 30.7% for AGIs below $10k, 5.1% for AGIs $10k-25k, 2.9% for AGIs $25k-50k, 1.9% for AGIs $50k-75k, 1.6% for AGIs $75k-100k, 1.6% for AGIs over 100k)
Taxable dividends: $3,510 (reported on 34.9% of returns)
Here:
$3,510
State:
$4,746
(% of AGI for various income ranges: 25.7% for AGIs below $10k, 4.2% for AGIs $10k-25k, 2.6% for AGIs $25k-50k, 1.7% for AGIs $50k-75k, 1.9% for AGIs $75k-100k, 2.1% for AGIs over 100k)
Net capital gain/loss: +$14,941 (reported on 31.4% of returns)
Here:
+$14,941
State:
+$23,418
(% of AGI for various income ranges: -18.4% for AGIs below $10k, 0.7% for AGIs $10k-25k, 0.8% for AGIs $25k-50k, 1.7% for AGIs $50k-75k, 2.2% for AGIs $75k-100k, 19.2% for AGIs over 100k)
Profit/loss from business: +$17,854 (reported on 22.7% of returns)
Here:
+$17,854
State:
+$16,826
(% of AGI for various income ranges: 36.3% for AGIs below $10k, 11.9% for AGIs $10k-25k, 8.7% for AGIs $25k-50k, 6.9% for AGIs $50k-75k, 6.0% for AGIs $75k-100k, 7.1% for AGIs over 100k)
IRA payment deduction: $3,492 (reported on 3.6% of returns)
95949:
$3,492
California:
$3,192
(% of AGI for various income ranges: 1.7% for AGIs below $10k, 0.2% for AGIs $10k-25k, 0.4% for AGIs $25k-50k, 0.3% for AGIs $50k-75k, 0.3% for AGIs $75k-100k, 0.1% for AGIs over 100k)
Self-employed pension: $12,523 (reported on 1.8% of returns)
Here:
$12,523
California:
$17,688
(% of AGI for various income ranges: 0.3% for AGIs $10k-25k, 0.2% for AGIs $25k-50k, 0.3% for AGIs $50k-75k, 0.4% for AGIs $75k-100k, 0.6% for AGIs over 100k)
Total itemized deductions: $23,225 (28% of AGI, reported on 50.5% of returns)
Here:
$23,225
State:
$28,113
Here:
28.0% of AGI
State:
25.3% of AGI
(% of AGI for various income ranges: 148.7% for AGIs below $10k, 25.7% for AGIs $10k-25k, 22.5% for AGIs $25k-50k, 22.7% for AGIs $50k-75k, 22.3% for AGIs $75k-100k, 19.1% for AGIs over 100k)
Charity contributions deductions: $2,569 (3% of AGI, reported on 44.4% of returns)
Here:
$2,569
State:
$3,923
Here:
3.1% of AGI
State:
3.3% of AGI
(% of AGI for various income ranges: 7.2% for AGIs below $10k, 1.9% for AGIs $10k-25k, 2.1% for AGIs $25k-50k, 2.2% for AGIs $50k-75k, 2.5% for AGIs $75k-100k, 1.9% for AGIs over 100k)
Total tax: $7,721 (reported on 80.4% of returns)
95949:
$7,721
State:
$10,761
(% of AGI for various income ranges: 17.9% for AGIs below $10k, 4.9% for AGIs $10k-25k, 7.1% for AGIs $25k-50k, 8.4% for AGIs $50k-75k, 9.9% for AGIs $75k-100k, 16.3% for AGIs over 100k)
Earned income credit: $1,436 (reported on 8.0% of returns)
Here:
$1,436
State:
$1,763
Percentage of individuals using paid preparers for their 2004 taxes: 62.2%
Here:
62%
State:
66%
(% for various income ranges: 48.3% for AGIs below $10k, 59.5% for AGIs $10k-25k, 63.3% for AGIs $25k-50k, 67.0% for AGIs $50k-75k, 67.4% for AGIs $75k-100k, 74.7% for AGIs over 100k)
Likely homosexual households (counted as self-reported same-sex unmarried-partner households)
Lesbian couples: 0.2% of all households
Gay men: 0.2% of all households
Household received Food Stamps/SNAP in the past 12 months: 411 Household did not receive Food Stamps/SNAP in the past 12 months: 7,866
Women who had a birth in the past 12 months: 148 (140 now married, 7 unmarried) Women who did not have a birth in the past 12 months: 3,152 (1,453 now married, 1,689 unmarried)
Housing units in zip code 95949 with a mortgage: 4,654 (417 second mortgage, 357 both second mortgage and home equity loan) Houses without a mortgage: 51
Median monthly owner costs for units with a mortgage: $2,321 Median monthly owner costs for units without a mortgage: $912
Residents with income below the poverty level in 2022:
This zip code:
7.7%
Whole state:
12.2%
Residents with income below 50% of the poverty level in 2022:
This zip code:
3.8%
Whole state:
6.2%
Median number of rooms in houses and condos:
Here:
6.0
State:
6.0
Median number of rooms in apartments:
Here:
4.8
State:
3.9
Notable locations in this zip code not listed on our city pages
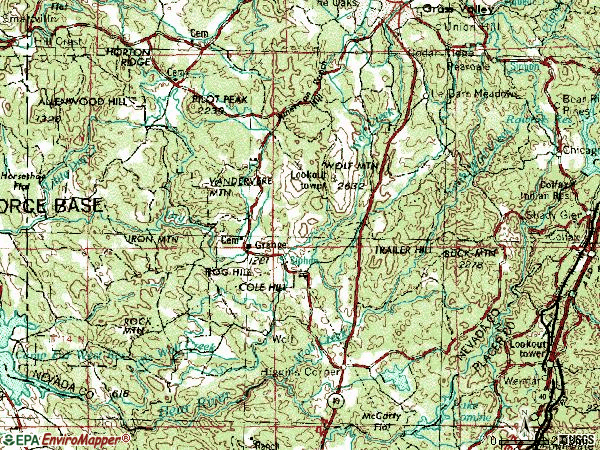
Notable locations in zip code 95949: State Foresty Guard Station (A), Spenceville (B), Nickerson Ranch (C), Nevada County Landfill (D), Banner Grange (E), North Star Museum (F), Nevada County Consolidated Fire District Station 88 (G), Nevada County Consolidated Fire District Station 90 (H), Nevada County Fire District 89 (I), Higgins Area Fire Protection District (J), Nevada County Consolidated Fire District Station 92 (K), Nevada County Consolidated Fire District Administrative (L). Display/hide their locations on the map
Creeks: Indian Springs Creek (A), Ellens Creek (B), South Wolf Creek (C), Critter Creek (D), Salt Creek (E), Rattlesnake Creek (F), Ragsdale Creek (G). Display/hide their locations on the map
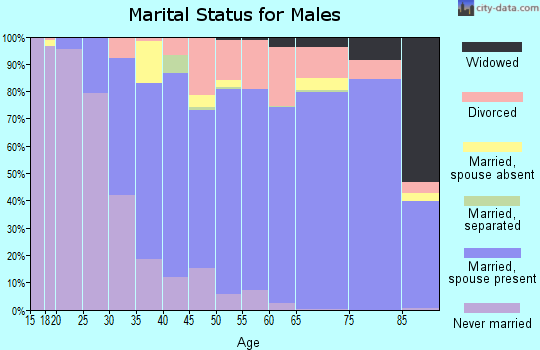
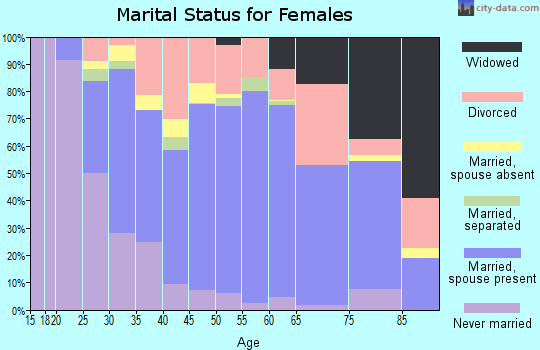
2,286 married couples with children.
322 single-parent households (197 men, 125 women).
94.5% of residents of 95949 zip code speak English at home.
3.1% of residents speak Spanish at home (82% very well, 10% well, 6% not well, 2% not at all).
1.6% of residents speak other Indo-European language at home (88% very well, 9% well, 3% not well).
0.6% of residents speak Asian or Pacific Island language at home (35% very well, 55% well, 2% not well, 8% not at all).
0.3% of residents speak other language at home (100% very well).
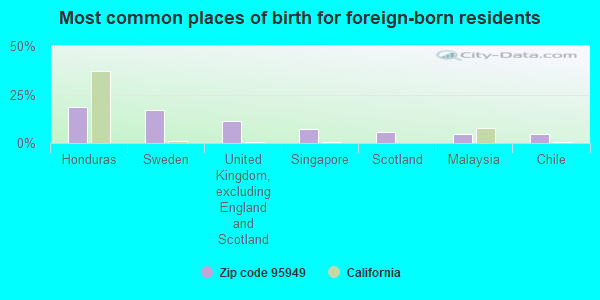
Foreign born population: 922 (4.4%) (64.5% of them are naturalized citizens)
Facilities with environmental interests located in this zip code:
ALTA SIERRA ELEMENTARY SCHOOL (16607 ANNIE DRIVE in GRASS VALLEY, CA)
(Geographic Names Information System) (National Center for Education Statistics) - STATE ID-6105811 Organizations: PLEASANT RIDGE UNION ELEMENTARY (SCHOOL DISTRICT)
MAGNOLIA INTERMEDIATE (22431 KINSTON LANE in GRASS VALLEY, CA)
(National Center for Education Statistics) - STATE ID-6094981 Organizations: PLEASANT RIDGE UNION ELEMENTARY (SCHOOL DISTRICT)
IRENE YAO (14455 BALLANTREE LANE in GRASS VALLEY, CA)
(Resource Conservation and Recovery Act (tracking hazardous waste)) Alternative names: W&S INC
BALLERINA CLEANERS (147 S AUBURN BLVD in GRASS VALLEY, CA)
CRITERIA AND HAZARDOUS AIR POLLUTANT INVENTORY (Inventory of air pollution sources) Small Quantity Generators, between 100 kg and 1000 kg of hazardous waste/month (Resource Conservation and Recovery Act (tracking hazardous waste)) Business SIC classification: DRYCLEANING PLANTS, EXCEPT RUG CLEANING Organizations: LANI WATERS (CONTACT/OWNER)
GRASS VALLEY BURN DUMP (15782 MC COURTNEY ROAD in GRASS VALLEY, CA)
CRITERIA AND HAZARDOUS AIR POLLUTANT INVENTORY (Inventory of air pollution sources) Business SIC classification: REFUSE SYSTEMS Business NAICS classification: SOLID WASTE LANDFILL.
HANSEN BROTHERS BEAR RIVER (14789 TAYLOR CROSSING ROAD in GRASS VALLEY, CA)
CRITERIA AND HAZARDOUS AIR POLLUTANT INVENTORY (Inventory of air pollution sources) Business SIC classification: CONSTRUCTION SAND AND GRAVEL
MCCOURTNEY LANDFILL (14741 WOLF MOUNTAIN ROAD in GRASS VALLEY, CA)
CRITERIA AND HAZARDOUS AIR POLLUTANT INVENTORY (Inventory of air pollution sources) Business SIC classification: REFUSE SYSTEMS Business NAICS classification: SOLID WASTE LANDFILL.
CANDY APPLE CONSTRUCTION (15270 S PONDEROSA WAY in GRASS VALLEY, CA)
CRITERIA AND HAZARDOUS AIR POLLUTANT INVENTORY (Inventory of air pollution sources) Business SIC classification: REFUSE SYSTEMS Business NAICS classification: SOLID WASTE LANDFILL.
Housing units lacking complete plumbing facilities: 1.5% Housing units lacking complete kitchen facilities: 1.0%
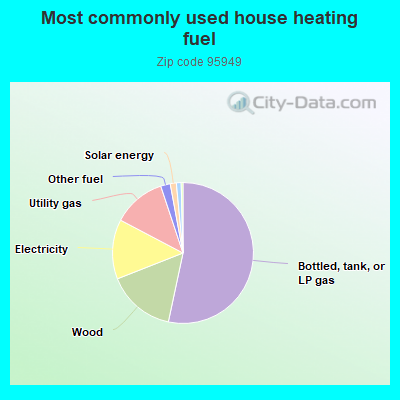
53.4%Bottled, tank, or LP gas
15.7%Wood
13.7%Electricity
12.2%Utility gas
2.2%Other fuel
1.4%Solar energy
1.1%Fuel oil, kerosene, etc.
Population in 1990: 20,973.
Place of birth for U.S.-born residents:
This state: 14,974
Northeast: 1,071
Midwest: 1,681
South: 997
West: 1,057
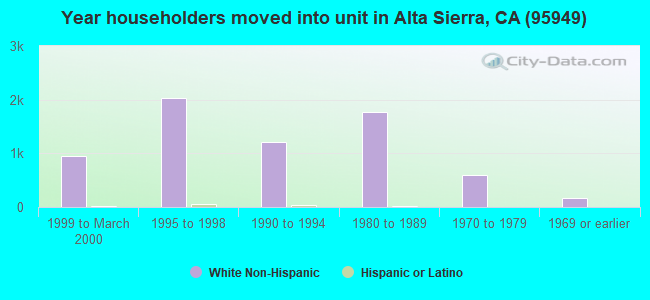
55% of the 95949 zip code residents lived in the same house 5 years ago. Out of people who lived in different houses, 45% lived in this county. Out of people who lived in different counties, 50% lived in California.
93% of the 95949 zip code residents lived in the same house 1 year ago. Out of people who lived in different houses, 27% moved from this county. Out of people who lived in different houses, 46% moved from different county within same state. Out of people who lived in different houses, 28% moved from different state. Out of people who lived in different houses, 5% moved from abroad.
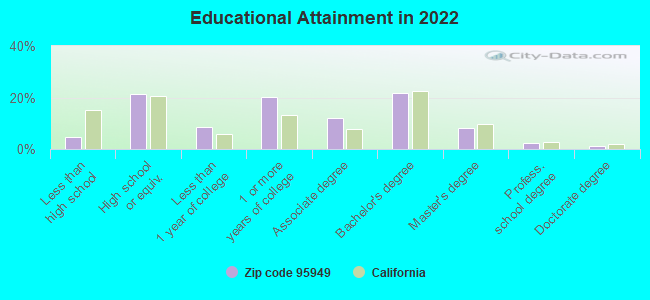
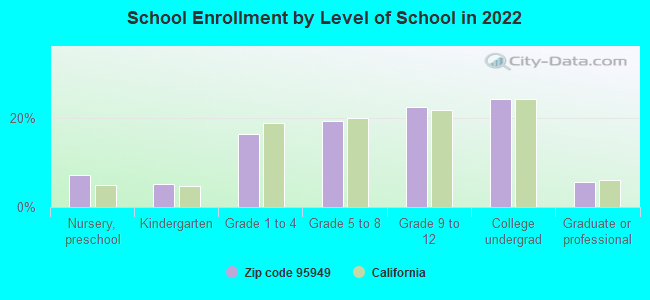
Private vs. public school enrollment:
Students in private schools in grades 1 to 8 (elementary and middle school): 209
Here:
16.7%
California:
10.5%
Students in private schools in grades 9 to 12 (high school): 80
Here:
10.1%
California:
8.5%
Students in private undergraduate colleges: 105
Here:
12.4%
California:
15.9%
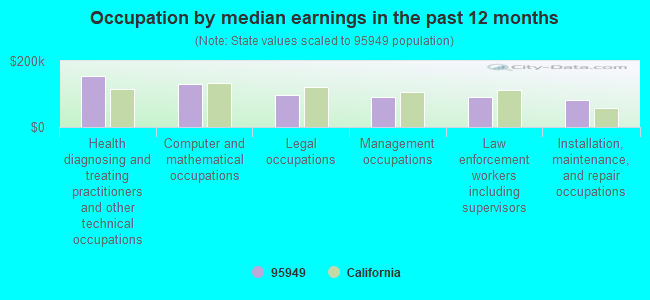
Occupation by median earnings in the past 12 months ($)
153,902Health diagnosing and treating practitioners and other technical occupations
129,033Computer and mathematical occupations
96,424Legal occupations
92,379Management occupations
90,295Law enforcement workers including supervisors
82,203Installation, maintenance, and repair occupations
Companies with federal contracts located in this zip code:
BODY SPECS SUNGLASSES & GOGGLE (20840 INSPIRATION LN in GRASS VALLEY, CA; small business) : $204,427 in 5 contractsfrom 2005 to 2006
Contracts for Safety and Rescue Equipment by Defense Logistics Agency Signed by year:2000: $0; 2001: $0; 2002: $0; 2003: $0; 2004: $0; 2005: $29,592; 2006: $174,835.
Biggest contracts:
$99,925 with Defense Logistics Agency for Safety and Rescue Equipment. Signed on 2006-01-05. Completion date: 2006-01-15.
$74,910, same as above.Signed on 2006-04-05. Completion date: 2006-05-20.
$16,500, same as above.Signed on 2005-10-19. Completion date: 2005-11-19.
$7,392, same as above.Signed on 2005-08-11. Completion date: 2005-08-27.
RGB DISPLAY CORPORATION (22525 KINGSTON LANE in GRASS VALLEY, CA; small business)
$69,831 with Navy for Services -- Applied Research and Exploratory Development (R&D). Signed on 2001-12-11. Completion date: 2002-06-10.
Top industries in this zip code by the number of employees in 2005:
Other Services (except Public Administration): Car Washes (50-99: 1, 10-19: 1)
Construction: New Single-Family Housing Construction (except Operative Builders) (20-49: 1, 5-9: 1, 1-4: 19)
People in group quarters in 2010:
21 people in residential treatment centers for juveniles (non-correctional)
12 people in group homes intended for adults
People in group quarters in 2000:
6 people in nursing homes
Fatal accident statistics in 2013:
Fatal accident count: 1
Vehicles involved in fatal accidents: 2
Fatal accidents caused by drunken drivers: 0
Fatalities: 1
Persons involved in fatal accidents: 2
Pedestrians involved in fatal accidents: 0
Fatal accident statistics in 2012:
Fatal accident count: 6
Vehicles involved in fatal accidents: 9
Fatal accidents caused by drunken drivers: 2
Fatalities: 6
Persons involved in fatal accidents: 11
Pedestrians involved in fatal accidents: 1
2005 - 2018 National Fire Incident Reporting System (NFIRS) incidents
Based on the data from the years 2005 - 2018 the average number of fires per year is 78. The highest number of fires - 144 took place in 2005, and the least - 20 in 2009. The data has a decreasing trend.
When looking into fire subcategories, the most reports belonged to: Outside Fires (58.4%), and Structure Fires (23.7%).
Fire incident types reported to NFIRS in Zip Code 95949


 Nearest zip codes: 95602, 95975, 95946, 95722, 95977, 95736.


 Based on the data from the years 2005 - 2018 the average number of fires per year is 78. The highest number of fires - 144 took place in 2005, and the least - 20 in 2009. The data has a decreasing trend.
 When looking into fire subcategories, the most reports belonged to: Outside Fires (58.4%), and Structure Fires (23.7%).