Big Park, Arizona
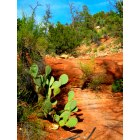
Big Park: Trail around Big Park
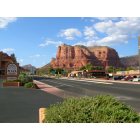
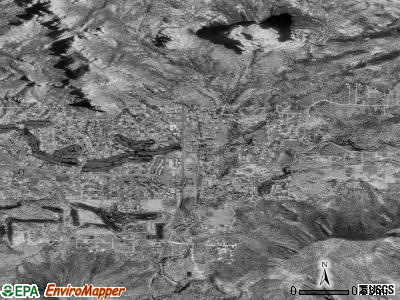
Big Park: Big Park
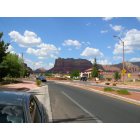
Big Park: Big Park
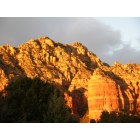
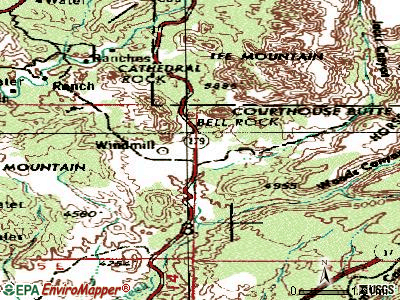
Big Park: Lee Mountain in Big Park
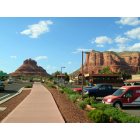
Big Park: Big Park
- add
your
Submit your own pictures of this place and show them to the world
- OSM Map
- General Map
- Google Map
- MSN Map
| Males: 2,992 | |
| Females: 3,592 |
| Median resident age: | 55.5 years |
| Arizona median age: | 34.2 years |
Zip codes: 86351.
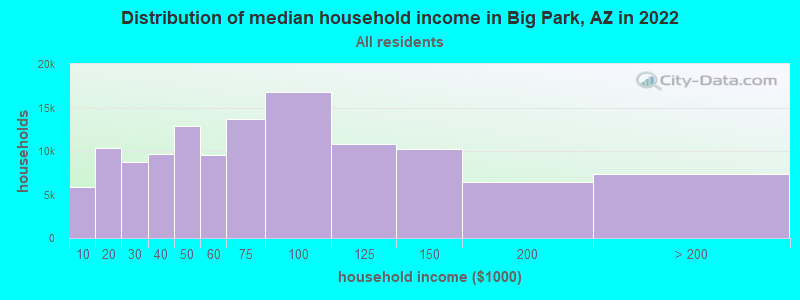
| Big Park: | $70,487 |
| AZ: | $74,568 |
Estimated per capita income in 2022: $59,866 (it was $30,026 in 2000)
Big Park CDP income, earnings, and wages data
Estimated median house or condo value in 2022: $817,858 (it was $215,800 in 2000)
| Big Park: | $817,858 |
| AZ: | $402,800 |
Mean prices in 2022: all housing units: $497,398; detached houses: $554,279; townhouses or other attached units: $444,806; in 2-unit structures: $963,710; in 3-to-4-unit structures: $330,793; in 5-or-more-unit structures: $347,956; mobile homes: $254,882; occupied boats, rvs, vans, etc.: $22,781
Detailed information about poverty and poor residents in Big Park, AZ


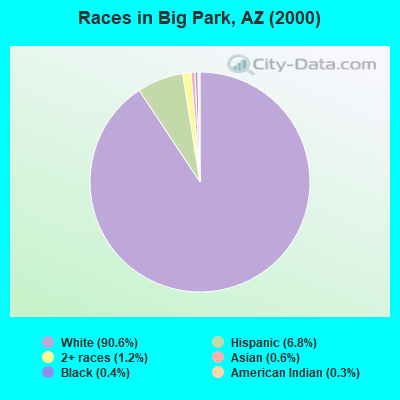
- 4,75390.6%White alone
- 3566.8%Hispanic
- 651.2%Two or more races
- 300.6%Asian alone
- 190.4%Black alone
- 170.3%American Indian alone
- 40.08%Other race alone
- 10.02%Native Hawaiian and Other
Pacific Islander alone
 Recent articles from our blog. Our writers, many of them Ph.D. graduates or candidates, create easy-to-read articles on a wide variety of topics.

 | Families in VOC with elementary school age kids & question about commuting (8 replies) |
| Quality Of Life In Sedona? (22 replies) |
| Renting a house Sedona (13 replies) |
| People who live in Sedona (55 replies) |
| Cottonwood or Sedona (60 replies) |
| Buying 2nd home in Sedona: Need advice (37 replies) |
Latest news from Big Park, AZ collected exclusively by city-data.com from local newspapers, TV, and radio stations
Ancestries: German (22.4%), English (22.2%), Irish (12.7%), United States (5.0%), French (4.9%), Scottish (4.1%).
Current Local Time: MST (no DST) time zone
Elevation: 4105 feet
Land area: 4.54 square miles.
Population density: 1,449 people per square mile (low).
452 residents are foreign born (3.2% Latin America, 3.1% Europe, 1.5% North America).
| This place: | 8.6% |
| Arizona: | 12.8% |
| Big Park CDP: | 0.7% ($1,414) |
| Arizona: | 0.9% ($962) |
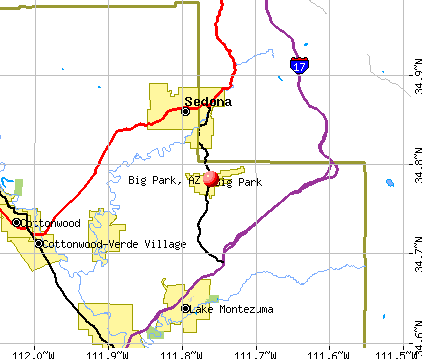
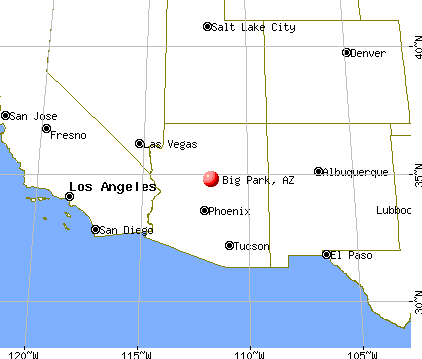
Nearest city with pop. 50,000+: Coconino, AZ (27.2 miles  , pop. 74,488).
Nearest city with pop. 200,000+: Scottsdale, AZ (82.8 miles , pop. 202,705).
Nearest city with pop. 1,000,000+: Phoenix, AZ (88.6 miles , pop. 1,321,045).
Nearest cities:
), ), ), Latitude: 34.78 N, Longitude: 111.76 W
| Here: | 3.3% |
| Arizona: | 3.8% |
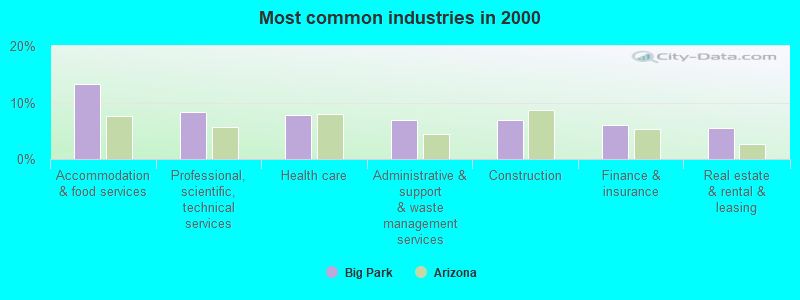
- Accommodation & food services (13.3%)
- Professional, scientific, technical services (8.2%)
- Health care (7.7%)
- Administrative & support & waste management services (6.9%)
- Construction (6.9%)
- Finance & insurance (6.1%)
- Real estate & rental & leasing (5.5%)
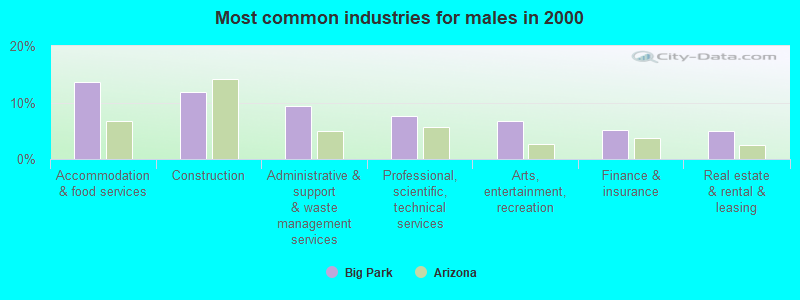
- Accommodation & food services (13.7%)
- Construction (11.9%)
- Administrative & support & waste management services (9.4%)
- Professional, scientific, technical services (7.7%)
- Arts, entertainment, recreation (6.7%)
- Finance & insurance (5.2%)
- Real estate & rental & leasing (4.9%)
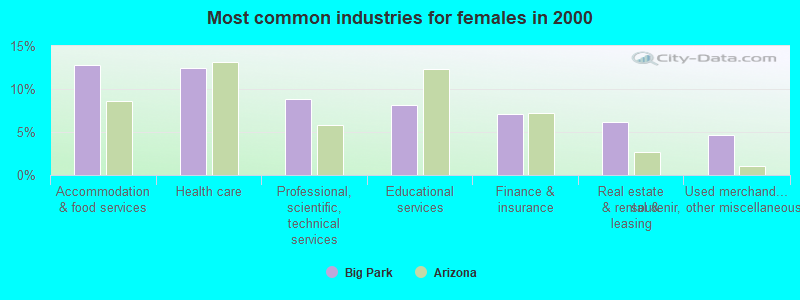
- Accommodation & food services (12.8%)
- Health care (12.4%)
- Professional, scientific, technical services (8.8%)
- Educational services (8.1%)
- Finance & insurance (7.1%)
- Real estate & rental & leasing (6.1%)
- Used merchandise, gift, novelty, souvenir, other miscellaneous stores (4.6%)
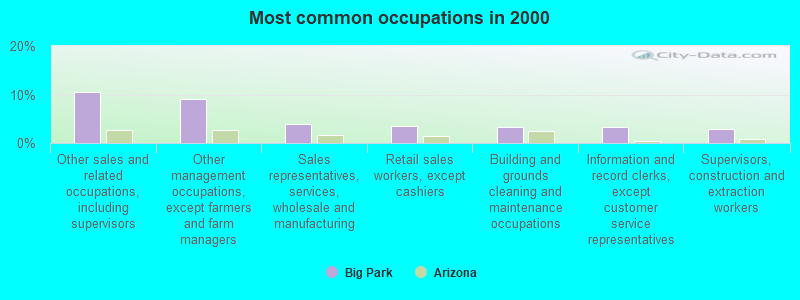
- Other sales and related occupations, including supervisors (10.5%)
- Other management occupations, except farmers and farm managers (9.0%)
- Sales representatives, services, wholesale and manufacturing (3.9%)
- Retail sales workers, except cashiers (3.6%)
- Building and grounds cleaning and maintenance occupations (3.2%)
- Information and record clerks, except customer service representatives (3.2%)
- Supervisors, construction and extraction workers (2.8%)
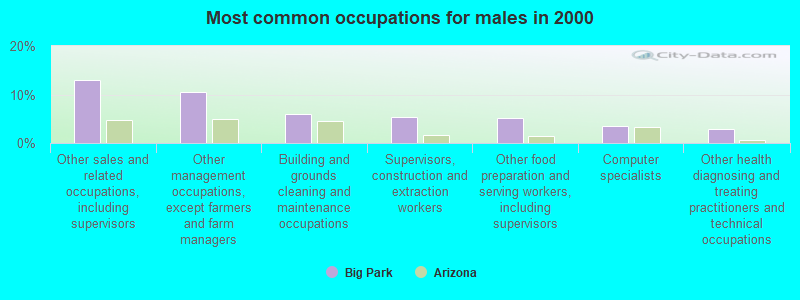
- Other sales and related occupations, including supervisors (13.1%)
- Other management occupations, except farmers and farm managers (10.6%)
- Building and grounds cleaning and maintenance occupations (6.0%)
- Supervisors, construction and extraction workers (5.3%)
- Other food preparation and serving workers, including supervisors (5.2%)
- Computer specialists (3.5%)
- Other health diagnosing and treating practitioners and technical occupations (2.9%)
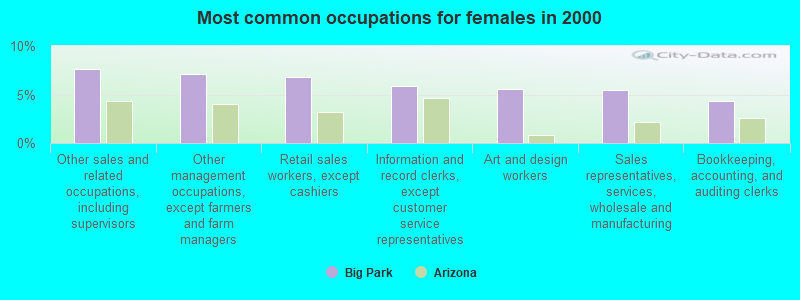
- Other sales and related occupations, including supervisors (7.6%)
- Other management occupations, except farmers and farm managers (7.2%)
- Retail sales workers, except cashiers (6.8%)
- Information and record clerks, except customer service representatives (5.9%)
- Art and design workers (5.6%)
- Sales representatives, services, wholesale and manufacturing (5.5%)
- Bookkeeping, accounting, and auditing clerks (4.3%)
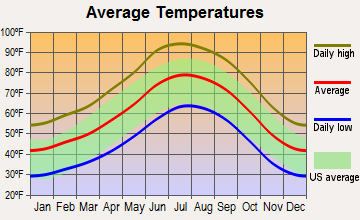
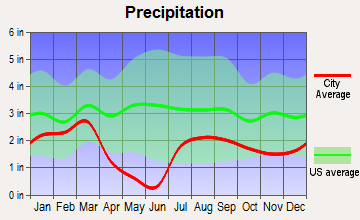
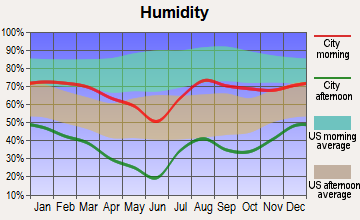
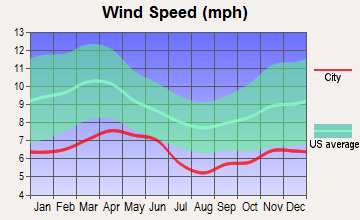
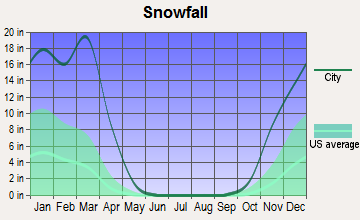
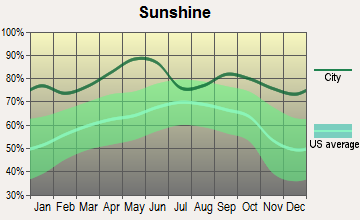
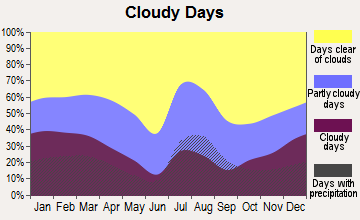
Average climate in Big Park, Arizona
Based on data reported by over 4,000 weather stations
Earthquake activity:
Big Park-area historical earthquake activity is significantly above Arizona state average. It is 2531% greater than the overall U.S. average.On 6/28/1992 at 11:57:34, a magnitude 7.6 (6.2 MB, 7.6 MS, 7.3 MW, Depth: 0.7 mi, Class: Major, Intensity: VIII - XII) earthquake occurred 275.1 miles away from Big Park center, causing 3 deaths (1 shaking deaths, 2 other deaths) and 400 injuries, causing $100,000,000 total damage and $40,000,000 insured losses
On 10/16/1999 at 09:46:44, a magnitude 7.4 (6.3 MB, 7.4 MS, 7.2 MW, 7.3 ML) earthquake occurred 266.6 miles away from the city center
On 5/19/1940 at 04:36:40, a magnitude 7.2 (7.2 UK) earthquake occurred 250.2 miles away from the city center, causing $33,000,000 total damage
On 12/31/1934 at 18:45:56, a magnitude 7.1 (7.1 UK) earthquake occurred 272.0 miles away from the city center
On 10/15/1979 at 23:16:54, a magnitude 7.0 (5.7 MB, 6.9 MS, 7.0 ML, 6.4 MW) earthquake occurred 261.1 miles away from the city center
On 7/21/1952 at 11:52:14, a magnitude 7.7 (7.7 UK) earthquake occurred 410.9 miles away from the city center, causing $50,000,000 total damage
Magnitude types: body-wave magnitude (MB), local magnitude (ML), surface-wave magnitude (MS), moment magnitude (MW)
Natural disasters:
The number of natural disasters in Yavapai County (18) is near the US average (15).Major Disasters (Presidential) Declared: 9
Emergencies Declared: 2
Causes of natural disasters: Floods: 9, Storms: 8, Fires: 6, Drought: 1, Hurricane: 1, Tornado: 1, Winter Storm: 1, Other: 1 (Note: some incidents may be assigned to more than one category).
Hospitals and medical centers near Big Park:
- RTA HOSPICE AND PALLIATIVE CARE SEDONA (Hospital, about 1 miles away; SEDONA, AZ)
- KINDRED TRANSITIONAL CARE AND REHAB-KACHINA (Nursing Home, about 1 miles away; SEDONA, AZ)
- RED ROCK CARE AND REHAB, INC (Nursing Home, about 16 miles away; COTTONWOOD, AZ)
- ANGELS CARE HOME HEALTH OF ARIZONA (Home Health Center, about 16 miles away; COTTONWOOD, AZ)
- VERDE VALLEY MEDICAL CENTER Acute Care Hospitals (about 16 miles away; COTTONWOOD, AZ)
Colleges/universities with over 2000 students nearest to Big Park:
- Coconino Community College (about 28 miles; Flagstaff, AZ; Full-time enrollment: 2,090)
- Northern Arizona University (about 29 miles; Flagstaff, AZ; FT enrollment: 22,494)
- Northcentral University (about 33 miles; Prescott Valley, AZ; FT enrollment: 5,927)
- Yavapai College (about 43 miles; Prescott, AZ; FT enrollment: 4,258)
- Universal Technical Institute of Arizona Inc-Motorcycle Mechanics Institute Division (about 79 miles; Phoenix, AZ; FT enrollment: 2,976)
- Paradise Valley Community College (about 80 miles; Phoenix, AZ; FT enrollment: 5,259)
- Arizona State University-West (about 85 miles; Glendale, AZ; FT enrollment: 3,454)
Points of interest:
Notable locations in Big Park: Big Park Water Improvement District Wastewater Treatment Plant (A), Sedona Fire District Station 3 (B). Display/hide their locations on the map
Churches in Big Park include: Community Church of the Nazarene (A), Village Park Baptist Church (B). Display/hide their locations on the map
Reservoirs: Bell Canyon Tank (A), Speeds Tank (B), Corral Tank (C), Dumas Tank (D). Display/hide their locations on the map
| This place: | 2.0 people |
| Arizona: | 2.6 people |
| This place: | 62.6% |
| Whole state: | 68.2% |
| This place: | 4.8% |
| Whole state: | 6.2% |
Likely homosexual households (counted as self-reported same-sex unmarried-partner households)
- Lesbian couples: 0.2% of all households
- Gay men: 0.2% of all households
| This place: | 8.4% |
| Whole state: | 13.9% |
| This place: | 3.3% |
| Whole state: | 6.2% |
For population 15 years and over in Big Park:
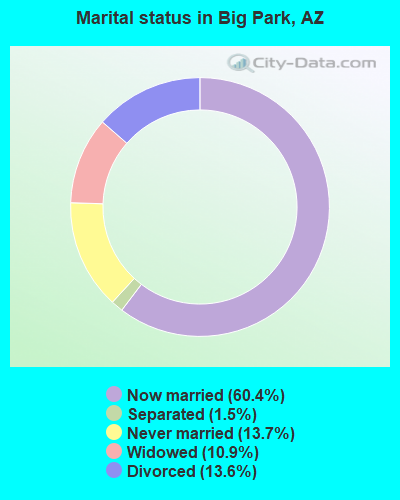
- Never married: 13.7%
- Now married: 60.4%
- Separated: 1.5%
- Widowed: 10.9%
- Divorced: 13.6%
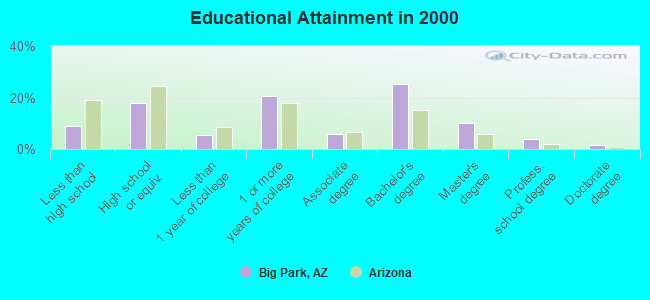
For population 25 years and over in Big Park:
- High school or higher: 91.1%
- Bachelor's degree or higher: 40.8%
- Graduate or professional degree: 15.5%
- Unemployed: 4.8%
- Mean travel time to work (commute): 21.7 minutes
| Here: | 10.5 |
| Arizona average: | 13.1 |
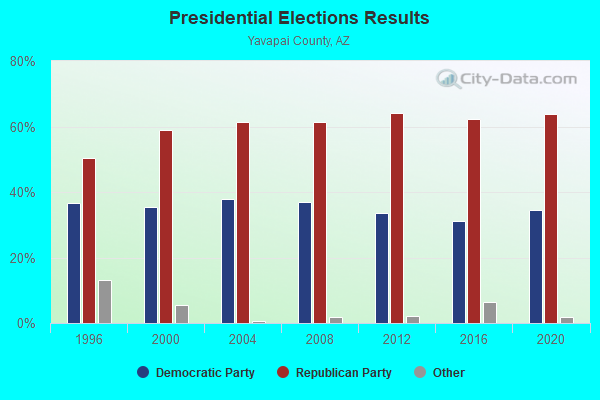
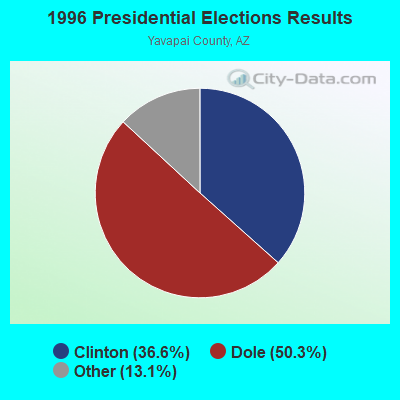
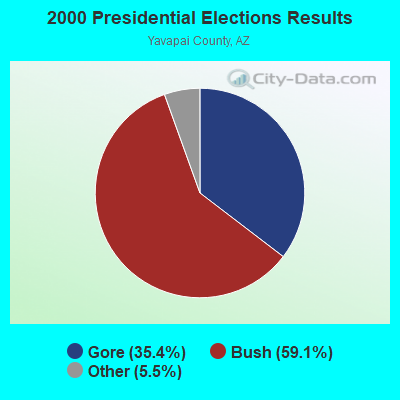
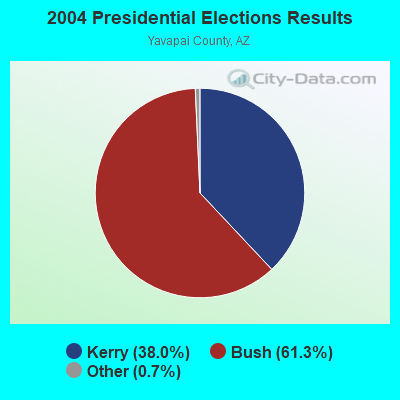
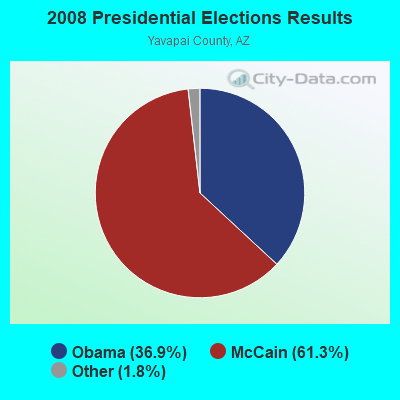

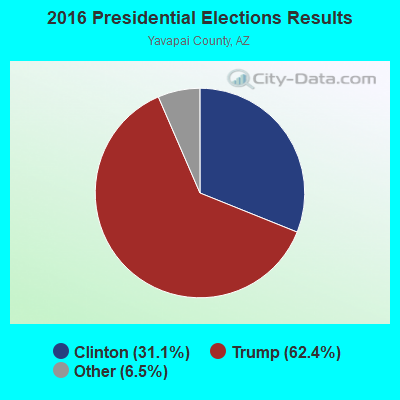
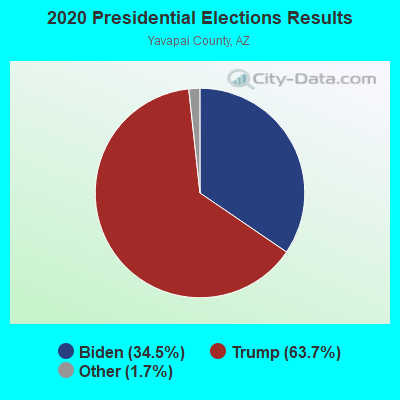
Graphs represent county-level data. Detailed 2008 Election Results
Religion statistics for Big Park, AZ (based on Yavapai County data)
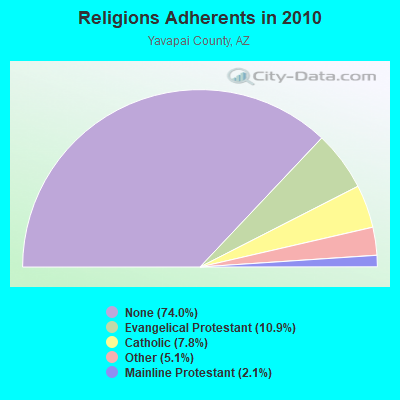
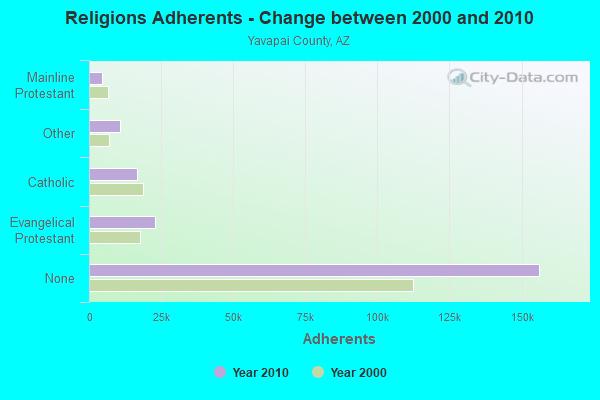
| Religion | Adherents | Congregations |
|---|---|---|
| Evangelical Protestant | 22,957 | 156 |
| Catholic | 16,500 | 14 |
| Other | 10,740 | 47 |
| Mainline Protestant | 4,525 | 22 |
| Orthodox | 100 | 1 |
| None | 156,211 | - |
Food Environment Statistics:
| Yavapai County: | 1.93 / 10,000 pop. |
| Arizona: | 1.36 / 10,000 pop. |
| This county: | 0.14 / 10,000 pop. |
| State: | 0.14 / 10,000 pop. |
| Here: | 0.57 / 10,000 pop. |
| State: | 0.55 / 10,000 pop. |
| Yavapai County: | 3.25 / 10,000 pop. |
| State: | 2.47 / 10,000 pop. |
| Yavapai County: | 10.18 / 10,000 pop. |
| Arizona: | 6.21 / 10,000 pop. |
| Yavapai County: | 7.5% |
| Arizona: | 8.0% |
| This county: | 17.7% |
| Arizona: | 22.8% |
| Yavapai County: | 10.4% |
| Arizona: | 14.2% |
Strongest AM radio stations in Big Park:
- KAZM (780 AM; 5 kW; SEDONA, AZ; Owner: TABBACK BROADCASTING CO.)
- KMIA (710 AM; 50 kW; BLACK CANYON CITY, AZ; Owner: ENTRAVISION HOLDINGS, LLC)
- KFNX (1100 AM; 50 kW; CAVE CREEK, AZ; Owner: NORTH AMERICAN BROADCASTING CO., INC.)
- KAFF (930 AM; 5 kW; FLAGSTAFF, AZ; Owner: GUYANN CORPORATION)
- KYET (1180 AM; 10 kW; WILLIAMS, AZ; Owner: GRAND CANYON GATEWAY BROADCASTING, LLC)
- KPXQ (1360 AM; 50 kW; GLENDALE, AZ; Owner: COMMON GROUND BROADCASTING, INC.)
- KMIK (1580 AM; 50 kW; TEMPE, AZ; Owner: ABC, INC.)
- KYBC (1600 AM; 1 kW; COTTONWOOD, AZ; Owner: YAVAPAI BROADCASTING CORPORATION)
- KTNN (660 AM; 50 kW; WINDOW ROCK, AZ; Owner: THE NAVAJO NATION)
- KFNN (1510 AM; 22 kW; MESA, AZ; Owner: CRC BROADCASTING COMPANY, INC.)
- KFLT (830 AM; 50 kW; TUCSON, AZ; Owner: FAMILY LIFE B/CING SYSTEM, INC.)
- KHAC (880 AM; 43 kW; TSE BONITO, NM; Owner: WESTERN INDIAN MINISTRIES, INC.)
- KVNA (600 AM; 1 kW; FLAGSTAFF, AZ; Owner: YAVAPAI BROADCASTING CORPORATION)
Strongest FM radio stations in Big Park:
- KVRD-FM (105.7 FM; COTTONWOOD, AZ; Owner: YAVAPAI BROADCASTING CORPORATION)
- KKLD (98.3 FM; PRESCOTT VALLEY, AZ; Owner: W. GRANT HAFLEY)
- KGCB (90.9 FM; PRESCOTT, AZ; Owner: GRAND CANYON BROADCASTERS, INC.)
- KZGL (95.9 FM; COTTONWOOD, AZ; Owner: YAVAPAI BROADCASTING CORPORATION)
- K201CQ (88.1 FM; PRESCOTT, AZ; Owner: FAMILY STATIONS, INC.)
- K220GI (91.9 FM; CAMP VERDE, AZ; Owner: CALVARY CHAPEL OF TWIN FALLS, INC.)
- KAFF-FM (92.9 FM; FLAGSTAFF, AZ; Owner: GUYANN CORPORATION)
- KVNA-FM (97.5 FM; FLAGSTAFF, AZ; Owner: YAVAPAI BROADCASTING CORPORATION)
- KMGN (93.9 FM; FLAGSTAFF, AZ; Owner: GUYANN CORPORATION)
- KJTA (89.9 FM; FLAGSTAFF, AZ; Owner: JOY PUBLIC BROADCASTING CORPORATION)
- KQST (102.9 FM; SEDONA, AZ; Owner: ROCKET RADIO CORPORATION)
- KSED (107.5 FM; SEDONA, AZ; Owner: RED ROCK COMMUNICATIONS, LTD.)
- KNAU (88.7 FM; FLAGSTAFF, AZ; Owner: NORTHERN ARIZONA UNIVERSITY)
- KWMX (96.7 FM; WILLIAMS, AZ; Owner: RED ROCK COMMUNICATIONS II, LTD.)
- KJZA (89.5 FM; DRAKE, AZ; Owner: ST. PAUL BIBLE COLLEGE)
- KWMX-FM1 (96.7 FM; FLAGSTAFF, AZ; Owner: RED ROCK COMMUNICATIONS II, LTD.)
- KFLX (105.1 FM; KACHINA VILLAGE, AZ; Owner: RED ROCK COMMUNICATIONS, LTD)
- K265DN (100.9 FM; FLAGSTAFF, AZ; Owner: FAMILY LIFE BROADCASTING, INC.)
- KAHM (102.1 FM; PRESCOTT, AZ; Owner: SOUTHWEST FM BROADCASTING CO., INC.)
- KPUB (91.7 FM; FLAGSTAFF, AZ; Owner: NORTHERN ARIZONA UNIVERSITY)
TV broadcast stations around Big Park:
- KTFL (Channel 4; FLAGSTAFF, AZ; Owner: WTVA, INC.)
- KNAZ-TV (Channel 2; FLAGSTAFF, AZ; Owner: MULTIMEDIA HOLDINGS CORPORATION)
- KFPH (Channel 13; FLAGSTAFF, AZ; Owner: TELEFUTURA PARTNERSHIP OF FLAGSTAFF)
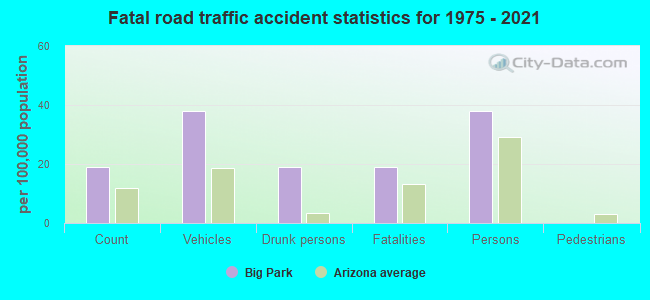
Big Park fatal accident list:
- National Bridge Inventory (NBI) Statistics
- 7Number of bridges
- 20ft / 5.9mTotal length
- 8,465Total average daily traffic
- 82Total average daily truck traffic
- 8,535Total future (year 2039) average daily traffic
FCC Registered Microwave Towers:
2- LEE MTN, Lee Mountain Road (Lat: 34.789000 Lon: -111.745472), Type: Ltower, Structure height: 12.2 m, Call Sign: WRBN598,
Assigned Frequencies: 19475.0 MHz, 19475.0 MHz, 19475.0 MHz, 19475.0 MHz, 19475.0 MHz, 19475.0 MHz, 19475.0 MHz, 19475.0 MHz, 19475.0 MHz, Grant Date: 05/08/2018, Expiration Date: 05/08/2028, Cancellation Date: 08/31/2020, Certifier: Mike Denny, Registrant: Law Office Of Suzanne S. Goodwyn, Pllc, 1234 Tottenham Court, Reston, VA 20194, Phone: (703) 444-5475, Fax: (703) 991-0629, Email:
- VOC, 125 Slide Rock Road (Lat: 34.779472 Lon: -111.764806), Type: Ltower, Structure height: 36.6 m, Call Sign: WRBN599,
Assigned Frequencies: 17915.0 MHz, 17915.0 MHz, 17915.0 MHz, 17915.0 MHz, 17915.0 MHz, 17915.0 MHz, 17915.0 MHz, 17915.0 MHz, 17915.0 MHz, Grant Date: 05/08/2018, Expiration Date: 05/08/2028, Cancellation Date: 08/31/2020, Certifier: Mike Denny, Registrant: Law Office Of Suzanne S. Goodwyn, Pllc, 1234 Tottenham Court, Reston, VA 20194, Phone: (703) 444-5475, Fax: (703) 991-0629, Email:
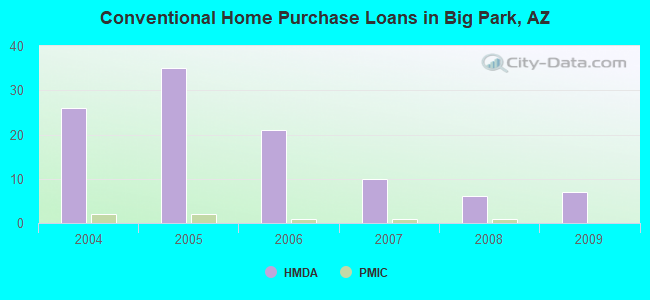
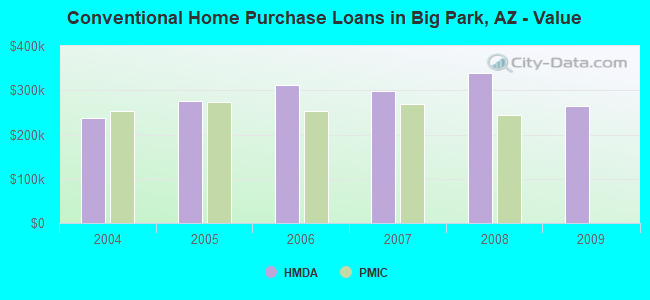
| Home Mortgage Disclosure Act Aggregated Statistics For Year 2009 (Based on 1 partial tract) | ||||||||||||
| A) FHA, FSA/RHS & VA Home Purchase Loans | B) Conventional Home Purchase Loans | C) Refinancings | D) Home Improvement Loans | F) Non-occupant Loans on < 5 Family Dwellings (A B C & D) | G) Loans On Manufactured Home Dwelling (A B C & D) | |||||||
|---|---|---|---|---|---|---|---|---|---|---|---|---|
| Number | Average Value | Number | Average Value | Number | Average Value | Number | Average Value | Number | Average Value | Number | Average Value | |
| LOANS ORIGINATED | 1 | $218,440 | 7 | $263,653 | 19 | $251,745 | 1 | $85,130 | 8 | $266,442 | 1 | $95,740 |
| APPLICATIONS APPROVED, NOT ACCEPTED | 0 | $0 | 1 | $198,860 | 2 | $243,100 | 0 | $0 | 0 | $0 | 0 | $0 |
| APPLICATIONS DENIED | 1 | $108,160 | 1 | $406,020 | 9 | $286,647 | 0 | $0 | 2 | $226,545 | 0 | $0 |
| APPLICATIONS WITHDRAWN | 0 | $0 | 1 | $185,770 | 4 | $251,100 | 0 | $0 | 1 | $272,940 | 0 | $0 |
| FILES CLOSED FOR INCOMPLETENESS | 0 | $0 | 0 | $0 | 1 | $391,480 | 0 | $0 | 0 | $0 | 0 | $0 |
Detailed HMDA statistics for the following Tracts: 0017.00
| Private Mortgage Insurance Companies Aggregated Statistics For Year 2008 (Based on 1 partial tract) | ||||
| A) Conventional Home Purchase Loans | C) Non-occupant Loans on < 5 Family Dwellings (A & B) | |||
|---|---|---|---|---|
| Number | Average Value | Number | Average Value | |
| LOANS ORIGINATED | 1 | $244,250 | 1 | $159,080 |
| APPLICATIONS APPROVED, NOT ACCEPTED | 0 | $0 | 0 | $0 |
| APPLICATIONS DENIED | 0 | $0 | 0 | $0 |
| APPLICATIONS WITHDRAWN | 0 | $0 | 0 | $0 |
| FILES CLOSED FOR INCOMPLETENESS | 0 | $0 | 0 | $0 |
Detailed PMIC statistics for the following Tracts: 0017.00
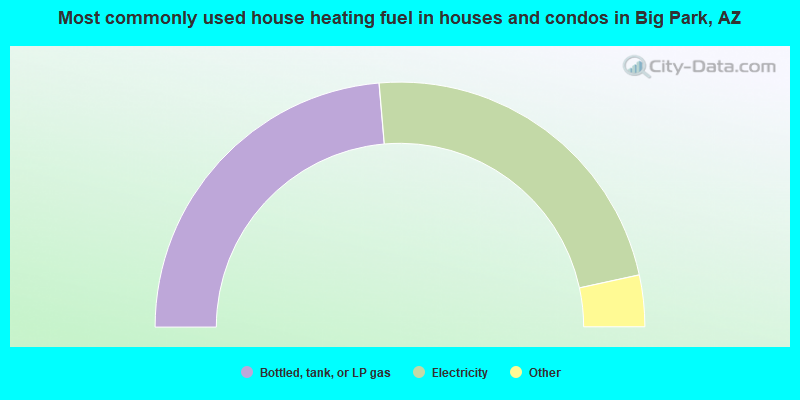
- 47.3%Bottled, tank, or LP gas
- 45.9%Electricity
- 2.9%Wood
- 2.5%Utility gas
- 1.1%Other fuel
- 0.3%Solar energy
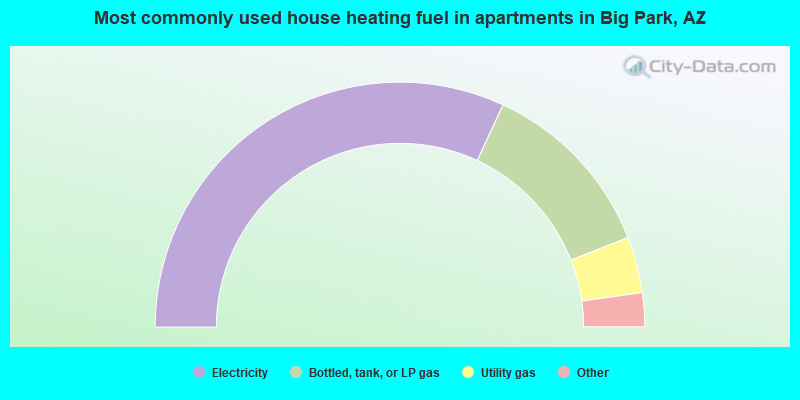
- 63.9%Electricity
- 24.3%Bottled, tank, or LP gas
- 7.4%Utility gas
- 2.9%Wood
- 1.6%No fuel used
Big Park compared to Arizona state average:
- Median house value above state average.
- Unemployed percentage significantly below state average.
- Black race population percentage significantly below state average.
- Hispanic race population percentage significantly below state average.
- Median age significantly above state average.
- Renting percentage significantly below state average.
- Length of stay since moving in significantly above state average.
- Number of rooms per house significantly below state average.
- House age significantly below state average.
- Institutionalized population percentage significantly above state average.
- Number of college students below state average.
- Percentage of population with a bachelor's degree or higher above state average.
Big Park on our top lists:
- #1 on the list of "Top 101 cities with largest percentage of males in occupations: other sales and related workers including supervisors (population 5,000+)"
- #1 on the list of "Top 101 cities with largest percentage of males in industries: sewing, needlework, and piece goods stores (population 5,000+)"
- #2 on the list of "Top 101 cities with largest percentage of females in occupations: art and design workers (population 5,000+)"
- #3 on the list of "Top 101 cities with largest percentage of females in occupations: communications equipment operators (population 5,000+)"
- #4 on the list of "Top 101 cities with largest percentage of females in industries: jewelry, luggage, and leather goods stores (population 5,000+)"
- #4 on the list of "Top 101 cities with largest percentage of females in occupations: therapists (population 5,000+)"
- #5 on the list of "Top 101 cities with largest percentage of males in occupations: other food preparation and serving workers including supervisors (population 5,000+)"
- #7 on the list of "Top 101 cities with largest percentage of males in occupations: transportation, tourism, and lodging attendants (population 5,000+)"
- #7 on the list of "Top 101 cities with largest percentage of females in industries: used merchandise, gift, novelty, and souvenir, and other miscellaneous stores (population 5,000+)"
- #9 on the list of "Top 101 cities with largest percentage of males in industries: health and personal care, except drug, stores (population 5,000+)"
- #9 on the list of "Top 101 cities with largest percentage of males in industries: other direct selling establishments (population 5,000+)"
- #10 on the list of "Top 101 cities with largest percentage of males in industries: used merchandise, gift, novelty, and souvenir, and other miscellaneous stores (population 5,000+)"
- #12 on the list of "Top 101 cities with the highest percentage of workers working at home, population 5,000+"
- #18 on the list of "Top 101 cities with largest percentage of females in industries: drugs, sundries, and chemical and allied products merchant wholesalers (population 5,000+)"
- #30 on the list of "Top 101 cities with largest percentage of males in industries: pharmacies and drug stores (population 5,000+)"
- #32 on the list of "Top 101 cities with largest percentage of males in industries: jewelry, luggage, and leather goods stores (population 5,000+)"
- #37 on the list of "Top 101 cities with largest percentage of females in industries: machinery, equipment, and supplies merchant wholesalers (population 5,000+)"
- #38 on the list of "Top 101 cities with largest percentage of females in industries: publishing, and motion picture and sound recording industries (population 5,000+)"
- #54 on the list of "Top 101 cities with largest percentage of males in industries: u. s. postal service (population 5,000+)"
- #62 on the list of "Top 101 cities with largest percentage of males in industries: publishing, and motion picture and sound recording industries (population 5,000+)"
- #40 (86351) on the list of "Top 101 zip codes with the smallest percentage of returns reporting salary or wage in 2012 (pop 5,000+)"
- #16 on the list of "Top 101 counties with the lowest Particulate Matter (PM2.5) Annual air pollution readings in 2012 (µg/m3)"
- #20 on the list of "Top 101 counties with the lowest number of births per 1000 residents 2007-2013"
- #45 on the list of "Top 101 counties with the lowest Particulate Matter (PM10) Annual air pollution readings in 2012 (µg/m3)"
- #68 on the list of "Top 101 counties with the highest Ozone (1-hour) air pollution readings in 2012 (ppm)"
- #76 on the list of "Top 101 counties with the highest number of deaths per 1000 residents 2007-2013 (pop. 50,000+)"