Black Hawk, Colorado Submit your own pictures of this city and show them to the world
OSM Map
General Map
Google Map
MSN Map
OSM Map
General Map
Google Map
MSN Map
OSM Map
General Map
Google Map
MSN Map
OSM Map
General Map
Google Map
MSN Map
Please wait while loading the map...
Population in 2022: 127 (0% urban, 100% rural). Population change since 2000: +7.6%Males: 79 Females: 48
March 2022 cost of living index in Black Hawk: 96.3 (near average, U.S. average is 100) Percentage of residents living in poverty in 2022: 4.9%
Profiles of local businesses
Business Search - 14 Million verified businesses
Data:
Median household income ($)
Median household income (% change since 2000)
Household income diversity
Ratio of average income to average house value (%)
Ratio of average income to average rent
Median household income ($) - White
Median household income ($) - Black or African American
Median household income ($) - Asian
Median household income ($) - Hispanic or Latino
Median household income ($) - American Indian and Alaska Native
Median household income ($) - Multirace
Median household income ($) - Other Race
Median household income for houses/condos with a mortgage ($)
Median household income for apartments without a mortgage ($)
Races - White alone (%)
Races - White alone (% change since 2000)
Races - Black alone (%)
Races - Black alone (% change since 2000)
Races - American Indian alone (%)
Races - American Indian alone (% change since 2000)
Races - Asian alone (%)
Races - Asian alone (% change since 2000)
Races - Hispanic (%)
Races - Hispanic (% change since 2000)
Races - Native Hawaiian and Other Pacific Islander alone (%)
Races - Native Hawaiian and Other Pacific Islander alone (% change since 2000)
Races - Two or more races (%)
Races - Two or more races (% change since 2000)
Races - Other race alone (%)
Races - Other race alone (% change since 2000)
Racial diversity
Unemployment (%)
Unemployment (% change since 2000)
Unemployment (%) - White
Unemployment (%) - Black or African American
Unemployment (%) - Asian
Unemployment (%) - Hispanic or Latino
Unemployment (%) - American Indian and Alaska Native
Unemployment (%) - Multirace
Unemployment (%) - Other Race
Population density (people per square mile)
Population - Males (%)
Population - Females (%)
Population - Males (%) - White
Population - Males (%) - Black or African American
Population - Males (%) - Asian
Population - Males (%) - Hispanic or Latino
Population - Males (%) - American Indian and Alaska Native
Population - Males (%) - Multirace
Population - Males (%) - Other Race
Population - Females (%) - White
Population - Females (%) - Black or African American
Population - Females (%) - Asian
Population - Females (%) - Hispanic or Latino
Population - Females (%) - American Indian and Alaska Native
Population - Females (%) - Multirace
Population - Females (%) - Other Race
Coronavirus confirmed cases (Apr 27, 2024)
Deaths caused by coronavirus (Apr 27, 2024)
Coronavirus confirmed cases (per 100k population) (Apr 27, 2024)
Deaths caused by coronavirus (per 100k population) (Apr 27, 2024)
Daily increase in number of cases (Apr 27, 2024)
Weekly increase in number of cases (Apr 27, 2024)
Cases doubled (in days) (Apr 27, 2024)
Hospitalized patients (Apr 18, 2022)
Negative test results (Apr 18, 2022)
Total test results (Apr 18, 2022)
COVID Vaccine doses distributed (per 100k population) (Sep 19, 2023)
COVID Vaccine doses administered (per 100k population) (Sep 19, 2023)
COVID Vaccine doses distributed (Sep 19, 2023)
COVID Vaccine doses administered (Sep 19, 2023)
Likely homosexual households (%)
Likely homosexual households (% change since 2000)
Likely homosexual households - Lesbian couples (%)
Likely homosexual households - Lesbian couples (% change since 2000)
Likely homosexual households - Gay men (%)
Likely homosexual households - Gay men (% change since 2000)
Cost of living index
Median gross rent ($)
Median contract rent ($)
Median monthly housing costs ($)
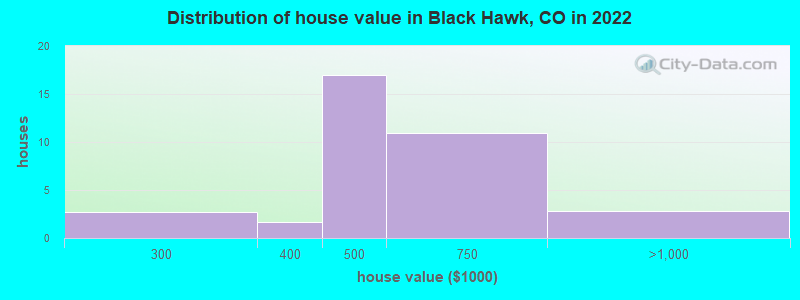
Median house or condo value ($)
Median house or condo value ($ change since 2000)
Mean house or condo value by units in structure - 1, detached ($)
Mean house or condo value by units in structure - 1, attached ($)
Mean house or condo value by units in structure - 2 ($)
Mean house or condo value by units in structure by units in structure - 3 or 4 ($)
Mean house or condo value by units in structure - 5 or more ($)
Mean house or condo value by units in structure - Boat, RV, van, etc. ($)
Mean house or condo value by units in structure - Mobile home ($)
Median house or condo value ($) - White
Median house or condo value ($) - Black or African American
Median house or condo value ($) - Asian
Median house or condo value ($) - Hispanic or Latino
Median house or condo value ($) - American Indian and Alaska Native
Median house or condo value ($) - Multirace
Median house or condo value ($) - Other Race
Median resident age
Resident age diversity
Median resident age - Males
Median resident age - Females
Median resident age - White
Median resident age - Black or African American
Median resident age - Asian
Median resident age - Hispanic or Latino
Median resident age - American Indian and Alaska Native
Median resident age - Multirace
Median resident age - Other Race
Median resident age - Males - White
Median resident age - Males - Black or African American
Median resident age - Males - Asian
Median resident age - Males - Hispanic or Latino
Median resident age - Males - American Indian and Alaska Native
Median resident age - Males - Multirace
Median resident age - Males - Other Race
Median resident age - Females - White
Median resident age - Females - Black or African American
Median resident age - Females - Asian
Median resident age - Females - Hispanic or Latino
Median resident age - Females - American Indian and Alaska Native
Median resident age - Females - Multirace
Median resident age - Females - Other Race
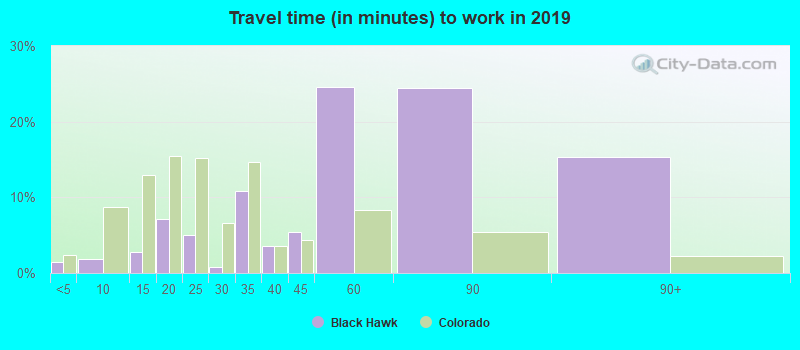
Commute - mean travel time to work (minutes)
Travel time to work - Less than 5 minutes (%)
Travel time to work - Less than 5 minutes (% change since 2000)
Travel time to work - 5 to 9 minutes (%)
Travel time to work - 5 to 9 minutes (% change since 2000)
Travel time to work - 10 to 19 minutes (%)
Travel time to work - 10 to 19 minutes (% change since 2000)
Travel time to work - 20 to 29 minutes (%)
Travel time to work - 20 to 29 minutes (% change since 2000)
Travel time to work - 30 to 39 minutes (%)
Travel time to work - 30 to 39 minutes (% change since 2000)
Travel time to work - 40 to 59 minutes (%)
Travel time to work - 40 to 59 minutes (% change since 2000)
Travel time to work - 60 to 89 minutes (%)
Travel time to work - 60 to 89 minutes (% change since 2000)
Travel time to work - 90 or more minutes (%)
Travel time to work - 90 or more minutes (% change since 2000)
Marital status - Never married (%)
Marital status - Now married (%)
Marital status - Separated (%)
Marital status - Widowed (%)
Marital status - Divorced (%)
Median family income ($)
Median family income (% change since 2000)
Median non-family income ($)
Median non-family income (% change since 2000)
Median per capita income ($)
Median per capita income (% change since 2000)
Median family income ($) - White
Median family income ($) - Black or African American
Median family income ($) - Asian
Median family income ($) - Hispanic or Latino
Median family income ($) - American Indian and Alaska Native
Median family income ($) - Multirace
Median family income ($) - Other Race
Median year house/condo built
Median year apartment built
Year house built - Built 2005 or later (%)
Year house built - Built 2000 to 2004 (%)
Year house built - Built 1990 to 1999 (%)
Year house built - Built 1980 to 1989 (%)
Year house built - Built 1970 to 1979 (%)
Year house built - Built 1960 to 1969 (%)
Year house built - Built 1950 to 1959 (%)
Year house built - Built 1940 to 1949 (%)
Year house built - Built 1939 or earlier (%)
Average household size
Household density (households per square mile)
Average household size - White
Average household size - Black or African American
Average household size - Asian
Average household size - Hispanic or Latino
Average household size - American Indian and Alaska Native
Average household size - Multirace
Average household size - Other Race
Occupied housing units (%)
Vacant housing units (%)
Owner occupied housing units (%)
Renter occupied housing units (%)
Vacancy status - For rent (%)
Vacancy status - For sale only (%)
Vacancy status - Rented or sold, not occupied (%)
Vacancy status - For seasonal, recreational, or occasional use (%)
Vacancy status - For migrant workers (%)
Vacancy status - Other vacant (%)
Residents with income below the poverty level (%)
Residents with income below 50% of the poverty level (%)
Children below poverty level (%)
Poor families by family type - Married-couple family (%)
Poor families by family type - Male, no wife present (%)
Poor families by family type - Female, no husband present (%)
Poverty status for native-born residents (%)
Poverty status for foreign-born residents (%)
Poverty among high school graduates not in families (%)
Poverty among people who did not graduate high school not in families (%)
Residents with income below the poverty level (%) - White
Residents with income below the poverty level (%) - Black or African American
Residents with income below the poverty level (%) - Asian
Residents with income below the poverty level (%) - Hispanic or Latino
Residents with income below the poverty level (%) - American Indian and Alaska Native
Residents with income below the poverty level (%) - Multirace
Residents with income below the poverty level (%) - Other Race
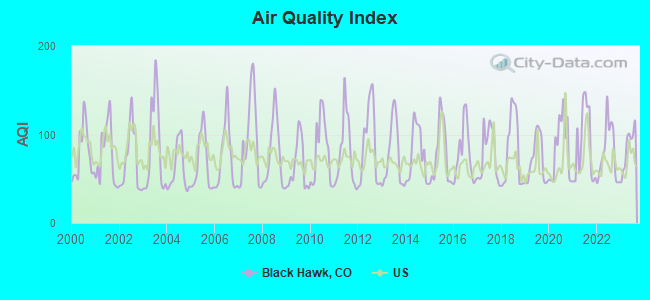
Air pollution - Air Quality Index (AQI)
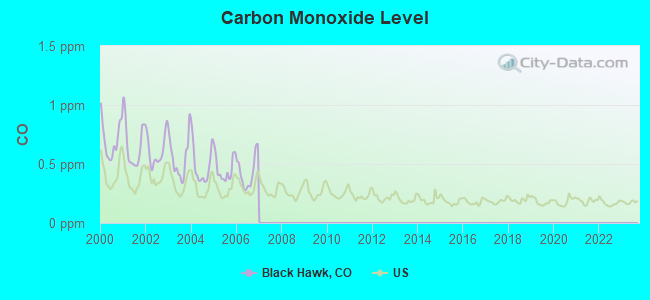
Air pollution - CO
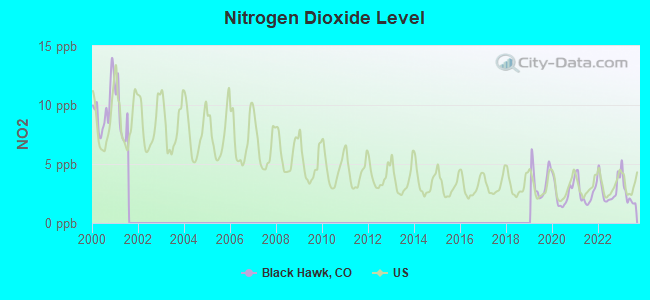
Air pollution - NO2
Air pollution - SO2
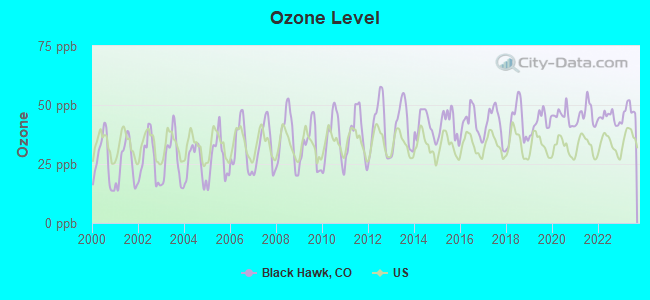
Air pollution - Ozone
Air pollution - PM10
Air pollution - PM25
Air pollution - Pb
Crime - Murders per 100,000 population
Crime - Rapes per 100,000 population
Crime - Robberies per 100,000 population
Crime - Assaults per 100,000 population
Crime - Burglaries per 100,000 population
Crime - Thefts per 100,000 population
Crime - Auto thefts per 100,000 population
Crime - Arson per 100,000 population
Crime - City-data.com crime index
Crime - Violent crime index
Crime - Property crime index
Crime - Murders per 100,000 population (5 year average)
Crime - Rapes per 100,000 population (5 year average)
Crime - Robberies per 100,000 population (5 year average)
Crime - Assaults per 100,000 population (5 year average)
Crime - Burglaries per 100,000 population (5 year average)
Crime - Thefts per 100,000 population (5 year average)
Crime - Auto thefts per 100,000 population (5 year average)
Crime - Arson per 100,000 population (5 year average)
Crime - City-data.com crime index (5 year average)
Crime - Violent crime index (5 year average)
Crime - Property crime index (5 year average)
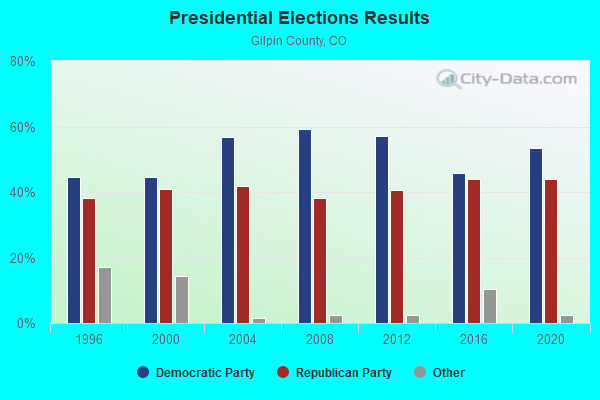
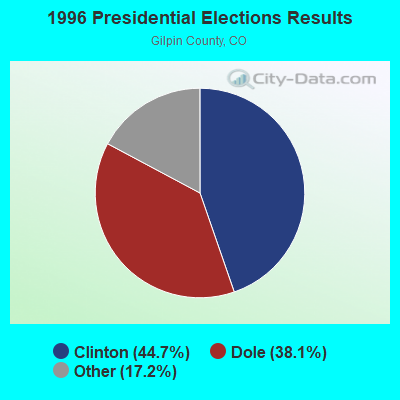
1996 Presidential Elections Results (%) - Democratic Party (Clinton)
1996 Presidential Elections Results (%) - Republican Party (Dole)
1996 Presidential Elections Results (%) - Other
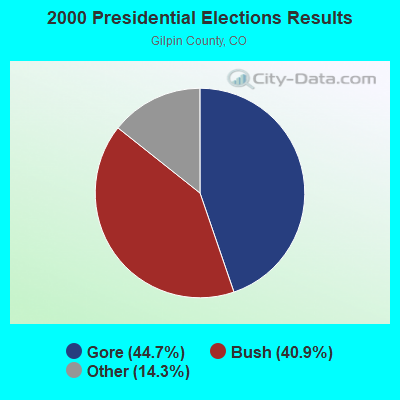
2000 Presidential Elections Results (%) - Democratic Party (Gore)
2000 Presidential Elections Results (%) - Republican Party (Bush)
2000 Presidential Elections Results (%) - Other
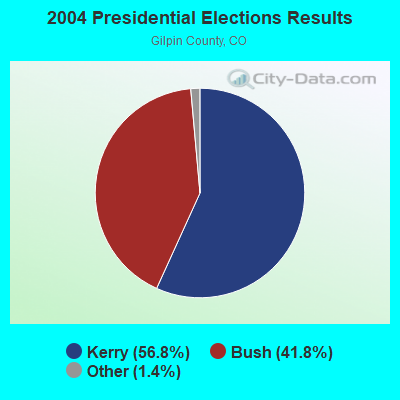
2004 Presidential Elections Results (%) - Democratic Party (Kerry)
2004 Presidential Elections Results (%) - Republican Party (Bush)
2004 Presidential Elections Results (%) - Other
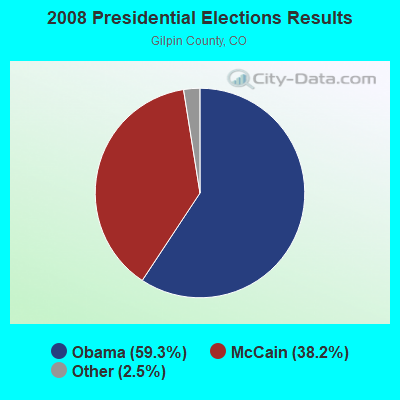
2008 Presidential Elections Results (%) - Democratic Party (Obama)
2008 Presidential Elections Results (%) - Republican Party (McCain)
2008 Presidential Elections Results (%) - Other
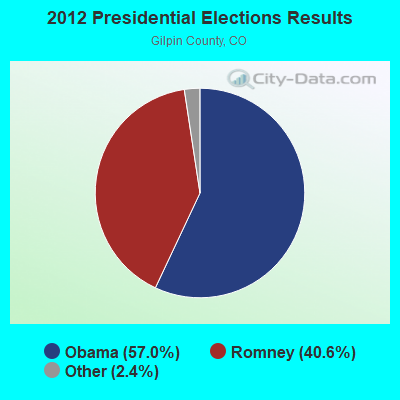
2012 Presidential Elections Results (%) - Democratic Party (Obama)
2012 Presidential Elections Results (%) - Republican Party (Romney)
2012 Presidential Elections Results (%) - Other
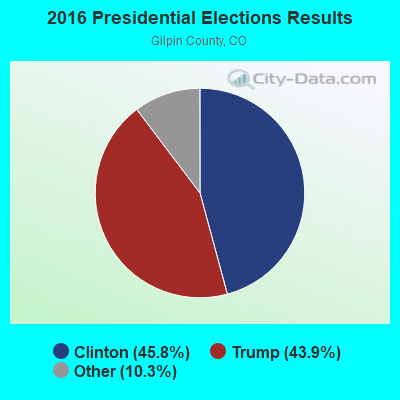
2016 Presidential Elections Results (%) - Democratic Party (Clinton)
2016 Presidential Elections Results (%) - Republican Party (Trump)
2016 Presidential Elections Results (%) - Other
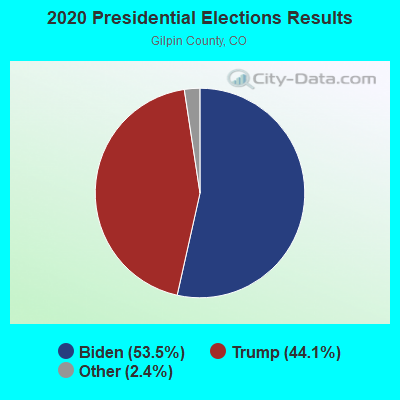
2020 Presidential Elections Results (%) - Democratic Party (Biden)
2020 Presidential Elections Results (%) - Republican Party (Trump)
2020 Presidential Elections Results (%) - Other
Ancestries Reported - Arab (%)
Ancestries Reported - Czech (%)
Ancestries Reported - Danish (%)
Ancestries Reported - Dutch (%)
Ancestries Reported - English (%)
Ancestries Reported - French (%)
Ancestries Reported - French Canadian (%)
Ancestries Reported - German (%)
Ancestries Reported - Greek (%)
Ancestries Reported - Hungarian (%)
Ancestries Reported - Irish (%)
Ancestries Reported - Italian (%)
Ancestries Reported - Lithuanian (%)
Ancestries Reported - Norwegian (%)
Ancestries Reported - Polish (%)
Ancestries Reported - Portuguese (%)
Ancestries Reported - Russian (%)
Ancestries Reported - Scotch-Irish (%)
Ancestries Reported - Scottish (%)
Ancestries Reported - Slovak (%)
Ancestries Reported - Subsaharan African (%)
Ancestries Reported - Swedish (%)
Ancestries Reported - Swiss (%)
Ancestries Reported - Ukrainian (%)
Ancestries Reported - United States (%)
Ancestries Reported - Welsh (%)
Ancestries Reported - West Indian (%)
Ancestries Reported - Other (%)
Educational Attainment - No schooling completed (%)
Educational Attainment - Less than high school (%)
Educational Attainment - High school or equivalent (%)
Educational Attainment - Less than 1 year of college (%)
Educational Attainment - 1 or more years of college (%)
Educational Attainment - Associate degree (%)
Educational Attainment - Bachelor's degree (%)
Educational Attainment - Master's degree (%)
Educational Attainment - Professional school degree (%)
Educational Attainment - Doctorate degree (%)
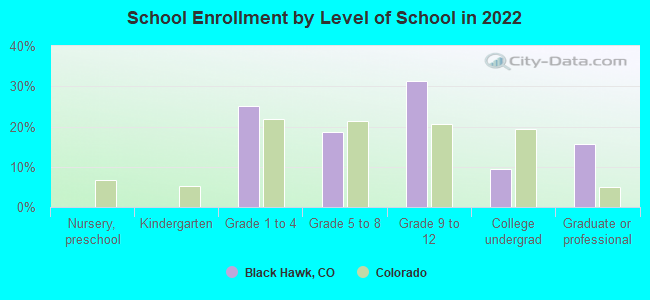
School Enrollment - Nursery, preschool (%)
School Enrollment - Kindergarten (%)
School Enrollment - Grade 1 to 4 (%)
School Enrollment - Grade 5 to 8 (%)
School Enrollment - Grade 9 to 12 (%)
School Enrollment - College undergrad (%)
School Enrollment - Graduate or professional (%)
School Enrollment - Not enrolled in school (%)
School enrollment - Public schools (%)
School enrollment - Private schools (%)
School enrollment - Not enrolled (%)
Median number of rooms in houses and condos
Median number of rooms in apartments
Housing units lacking complete plumbing facilities (%)
Housing units lacking complete kitchen facilities (%)
Density of houses
Urban houses (%)
Rural houses (%)
Households with people 60 years and over (%)
Households with people 65 years and over (%)
Households with people 75 years and over (%)
Households with one or more nonrelatives (%)
Households with no nonrelatives (%)
Population in households (%)
Family households (%)
Nonfamily households (%)
Population in families (%)
Family households with own children (%)
Median number of bedrooms in owner occupied houses
Mean number of bedrooms in owner occupied houses
Median number of bedrooms in renter occupied houses
Mean number of bedrooms in renter occupied houses
Median number of vehichles in owner occupied houses
Mean number of vehichles in owner occupied houses
Median number of vehichles in renter occupied houses
Mean number of vehichles in renter occupied houses
Mortgage status - with mortgage (%)
Mortgage status - with second mortgage (%)
Mortgage status - with home equity loan (%)
Mortgage status - with both second mortgage and home equity loan (%)
Mortgage status - without a mortgage (%)
Average family size
Average family size - White
Average family size - Black or African American
Average family size - Asian
Average family size - Hispanic or Latino
Average family size - American Indian and Alaska Native
Average family size - Multirace
Average family size - Other Race
Geographical mobility - Same house 1 year ago (%)
Geographical mobility - Moved within same county (%)
Geographical mobility - Moved from different county within same state (%)
Geographical mobility - Moved from different state (%)
Geographical mobility - Moved from abroad (%)
Place of birth - Born in state of residence (%)
Place of birth - Born in other state (%)
Place of birth - Native, outside of US (%)
Place of birth - Foreign born (%)
Housing units in structures - 1, detached (%)
Housing units in structures - 1, attached (%)
Housing units in structures - 2 (%)
Housing units in structures - 3 or 4 (%)
Housing units in structures - 5 to 9 (%)
Housing units in structures - 10 to 19 (%)
Housing units in structures - 20 to 49 (%)
Housing units in structures - 50 or more (%)
Housing units in structures - Mobile home (%)
Housing units in structures - Boat, RV, van, etc. (%)
House/condo owner moved in on average (years ago)
Renter moved in on average (years ago)
Year householder moved into unit - Moved in 1999 to March 2000 (%)
Year householder moved into unit - Moved in 1995 to 1998 (%)
Year householder moved into unit - Moved in 1990 to 1994 (%)
Year householder moved into unit - Moved in 1980 to 1989 (%)
Year householder moved into unit - Moved in 1970 to 1979 (%)
Year householder moved into unit - Moved in 1969 or earlier (%)
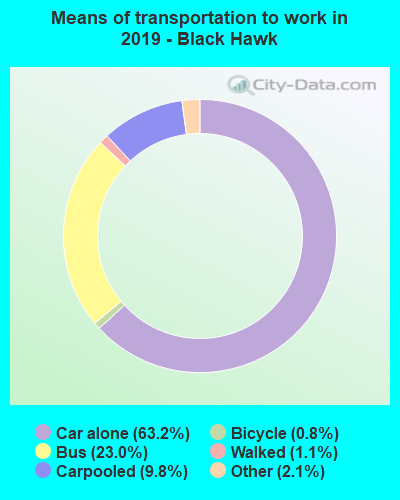
Means of transportation to work - Drove car alone (%)
Means of transportation to work - Carpooled (%)
Means of transportation to work - Public transportation (%)
Means of transportation to work - Bus or trolley bus (%)
Means of transportation to work - Streetcar or trolley car (%)
Means of transportation to work - Subway or elevated (%)
Means of transportation to work - Railroad (%)
Means of transportation to work - Ferryboat (%)
Means of transportation to work - Taxicab (%)
Means of transportation to work - Motorcycle (%)
Means of transportation to work - Bicycle (%)
Means of transportation to work - Walked (%)
Means of transportation to work - Other means (%)
Working at home (%)
Industry diversity
Most Common Industries - Agriculture, forestry, fishing and hunting, and mining (%)
Most Common Industries - Agriculture, forestry, fishing and hunting (%)
Most Common Industries - Mining, quarrying, and oil and gas extraction (%)
Most Common Industries - Construction (%)
Most Common Industries - Manufacturing (%)
Most Common Industries - Wholesale trade (%)
Most Common Industries - Retail trade (%)
Most Common Industries - Transportation and warehousing, and utilities (%)
Most Common Industries - Transportation and warehousing (%)
Most Common Industries - Utilities (%)
Most Common Industries - Information (%)
Most Common Industries - Finance and insurance, and real estate and rental and leasing (%)
Most Common Industries - Finance and insurance (%)
Most Common Industries - Real estate and rental and leasing (%)
Most Common Industries - Professional, scientific, and management, and administrative and waste management services (%)
Most Common Industries - Professional, scientific, and technical services (%)
Most Common Industries - Management of companies and enterprises (%)
Most Common Industries - Administrative and support and waste management services (%)
Most Common Industries - Educational services, and health care and social assistance (%)
Most Common Industries - Educational services (%)
Most Common Industries - Health care and social assistance (%)
Most Common Industries - Arts, entertainment, and recreation, and accommodation and food services (%)
Most Common Industries - Arts, entertainment, and recreation (%)
Most Common Industries - Accommodation and food services (%)
Most Common Industries - Other services, except public administration (%)
Most Common Industries - Public administration (%)
Occupation diversity
Most Common Occupations - Management, business, science, and arts occupations (%)
Most Common Occupations - Management, business, and financial occupations (%)
Most Common Occupations - Management occupations (%)
Most Common Occupations - Business and financial operations occupations (%)
Most Common Occupations - Computer, engineering, and science occupations (%)
Most Common Occupations - Computer and mathematical occupations (%)
Most Common Occupations - Architecture and engineering occupations (%)
Most Common Occupations - Life, physical, and social science occupations (%)
Most Common Occupations - Education, legal, community service, arts, and media occupations (%)
Most Common Occupations - Community and social service occupations (%)
Most Common Occupations - Legal occupations (%)
Most Common Occupations - Education, training, and library occupations (%)
Most Common Occupations - Arts, design, entertainment, sports, and media occupations (%)
Most Common Occupations - Healthcare practitioners and technical occupations (%)
Most Common Occupations - Health diagnosing and treating practitioners and other technical occupations (%)
Most Common Occupations - Health technologists and technicians (%)
Most Common Occupations - Service occupations (%)
Most Common Occupations - Healthcare support occupations (%)
Most Common Occupations - Protective service occupations (%)
Most Common Occupations - Fire fighting and prevention, and other protective service workers including supervisors (%)
Most Common Occupations - Law enforcement workers including supervisors (%)
Most Common Occupations - Food preparation and serving related occupations (%)
Most Common Occupations - Building and grounds cleaning and maintenance occupations (%)
Most Common Occupations - Personal care and service occupations (%)
Most Common Occupations - Sales and office occupations (%)
Most Common Occupations - Sales and related occupations (%)
Most Common Occupations - Office and administrative support occupations (%)
Most Common Occupations - Natural resources, construction, and maintenance occupations (%)
Most Common Occupations - Farming, fishing, and forestry occupations (%)
Most Common Occupations - Construction and extraction occupations (%)
Most Common Occupations - Installation, maintenance, and repair occupations (%)
Most Common Occupations - Production, transportation, and material moving occupations (%)
Most Common Occupations - Production occupations (%)
Most Common Occupations - Transportation occupations (%)
Most Common Occupations - Material moving occupations (%)
People in Group quarters - Institutionalized population (%)
People in Group quarters - Correctional institutions (%)
People in Group quarters - Federal prisons and detention centers (%)
People in Group quarters - Halfway houses (%)
People in Group quarters - Local jails and other confinement facilities (including police lockups) (%)
People in Group quarters - Military disciplinary barracks (%)
People in Group quarters - State prisons (%)
People in Group quarters - Other types of correctional institutions (%)
People in Group quarters - Nursing homes (%)
People in Group quarters - Hospitals/wards, hospices, and schools for the handicapped (%)
People in Group quarters - Hospitals/wards and hospices for chronically ill (%)
People in Group quarters - Hospices or homes for chronically ill (%)
People in Group quarters - Military hospitals or wards for chronically ill (%)
People in Group quarters - Other hospitals or wards for chronically ill (%)
People in Group quarters - Hospitals or wards for drug/alcohol abuse (%)
People in Group quarters - Mental (Psychiatric) hospitals or wards (%)
People in Group quarters - Schools, hospitals, or wards for the mentally retarded (%)
People in Group quarters - Schools, hospitals, or wards for the physically handicapped (%)
People in Group quarters - Institutions for the deaf (%)
People in Group quarters - Institutions for the blind (%)
People in Group quarters - Orthopedic wards and institutions for the physically handicapped (%)
People in Group quarters - Wards in general hospitals for patients who have no usual home elsewhere (%)
People in Group quarters - Wards in military hospitals for patients who have no usual home elsewhere (%)
People in Group quarters - Juvenile institutions (%)
People in Group quarters - Long-term care (%)
People in Group quarters - Homes for abused, dependent, and neglected children (%)
People in Group quarters - Residential treatment centers for emotionally disturbed children (%)
People in Group quarters - Training schools for juvenile delinquents (%)
People in Group quarters - Short-term care, detention or diagnostic centers for delinquent children (%)
People in Group quarters - Type of juvenile institution unknown (%)
People in Group quarters - Noninstitutionalized population (%)
People in Group quarters - College dormitories (includes college quarters off campus) (%)
People in Group quarters - Military quarters (%)
People in Group quarters - On base (%)
People in Group quarters - Barracks, unaccompanied personnel housing (UPH), (Enlisted/Officer), ;and similar group living quarters for military personnel (%)
People in Group quarters - Transient quarters for temporary residents (%)
People in Group quarters - Military ships (%)
People in Group quarters - Group homes (%)
People in Group quarters - Homes or halfway houses for drug/alcohol abuse (%)
People in Group quarters - Homes for the mentally ill (%)
People in Group quarters - Homes for the mentally retarded (%)
People in Group quarters - Homes for the physically handicapped (%)
People in Group quarters - Other group homes (%)
People in Group quarters - Religious group quarters (%)
People in Group quarters - Dormitories (%)
People in Group quarters - Agriculture workers' dormitories on farms (%)
People in Group quarters - Job Corps and vocational training facilities (%)
People in Group quarters - Other workers' dormitories (%)
People in Group quarters - Crews of maritime vessels (%)
People in Group quarters - Other nonhousehold living situations (%)
People in Group quarters - Other noninstitutional group quarters (%)
Residents speaking English at home (%)
Residents speaking English at home - Born in the United States (%)
Residents speaking English at home - Native, born elsewhere (%)
Residents speaking English at home - Foreign born (%)
Residents speaking Spanish at home (%)
Residents speaking Spanish at home - Born in the United States (%)
Residents speaking Spanish at home - Native, born elsewhere (%)
Residents speaking Spanish at home - Foreign born (%)
Residents speaking other language at home (%)
Residents speaking other language at home - Born in the United States (%)
Residents speaking other language at home - Native, born elsewhere (%)
Residents speaking other language at home - Foreign born (%)
Class of Workers - Employee of private company (%)
Class of Workers - Self-employed in own incorporated business (%)
Class of Workers - Private not-for-profit wage and salary workers (%)
Class of Workers - Local government workers (%)
Class of Workers - State government workers (%)
Class of Workers - Federal government workers (%)
Class of Workers - Self-employed workers in own not incorporated business and Unpaid family workers (%)
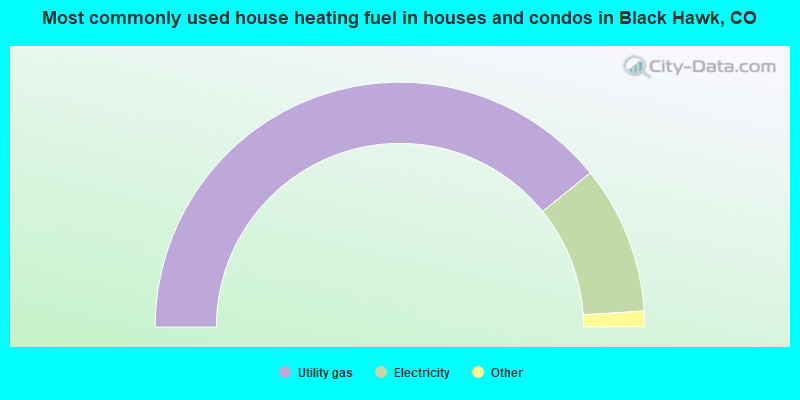
House heating fuel used in houses and condos - Utility gas (%)
House heating fuel used in houses and condos - Bottled, tank, or LP gas (%)
House heating fuel used in houses and condos - Electricity (%)
House heating fuel used in houses and condos - Fuel oil, kerosene, etc. (%)
House heating fuel used in houses and condos - Coal or coke (%)
House heating fuel used in houses and condos - Wood (%)
House heating fuel used in houses and condos - Solar energy (%)
House heating fuel used in houses and condos - Other fuel (%)
House heating fuel used in houses and condos - No fuel used (%)
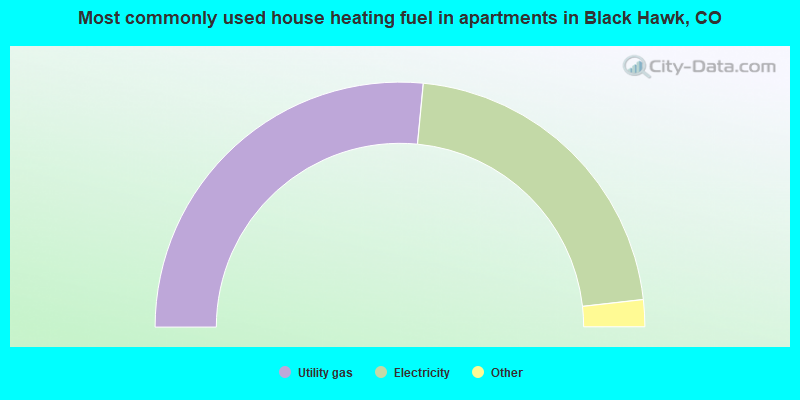
House heating fuel used in apartments - Utility gas (%)
House heating fuel used in apartments - Bottled, tank, or LP gas (%)
House heating fuel used in apartments - Electricity (%)
House heating fuel used in apartments - Fuel oil, kerosene, etc. (%)
House heating fuel used in apartments - Coal or coke (%)
House heating fuel used in apartments - Wood (%)
House heating fuel used in apartments - Solar energy (%)
House heating fuel used in apartments - Other fuel (%)
House heating fuel used in apartments - No fuel used (%)
Armed forces status - In Armed Forces (%)
Armed forces status - Civilian (%)
Armed forces status - Civilian - Veteran (%)
Armed forces status - Civilian - Nonveteran (%)
Fatal accidents locations in years 2005-2021
Fatal accidents locations in 2005
Fatal accidents locations in 2006
Fatal accidents locations in 2007
Fatal accidents locations in 2008
Fatal accidents locations in 2009
Fatal accidents locations in 2010
Fatal accidents locations in 2011
Fatal accidents locations in 2012
Fatal accidents locations in 2013
Fatal accidents locations in 2014
Fatal accidents locations in 2015
Fatal accidents locations in 2016
Fatal accidents locations in 2017
Fatal accidents locations in 2018
Fatal accidents locations in 2019
Fatal accidents locations in 2020
Fatal accidents locations in 2021
Alcohol use - People drinking some alcohol every month (%)
Alcohol use - People not drinking at all (%)
Alcohol use - Average days/month drinking alcohol
Alcohol use - Average drinks/week
Alcohol use - Average days/year people drink much
Audiometry - Average condition of hearing (%)
Audiometry - People that can hear a whisper from across a quiet room (%)
Audiometry - People that can hear normal voice from across a quiet room (%)
Audiometry - Ears ringing, roaring, buzzing (%)
Audiometry - Had a job exposure to loud noise (%)
Audiometry - Had off-work exposure to loud noise (%)
Blood Pressure & Cholesterol - Has high blood pressure (%)
Blood Pressure & Cholesterol - Checking blood pressure at home (%)
Blood Pressure & Cholesterol - Frequently checking blood cholesterol (%)
Blood Pressure & Cholesterol - Has high cholesterol level (%)
Consumer Behavior - Money monthly spent on food at supermarket/grocery store
Consumer Behavior - Money monthly spent on food at other stores
Consumer Behavior - Money monthly spent on eating out
Consumer Behavior - Money monthly spent on carryout/delivered foods
Consumer Behavior - Income spent on food at supermarket/grocery store (%)
Consumer Behavior - Income spent on food at other stores (%)
Consumer Behavior - Income spent on eating out (%)
Consumer Behavior - Income spent on carryout/delivered foods (%)
Current Health Status - General health condition (%)
Current Health Status - Blood donors (%)
Current Health Status - Has blood ever tested for HIV virus (%)
Current Health Status - Left-handed people (%)
Dermatology - People using sunscreen (%)
Diabetes - Diabetics (%)
Diabetes - Had a blood test for high blood sugar (%)
Diabetes - People taking insulin (%)
Diet Behavior & Nutrition - Diet health (%)
Diet Behavior & Nutrition - Milk product consumption (# of products/month)
Diet Behavior & Nutrition - Meals not home prepared (#/week)
Diet Behavior & Nutrition - Meals from fast food or pizza place (#/week)
Diet Behavior & Nutrition - Ready-to-eat foods (#/month)
Diet Behavior & Nutrition - Frozen meals/pizza (#/month)
Drug Use - People that ever used marijuana or hashish (%)
Drug Use - Ever used hard drugs (%)
Drug Use - Ever used any form of cocaine (%)
Drug Use - Ever used heroin (%)
Drug Use - Ever used methamphetamine (%)
Health Insurance - People covered by health insurance (%)
Kidney Conditions-Urology - Avg. # of times urinating at night
Medical Conditions - People with asthma (%)
Medical Conditions - People with anemia (%)
Medical Conditions - People with psoriasis (%)
Medical Conditions - People with overweight (%)
Medical Conditions - Elderly people having difficulties in thinking or remembering (%)
Medical Conditions - People who ever received blood transfusion (%)
Medical Conditions - People having trouble seeing even with glass/contacts (%)
Medical Conditions - People with arthritis (%)
Medical Conditions - People with gout (%)
Medical Conditions - People with congestive heart failure (%)
Medical Conditions - People with coronary heart disease (%)
Medical Conditions - People with angina pectoris (%)
Medical Conditions - People who ever had heart attack (%)
Medical Conditions - People who ever had stroke (%)
Medical Conditions - People with emphysema (%)
Medical Conditions - People with thyroid problem (%)
Medical Conditions - People with chronic bronchitis (%)
Medical Conditions - People with any liver condition (%)
Medical Conditions - People who ever had cancer or malignancy (%)
Mental Health - People who have little interest in doing things (%)
Mental Health - People feeling down, depressed, or hopeless (%)
Mental Health - People who have trouble sleeping or sleeping too much (%)
Mental Health - People feeling tired or having little energy (%)
Mental Health - People with poor appetite or overeating (%)
Mental Health - People feeling bad about themself (%)
Mental Health - People who have trouble concentrating on things (%)
Mental Health - People moving or speaking slowly or too fast (%)
Mental Health - People having thoughts they would be better off dead (%)
Oral Health - Average years since last visit a dentist
Oral Health - People embarrassed because of mouth (%)
Oral Health - People with gum disease (%)
Oral Health - General health of teeth and gums (%)
Oral Health - Average days a week using dental floss/device
Oral Health - Average days a week using mouthwash for dental problem
Oral Health - Average number of teeth
Pesticide Use - Households using pesticides to control insects (%)
Pesticide Use - Households using pesticides to kill weeds (%)
Physical Activity - People doing vigorous-intensity work activities (%)
Physical Activity - People doing moderate-intensity work activities (%)
Physical Activity - People walking or bicycling (%)
Physical Activity - People doing vigorous-intensity recreational activities (%)
Physical Activity - People doing moderate-intensity recreational activities (%)
Physical Activity - Average hours a day doing sedentary activities
Physical Activity - Average hours a day watching TV or videos
Physical Activity - Average hours a day using computer
Physical Functioning - People having limitations keeping them from working (%)
Physical Functioning - People limited in amount of work they can do (%)
Physical Functioning - People that need special equipment to walk (%)
Physical Functioning - People experiencing confusion/memory problems (%)
Physical Functioning - People requiring special healthcare equipment (%)
Prescription Medications - Average number of prescription medicines taking
Preventive Aspirin Use - Adults 40+ taking low-dose aspirin (%)
Reproductive Health - Vaginal deliveries (%)
Reproductive Health - Cesarean deliveries (%)
Reproductive Health - Deliveries resulted in a live birth (%)
Reproductive Health - Pregnancies resulted in a delivery (%)
Reproductive Health - Women breastfeeding newborns (%)
Reproductive Health - Women that had a hysterectomy (%)
Reproductive Health - Women that had both ovaries removed (%)
Reproductive Health - Women that have ever taken birth control pills (%)
Reproductive Health - Women taking birth control pills (%)
Reproductive Health - Women that have ever used Depo-Provera or injectables (%)
Reproductive Health - Women that have ever used female hormones (%)
Sexual Behavior - People 18+ that ever had sex (vaginal, anal, or oral) (%)
Sexual Behavior - Males 18+ that ever had vaginal sex with a woman (%)
Sexual Behavior - Males 18+ that ever performed oral sex on a woman (%)
Sexual Behavior - Males 18+ that ever had anal sex with a woman (%)
Sexual Behavior - Males 18+ that ever had any sex with a man (%)
Sexual Behavior - Females 18+ that ever had vaginal sex with a man (%)
Sexual Behavior - Females 18+ that ever performed oral sex on a man (%)
Sexual Behavior - Females 18+ that ever had anal sex with a man (%)
Sexual Behavior - Females 18+ that ever had any kind of sex with a woman (%)
Sexual Behavior - Average age people first had sex
Sexual Behavior - Average number of female sex partners in lifetime (males 18+)
Sexual Behavior - Average number of female vaginal sex partners in lifetime (males 18+)
Sexual Behavior - Average age people first performed oral sex on a woman (18+)
Sexual Behavior - Average number of woman performed oral sex on in lifetime (18+)
Sexual Behavior - Average number of male sex partners in lifetime (males 18+)
Sexual Behavior - Average number of male anal sex partners in lifetime (males 18+)
Sexual Behavior - Average age people first performed oral sex on a man (18+)
Sexual Behavior - Average number of male oral sex partners in lifetime (18+)
Sexual Behavior - People using protection when performing oral sex (%)
Sexual Behavior - Average number of times people have vaginal or anal sex a year
Sexual Behavior - People having sex without condom (%)
Sexual Behavior - Average number of male sex partners in lifetime (females 18+)
Sexual Behavior - Average number of male vaginal sex partners in lifetime (females 18+)
Sexual Behavior - Average number of female sex partners in lifetime (females 18+)
Sexual Behavior - Circumcised males 18+ (%)
Sleep Disorders - Average hours sleeping at night
Sleep Disorders - People that has trouble sleeping (%)
Smoking-Cigarette Use - People smoking cigarettes (%)
Taste & Smell - People 40+ having problems with smell (%)
Taste & Smell - People 40+ having problems with taste (%)
Taste & Smell - People 40+ that ever had wisdom teeth removed (%)
Taste & Smell - People 40+ that ever had tonsils teeth removed (%)
Taste & Smell - People 40+ that ever had a loss of consciousness because of a head injury (%)
Taste & Smell - People 40+ that ever had a broken nose or other serious injury to face or skull (%)
Taste & Smell - People 40+ that ever had two or more sinus infections (%)
Weight - Average height (inches)
Weight - Average weight (pounds)
Weight - Average BMI
Weight - People that are obese (%)
Weight - People that ever were obese (%)
Weight - People trying to lose weight (%)
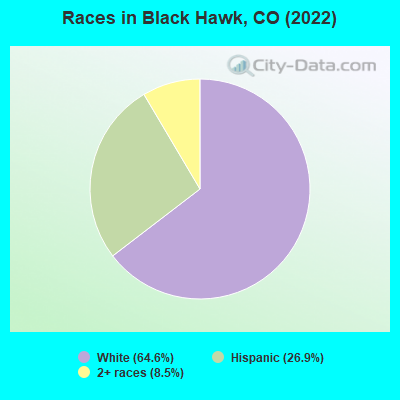
84 64.6% White alone 35 26.9% Hispanic 11 8.5% Two or more races
The City-Data.com crime index weighs serious crimes and violent crimes more heavily. Higher means more crime, U.S. average is 246.1. It adjusts for the number of visitors and daily workers commuting into cities.
Officers per 1,000 residents here:
159.09Colorado average:
2.14
Latest news from Black Hawk, CO collected exclusively by city-data.com from local newspapers, TV, and radio stations
Black Hawk, CO City Guides: Ancestries: English (21.5%), Irish (12.3%), American (9.2%), Russian (9.2%), German (6.2%), French Canadian (1.5%).
Current Local Time:
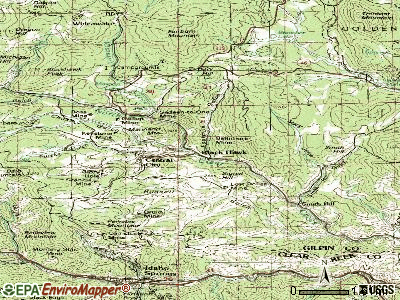
Land area: 1.46 square miles.
Population density: 87 people per square mile (very low).
3 residents are foreign born (2.5% Oceania ).
This city:
2.5%Colorado:
8.6%
Median real estate property taxes paid for housing units with mortgages in 2022: $554 (0.1%)Median real estate property taxes paid for housing units with no mortgage in 2022: $643 (0.1%)
Nearest city with pop. 50,000+: Boulder, CO
Nearest city with pop. 200,000+: Northeast Jefferson, CO (20.8 miles
Nearest city with pop. 1,000,000+: Phoenix, AZ
Nearest cities:
Rollinsville, CO (2.8 miles),
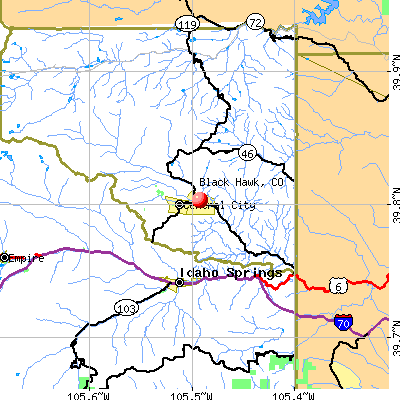
Latitude: 39.80 N, Longitude: 105.49 W
Nickname or alias (official or unofficial): City of Mills
Daytime population change due to commuting: +3,779 (+2,894.8%)Workers who live and work in this city: 39 (45.8%)
Black Hawk tourist attractions:
Unemployment in December 2023:
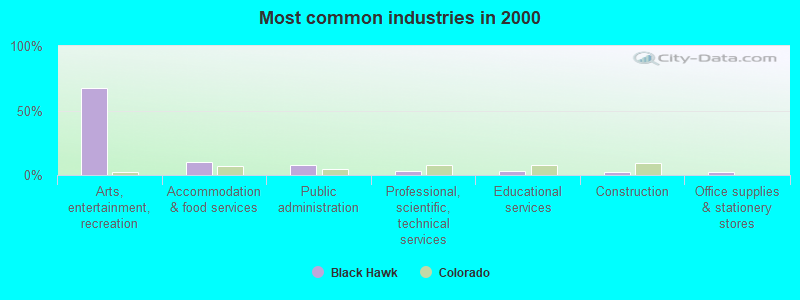
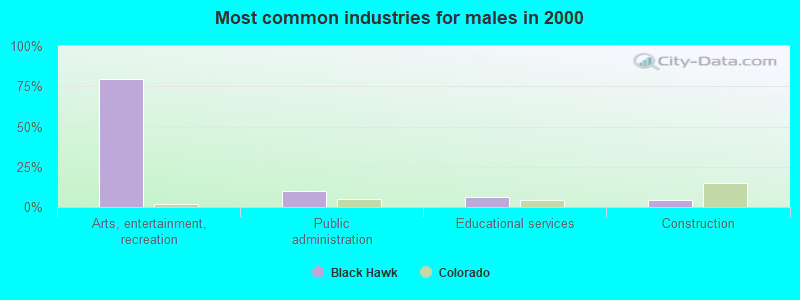
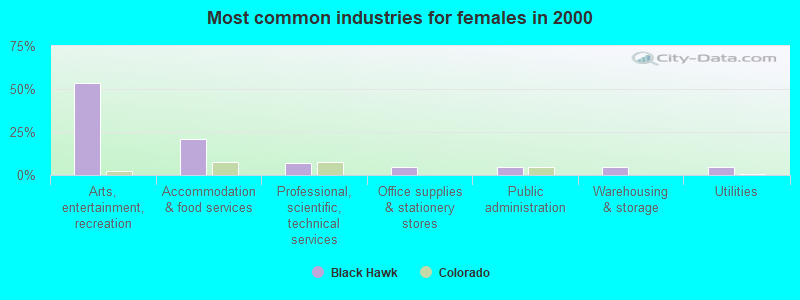
Most common industries in Black Hawk, CO (%)
Both Males Females
Arts, entertainment, recreation (67.4%)
Accommodation & food services (9.8%)
Public administration (7.6%)
Professional, scientific, technical services (3.3%)
Educational services (3.3%)
Construction (2.2%)
Office supplies & stationery stores (2.2%)
Arts, entertainment, recreation (79.6%)
Public administration (10.2%)
Educational services (6.1%)
Construction (4.1%)
Arts, entertainment, recreation (53.5%)
Accommodation & food services (20.9%)
Professional, scientific, technical services (7.0%)
Office supplies & stationery stores (4.7%)
Public administration (4.7%)
Warehousing & storage (4.7%)
Utilities (4.7%)
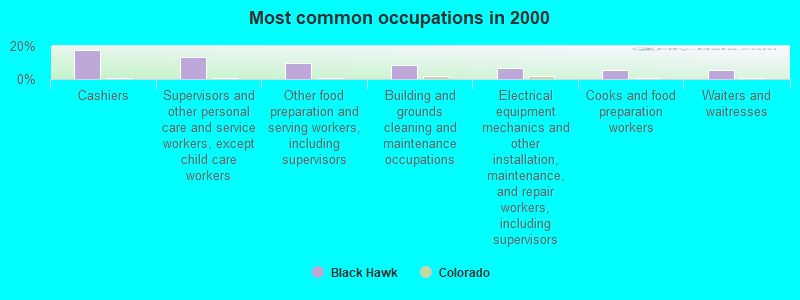
Most common occupations in Black Hawk, CO (%)
Both Males Females
Cashiers (17.4%)
Supervisors and other personal care and service workers, except child care workers (13.0%)
Other food preparation and serving workers, including supervisors (9.8%)
Building and grounds cleaning and maintenance occupations (8.7%)
Electrical equipment mechanics and other installation, maintenance, and repair workers, including supervisors (6.5%)
Cooks and food preparation workers (5.4%)
Waiters and waitresses (5.4%)
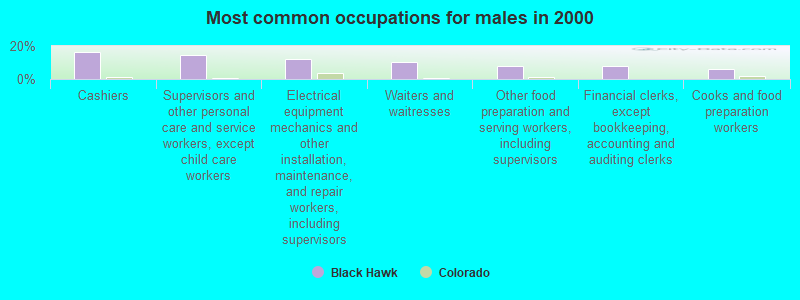
Cashiers (16.3%)
Supervisors and other personal care and service workers, except child care workers (14.3%)
Electrical equipment mechanics and other installation, maintenance, and repair workers, including supervisors (12.2%)
Waiters and waitresses (10.2%)
Other food preparation and serving workers, including supervisors (8.2%)
Financial clerks, except bookkeeping, accounting and auditing clerks (8.2%)
Cooks and food preparation workers (6.1%)
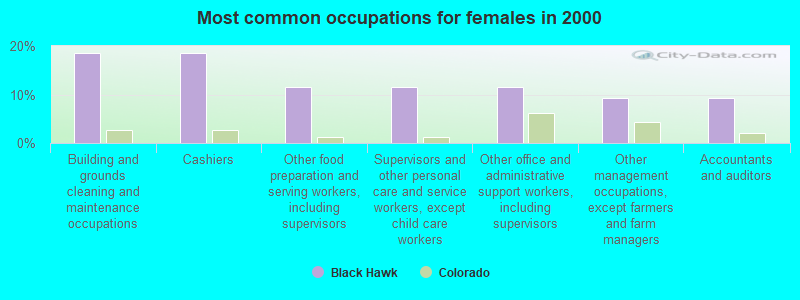
Building and grounds cleaning and maintenance occupations (18.6%)
Cashiers (18.6%)
Other food preparation and serving workers, including supervisors (11.6%)
Supervisors and other personal care and service workers, except child care workers (11.6%)
Other office and administrative support workers, including supervisors (11.6%)
Other management occupations, except farmers and farm managers (9.3%)
Accountants and auditors (9.3%)
Air pollution and air quality trends(lower is better)
AQI CO NO2 Ozone
Tornado activity:
Black Hawk-area historical tornado activity is slightly above Colorado state average. It is 15% smaller than the overall U.S. average.
On 6/15/1988, a category F3 (max. wind speeds 158-206 mph) tornado 30.3 miles away from the Black Hawk city center injured 7 people and caused between $5,000,000 and $50,000,000 in damages.
On 5/18/1975, a category F3 tornado 40.5 miles away from the city center .
Earthquake activity:
Black Hawk-area historical earthquake activity is significantly above Colorado state average. It is 771% greater than the overall U.S. average. On 8/18/1959 at 06:37:13, a magnitude 7.7 (7.7 UK, Class: Major, Intensity: VIII - XII) earthquake occurred 422.3 miles away from Black Hawk center, causing $26,000,000 total damage On 10/18/1984 at 15:30:23, a magnitude 5.5 (5.4 MB, 5.1 MS, 5.5 ML, Class: Moderate, Intensity: VI - VII) earthquake occurred 179.3 miles away from Black Hawk center On 10/28/1983 at 14:06:06, a magnitude 7.3 (6.2 MB, 7.3 MS, 7.0 MW) earthquake occurred 519.4 miles away from Black Hawk center, causing 2 deaths ( 2 shaking deaths) and 3 injuries, causing $15,000,000 total damage On 8/23/2011 at 05:46:18, a magnitude 5.3 (5.3 MW, Depth: 2.5 mi) earthquake occurred 194.3 miles away from Black Hawk center On 3/28/1975 at 02:31:05, a magnitude 6.2 (6.1 MB, 6.0 MS, 6.2 ML, Class: Strong, Intensity: VII - IX) earthquake occurred 395.5 miles away from the city center On 2/3/1995 at 15:26:10, a magnitude 5.3 (5.3 MB, 4.6 MS, Depth: 0.6 mi) earthquake occurred 248.2 miles away from the city center Magnitude types: body-wave magnitude (MB), local magnitude (ML), surface-wave magnitude (MS), moment magnitude (MW) Natural disasters: The number of natural disasters in Gilpin County (7) is smaller than the US average (15).Major Disasters (Presidential) Declared: 3Emergencies Declared: 3Floods: 2, Storms: 2, Fire: 1, Hurricane: 1, Landslide: 1, Mudslide: 1, Snow: 1, Snowstorm: 1, Other: 1 (Note: some incidents may be assigned to more than one category). Main business address for: JACOBS ENTERTAINMENT INC SERVICES-MISCELLANEOUS AMUSEMENT & RECREATION ).
Hospitals and medical centers near Black Hawk: LIFE CARE CENTER OF EVERGREEN (Nursing Home, about 13 miles away; EVERGREEN, CO)
MT EVANS HOME HEALTH CARE INC (Home Health Center, about 13 miles away; EVERGREEN, CO)
ATLAS HOME HEALTH (Home Health Center, about 15 miles away; GOLDEN, CO)
Heliports located in Black Hawk: Amtrak station near Black Hawk: 20 miles: FRAISER-WINTER PARK (FRASER, 420 RAILROAD ST.) - Seasonal Station Services: fully wheelchair accessible, enclosed waiting area, public restrooms, public payphones, full-service food facilities, free short-term parking, free long-term parking, call for taxi service, intercity bus service.
Colleges/universities with over 2000 students nearest to Black Hawk:
Colorado School of Mines (about 15 miles; Golden, CO ; Full-time enrollment: 5,507)
University of Colorado Boulder (about 19 miles; Boulder, CO ; FT enrollment: 28,328)
Red Rocks Community College (about 20 miles; Lakewood, CO ; FT enrollment: 6,185)
Colorado Christian University (about 23 miles; Lakewood, CO ; FT enrollment: 2,959)
Regis University (about 25 miles; Denver, CO ; FT enrollment: 6,975)
Front Range Community College (about 25 miles; Westminster, CO ; FT enrollment: 14,756)
Community College of Denver (about 27 miles; Denver, CO ; FT enrollment: 7,329)
Public high school in Black Hawk:
Public elementary/middle school in Black Hawk:
See full list of schools located in Black Hawk Library in Black Hawk: GILPIN COUNTY LIBRARY DISTRICT Operating income: $309,054; Location: 15131 HIGHWAY 119; 30,000 books ; 905 audio materials ; 2,000 video materials ; 26 print serial subscriptions ; 1 electronic serial subscriptions )
Gilpin County has a predicted average indoor radon screening level greater than 4 pCi/L (pico curies per liter) - Highest Potential Drinking water stations with addresses in Black Hawk and their reported violations in the past:
BLACK HAWK CITY OF (Population served: 15,167, Surface water):
Past monitoring violations:
Monitoring of Treatment (SWTR-Filter) - In JUN-2012. Follow-up actions: St Public Notif requested (AUG-16-2012), St Violation/Reminder Notice (AUG-16-2012), St Compliance achieved (DEC-31-2012), St Public Notif received (JUN-27-2013)
Monitoring and Reporting (DBP) - Between APR-2012 and JUN-2012, Contaminant: Chlorine. Follow-up actions: St Public Notif requested (AUG-16-2012), St Violation/Reminder Notice (AUG-16-2012), St Compliance achieved (DEC-31-2012), St Public Notif received (JUN-27-2013)
One minor monitoring violation
62 regular monitoring violations
Population served: 43, Groundwater):
Past monitoring violations:
One routine major monitoring violation
2 regular monitoring violations
Average household size: This city:
2.3 peopleColorado:
2.5 people
Percentage of family households: This city:
62.7%Whole state:
63.9%
Percentage of households with unmarried partners: This city:
7.8%Whole state:
6.5%
Likely homosexual households (counted as self-reported same-sex unmarried-partner households)
Lesbian couples: 0.0% of all households Gay men: 3.9% of all households
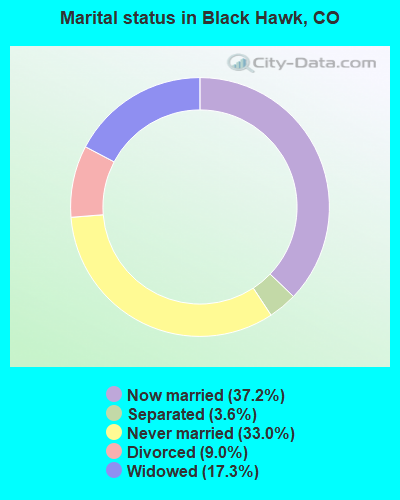
For population 15 years and over in Black Hawk:
Never married: 33.0%Now married: 37.2%Separated: 3.6%Widowed: 17.3%Divorced: 9.0% For population 25 years and over in Black Hawk:
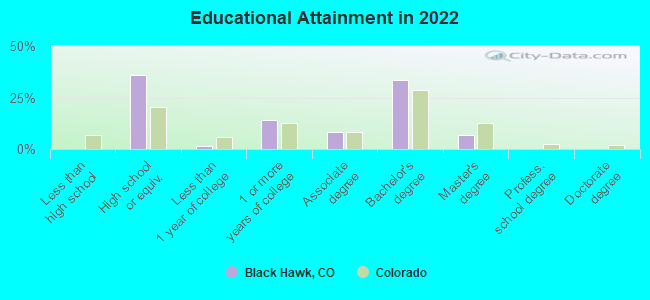
High school or higher: 100.0%Bachelor's degree or higher: 38.2%Graduate or professional degree: 6.5%Mean travel time to work (commute): 7.0 minutes
Education Gini index (Inequality in education) Here:
7.5Colorado average:
11.1
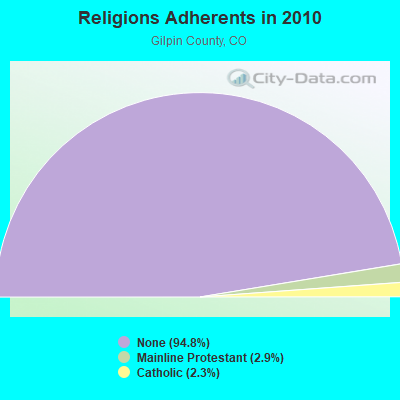
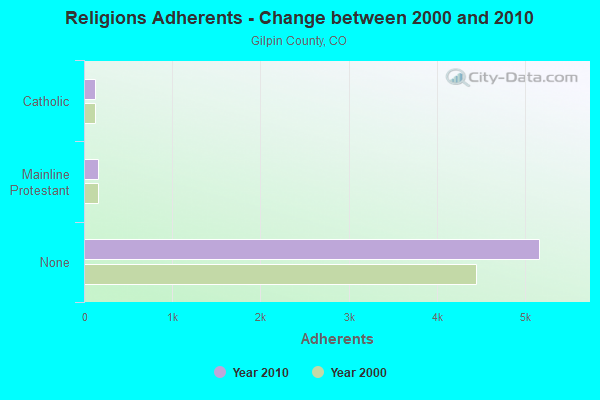
Religion statistics for Black Hawk, CO (based on Gilpin County data)
Religion Adherents Congregations Mainline Protestant 157 2 Catholic 126 1 Other 2 - None 5,156 -
Source: Clifford Grammich, Kirk Hadaway, Richard Houseal, Dale E.Jones, Alexei Krindatch, Richie Stanley and Richard H.Taylor. 2012. 2010 U.S.Religion Census: Religious Congregations & Membership Study. Association of Statisticians of American Religious Bodies. Jones, Dale E., et al. 2002. Congregations and Membership in the United States 2000. Nashville, TN: Glenmary Research Center. Graphs represent county-level data
Food Environment Statistics: Number of convenience stores (with gas) : 1Gilpin County :
1.97 / 10,000 pop.State :
3.13 / 10,000 pop.
Number of full-service restaurants : 2Here :
3.93 / 10,000 pop.Colorado :
8.99 / 10,000 pop.
Adult diabetes rate : Gilpin County :
4.9%State :
5.3%
Adult obesity rate : Gilpin County :
16.8%State :
18.4%
Health and Nutrition: Healthy diet rate : Black Hawk:
45.6%State:
49.4%
Average overall health of teeth and gums : Black Hawk:
39.8%Colorado:
47.8%
People feeling badly about themselves : People not drinking alcohol at all : Black Hawk:
10.8%Colorado:
9.7%
Average hours sleeping at night : Black Hawk:
6.7Colorado:
6.8
Overweight people : This city:
33.8%Colorado:
33.3%
General health condition : Black Hawk:
52.7%Colorado:
57.3%
Average condition of hearing : Black Hawk:
77.1%Colorado:
80.2%
More about Health and Nutrition of Black Hawk, CO Residents
Local government employment and payroll (March 2022)
Function
Full-time employees
Monthly full-time payroll
Average yearly full-time wage
Part-time employees
Monthly part-time payroll
Police Protection - Officers
23 $221,931 $115,790 0 $0 Firefighters
19 $190,534 $120,337 0 $0 Other and Unallocable
14 $110,102 $94,373 0 $0 Police - Other
9 $57,530 $76,707 0 $0 Water Supply
8 $61,696 $92,544 0 $0 Other Government Administration
7 $70,108 $120,185 7 $24,779 Streets and Highways
5 $27,867 $66,881 0 $0 Financial Administration
4 $44,093 $132,279 0 $0 Fire - Other
1 $6,525 $78,300 0 $0 Judicial and Legal
0 $0 1 $1,697
Totals for Government
90 $790,386 $105,385 8 $26,476
Black Hawk government finances - Expenditure in 2021 (per resident):
Construction - Housing and Community Development: $10,755,000 ($84685.04)
Parks and Recreation: $271,000 ($2133.86)Regular Highways: $111,000 ($874.02)Current Operations - Police Protection: $4,333,000 ($34118.11)
Central Staff Services: $2,961,000 ($23314.96)Local Fire Protection: $2,875,000 ($22637.80)General - Other: $1,932,000 ($15212.60)Regular Highways: $1,711,000 ($13472.44)Water Utilities: $1,641,000 ($12921.26)Financial Administration: $884,000 ($6960.63)General Public Buildings: $392,000 ($3086.61)Transit Utilities: $114,000 ($897.64)Judicial and Legal Services: $68,000 ($535.43)General - Interest on Debt: $772,000 ($6078.74)
Intergovernmental to Local - Other - General - Other: $823,000 ($6480.31)
Other - Health - Other: $442,000 ($3480.31)Other Capital Outlay - Water Utilities: $355,000 ($2795.28)
Local Fire Protection: $122,000 ($960.63)Regular Highways: $29,000 ($228.35)Total Salaries and Wages: $8,991,000 ($70795.28)
Black Hawk government finances - Revenue in 2021 (per resident):
Federal Intergovernmental - Health and Hospitals: $141,000 ($1110.24)
Local Intergovernmental - Highways: $124,000 ($976.38)
Miscellaneous - General Revenue - Other: $835,000 ($6574.80)
Interest Earnings: $196,000 ($1543.31)Rents: $157,000 ($1236.22)Special Assessments: $23,000 ($181.10)Fines and Forfeits: $14,000 ($110.24)Revenue - Water Utilities: $2,457,000 ($19346.46)
State Intergovernmental - Other: $7,118,000 ($56047.24)
Transit Utilities: $106,000 ($834.65)Highways: $13,000 ($102.36)General Local Government Support: $10,000 ($78.74)Tax - Amusements License: $4,716,000 ($37133.86)
General Sales and Gross Receipts: $3,312,000 ($26078.74)Property: $1,188,000 ($9354.33)Occupation and Business License - Other: $192,000 ($1511.81)Other Selective Sales: $178,000 ($1401.57)Public Utilities Sales: $124,000 ($976.38)Other: $75,000 ($590.55)Alcoholic Beverage License: $16,000 ($125.98)
Black Hawk government finances - Debt in 2021 (per resident):
Long Term Debt - Beginning Outstanding - Unspecified Public Purpose: $19,470,000 ($153307.09)
Outstanding Unspecified Public Purpose: $17,400,000 ($137007.87)Retired Unspecified Public Purpose: $2,070,000 ($16299.21)
Black Hawk government finances - Cash and Securities in 2021 (per resident):
Other Funds - Cash and Securities: $27,914,000 ($219795.28)
Sinking Funds - Cash and Securities: $1,740,000 ($13700.79)
Businesses in Black Hawk, CO
Strongest AM radio stations in Black Hawk:
KKZN (760 AM; 50 kW; THORNTON, CO; Owner: JACOR BROADCASTING OF COLORADO, INC.)
KLTT (670 AM; 50 kW; COMMERCE CITY, CO; Owner: KLZ RADIO, INC.)
KOA (850 AM; 50 kW; DENVER, CO; Owner: JACOR BROADCASTING OF COLORADO, INC.)
KLMO (1060 AM; 30 kW; LONGMONT, CO; Owner: PILGRIM COMMUNICATIONS, INC.)
KMXA (1090 AM; 50 kW; AURORA, CO; Owner: ENTRAVISION HOLDINGS, LLC)
KCUV (1510 AM; 25 kW; LITTLETON, CO; Owner: PEOPLE WIRELESS, INC.)
KVCU (1190 AM; 7 kW; BOULDER, CO; Owner: THE UNIVERSITY OF CO FOUNDATION, INC.)
KRKS (990 AM; 10 kW; DENVER, CO; Owner: SALEM MEDIA OF COLORADO, INC.)
KLZ (560 AM; 5 kW; DENVER, CO; Owner: KLZ RADIO, INC.)
KPOF (910 AM; 5 kW; DENVER, CO; Owner: PILLAR OF FIRE)
KADZ (1550 AM; 10 kW; ARVADA, CO; Owner: ABC, INC.)
KBJD (1650 AM; 10 kW; DENVER, CO; Owner: SALEM MEDIA OF COLORADO, INC.)
KDDZ (1690 AM; 10 kW; ARVADA, CO; Owner: ABC, INC.)
Strongest FM radio stations in Black Hawk:
KYGO-FM (98.5 FM; DENVER, CO; Owner: JEFFERSON-PILOT COMMUNICATIONS COMPANY OF COLORADO)
KXPK (96.5 FM; EVERGREEN, CO; Owner: ENTRAVISION HOLDINGS, LLC)
KBCO-FM (97.3 FM; BOULDER, CO; Owner: CITICASTERS LICENSES, L.P.)
KBPI (106.7 FM; DENVER, CO; Owner: JACOR BROADCASTING OF COLORADO, INC.)
KALC (105.9 FM; DENVER, CO; Owner: ENTERCOM DENVER LICENSE, LLC)
KFMD (95.7 FM; DENVER, CO; Owner: CITICASTERS LICENSES, L.P.)
KOSI (101.1 FM; DENVER, CO; Owner: ENTERCOM DENVER LICENSE, LLC)
KRFX (103.5 FM; DENVER, CO; Owner: JACOR BROADCASTING OF COLORADO, INC.)
KUVO (89.3 FM; DENVER, CO; Owner: DENVER EDUCATIONAL BROADCASTING)
KRKS-FM (94.7 FM; LAFAYETTE, CO; Owner: SALEM MEDIA OF COLORADO, INC)
KIMN (100.3 FM; DENVER, CO; Owner: INFINITY RADIO OPERATIONS INC.)
K209DE (89.7 FM; GOLDEN, CO; Owner: WAY-FM MEDIA GROUP, INC.)
KVOD (90.1 FM; DENVER, CO; Owner: PUBLIC BROADCASTING OF COLORADO, INC)
KQKS (107.5 FM; LAKEWOOD, CO; Owner: JEFFERSON-PILOT COMMUNICATIONS COMPANY OF COLORADO)
KXKL-FM (105.1 FM; DENVER, CO; Owner: INFINITY RADIO OPERATIONS INC.)
KQMT (99.5 FM; DENVER, CO; Owner: ENTERCOM DENVER LICENSE, LLC)
KLDV (91.1 FM; MORRISON, CO; Owner: EDUCATIONAL MEDIA FOUNDATION)
K229AC (93.7 FM; WARD, CO; Owner: BOULDER COMMUNITY BROADCAST ASSOC., INC.)
K300AE (107.9 FM; BRECKENRIDGE, CO; Owner: EDUCATIONAL MEDIA FOUNDATION)
K207CK (89.3 FM; BRECKENRIDGE, CO; Owner: SUMMIT PUBLIC RADIOSUMMIT FOUNDATION)
TV broadcast stations around Black Hawk:
KUSA-TV (Channel 9; DENVER, CO; Owner: MULTIMEDIA HOLDINGS CORPORATION)
KTVD (Channel 20; DENVER, CO; Owner: TWENVER BROADCAST, INC.)
KCNC-TV (Channel 4; DENVER, CO; Owner: CBS TELEVISION STATIONS INC.)
KWGN-TV (Channel 2; DENVER, CO; Owner: KWGN INC.)
KMGH-TV (Channel 7; DENVER, CO; Owner: MCGRAW-HILL BROADCASTING COMPANY, INC.)
K08IV (Channel 8; PINEWOOD SPRINGS,ETC, CO; Owner: CHANNEL 20 TV COMPANY)
KDVR (Channel 31; DENVER, CO; Owner: FOX TELEVISION STATIONS, INC.)
KRMA-TV (Channel 6; DENVER, CO; Owner: ROCKY MOUNTAIN PUBLIC BROADCASTING NETWORK, INC.)
KMAS-LP (Channel 63; DENVER, CO; Owner: TELEMUNDO OF STEAMBOAT SPRINGS COLO. LIC. CORP.)
KDEN (Channel 25; LONGMONT, CO; Owner: LONGMONT CHANNEL 25, INC.)
KPXC-TV (Channel 59; DENVER, CO; Owner: PAXSON DENVER LICENSE, INC.)
K48FW (Channel 48; DENVER, CO; Owner: TRINITY BROADCASTING NETWORK)
KDVT-LP (Channel 36; DENVER, CO; Owner: ENTRAVISION HOLDINGS, LLC)
K47IH (Channel 47; BOULDER, CO; Owner: CHANNEL 20 TV COMPANY)
KBDI-TV (Channel 12; BROOMFIELD, CO; Owner: FRONT RANGE EDUCATIONAL MEDIA CORP.)
KCEC (Channel 50; DENVER, CO; Owner: ENTRAVISION HOLDINGS, LLC)
Black Hawk, Colorado
Fatal accident count 10 Vehicles involved in fatal accidents 11 Fatal accidents involving drunk persons: 8 Fatalities 12 Persons involved in fatal accidents 19 Pedestrians involved in fatal accidents 1
Colorado average
Fatal accident count 4561 Vehicles involved in fatal accidents 6679 Fatal accidents involving drunk persons 2107 Fatalities 5109 Persons involved in fatal accidents 12052 Pedestrians involved in fatal accidents 343
See more detailed statistics of Black Hawk fatal car crashes and road traffic accidents for 1975 - 2021 here
National Bridge Inventory (NBI) Statistics 8 Number of bridges79ft / 24.5m Total length $363,000 Total costs24,419 Total average daily traffic1,156 Total average daily truck traffic32,522 Total future (year 2038) average daily traffic
FCC Registered Antenna Towers: 3
Richard Byrne, 293 Miners Mesa Rd (Lat: 39.795944 Lon: -105.480222), Type: 14.9, Overall height: 12.6 m, Registrant: Towerco Assets LLC, Afry@towerco.Com, , Cary, Phone: (919) 653-5710 Richard Byrne, 293 Miners Mesa Rd (Lat: 39.795944 Lon: -105.480222), Type: 14.9, Overall height: 12.6 m, Registrant: Towerco Assets LLC, Afry@towerco.Com, , Cary, Phone: (919) 653-5710 Edward G Roach, 293 Miners Mesa Rd (Lat: 39.795944 Lon: -105.480222), Type: 14.9, Structure height: 08047 m, Overall height: 12.6 m, Registrant: Sba 2012 Tc Assets, LLC, Eroach@sbasite.Com, , Boca -Raton, Phone: (561) 995-7670 FCC Registered Private Land Mobile Towers: 3 (
See the full list of FCC Registered Private Land Mobile Towers in Black Hawk, CO )
FCC Registered Broadcast Land Mobile Towers: 16 (
See the full list of FCC Registered Broadcast Land Mobile Towers )
FCC Registered Microwave Towers: 15 (
See the full list of FCC Registered Microwave Towers in this town )
FCC Registered Amateur Radio Licenses: 28 (
See the full list of FCC Registered Amateur Radio Licenses in Black Hawk )
FAA Registered Aircraft: 4
Aircraft: CESSNA 182J (Category: Land, Seats: 4, Weight: Up to 12,499 Pounds, Speed: 119 mph), Engine: CONT MOTOR O-470 SERIES (230 HP) (Reciprocating)N-Number: 2769F, N2769F, N-2769F, Serial Number: 18256869, Year manufactured: 1965, Airworthiness Date: 12/22/1965, Certificate Issue Date: 05/30/1979Registrant (Corporation): Aeronautical & Terrestrial Ventures Inc, 96 Bristlecone Way, Black Hawk, CO 80422Aircraft: NEW PIPER AIRCRAFT INC PA-46-500TP (Category: Land, Seats: 6, Weight: Up to 12,499 Pounds), Engine: P&W CANADA PT6A-42A (850 HP) (Turbo-prop)N-Number: 281DD, N281DD, N-281DD, Serial Number: 4697262, Year manufactured: 2006, Airworthiness Date: 08/07/2006, Certificate Issue Date: 06/20/2011Registrant (LLC): Romeo Hotel LLC, 3479 Smith Hill Rd, Black Hawk, CO 80422Aircraft: CESSNA P210N (Category: Land, Seats: 6, Weight: Up to 12,499 Pounds, Speed: 141 mph), Engine: CONT MOTOR TSIO-520 SER (300 HP) (Reciprocating)N-Number: 4612K, N4612K, N-4612K, Serial Number: P21000236, Year manufactured: 1979, Airworthiness Date: 03/27/1979, Certificate Issue Date: 11/02/2015Registrant (Individual): Andrew D Chitiea, Po Box 65, Black Hawk, CO 80422Aircraft: DANIELSON MARK W SKYBOLT (Category: Land, Seats: 2, Weight: Up to 12,499 Pounds), Engine: LYCOMING IO-540 SER (300 HP) (Reciprocating)N-Number: 51MD, N51MD, N-51MD, Serial Number: 1-300, Year manufactured: 1979, Airworthiness Date: 12/26/1979, Certificate Issue Date: 04/05/2018Registrant (Co-Owned): Andrew D Chitiea, Po Box 65, Black Hawk, CO 80422, Other Owners: Spencer B Mamber Black Hawk compared to Colorado state average:
Unemployed percentage significantly below state average. Black race population percentage significantly below state average. Median age significantly above state average. Foreign-born population percentage significantly below state average. Length of stay since moving in significantly above state average. House age significantly above state average.
Top Patent Applicants
Michael E. Weiblen (5)
Jordan Snyder (1)
Lawrence Ahlfert Pearlman (1)
Michael Eugene Weiblen (1)
Gary Cumro (1)
Total of 10 patent applications in 2008-2024.


 Recent articles from our blog. Our writers, many of them Ph.D. graduates or candidates, create easy-to-read articles on a wide variety of topics.


 (19.4 miles
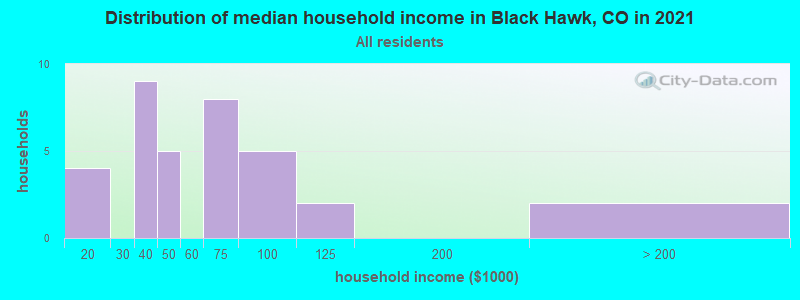


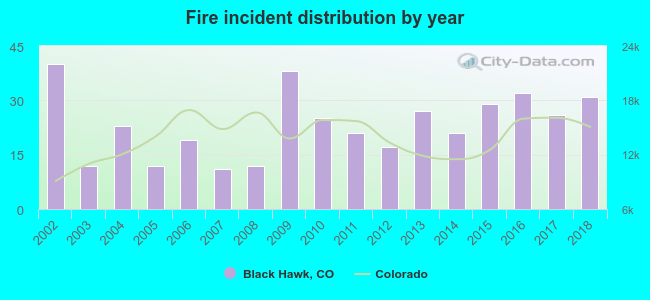 According to the data from the years 2002 - 2018 the average number of fire incidents per year is 23. The highest number of reported fires - 40 took place in 2002, and the least - 11 in 2007. The data has a dropping trend.
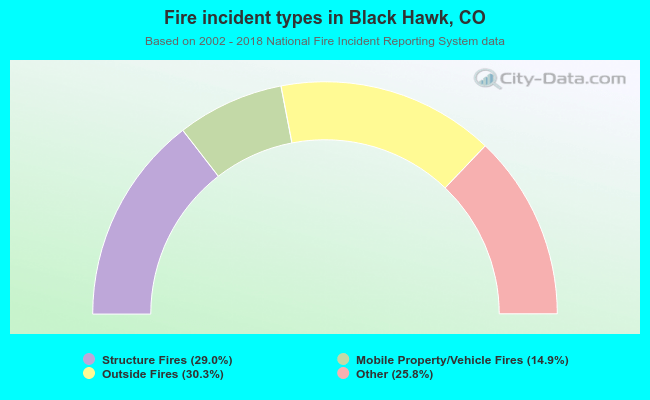 When looking into fire subcategories, the most incidents belonged to: Outside Fires (30.3%), and Structure Fires (29.0%).