Bloomfield Township, Michigan
Submit your own pictures of this place and show them to the world
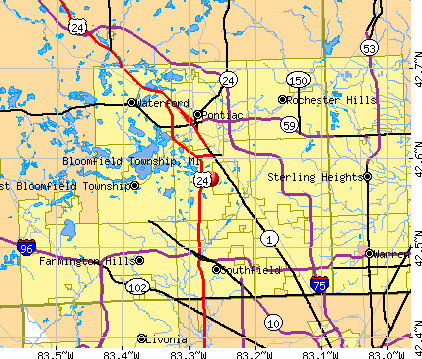
- OSM Map
- General Map
- Google Map
- MSN Map
| Males: 20,952 | |
| Females: 22,259 |
| Median resident age: | 45.2 years |
| Michigan median age: | 35.5 years |
Zip codes: 48302.
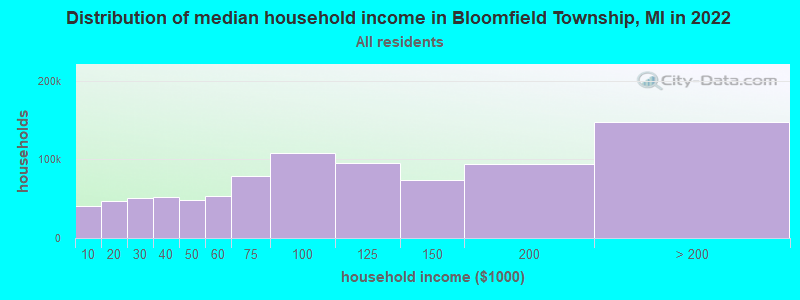
| Bloomfield Township: | $152,042 |
| MI: | $66,986 |
Estimated per capita income in 2022: $102,078 (it was $62,716 in 2000)
Bloomfield Township CDP income, earnings, and wages data
Estimated median house or condo value in 2022: $651,703 (it was $342,400 in 2000)
| Bloomfield Township: | $651,703 |
| MI: | $224,400 |
Mean prices in 2022: all housing units: $385,845; detached houses: $411,064; townhouses or other attached units: $279,603; in 2-unit structures: $305,018; in 3-to-4-unit structures: $206,955; in 5-or-more-unit structures: $228,603; mobile homes: $52,080; occupied boats, rvs, vans, etc.: $331,049
Bloomfield Township, MI residents, houses, and apartments details
Detailed information about poverty and poor residents in Bloomfield Township, MI


- 37,24786.6%White alone
- 2,7726.4%Asian alone
- 1,8354.3%Black alone
- 5951.4%Hispanic
- 4521.1%Two or more races
- 650.2%Other race alone
- 320.07%American Indian alone
- 230.05%Native Hawaiian and Other
Pacific Islander alone
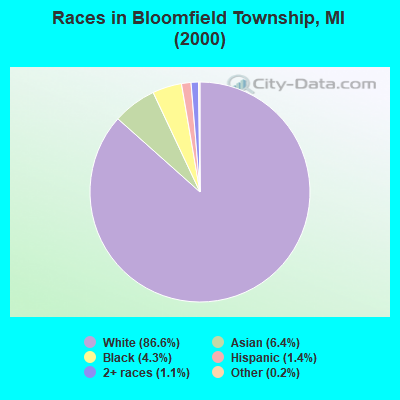
Races in Bloomfield Township detailed stats: ancestries, foreign born residents, place of birth
According to our research of Michigan and other state lists, there was 1 registered sex offender living in Bloomfield Township, Michigan as of April 28, 2024.
The ratio of all residents to sex offenders in Bloomfield Township is 43,211 to 1.
The ratio of registered sex offenders to all residents in this city is much lower than the state average.
Type |
2009 |
2010 |
2011 |
2012 |
2013 |
2014 |
2015 |
2016 |
2017 |
2018 |
2019 |
2020 |
2021 |
2022 |
|---|---|---|---|---|---|---|---|---|---|---|---|---|---|---|
| Murders (per 100,000) | 0 (0.0) | 0 (0.0) | 0 (0.0) | 1 (2.4) | 0 (0.0) | 1 (2.4) | 0 (0.0) | 0 (0.0) | 0 (0.0) | 0 (0.0) | 0 (0.0) | 0 (0.0) | 0 (0.0) | 0 (0.0) |
| Rapes (per 100,000) | 3 (7.4) | 4 (9.7) | 0 (0.0) | 2 (4.8) | 3 (7.2) | 3 (7.1) | 2 (4.7) | 3 (7.1) | 2 (4.7) | 4 (9.5) | 1 (2.4) | 6 (14.3) | 7 (16.7) | 1 (2.3) |
| Robberies (per 100,000) | 11 (27.0) | 6 (14.6) | 9 (21.9) | 4 (9.7) | 9 (21.5) | 7 (16.6) | 4 (9.5) | 3 (7.1) | 1 (2.4) | 2 (4.7) | 1 (2.4) | 1 (2.4) | 2 (4.8) | 1 (2.3) |
| Assaults (per 100,000) | 16 (39.3) | 9 (21.9) | 11 (26.8) | 15 (36.3) | 11 (26.3) | 6 (14.2) | 7 (16.6) | 14 (33.1) | 11 (26.0) | 17 (40.3) | 10 (23.6) | 5 (11.9) | 15 (35.9) | 19 (43.4) |
| Burglaries (per 100,000) | 118 (289.9) | 139 (338.4) | 91 (221.7) | 106 (256.2) | 75 (179.5) | 67 (159.1) | 68 (161.2) | 65 (153.6) | 52 (123.0) | 35 (82.9) | 41 (96.9) | 18 (42.8) | 25 (59.8) | 24 (54.8) |
| Thefts (per 100,000) | 486 (1,194) | 394 (959.3) | 347 (845.5) | 333 (805.0) | 337 (806.4) | 251 (596.0) | 322 (763.2) | 345 (815.4) | 286 (676.3) | 288 (682.5) | 270 (637.9) | 188 (447.0) | 175 (418.6) | 232 (529.6) |
| Auto thefts (per 100,000) | 32 (78.6) | 21 (51.1) | 21 (51.2) | 17 (41.1) | 28 (67.0) | 15 (35.6) | 16 (37.9) | 18 (42.5) | 23 (54.4) | 9 (21.3) | 16 (37.8) | 14 (33.3) | 17 (40.7) | 31 (70.8) |
| Arson (per 100,000) | 1 (2.5) | 2 (4.9) | 3 (7.3) | 0 (0.0) | 1 (2.4) | 2 (4.7) | 0 (0.0) | 1 (2.4) | 1 (2.4) | 2 (4.7) | 0 (0.0) | 0 (0.0) | 0 (0.0) | 0 (0.0) |
| City-Data.com crime index | 96.2 | 82.7 | 65.4 | 72.3 | 67.6 | 56.1 | 54.8 | 61.2 | 49.7 | 51.9 | 42.6 | 38.0 | 46.2 | 41.9 |
The City-Data.com crime index weighs serious crimes and violent crimes more heavily. Higher means more crime, U.S. average is 246.1. It adjusts for the number of visitors and daily workers commuting into cities.
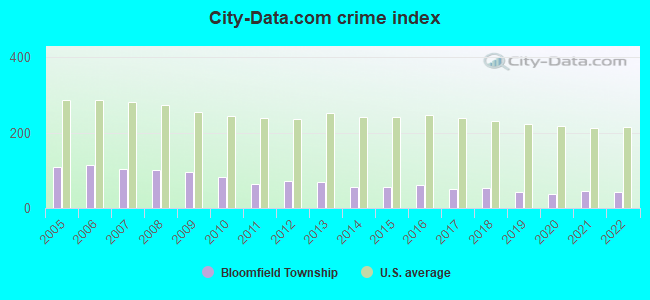
Crime rate in Bloomfield Township detailed stats: murders, rapes, robberies, assaults, burglaries, thefts, arson
Full-time law enforcement employees in 2021, including police officers: 85 (67 officers - 61 male; 6 female).
| Officers per 1,000 residents here: | 1.60 |
| Michigan average: | 1.86 |
 Recent articles from our blog. Our writers, many of them Ph.D. graduates or candidates, create easy-to-read articles on a wide variety of topics.


Latest news from Bloomfield Township, MI collected exclusively by city-data.com from local newspapers, TV, and radio stations
Ancestries: German (19.3%), Irish (14.0%), English (13.6%), Polish (8.3%), Italian (5.6%), French (4.2%).
Current Local Time: EST time zone
Land area: 24.9 square miles.
Population density: 1,733 people per square mile (low).
6,095 residents are foreign born (6.8% Asia, 4.9% Europe).
| This place: | 14.2% |
| Michigan: | 5.3% |
| Bloomfield Township CDP: | 1.2% ($4,246) |
| Michigan: | 1.3% ($1,461) |
Nearest city with pop. 50,000+: Pontiac, MI  (5.0 miles , pop. 66,337).
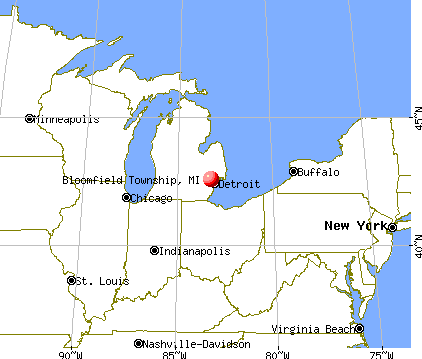
Nearest city with pop. 200,000+: Detroit, MI (15.5 miles , pop. 951,270).
Nearest city with pop. 1,000,000+: Chicago, IL (231.7 miles , pop. 2,896,016).
Nearest cities:
), ), ), ), Latitude: 42.58 N, Longitude: 83.27 W
Daytime population change due to commuting: -372 (-0.9%)
Workers who live and work in this place: 3,036 (15.3%)
Area code commonly used in this area: 248
| Here: | 2.6% |
| Michigan: | 3.5% |
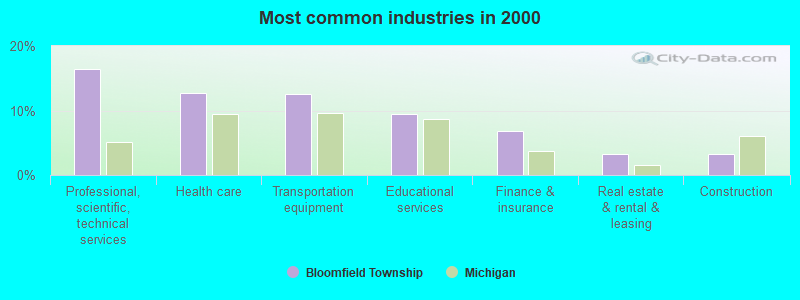
- Professional, scientific, technical services (16.5%)
- Health care (12.7%)
- Transportation equipment (12.6%)
- Educational services (9.5%)
- Finance & insurance (6.8%)
- Real estate & rental & leasing (3.3%)
- Construction (3.3%)
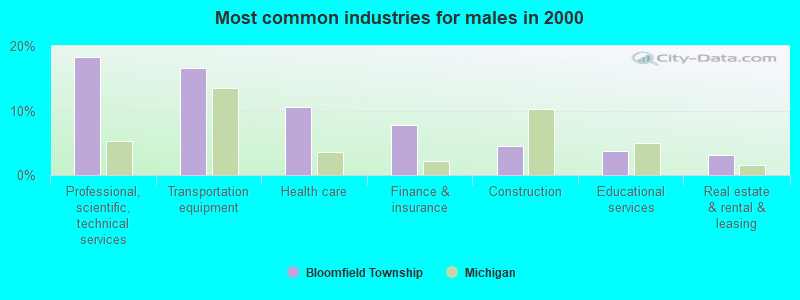
- Professional, scientific, technical services (18.3%)
- Transportation equipment (16.6%)
- Health care (10.6%)
- Finance & insurance (7.7%)
- Construction (4.6%)
- Educational services (3.7%)
- Real estate & rental & leasing (3.1%)
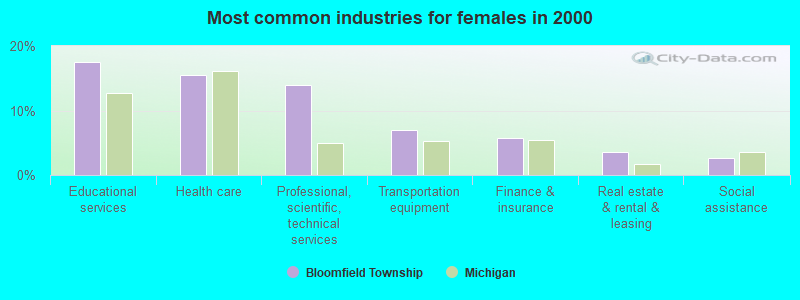
- Educational services (17.5%)
- Health care (15.6%)
- Professional, scientific, technical services (14.0%)
- Transportation equipment (6.9%)
- Finance & insurance (5.7%)
- Real estate & rental & leasing (3.5%)
- Social assistance (2.6%)
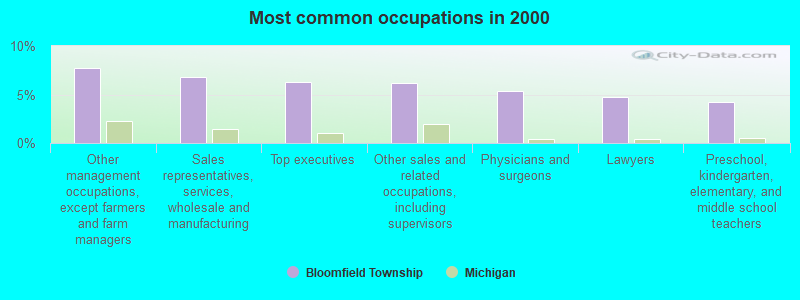
- Other management occupations, except farmers and farm managers (7.8%)
- Sales representatives, services, wholesale and manufacturing (6.8%)
- Top executives (6.3%)
- Other sales and related occupations, including supervisors (6.2%)
- Physicians and surgeons (5.3%)
- Lawyers (4.8%)
- Preschool, kindergarten, elementary, and middle school teachers (4.2%)
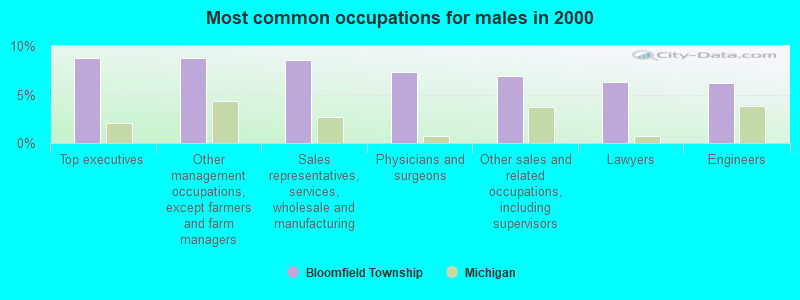
- Top executives (8.8%)
- Other management occupations, except farmers and farm managers (8.8%)
- Sales representatives, services, wholesale and manufacturing (8.5%)
- Physicians and surgeons (7.3%)
- Other sales and related occupations, including supervisors (6.9%)
- Lawyers (6.3%)
- Engineers (6.2%)
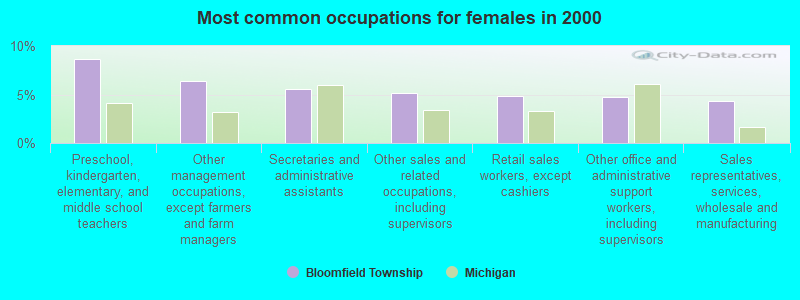
- Preschool, kindergarten, elementary, and middle school teachers (8.6%)
- Other management occupations, except farmers and farm managers (6.4%)
- Secretaries and administrative assistants (5.6%)
- Other sales and related occupations, including supervisors (5.2%)
- Retail sales workers, except cashiers (4.8%)
- Other office and administrative support workers, including supervisors (4.8%)
- Sales representatives, services, wholesale and manufacturing (4.4%)
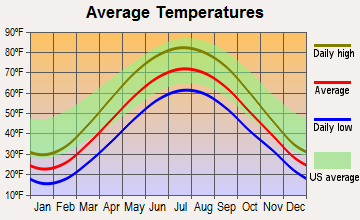
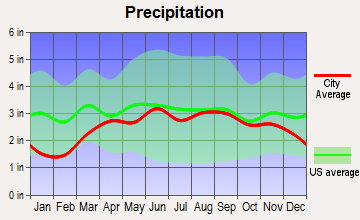
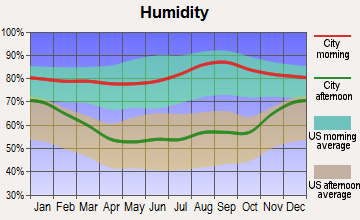
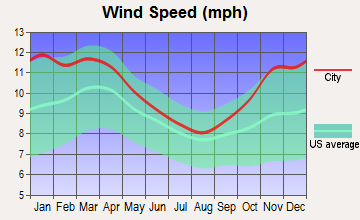
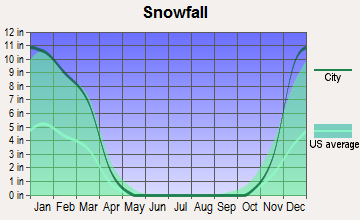
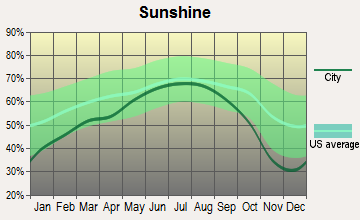
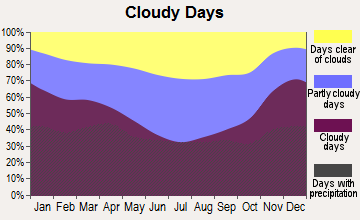
Average climate in Bloomfield Township, Michigan
Based on data reported by over 4,000 weather stations
(lower is better)
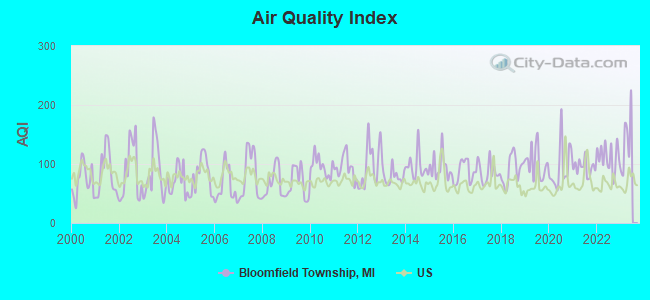
Air Quality Index (AQI) level in 2022 was 111. This is significantly worse than average.
| City: | 111 |
| U.S.: | 73 |
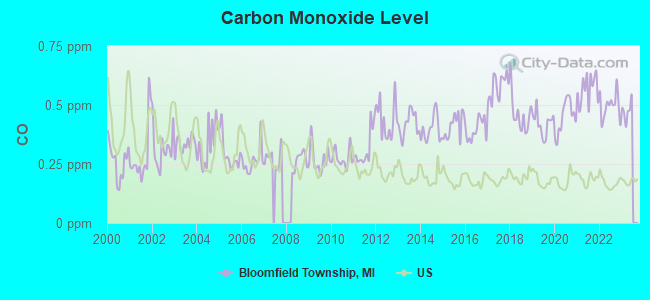
Carbon Monoxide (CO) [ppm] level in 2022 was 0.495. This is significantly worse than average. Closest monitor was 8.8 miles away from the city center.
| City: | 0.495 |
| U.S.: | 0.251 |
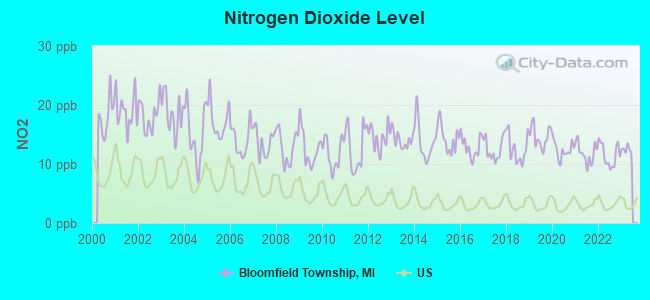
Nitrogen Dioxide (NO2) [ppb] level in 2022 was 11.5. This is significantly worse than average. Closest monitor was 5.0 miles away from the city center.
| City: | 11.5 |
| U.S.: | 5.1 |
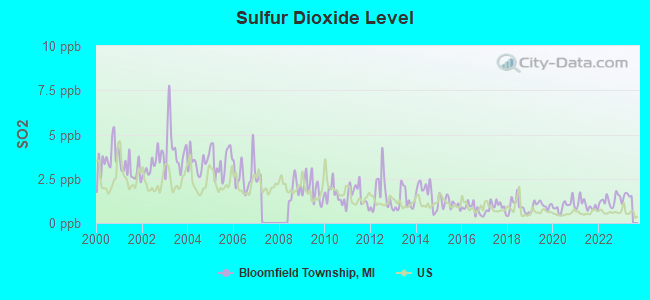
Sulfur Dioxide (SO2) [ppb] level in 2022 was 1.29. This is about average. Closest monitor was 5.0 miles away from the city center.
| City: | 1.29 |
| U.S.: | 1.51 |
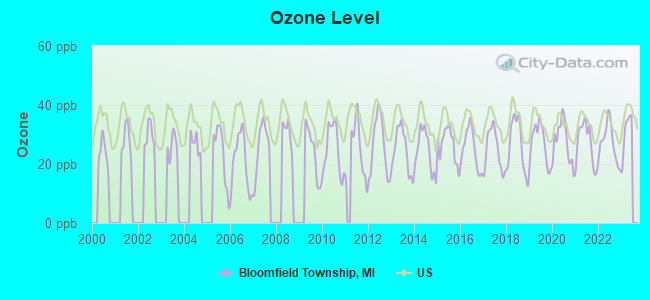
Ozone [ppb] level in 2022 was 27.2. This is better than average. Closest monitor was 8.8 miles away from the city center.
| City: | 27.2 |
| U.S.: | 33.3 |
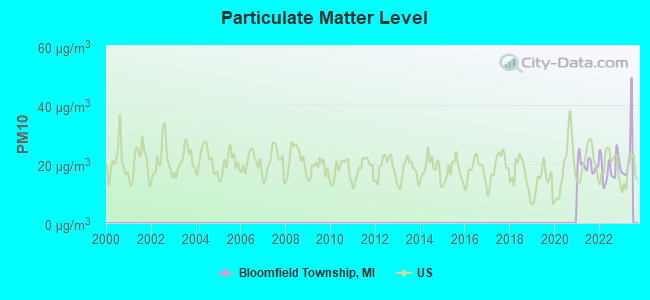
Particulate Matter (PM10) [µg/m3] level in 2022 was 18.6. This is about average. Closest monitor was 13.4 miles away from the city center.
| City: | 18.6 |
| U.S.: | 19.2 |
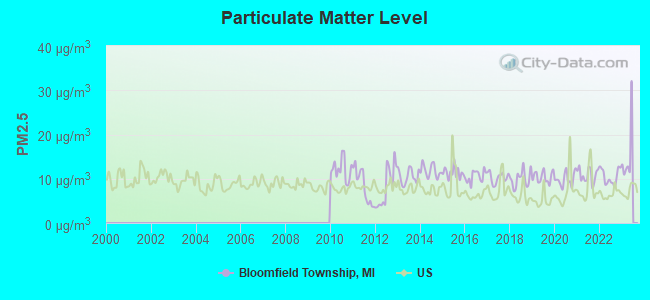
Particulate Matter (PM2.5) [µg/m3] level in 2022 was 10.5. This is worse than average. Closest monitor was 8.9 miles away from the city center.
| City: | 10.5 |
| U.S.: | 8.1 |
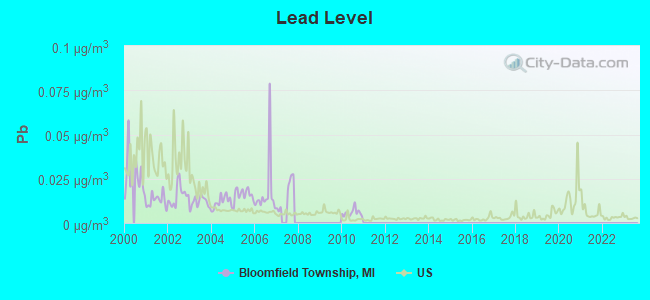
Lead (Pb) [µg/m3] level in 2010 was 0.00582. This is significantly better than average. Closest monitor was 5.0 miles away from the city center.
| City: | 0.00582 |
| U.S.: | 0.00931 |
Tornado activity:
Bloomfield Township-area historical tornado activity is slightly above Michigan state average. It is 39% greater than the overall U.S. average.
On 3/20/1976, a category F4 (max. wind speeds 207-260 mph) tornado 3.7 miles away from the Bloomfield Township place center killed one person and injured 55 people and caused between $5,000,000 and $50,000,000 in damages.
On 7/4/1957, a category F4 tornado 8.4 miles away from the place center injured 6 people and caused between $50,000 and $500,000 in damages.
Earthquake activity:
Bloomfield Township-area historical earthquake activity is significantly above Michigan state average. It is 48% smaller than the overall U.S. average.On 9/25/1998 at 19:52:52, a magnitude 5.2 (4.8 MB, 4.3 MS, 5.2 LG, 4.5 MW, Depth: 3.1 mi, Class: Moderate, Intensity: VI - VII) earthquake occurred 165.5 miles away from Bloomfield Township center
On 1/31/1986 at 16:46:43, a magnitude 5.0 (5.0 MB) earthquake occurred 127.4 miles away from the city center
On 7/12/1986 at 08:19:37, a magnitude 4.5 (4.5 MB, Class: Light, Intensity: IV - V) earthquake occurred 152.2 miles away from the city center
On 5/2/2015 at 16:23:07, a magnitude 4.2 (4.2 MW, Depth: 2.8 mi) earthquake occurred 112.9 miles away from the city center
On 7/27/1980 at 18:52:21, a magnitude 5.2 (5.1 MB, 4.7 MS, 5.0 UK, 5.2 UK) earthquake occurred 304.4 miles away from the city center
On 8/23/2011 at 17:51:04, a magnitude 5.8 (5.8 MW, Depth: 3.7 mi) earthquake occurred 428.1 miles away from Bloomfield Township center
Magnitude types: regional Lg-wave magnitude (LG), body-wave magnitude (MB), surface-wave magnitude (MS), moment magnitude (MW)
Natural disasters:
The number of natural disasters in Oakland County (12) is smaller than the US average (15).Major Disasters (Presidential) Declared: 6
Emergencies Declared: 5
Causes of natural disasters: Storms: 6, Floods: 5, Tornadoes: 3, Winter Storms: 2, Blizzard: 1, Hurricane: 1, Power Outage: 1, Snowstorm: 1, Wind: 1, Other: 1 (Note: some incidents may be assigned to more than one category).

Hospitals and medical centers near Bloomfield Township:
- BLOOMFIELD HILLS CARE CENTER (Nursing Home, about 2 miles away; BLOOMFIELD HILLS, MI)
- MEDILODGE OF BLOOMFIELD HILLS, INC (Nursing Home, about 2 miles away; BLOOMFIELD HILLS, MI)
- PREMIERCARE HOME HEALTH SOLUTIONS (Home Health Center, about 2 miles away; BLOOMFIELD HILLS, MI)
- PRIME HOMECARE AGENCY, L L C (Home Health Center, about 2 miles away; BLOOMFIELD HILLS, MI)
- WOODWARD HILLS NURSING CENTER (Nursing Home, about 3 miles away; BLOOMFIELD HILLS, MI)
- MERCY AMICARE HOME HEALTHCARE (Home Health Center, about 3 miles away; BLOOMFIELD HILLS, MI)
- CRANBROOK HOSPICE CARE (Hospital, about 3 miles away; BLOOMFIELD HILLS, MI)
Amtrak stations near Bloomfield Township:
- 5 miles: BIRMINGHAM (449 S. ETON ST.) . Services: public payphones, free short-term parking, free long-term parking, call for taxi service, public transit connection.
- 5 miles: PONTIAC (1600 WIDE TRACK DR.) . Services: partially wheelchair accessible, enclosed waiting area, public payphones, vending machines, free short-term parking, free long-term parking, call for taxi service, intercity bus service, public transit connection.
- 9 miles: ROYAL OAK (201 S. SHERMAN DR.) . Services: enclosed waiting area, public payphones, vending machines, paid short-term parking, taxi stand, intercity bus service, public transit connection.
Colleges/universities with over 2000 students nearest to Bloomfield Township:
- Baker College of Auburn Hills (about 6 miles; Auburn Hills, MI; Full-time enrollment: 2,284)
- Oakland University (about 8 miles; Rochester Hills, MI; FT enrollment: 16,449)
- Lawrence Technological University (about 8 miles; Southfield, MI; FT enrollment: 2,430)
- Oakland Community College (about 9 miles; Bloomfield Hills, MI; FT enrollment: 18,956)
- University of Detroit Mercy (about 13 miles; Detroit, MI; FT enrollment: 3,406)
- Schoolcraft College (about 14 miles; Livonia, MI; FT enrollment: 10,867)
- Madonna University (about 15 miles; Livonia, MI; FT enrollment: 3,212)
Public high school in Bloomfield Township:
- WEST BLOOMFIELD HIGH SCHOOL (Students: 1,954, Location: 4925 ORCHARD LAKE RD, Grades: 9-12)
Private high school in Bloomfield Township:
Biggest public elementary/middle schools in Bloomfield Township:
- WALNUT CREEK MIDDLE SCHOOL (Students: 868, Location: 7601 WALNUT LAKE RD, Grades: 6-8)
- ORCHARD LAKE MIDDLE SCHOOL (Students: 793, Location: 6000 ORCHARD LAKE RD, Grades: 6-8)
- SCOTCH ELEMENTARY SCHOOL (Students: 681, Location: 5959 COMMERCE RD, Grades: 2-5)
- KEITH ELEMENTARY SCHOOL (Students: 589, Location: 2800 KEITH RD, Grades: KG-5)
- DOHERTY ELEMENTARY SCHOOL (Students: 486, Location: 3575 WALNUT LAKE RD, Grades: PK-5)
- PLEASANT LAKE ELEMENTARY SCHOOL (Students: 468, Location: 4900 HALSTED RD, Grades: KG-5)
- SHEIKO ELEMENTARY SCHOOL (Students: 456, Location: 4500 WALNUT LAKE RD, Grades: PK-5)
- WEST HILLS MIDDLE SCHOOL (Students: 393, Location: 2601 LONE PINE RD, Grades: 3-8)
- GRETCHKO ELEMENTARY SCHOOL (Students: 372, Location: 5300 GREER RD, Grades: PK-1)
- LONE PINE ELEMENTARY SCHOOL (Students: 313, Location: 3100 LONE PINE RD, Grades: PK-5)
Private elementary/middle school in Bloomfield Township:
Points of interest:
Notable locations in Bloomfield Township: Forest Lake Golf Course (A), Birmingham Golf Club (B), Oakland Hills Country Club (C), Township of Bloomfield City Offices (D), Bloomfield Township Fire Department Station 2 (E), Bloomfield Township Fire Department Station 3 (F), Bloomfield Township Fire Department Station 4 (G), Bloomfield Township Fire Department Station 5 (H), Bloomfield Township Fire Department Station 1 (I), El Johnson Nature Center (J), Bloomfield Township Hall (K), Bloomfield Township Public Library (L), Oakland County District Courthouse (M), Bloomfield Township Fire Department (N). Display/hide their locations on the map
Shopping Centers: Burlington Bloomfield Plaza Shopping Center (1), Bloomfield Village Square Shopping Center (2), Bloomfield Town Square Shopping Center (3), Bloomfield Plaza Shopping Center (4), Bloomfield Hills Plaza Shopping Center (5), Village Knoll Shopping Center (6). Display/hide their locations on the map
Churches in Bloomfield Township include: Incarnate Word Church (A), Nativity Episcopal Church (B), Pilgrim Congregational Church of Birmingham (C), Saint George Hellenic Orthodox Church (D), Saint Andrew Church (E), Saint Owens Church (F), Saint Regis Church (G), Beautiful Savior Church (H), Franklin Road Church of Christ (I). Display/hide their locations on the map
Cemetery: Kirk in the Hills Columbarium (1). Display/hide its location on the map
Lakes: Turtle Lake (A), Lower Long Lake (B), Upper Long Lake (C), Wabeek Lake (D), Orange Lake (E), Kirkwood Lake (F), Wing Lake (G), Island Lake (H). Display/hide their locations on the map
Parks in Bloomfield Township include: Congregation Beth El Historical Marker (1), Temple Beth El Historical Marker (2). Display/hide their locations on the map
Birthplace of: John Coyle (speed skater) - Short-track speed skater.
| This place: | 2.5 people |
| Michigan: | 2.6 people |
| This place: | 75.6% |
| Whole state: | 68.5% |
| This place: | 2.0% |
| Whole state: | 5.3% |
Likely homosexual households (counted as self-reported same-sex unmarried-partner households)
- Lesbian couples: 0.1% of all households
- Gay men: 0.3% of all households
| This place: | 2.5% |
| Whole state: | 10.5% |
| This place: | 1.3% |
| Whole state: | 4.8% |
People in group quarters in Bloomfield Township in 2000:
- 227 people in nursing homes
- 136 people in other noninstitutional group quarters
- 34 people in homes for the mentally retarded
- 22 people in other group homes
- 10 people in other nonhousehold living situations
- 7 people in religious group quarters
- 2 people in homes for the mentally ill
Banks with branches in Bloomfield Township (2011 data):
- The Huntington National Bank: Bloomfield Township Branch at 3681 West Maple Road, branch established on 1964/12/09. Info updated 2012/04/02: Bank assets: $54,183.4 mil, Deposits: $44,300.3 mil, headquarters in Columbus, OH, positive income, Commercial Lending Specialization, 878 total offices, Holding Company: Huntington Bancshares Incorporated
- RBS Citizens, National Association: Woodward-Square Lake Branch at 42869 Woodward Avenue, branch established on 2005/01/13. Info updated 2007/09/19: Bank assets: $106,940.6 mil, Deposits: $75,690.2 mil, headquarters in Providence, RI, positive income, 1135 total offices, Holding Company: Uk Financial Investments Limited
For population 15 years and over in Bloomfield Township:
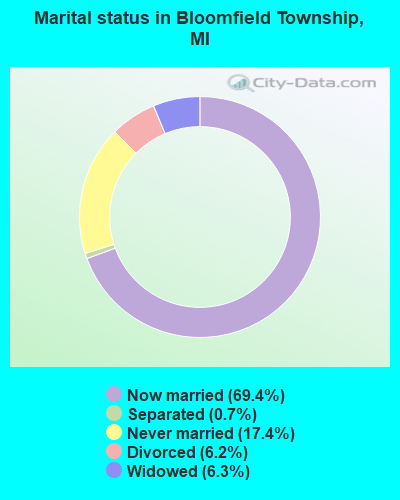
- Never married: 17.4%
- Now married: 69.4%
- Separated: 0.7%
- Widowed: 6.3%
- Divorced: 6.2%
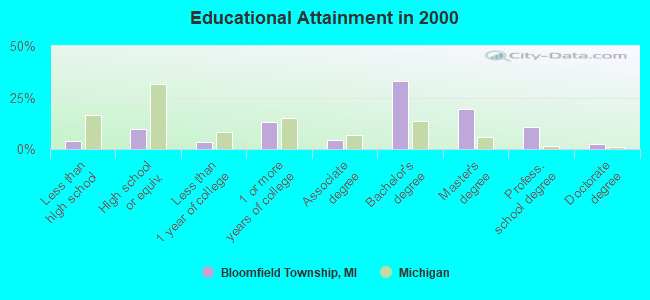
For population 25 years and over in Bloomfield Township:
- High school or higher: 96.2%
- Bachelor's degree or higher: 65.8%
- Graduate or professional degree: 32.8%
- Unemployed: 3.4%
- Mean travel time to work (commute): 24.9 minutes
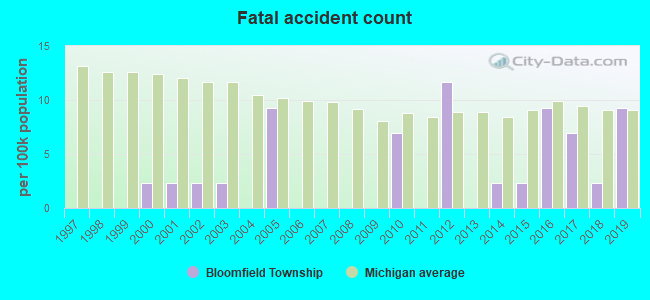
| Here: | 9.6 |
| Michigan average: | 11.3 |
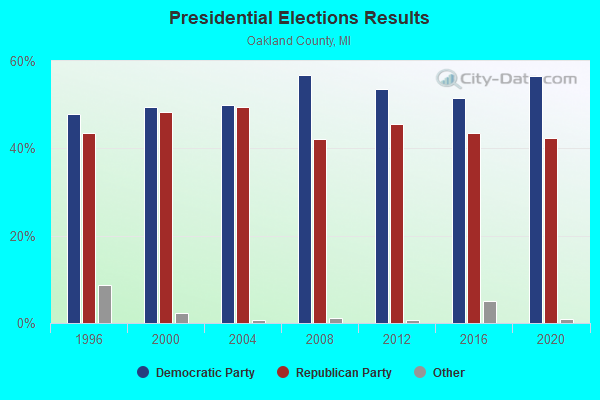
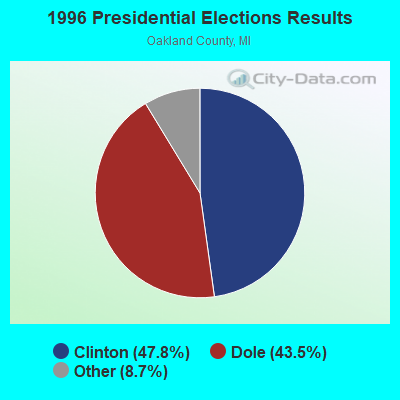
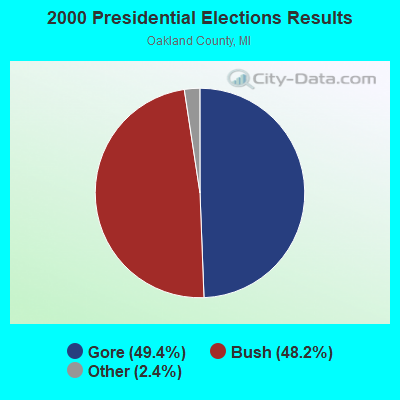
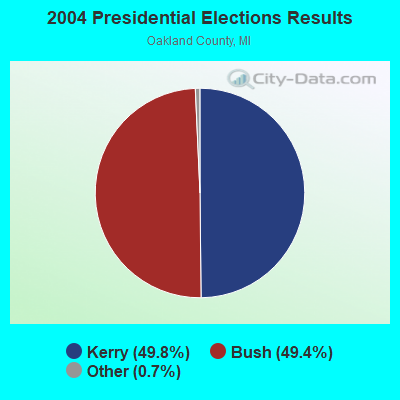
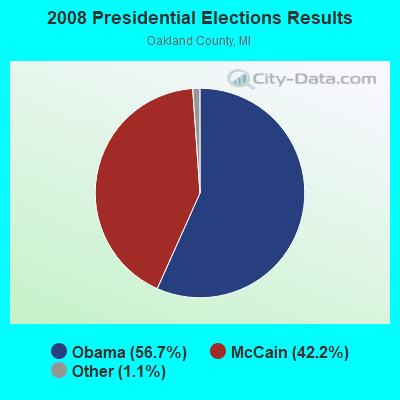
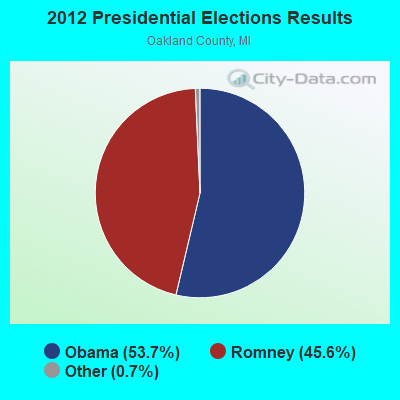
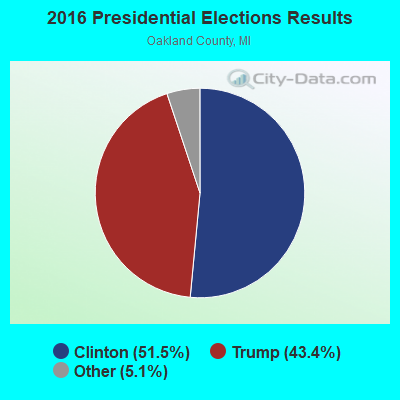
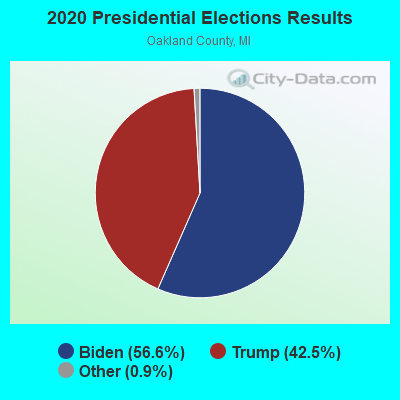
Graphs represent county-level data. Detailed 2008 Election Results
Political contributions by individuals in Bloomfield Township, MI
Religion statistics for Bloomfield Township, MI (based on Oakland County data)
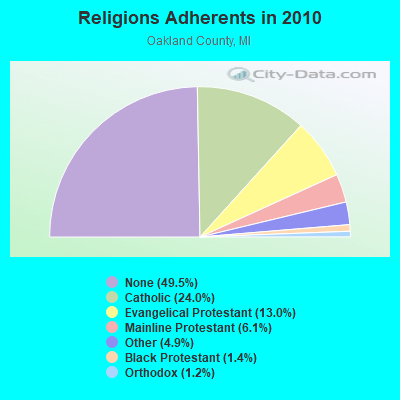
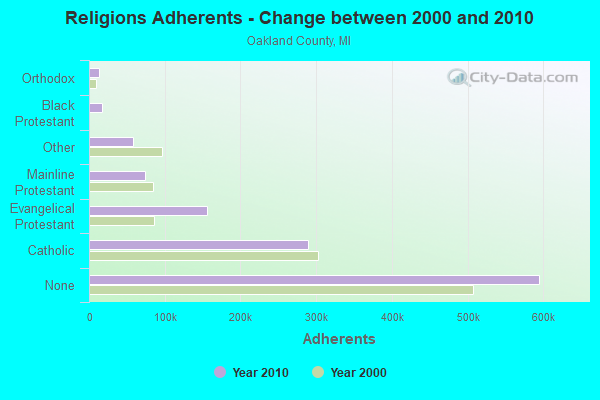
| Religion | Adherents | Congregations |
|---|---|---|
| Catholic | 289,116 | 64 |
| Evangelical Protestant | 155,826 | 319 |
| Mainline Protestant | 73,373 | 159 |
| Other | 58,590 | 117 |
| Black Protestant | 16,826 | 35 |
| Orthodox | 13,844 | 23 |
| None | 594,787 | - |
Food Environment Statistics:
| This county: | 2.44 / 10,000 pop. |
| State: | 2.34 / 10,000 pop. |
| Here: | 0.18 / 10,000 pop. |
| State: | 0.18 / 10,000 pop. |
| Oakland County: | 1.35 / 10,000 pop. |
| Michigan: | 1.52 / 10,000 pop. |
| This county: | 2.43 / 10,000 pop. |
| State: | 2.99 / 10,000 pop. |
| Here: | 8.18 / 10,000 pop. |
| Michigan: | 6.80 / 10,000 pop. |
| Here: | 8.8% |
| State: | 9.7% |
| Oakland County: | 25.6% |
| Michigan: | 29.7% |
| Oakland County: | 13.0% |
| State: | 13.4% |
5.91% of this county's 2021 resident taxpayers lived in other counties in 2020 ($79,655 average adjusted gross income)
| Here: | 5.91% |
| Michigan average: | 5.83% |
0.01% of residents moved from foreign countries ($78 average AGI)
Oakland County: 0.01% Michigan average: 0.00%
Top counties from which taxpayers relocated into this county between 2020 and 2021:
| from Wayne County, MI | |
| from Macomb County, MI | |
| from Genesee County, MI |
6.21% of this county's 2020 resident taxpayers moved to other counties in 2021 ($89,748 average adjusted gross income)
| Here: | 6.21% |
| Michigan average: | 5.95% |
0.01% of residents moved to foreign countries ($55 average AGI)
Oakland County: 0.01% Michigan average: 0.00%
Top counties to which taxpayers relocated from this county between 2020 and 2021:
| to Wayne County, MI | |
| to Macomb County, MI | |
| to Genesee County, MI |
| Businesses in Bloomfield Township, MI | ||||
| Name | Count | Name | Count | |
|---|---|---|---|---|
| CVS | 1 | Nike | 2 | |
| Jimmy John's | 1 | Starbucks | 1 | |
| Little Caesars Pizza | 1 | |||
Strongest AM radio stations in Bloomfield Township:
- WXYT (1270 AM; 50 kW; DETROIT, MI; Owner: INFINITY BROADCASTING CORP. OF DETROIT)
- WWJ (950 AM; 50 kW; DETROIT, MI; Owner: INFINITY BROADCASTING OPERATIONS, INC.)
- WJR (760 AM; 50 kW; DETROIT, MI; Owner: ABC, INC.)
- WCHB (1200 AM; 50 kW; TAYLOR, MI; Owner: RADIO ONE OF DETROIT, LLC)
- WDFN (1130 AM; 50 kW; DETROIT, MI; Owner: AMFM RADIO LICENSES, L.L.C.)
- WFDF (910 AM; 50 kW; FLINT, MI; Owner: ABC, INC.)
- WOAP (1080 AM; 50 kW; OWOSSO, MI)
- WUFL (1030 AM; daytime; 5 kW; STERLING HEIGHTS, MI; Owner: FAMILY LIFE BROADCASTING SYSTEM)
- WDEO (990 AM; 9 kW; YPSILANTI, MI; Owner: WORD BROADCASTERS, INC.)
- WXDX (1310 AM; 5 kW; DEARBORN, MI; Owner: AMFM RADIO LICENSES, L.L.C.)
- WTKA (1050 AM; 10 kW; ANN ARBOR, MI; Owner: CAPSTAR TX LIMITED PARTNERSHIP)
- WEXL (1340 AM; 1 kW; ROYAL OAK, MI; Owner: WMUZ RADIO, INC.)
- WPON (1460 AM; 1 kW; WALLED LAKE, MI; Owner: FOREIGN RADIO PROGRAMS, INC.)
Strongest FM radio stations in Bloomfield Township:
- WBFH (88.1 FM; BLOOMFIELD HILLS, MI; Owner: BLOOMFIELD HILLS SCHOOL DISTRICT)
- WRIF (101.1 FM; DETROIT, MI; Owner: GREATER BOSTON RADIO, INC.)
- WKRK-FM (97.1 FM; DETROIT, MI; Owner: INFINITY BROADCASTING OPERATIONS, INC.)
- WYCD (99.5 FM; DETROIT, MI; Owner: INFINITY BROADCASTING CORPORATION OF MICHIGAN)
- WDTJ (105.9 FM; DETROIT, MI; Owner: RADIO ONE OF DETROIT, LLC)
- WMGC-FM (105.1 FM; DETROIT, MI; Owner: GREATER BOSTON RADIO, INC.)
- WCSX (94.7 FM; BIRMINGHAM, MI; Owner: GREATER BOSTON RADIO, INC.)
- WDRQ (93.1 FM; DETROIT, MI; Owner: ABC, INC.)
- WDVD (96.3 FM; DETROIT, MI; Owner: ABC, INC.)
- WKQI (95.5 FM; DETROIT, MI; Owner: AMFM RADIO LICENSES, L.L.C.)
- WAHS (89.5 FM; AUBURN HEIGHTS, MI; Owner: AVONDALE SCHOOL DISTRICT)
- WNIC (100.3 FM; DEARBORN, MI; Owner: AMFM RADIO LICENSES, L.L.C.)
- WOMC (104.3 FM; DETROIT, MI; Owner: INFINITY BROADCASTING CORPORATION OF MICHIGAN)
- WJLB (97.9 FM; DETROIT, MI; Owner: AMFM RADIO LICENSES, L.L.C.)
- WMUZ (103.5 FM; DETROIT, MI; Owner: WMUZ RADIO, INC.)
- WVMV (98.7 FM; DETROIT, MI; Owner: INFINITY BROADCASTING OPERATIONS, INC.)
- WMXD (92.3 FM; DETROIT, MI; Owner: AMFM RADIO LICENSES, L.L.C.)
- WDTR-FM (90.9 FM; DETROIT, MI; Owner: BOARD OF EDUCATION, CITY OF DETROIT)
- WDTW (106.7 FM; DETROIT, MI; Owner: AMFM RADIO LICENSES, L.L.C.)
- WXOU (88.3 FM; AUBURN HILLS, MI; Owner: OAKLAND UNIVERSITY)
TV broadcast stations around Bloomfield Township:
- WXYZ-TV (Channel 7; DETROIT, MI; Owner: CHANNEL 7 OF DETROIT, INC.)
- WKBD (Channel 50; DETROIT, MI; Owner: VIACOM STATIONS GROUP OF DETROIT INC.)
- WJBK (Channel 2; DETROIT, MI; Owner: FOX TELEVISION STATIONS, INC.)
- WDIV-TV (Channel 4; DETROIT, MI; Owner: POST-NEWSWEEK STATIONS, MICHIGAN, INC.)
- WWJ-TV (Channel 62; DETROIT, MI; Owner: CBS BROADCASTING INC.)
- WDWB (Channel 20; DETROIT, MI; Owner: WXON LICENSE, INC.)
- WTVS (Channel 56; DETROIT, MI; Owner: DETROIT EDUC. TV FOUNDATION)
- WBXD-CA (Channel 5; DETROIT, MI; Owner: THE BOX WORLDWIDE LLC)
- WFUM (Channel 28; FLINT, MI; Owner: UNIVERSITY OF MICHIGAN)
- WADL (Channel 38; MOUNT CLEMENS, MI; Owner: ADELL BROADCASTING CORPORATION)
- W33BY (Channel 68; DETROIT, MI; Owner: HIGHLAND PARK BROADCASTING, L.P.)
- WLPC-LP (Channel 26; DETROIT, MI; Owner: GLENN R. AND KARIN A. PLUMMER)
- WEYI-TV (Channel 25; SAGINAW, MI; Owner: WEYI BROADCASTING, LLC)
- WDWO-CA (Channel 18; DETROIT, MI; Owner: TCT OF MICHIGAN, INC.)
- WPXD (Channel 31; ANN ARBOR, MI; Owner: PAXSON COMMUNICATIONS LICENSE COMPANY, LLC)
- W48AV (Channel 48; DETROIT, MI; Owner: PAXSON COMMUNICATIONS LICENSE COMPANY, LLC)
- National Bridge Inventory (NBI) Statistics
- 18Number of bridges
- 151ft / 45.7mTotal length
- $277,000Total costs
- 419,373Total average daily traffic
- 21,393Total average daily truck traffic
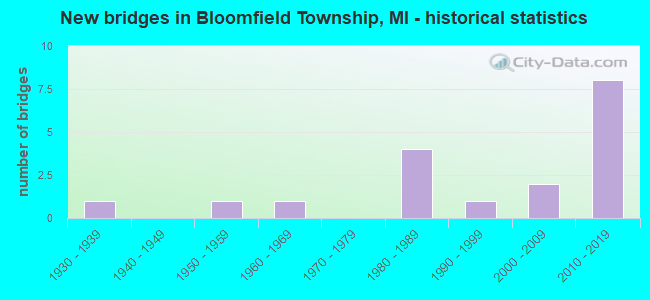
- New bridges - historical statistics
- 11930-1939
- 11950-1959
- 11960-1969
- 41980-1989
- 11990-1999
- 22000-2009
- 82010-2019
FCC Registered Amateur Radio Licenses:
2- Call Sign: WB2ADX, Previous Call Sign: KC2QDC, Licensee ID: L01187855, Grant Date: 03/08/2017, Expiration Date: 05/01/2027, Cancellation Date: 12/04/2020, Certifier: Joseph D Raznik, Registrant: Joseph D Raznik, 5166 Provincial Drive, Bloomfield Township, MI 48302
- Call Sign: WB8ADX, Previous Call Sign: WB2ADX, Licensee ID: L01187855, Grant Date: 12/04/2020, Expiration Date: 12/04/2030, Certifier: Joseph D Raznik, Registrant: Joseph D Raznik, 5166 Provincial Drive, Bloomfield Township, MI 48302
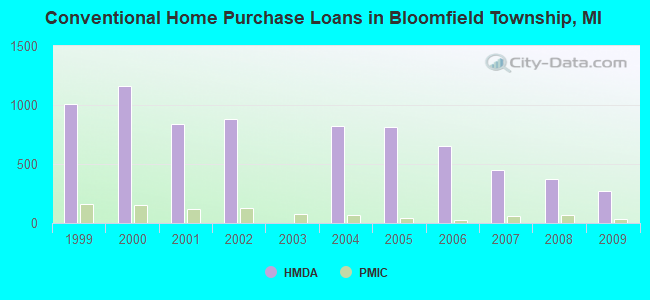
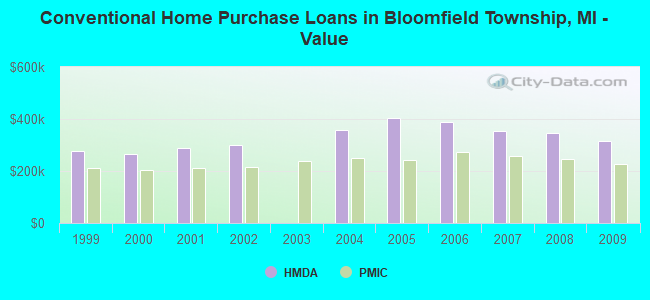
| Home Mortgage Disclosure Act Aggregated Statistics For Year 2009 (Based on 11 full and 1 partial tracts) | ||||||||||||
| A) FHA, FSA/RHS & VA Home Purchase Loans | B) Conventional Home Purchase Loans | C) Refinancings | D) Home Improvement Loans | F) Non-occupant Loans on < 5 Family Dwellings (A B C & D) | G) Loans On Manufactured Home Dwelling (A B C & D) | |||||||
|---|---|---|---|---|---|---|---|---|---|---|---|---|
| Number | Average Value | Number | Average Value | Number | Average Value | Number | Average Value | Number | Average Value | Number | Average Value | |
| LOANS ORIGINATED | 122 | $189,619 | 267 | $316,354 | 1,142 | $293,806 | 27 | $111,014 | 37 | $226,963 | 0 | $0 |
| APPLICATIONS APPROVED, NOT ACCEPTED | 15 | $162,017 | 24 | $414,864 | 147 | $345,093 | 2 | $73,000 | 9 | $246,604 | 0 | $0 |
| APPLICATIONS DENIED | 21 | $197,033 | 58 | $350,687 | 432 | $359,213 | 16 | $132,261 | 31 | $188,129 | 1 | $43,000 |
| APPLICATIONS WITHDRAWN | 19 | $173,722 | 42 | $270,518 | 169 | $292,322 | 2 | $86,000 | 9 | $237,889 | 0 | $0 |
| FILES CLOSED FOR INCOMPLETENESS | 4 | $156,250 | 14 | $373,964 | 75 | $298,850 | 0 | $0 | 1 | $163,000 | 0 | $0 |
Detailed mortgage data for all 12 tracts in Bloomfield Township, MI
| Private Mortgage Insurance Companies Aggregated Statistics For Year 2009 (Based on 11 full and 1 partial tracts) | ||||
| A) Conventional Home Purchase Loans | B) Refinancings | |||
|---|---|---|---|---|
| Number | Average Value | Number | Average Value | |
| LOANS ORIGINATED | 35 | $225,021 | 11 | $310,985 |
| APPLICATIONS APPROVED, NOT ACCEPTED | 10 | $294,100 | 9 | $254,254 |
| APPLICATIONS DENIED | 15 | $308,133 | 13 | $325,148 |
| APPLICATIONS WITHDRAWN | 3 | $367,783 | 5 | $342,400 |
| FILES CLOSED FOR INCOMPLETENESS | 4 | $310,102 | 0 | $0 |
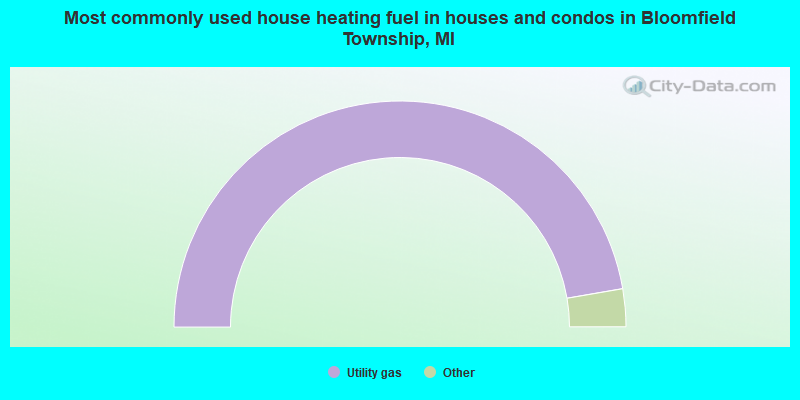
- 94.6%Utility gas
- 4.0%Electricity
- 0.7%Fuel oil, kerosene, etc.
- 0.4%Bottled, tank, or LP gas
- 0.3%Other fuel
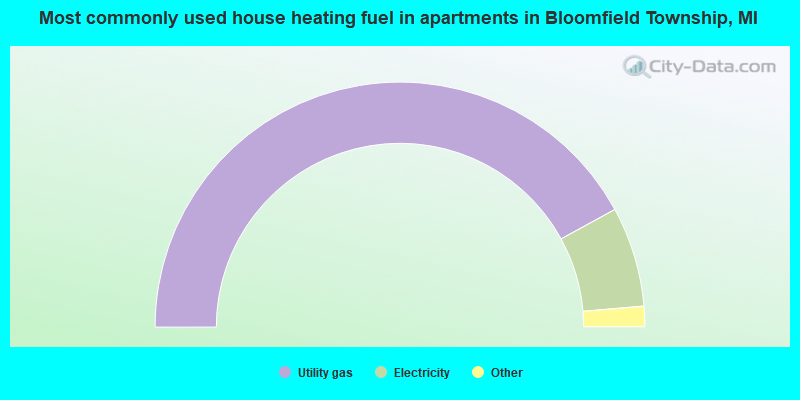
- 84.1%Utility gas
- 13.2%Electricity
- 1.4%Bottled, tank, or LP gas
- 0.4%Fuel oil, kerosene, etc.
- 0.4%Other fuel
- 0.4%No fuel used
Bloomfield Township compared to Michigan state average:
- Median household income significantly above state average.
- Median house value significantly above state average.
- Unemployed percentage significantly below state average.
- Black race population percentage significantly below state average.
- Hispanic race population percentage significantly below state average.
- Median age above state average.
- Foreign-born population percentage above state average.
- Renting percentage significantly below state average.
- Length of stay since moving in significantly above state average.
- Number of rooms per house significantly below state average.
- House age significantly below state average.
- Institutionalized population percentage significantly above state average.
- Percentage of population with a bachelor's degree or higher significantly above state average.
Bloomfield Township on our top lists:
- #5 on the list of "Top 101 cities with largest percentage of males in occupations: physicians and surgeons (population 5,000+)"
- #11 on the list of "Top 101 cities with largest percentage of males in occupations: lawyers (population 5,000+)"
- #11 on the list of "Top 101 cities with largest percentage of males in industries: transportation equipment (population 5,000+)"
- #12 on the list of "Top 101 cities with largest percentage of females in occupations: physicians and surgeons (population 5,000+)"
- #16 on the list of "Top 101 cities with largest percentage of females in industries: transportation equipment (population 5,000+)"
- #17 on the list of "Top 101 cities with largest percentage of females in occupations: lawyers (population 5,000+)"
- #18 on the list of "Top 101 cities with largest percentage of males in industries: health care (population 5,000+)"
- #20 on the list of "Top 101 cities with largest percentage of males in occupations: sales representatives, services, wholesale and manufacturing (population 5,000+)"
- #21 on the list of "Top 101 cities with largest percentage of females in occupations: top executives (population 5,000+)"
- #24 on the list of "Top 101 cities with the largest percentage of elementary and middle school students in private schools (5,000+ students)"
- #26 on the list of "Top 101 cities with the largest racial income disparity between any two races with at least 200 householders"
- #67 on the list of "Top 101 cities with largest percentage of males in industries: sewing, needlework, and piece goods stores (population 5,000+)"
- #71 on the list of "Top 101 cities with largest percentage of females in industries: furniture and home furnishings, and household appliance stores (population 5,000+)"
- #82 on the list of "Top 101 cities with largest percentage of males in industries: miscellaneous durable goods merchant wholesalers (population 5,000+)"
- #95 on the list of "Top 101 cities with largest percentage of females in industries: petroleum and coal products (population 5,000+)"
- #6 on the list of "Top 101 counties with the highest percentage of residents that visited a dentist within the past year"
- #12 on the list of "Top 101 counties with the most Orthodox congregations"
- #14 on the list of "Top 101 counties with the most Orthodox adherents"
- #38 on the list of "Top 101 counties with the most Mainline Protestant adherents"
- #39 on the list of "Top 101 counties with the most Catholic adherents"

|
|
Total of 105 patent applications in 2008-2024.