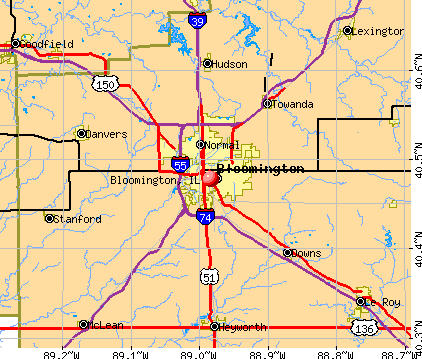
Bloomington, Illinois

Bloomington: David Davis Mansion
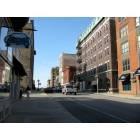
Bloomington: Historic City Center

Bloomington: South Hill Neighborhood October 2006

Bloomington: County Courthouse
Bloomington
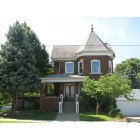
Bloomington: Paul Moratz Queen Ann Brick 1896 Bloomington Illinois
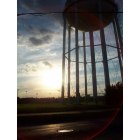
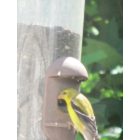
Bloomington: Water tower off Main Street by ISU stadium.
Bloomington: Bloomington VOR

Bloomington: White Oak Park in Bloomington

Bloomington: The newly renovated Bloomington Public Library
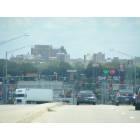
Bloomington: Downtown Bloomington IL
- see
17
more - add
your
Submit your own pictures of this city and show them to the world
- OSM Map
- General Map
- Google Map
- MSN Map
Population change since 2000: +21.7%
 |
| Males: 38,351 | |
| Females: 40,513 |
| Median resident age: | 37.8 years |
| Illinois median age: | 39.1 years |
Zip codes: 61701, 61704, 61705, 61761.
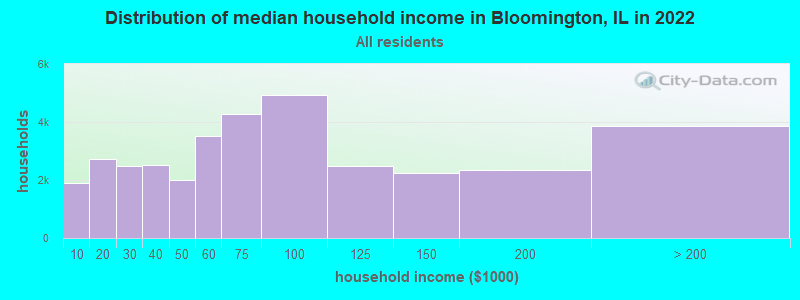
Bloomington Zip Code Map| Bloomington: | $67,592 |
| IL: | $76,708 |
Estimated per capita income in 2022: $45,235 (it was $24,751 in 2000)
Bloomington city income, earnings, and wages data
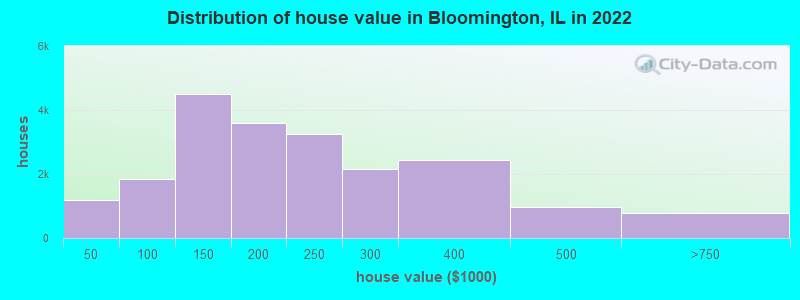
Estimated median house or condo value in 2022: $185,300 (it was $108,200 in 2000)
| Bloomington: | $185,300 |
| IL: | $251,600 |
Mean prices in 2022: all housing units: $239,213; detached houses: $255,847; townhouses or other attached units: $217,347; in 2-unit structures: $141,796; in 3-to-4-unit structures: $110,808; in 5-or-more-unit structures: $164,605; mobile homes: $77,465
Median gross rent in 2022: $965.
(7.5% for White Non-Hispanic residents, 33.8% for Black residents, 15.7% for Hispanic or Latino residents, 7.4% for other race residents, 14.8% for two or more races residents)
Detailed information about poverty and poor residents in Bloomington, IL


Compare current foreclosures in Bloomington, IL:
| Photo | Address | Area | Beds / Baths | Price | Details |
|---|---|---|---|---|---|

|
#1
S Prairie St
Bloomington, IL 61701
|
1,544 sq. feet
|
1 baths 3 beds |
show details | |

|
#2
Rowe Dr
Bloomington, IL 61701
|
1,188 sq. feet
|
3 baths 3 beds |
show details | |

|
#3
W Oakland Ave
Bloomington, IL 61701
|
924 sq. feet
|
1 baths 2 beds |
show details | |

|
#4
S East St
Bloomington, IL 61701
|
1,868 sq. feet
|
2 baths 3 beds |
show details | |

|
#5
W Locust St
Bloomington, IL 61701
|
- sq. feet
|
1 baths 2 beds |
show details | |

|
#6
E Washington St
Bloomington, IL 61704
|
1,215 sq. feet
|
2 baths 4 beds |
show details | |

|
#7
Currie Ct
Bloomington, IL 61704
|
3,177 sq. feet
|
3 baths - beds |
show details | |

|
#8
Surrey Cir
Bloomington, IL 61705
|
2,029 sq. feet
|
1 baths - beds |
show details | |

|
#9
Eucalyptus St
Bloomington, IL 61705
|
- sq. feet
|
- baths - beds |
show details | |

|
#10
Melissa Dr
Bloomington, IL 61704
|
- sq. feet
|
- baths - beds |
show details |
| Photo | Address | Area | Beds / Baths | Price | Details |
|---|---|---|---|---|---|

|
#11
Glenbridge Rd
Bloomington, IL 61704
|
- sq. feet
|
- baths - beds |
show details | |

|
#12
E Jefferson St # 8
Bloomington, IL 61701
|
- sq. feet
|
- baths - beds |
show details | |

|
#13
De Ville Dr # 375
Bloomington, IL 61704
|
- sq. feet
|
- baths - beds |
show details | |

|
#14
21st St
Bloomington, IL 61704
|
- sq. feet
|
- baths - beds |
show details | |

|
#15
Yucca Dr
Bloomington, IL 61705
|
- sq. feet
|
- baths - beds |
show details | |

|
#16
Rhodes Ln
Bloomington, IL 61704
|
- sq. feet
|
- baths - beds |
show details | |

|
#17
Rhodes Ln
Bloomington, IL 61704
|
- sq. feet
|
- baths - beds |
show details | |

|
#18
Parkland Dr
Bloomington, IL 61704
|
- sq. feet
|
- baths - beds |
show details | |

|
#19
E Jefferson St Apt 5
Bloomington, IL 61701
|
- sq. feet
|
- baths - beds |
show details | |

|
#20
Orchard Rd Apt 3
Bloomington, IL 61704
|
- sq. feet
|
- baths - beds |
show details |
| Photo | Address | Area | Beds / Baths | Price | Details |
|---|---|---|---|---|---|

|
#21
Arcadia Dr
Bloomington, IL 61704
|
- sq. feet
|
- baths - beds |
show details | |

|
#22
Arcadia Dr
Bloomington, IL 61704
|
- sq. feet
|
- baths - beds |
show details | |

|
#23
Hall Ct
Bloomington, IL 61704
|
- sq. feet
|
- baths - beds |
show details | |

|
#24
Valley View Cir
Bloomington, IL 61705
|
- sq. feet
|
- baths - beds |
show details | |

|
#25
Del Vista Dr
Bloomington, IL 61704
|
- sq. feet
|
- baths - beds |
show details | |

|
#26
Willard Ave
Bloomington, IL 61701
|
- sq. feet
|
- baths - beds |
show details | |

|
#27
Avenue F
Bloomington, IL 61704
|
- sq. feet
|
- baths - beds |
show details | |

|
#28
Bobolink Way Apt 2
Bloomington, IL 61704
|
- sq. feet
|
- baths - beds |
show details | |

|
#29
Pine Cone Ct Apt 173
Bloomington, IL 61704
|
- sq. feet
|
- baths - beds |
show details | |

|
#30
E Washington St Ste 308
Bloomington, IL 61701
|
- sq. feet
|
- baths - beds |
show details |
| Photo | Address | Area | Beds / Baths | Price | Details |
|---|---|---|---|---|---|

|
#31
Rainbow Ave
Bloomington, IL 61704
|
- sq. feet
|
- baths - beds |
show details | |

|
#32
Pier Way Apt 2
Bloomington, IL 61704
|
- sq. feet
|
- baths - beds |
show details | |

|
#33
Warbler Way # 8
Bloomington, IL 61704
|
- sq. feet
|
- baths - beds |
show details | |

|
#34
N Western Ave
Bloomington, IL 61701
|
- sq. feet
|
- baths - beds |
show details | |

|
#35
Blackberry Dr
Bloomington, IL 61705
|
- sq. feet
|
- baths - beds |
show details | |

|
#36
Tralee Ct
Bloomington, IL 61704
|
- sq. feet
|
- baths - beds |
show details | |

|
#37
23rd St
Bloomington, IL 61704
|
- sq. feet
|
- baths - beds |
show details | |

|
#38
S Roosevelt Ave Apt 403
Bloomington, IL 61701
|
- sq. feet
|
- baths - beds |
show details | |

|
#39
Sassafras St
Bloomington, IL 61705
|
- sq. feet
|
- baths - beds |
show details | |

|
#40
Pepper Pl Apt 1
Bloomington, IL 61705
|
- sq. feet
|
- baths - beds |
show details |
| Photo | Address | Area | Beds / Baths | Price | Details |
|---|---|---|---|---|---|

|
#41
Dennis Dr
Bloomington, IL 61701
|
- sq. feet
|
- baths - beds |
show details | |

|
#42
Yotzonot Dr Apt 303
Bloomington, IL 61704
|
- sq. feet
|
- baths - beds |
show details | |

|
#43
Springfield Rd Apt 1
Bloomington, IL 61701
|
- sq. feet
|
- baths - beds |
show details | |

|
#44
24th St # 166
Bloomington, IL 61704
|
- sq. feet
|
- baths - beds |
show details | |

|
#45
Valley View Cir
Bloomington, IL 61705
|
- sq. feet
|
- baths - beds |
show details | |

|
#46
Longfield Rd
Bloomington, IL 61705
|
- sq. feet
|
- baths - beds |
show details | |

|
#47
W Grove St
Bloomington, IL 61701
|
- sq. feet
|
- baths - beds |
show details | |

|
#48
Andy Ct Apt 4
Bloomington, IL 61704
|
- sq. feet
|
- baths - beds |
show details | |

|
#49
Fuller Ct
Bloomington, IL 61705
|
- sq. feet
|
- baths - beds |
show details | |

|
Check over 1 million property listings on Foreclosure.com!
|
browse all offers | |||


- 55,16269.9%White alone
- 8,15610.3%Black alone
- 5,4847.0%Hispanic
- 4,9816.3%Asian alone
- 4,7606.0%Two or more races
- 1490.2%American Indian alone
- 1820.2%Other race alone
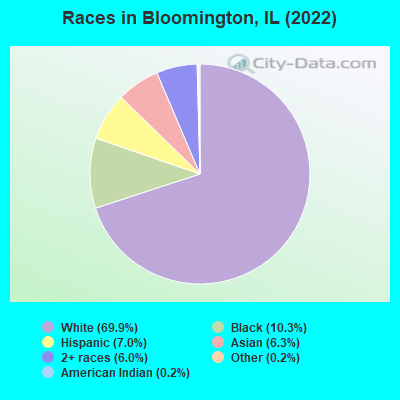
Races in Bloomington detailed stats: ancestries, foreign born residents, place of birth
According to our research of Illinois and other state lists, there were 179 registered sex offenders living in Bloomington, Illinois as of April 27, 2024.
The ratio of all residents to sex offenders in Bloomington is 436 to 1.
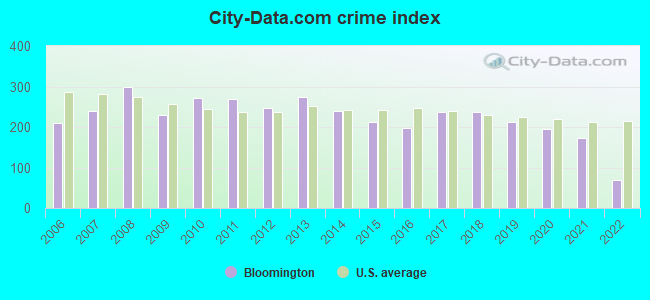
The City-Data.com crime index weighs serious crimes and violent crimes more heavily. Higher means more crime, U.S. average is 246.1. It adjusts for the number of visitors and daily workers commuting into cities.
- means the value is smaller than the state average.- means the value is about the same as the state average.
- means the value is bigger than the state average.
- means the value is much bigger than the state average.
Crime rate in Bloomington detailed stats: murders, rapes, robberies, assaults, burglaries, thefts, arson
Full-time law enforcement employees in 2019, including police officers: 157 (124 officers - 119 male; 5 female).
| Officers per 1,000 residents here: | 1.59 |
| Illinois average: | 3.06 |
 Recent articles from our blog. Our writers, many of them Ph.D. graduates or candidates, create easy-to-read articles on a wide variety of topics.

 | Bloomington, Lincoln, Clinton or Springfield good to move to? (13 replies) |
| HELP! Choosing where to live between Champaign, Bloomington, or Peoria?! (12 replies) |
| Thinking of moving to Illinois (77 replies) |
| Ottawa Vs. Bloomington: Real Estate Question (8 replies) |
| Moving to Bloomington-Normal (17 replies) |
| Moving to Bloomington-Normal 2019 (3 replies) |
Latest news from Bloomington, IL collected exclusively by city-data.com from local newspapers, TV, and radio stations
Ancestries: German (19.3%), Irish (13.9%), English (7.4%), American (5.0%), Italian (2.6%), European (2.2%).
Current Local Time: CST time zone
Incorporated on 04/29/1897
Elevation: 829 feet
Land area: 22.5 square miles.
Population density: 3,505 people per square mile (average).
7,995 residents are foreign born (6.9% Asia, 2.1% Latin America).
| This city: | 10.2% |
| Illinois: | 14.1% |
Median real estate property taxes paid for housing units with mortgages in 2022: $4,065 (2.2%)
Median real estate property taxes paid for housing units with no mortgage in 2022: $3,673 (1.9%)
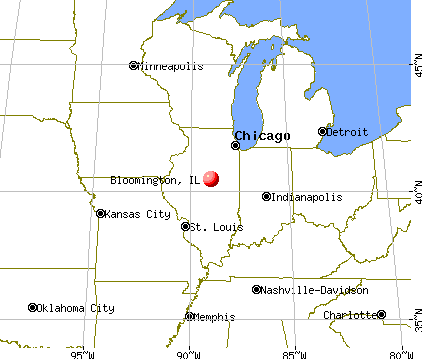
Nearest city with pop. 200,000+: Chicago, IL  (116.2 miles , pop. 2,896,016).
Nearest cities:
), ), Latitude: 40.48 N, Longitude: 88.98 W
Daytime population change due to commuting: +11,505 (+14.6%)
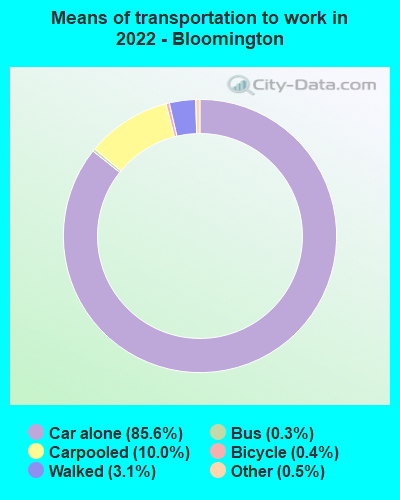
Workers who live and work in this city: 25,779 (66.1%)
Area code: 309
Bloomington tourist attractions:
Bloomington, Illinois accommodation & food services, waste management - Economy and Business Data
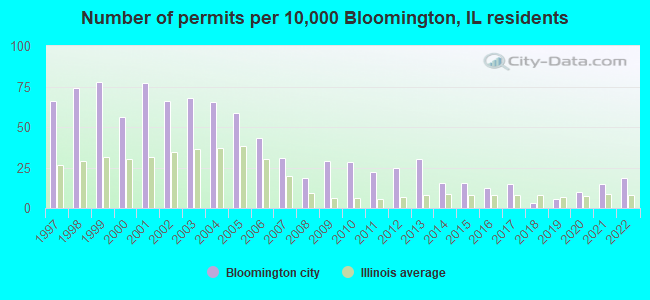
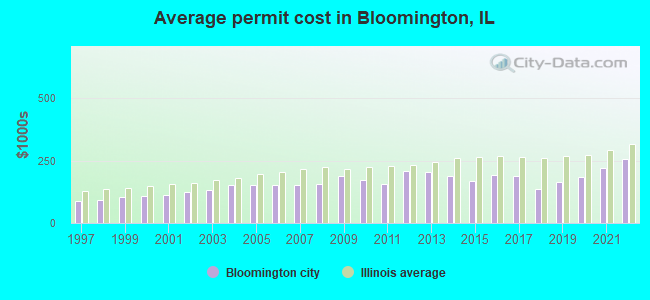
Single-family new house construction building permits:
- 2022: 118 buildings, average cost: $256,200
- 2021: 95 buildings, average cost: $220,000
- 2020: 63 buildings, average cost: $186,400
- 2019: 38 buildings, average cost: $164,000
- 2018: 22 buildings, average cost: $137,100
- 2017: 95 buildings, average cost: $187,300
- 2016: 82 buildings, average cost: $192,300
- 2015: 99 buildings, average cost: $168,600
- 2014: 102 buildings, average cost: $190,300
- 2013: 197 buildings, average cost: $203,000
- 2012: 160 buildings, average cost: $208,800
- 2011: 146 buildings, average cost: $157,100
- 2010: 184 buildings, average cost: $173,400
- 2009: 190 buildings, average cost: $188,400
- 2008: 120 buildings, average cost: $156,100
- 2007: 200 buildings, average cost: $151,800
- 2006: 279 buildings, average cost: $151,700
- 2005: 379 buildings, average cost: $152,100
- 2004: 425 buildings, average cost: $150,600
- 2003: 441 buildings, average cost: $131,300
- 2002: 429 buildings, average cost: $123,000
- 2001: 501 buildings, average cost: $113,100
- 2000: 363 buildings, average cost: $110,200
- 1999: 503 buildings, average cost: $104,500
- 1998: 479 buildings, average cost: $91,400
- 1997: 430 buildings, average cost: $87,700
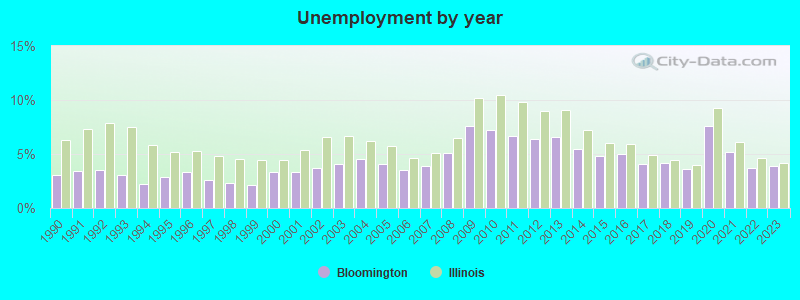
| Here: | 3.9% |
| Illinois: | 4.2% |
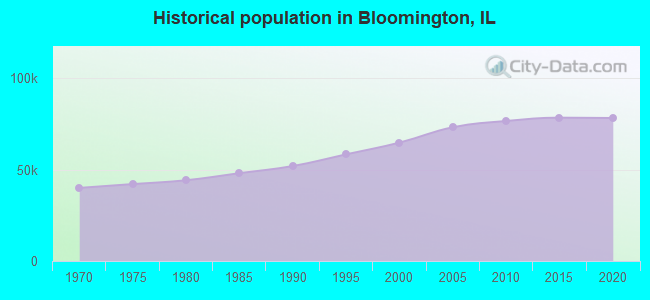
Population change in the 1990s: +11,970 (+22.7%).
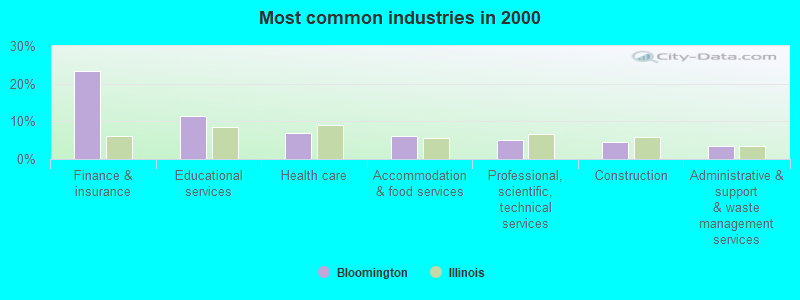
- Finance & insurance (23.3%)
- Educational services (11.5%)
- Health care (6.8%)
- Accommodation & food services (6.1%)
- Professional, scientific, technical services (4.9%)
- Construction (4.6%)
- Administrative & support & waste management services (3.6%)
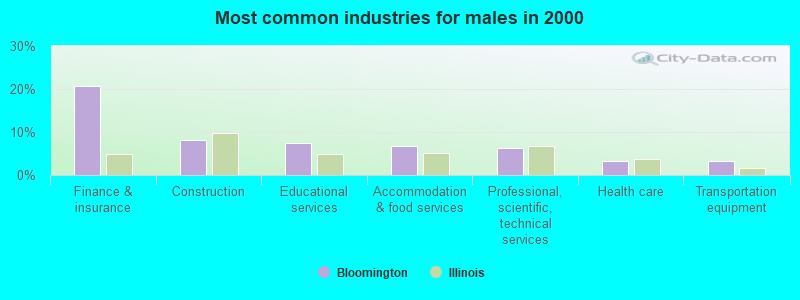
- Finance & insurance (20.8%)
- Construction (8.1%)
- Educational services (7.4%)
- Accommodation & food services (6.7%)
- Professional, scientific, technical services (6.2%)
- Health care (3.3%)
- Transportation equipment (3.3%)
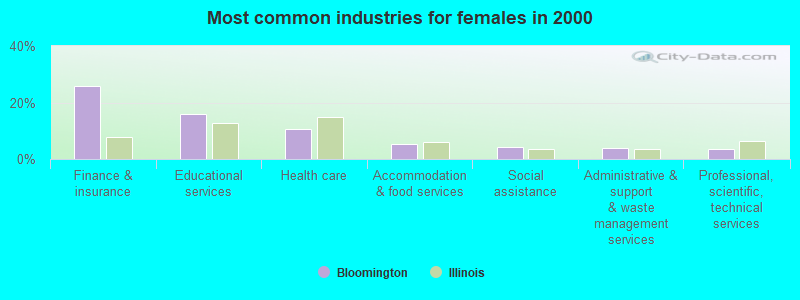
- Finance & insurance (26.0%)
- Educational services (15.9%)
- Health care (10.5%)
- Accommodation & food services (5.5%)
- Social assistance (4.3%)
- Administrative & support & waste management services (3.8%)
- Professional, scientific, technical services (3.5%)
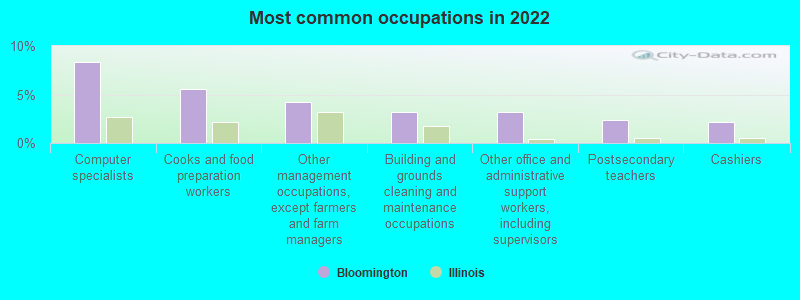
- Computer specialists (8.3%)
- Cooks and food preparation workers (5.6%)
- Other management occupations, except farmers and farm managers (4.3%)
- Building and grounds cleaning and maintenance occupations (3.2%)
- Other office and administrative support workers, including supervisors (3.2%)
- Postsecondary teachers (2.4%)
- Cashiers (2.2%)
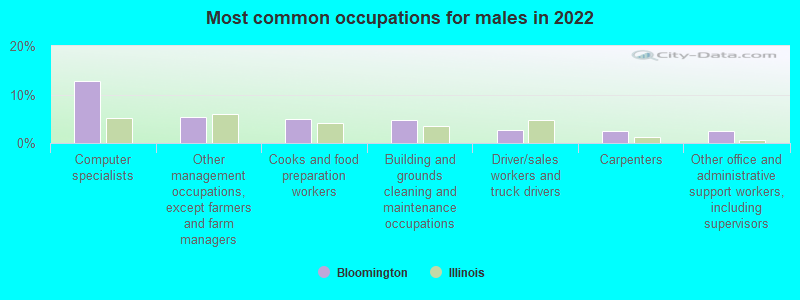
- Computer specialists (12.7%)
- Other management occupations, except farmers and farm managers (5.4%)
- Cooks and food preparation workers (4.9%)
- Building and grounds cleaning and maintenance occupations (4.7%)
- Driver/sales workers and truck drivers (2.8%)
- Carpenters (2.4%)
- Other office and administrative support workers, including supervisors (2.4%)
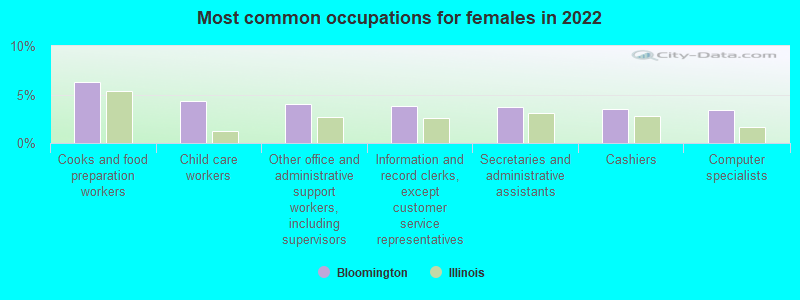
- Cooks and food preparation workers (6.3%)
- Child care workers (4.3%)
- Other office and administrative support workers, including supervisors (4.0%)
- Information and record clerks, except customer service representatives (3.8%)
- Secretaries and administrative assistants (3.7%)
- Cashiers (3.5%)
- Computer specialists (3.4%)
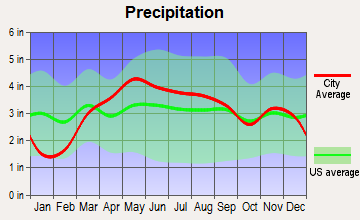
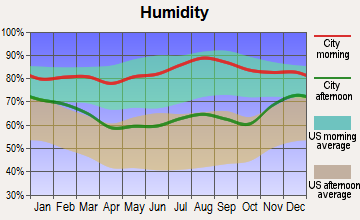
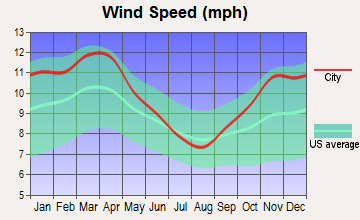
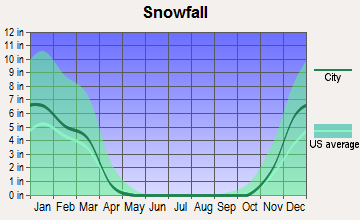
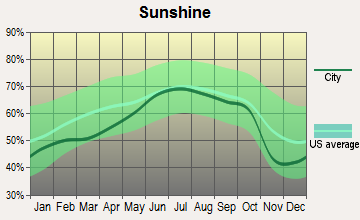
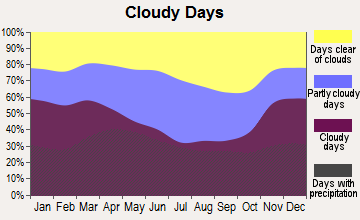
Average climate in Bloomington, Illinois
Based on data reported by over 4,000 weather stations

|
|

(lower is better)
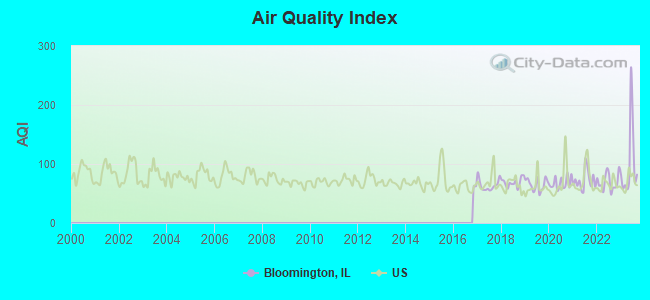
Air Quality Index (AQI) level in 2023 was 100. This is worse than average.
| City: | 100 |
| U.S.: | 73 |
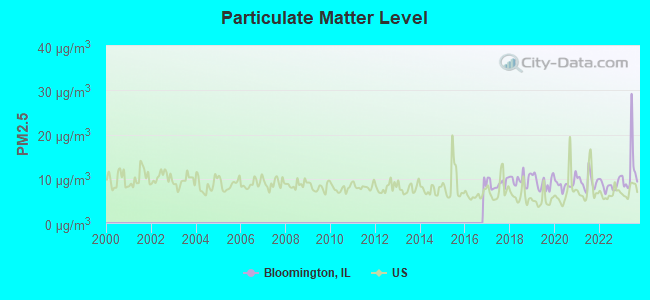
Particulate Matter (PM2.5) [µg/m3] level in 2023 was 11.9. This is significantly worse than average. Closest monitor was 2.7 miles away from the city center.
| City: | 11.9 |
| U.S.: | 8.1 |
Tornado activity:
Bloomington-area historical tornado activity is slightly above Illinois state average. It is 94% greater than the overall U.S. average.
On 5/5/1977, a category F4 (max. wind speeds 207-260 mph) tornado 12.5 miles away from the Bloomington city center injured 2 people and caused between $500,000 and $5,000,000 in damages.
On 7/13/2004, a category F4 tornado 23.1 miles away from the city center injured 3 people.
Earthquake activity:
Bloomington-area historical earthquake activity is significantly above Illinois state average. It is 121% greater than the overall U.S. average.On 4/18/2008 at 09:36:59, a magnitude 5.4 (5.1 MB, 4.8 MS, 5.4 MW, 5.2 MW, Class: Moderate, Intensity: VI - VII) earthquake occurred 151.9 miles away from Bloomington center
On 6/10/1987 at 23:48:54, a magnitude 5.1 (4.9 MB, 4.4 MS, 4.6 MS, 5.1 LG) earthquake occurred 128.6 miles away from Bloomington center
On 4/18/2008 at 09:36:59, a magnitude 5.2 (5.2 MW, Depth: 8.9 mi) earthquake occurred 151.9 miles away from Bloomington center
On 6/18/2002 at 17:37:15, a magnitude 5.0 (4.3 MB, 4.6 MW, 5.0 LG) earthquake occurred 183.9 miles away from the city center
On 4/18/2008 at 15:14:16, a magnitude 4.8 (4.5 MB, 4.8 MW, 4.6 MW, Class: Light, Intensity: IV - V) earthquake occurred 151.2 miles away from Bloomington center
On 4/3/1974 at 23:05:02, a magnitude 4.7 (4.5 MB, 4.7 LG) earthquake occurred 138.8 miles away from Bloomington center
Magnitude types: regional Lg-wave magnitude (LG), body-wave magnitude (MB), surface-wave magnitude (MS), moment magnitude (MW)
Natural disasters:
The number of natural disasters in McLean County (10) is smaller than the US average (15).Major Disasters (Presidential) Declared: 6
Emergencies Declared: 3
Causes of natural disasters: Storms: 4, Winter Storms: 3, Floods: 2, Tornadoes: 2, Hurricane: 1, Ice Storm: 1, Snow: 1, Snowstorm: 1, Other: 1 (Note: some incidents may be assigned to more than one category).
Main business address for: CITIZENS FIRST FINANCIAL CORP (SAVINGS INSTITUTION, FEDERALLY CHARTERED).
Hospitals and medical centers in Bloomington:
- EASTLAND MEDICAL PLAZA SURGICENTER (1505 EASTLAND DR)
- MENNONITE HOSPITAL (807 N MAIN ST)
- ST JOSEPH HOSPICE (2416 E WASHINGTON ST SUITE G)
- ST JOSEPH MEDICAL CENTER (Voluntary non-profit - Church, 2200 E WASHINGTON)
- ASTA CARE CENTER OF BLOOMINGTN (1509 NORTH CALHOUN STREET)
- BLOOMINGTON REHABILITATION AND HCC (1925 SOUTH MAIN STREET)
- HERITAGE HEALTH-BLOOMINGTON (700 EAST WALNUT)
- WESTMINSTER VILLAGE (2025 EAST LINCOLN STREET)
- FMC - CENTRAL IL. BLOOMINGTON PD (1404 EASTLAND DRIVE, UNIT 103)
- FMC - MCLEAN COUNTY (1505 EASTLAND MEDICAL PLAZA)
Airports and heliports located in Bloomington:
- Cottonwood Airport (IL57) (Runways: 1)
- Osf St Joseph Medical Center Heliport (IL40)
- Stark Heliport (IL14)
Amtrak station near Bloomington:
Colleges/Universities in Bloomington:
Other colleges/universities with over 2000 students near Bloomington:
- Illinois State University (about 3 miles; Normal, IL; Full-time enrollment: 18,804)
- Heartland Community College (about 5 miles; Normal, IL; FT enrollment: 3,958)
- Illinois Central College (about 33 miles; East Peoria, IL; FT enrollment: 7,158)
- Bradley University (about 37 miles; Peoria, IL; FT enrollment: 5,152)
- Richland Community College (about 42 miles; Decatur, IL; FT enrollment: 2,434)
- Parkland College (about 44 miles; Champaign, IL; FT enrollment: 7,326)
- Millikin University (about 44 miles; Decatur, IL; FT enrollment: 2,419)
Public high schools in Bloomington:
- BLOOMINGTON HIGH SCHOOL (Students: 1,550, Location: 1202 E LOCUST ST, Grades: 9-12)
- REGIONAL ALOP SCHOOL (Location: 408 W WASHINGTON ST, Grades: 9-12)
Private high school in Bloomington:
Biggest public elementary/middle schools in Bloomington:
- BLOOMINGTON JR HIGH SCHOOL (Students: 1,191, Location: 901 COLTON AVE, Grades: 6-8)
- NORTHPOINT ELEMENTARY SCHOOL (Students: 745, Location: 2602 E COLLEGE AVE, Grades: KG-5)
- PEPPER RIDGE ELEMENTARY SCHOOL (Students: 509, Location: 2602 DANBURY DR, Grades: KG-5)
- OAKLAND ELEMENTARY SCHOOL (Students: 482, Location: 1605 E OAKLAND AVE, Grades: KG-5)
- STEVENSON ELEM SCHOOL (Students: 462, Location: 2106 ARROWHEAD DR, Grades: KG-5)
- SHERIDAN ELEM SCHOOL (Students: 409, Location: 1403 W WALNUT ST, Grades: KG-5)
- WASHINGTON ELEM SCHOOL (Students: 377, Location: 1201 E WASHINGTON ST, Grades: KG-5)
- BENT ELEM SCHOOL (Students: 374, Location: 904 N ROOSEVELT AVE, Grades: KG-5)
- FOX CREEK ELEMENTARY SCHOOL (Students: 371, Location: 3910 TIMBERWOLF TRL, Grades: KG-5)
- CEDAR RIDGE ELEM SCHOOL (Location: 2808 BREEZEWOOD BLVD, Grades: KG-5)
Private elementary/middle schools in Bloomington:
Points of interest:
Notable locations in Bloomington: Lakeside Country Club (A), Bible Garden (B), Mark Evans Observatory (C), Highland Park Golf Course (D), McLean County Fairground (E), Bloomington Country Club (F), Lincoln Leisure Center (G), McLean County Courthouse (H), Bloomington City Hall (I), Alice Miller Center for the Fine Arts (J), Arnold Cabana (K), Blackstock Hall (L), Bloomington Township Fire Protection District Station 2 (M), Buck Memorial Library (N), Dodds Hall (O), Dolan Hall (P), DeMotte Hall (Q), Bloomington Fire Department Station 2 Southeast (R), Fort Natatorium (S), Gulick Hall (T). Display/hide their locations on the map
Shopping Centers: Towanda Plaza Shopping Center (1), Colonial Plaza Shopping Center (2), Eastland Commons Shopping Center (3), Eastland Mall Shopping Center (4), Empire Plaza Shopping Center (5). Display/hide their locations on the map
Main business address in Bloomington: CITIZENS FIRST FINANCIAL CORP (A). Display/hide its location on the map
Churches in Bloomington include: Bethel Church (A), Bloomington Bible Church (B), Bloomington West Church of God (C), Centennial Christian Church (D), Christ Temple Pentecostal Church (E), Evangelical Free Church (F), Evelyn Chapel (G), Faith Fellowship Church (H), First Baptist Church of Bloomington (I). Display/hide their locations on the map
Cemeteries: Evergreen Cemetery (1), Jewish Cemetery (2), Park Hill Cemetery (3), Saint Mary's Cemetery (4), Price Cemetery (5), East Lawn Cemetery (6). Display/hide their locations on the map
Reservoir: Miller Park Lake (A). Display/hide its location on the map
Creek: Goose Creek (A). Display/hide its location on the map
Parks in Bloomington include: General Electric Park (1), Holiday Park (2), O'Neil Park (3), Evergreen Park (4), Rollingbrook Park (5), White Place Historic District (6), Wilder Field (7), Mercherle Park (8), Forest Park (9). Display/hide their locations on the map
Tourist attractions: Creatures Crypt Haunted House (Amusement & Theme Parks; 1201 E Bell St) (1), Bloomington-Normal Area Convention & Visitors Bureau (210 South East Street) (2). Display/hide their approximate locations on the map
Hotels: Country Inn & Suites (923 Maple Hill Road) (1), Davis Manor Bed & Breakfast (1001 E Jefferson St) (2), Country Inn & Suites by Carlson-Bloomingtn Nrmlwst (923 Maple Hill Road) (3), Coachman Motel (408 East Washington) (4), Econo Lodge (401 Brock Drive) (5), Hampton Inn Bloomington/Normal (604 1/2 Iaa Drive) (6), Guesthouse Inn - Bloomington (1803 E Empire St) (7), Eastland Suites (1801 Eastland Dr) (8), Extended Stayamerica (1805 South Veterans Parkway) (9). Display/hide their approximate locations on the map
Courts: Illinois State - Supreme Court Reporter Of Decisions (722 West Chestnut Street) (1), Illinois State - State Appellate Court 4th District (318 West Washington Street) (2). Display/hide their approximate locations on the map
Birthplace of: Bill Brady (politician) - Illinois politician, Rick Scott - Lawyer, George Lincoln Rockwell - (died 1967), Nazi Party leader, Ogonna Nnamani - Volleyball player, Vern Partlow - Newspaper reporter, James I. Poynter - Marine Corps Medal of Honor recipient, Forrest Taylor - Actor, Clinton Davisson - Nobel laureate, James Harbord - Army Major General and President of RCA, Joel Higgins - Film actor.
Drinking water stations with addresses in Bloomington and their reported violations in the past:
BLOOMINGTON TOWNSHIP PWD WEST PHASE (Population served: 1,800, Purch surface water):Past monitoring violations:FREEDOM OIL COMPANY (136945) (Population served: 400, Groundwater):
- Water Quality Parameter M/R - Between JAN-2008 and JUN-2008, Contaminant: Lead and Copper Rule. Follow-up actions: St Violation/Reminder Notice (JUL-16-2008), St Compliance achieved (JUL-21-2008)
Past health violations:VICTORY CHRISTIAN CENTER (Population served: 300, Groundwater):
- MCL, Monthly (TCR) - Between OCT-2005 and DEC-2005, Contaminant: Coliform. Follow-up actions: St Boil Water Order (DEC-20-2005), St Formal NOV issued (DEC-20-2005), St Compliance achieved (APR-05-2006)
Past health violations:FREEDOM OIL COMPANY (125666) (Population served: 200, Groundwater):Past monitoring violations:
- MCL, Monthly (TCR) - In JUN-2011, Contaminant: Coliform. Follow-up actions: St Public Notif requested (AUG-15-2011), St Compliance achieved (JAN-11-2012)
- Monitoring, Repeat Major (TCR) - In JUL-2011, Contaminant: Coliform (TCR). Follow-up actions: St Compliance achieved (AUG-10-2011)
- Follow-up Or Routine LCR Tap M/R - In JUL-01-2009, Contaminant: Lead and Copper Rule. Follow-up actions: St Public Notif requested (AUG-12-2009), St Violation/Reminder Notice (AUG-12-2009), St Compliance achieved (SEP-03-2009)
- Initial Tap Sampling for Pb and Cu - In JAN-01-2009, Contaminant: Lead and Copper Rule. Follow-up actions: St Violation/Reminder Notice (FEB-09-2009), St Public Notif requested (FEB-09-2009), St Violation/Reminder Notice (MAY-15-2009), St Public Notif requested (MAY-15-2009), St Compliance achieved (SEP-03-2009)
- Initial Tap Sampling for Pb and Cu - In JUL-01-2008, Contaminant: Lead and Copper Rule. Follow-up actions: St Public Notif requested (AUG-13-2008), St Violation/Reminder Notice (AUG-13-2008), St Public Notif requested (NOV-14-2008), St Violation/Reminder Notice (NOV-14-2008), St Compliance achieved (SEP-03-2009)
- 259 regular monitoring violations
Past health violations:COLONIAL MEADOWS WATER COMPANY (Population served: 190, Groundwater):
- MCL, Monthly (TCR) - Between JUL-2009 and SEP-2009, Contaminant: Coliform. Follow-up actions: St Unresolved (OCT-15-2009), St Violation/Reminder Notice (OCT-16-2009), St Public Notif requested (OCT-16-2009), St Compliance achieved (NOV-09-2009)
- MCL, Monthly (TCR) - Between JAN-2008 and MAR-2008, Contaminant: Coliform. Follow-up actions: St Public Notif requested (MAR-14-2008), St Compliance achieved (MAR-31-2008)
Past monitoring violations:FIRST CHURCH OF THE NAZARENE (135293) (Address: 2207 N. TOWANDA-BARNES RD , Population served: 150, Groundwater):
- Lead Consumer Notice - In DEC-30-2013, Contaminant: Lead and Copper Rule. Follow-up actions: St Violation/Reminder Notice (JAN-27-2014)
- Monitoring and Reporting (DBP) - Between OCT-2013 and DEC-2013, Contaminant: Chlorine. Follow-up actions: St Public Notif requested (NOV-14-2013), St Violation/Reminder Notice (NOV-14-2013), St Compliance achieved (NOV-15-2013), St Formal NOV issued (DEC-12-2013), St Public Notif received (JAN-27-2014), St Civil Case under development (MAR-14-2014)
- Monitoring and Reporting (DBP) - Between APR-2013 and JUN-2013, Contaminant: Chlorine. Follow-up actions: St Public Notif requested (JUL-17-2013), St Violation/Reminder Notice (JUL-17-2013), St Compliance achieved (JUL-26-2013)
- Monitoring and Reporting (DBP) - Between JUL-2012 and SEP-2012, Contaminant: Chlorine. Follow-up actions: St Public Notif requested (SEP-12-2012), St Violation/Reminder Notice (SEP-12-2012), St Compliance achieved (SEP-25-2012), St Public Notif received (OCT-04-2012)
- Monitoring and Reporting (DBP) - Between APR-2012 and JUN-2012, Contaminant: Chlorine. Follow-up actions: St Public Notif requested (JUL-13-2012), St Violation/Reminder Notice (JUL-13-2012), St Formal NOV issued (2 times from AUG-03-2012 to AUG-30-2012), St Compliance achieved (SEP-25-2012), St Public Notif received (NOV-21-2012)
- 7 routine major monitoring violations
- 15 regular monitoring violations
- 13 other older monitoring violations
Past monitoring violations:COUNTRY LANE MHP (Address: SUITE 360-306 , Population served: 50, Groundwater):
- 2 routine major monitoring violations
Past health violations:Past monitoring violations:
- MCL, Monthly (TCR) - In APR-2008, Contaminant: Coliform. Follow-up actions: St Public Notif requested (MAY-14-2008), St Violation/Reminder Notice (MAY-14-2008), St Public Notif received (JUL-01-2008), St Compliance achieved (NOV-01-2008)
- Follow-up Or Routine LCR Tap M/R - In OCT-01-2010, Contaminant: Lead and Copper Rule. Follow-up actions: St Violation/Reminder Notice (OCT-13-2010), St Compliance achieved (OCT-19-2010)
- Monitoring, Repeat Major (TCR) - In APR-2008, Contaminant: Coliform (TCR). Follow-up actions: St Public Notif requested (MAY-14-2008), St Violation/Reminder Notice (MAY-14-2008), St Public Notif received (JUL-01-2008), St Compliance achieved (NOV-01-2008)
- Monitoring, Repeat Major (TCR) - In AUG-2007, Contaminant: Coliform (TCR). Follow-up actions: St Public Notif requested (SEP-18-2007), St Violation/Reminder Notice (SEP-18-2007), St Public Notif received (OCT-23-2008), St Compliance achieved (NOV-01-2008)
- 2 routine major monitoring violations
- One minor monitoring violation
Drinking water stations with addresses in Bloomington that have no violations reported:
- BLOOMINGTON (Population served: 77,610, Primary Water Source Type: Surface water)
- BLOOMINGTON TOWNSHIP PWD-CRESTWICKE (Population served: 900, Primary Water Source Type: Purch surface water)
- CANAAN COMMUNITY MHP (Serves OH, Population served: 420, Primary Water Source Type: Groundwater)
- GRANDVIEW MHP A PWS (Serves OH, Population served: 72, Primary Water Source Type: Groundwater)
- KINGDOM HALL BLOOMINGTON (Population served: 50, Primary Water Source Type: Groundwater)
- RESURRECTION LUTHERAN CHURCH (Population served: 50, Primary Water Source Type: Groundwater)
- GRANDVIEW MHP B (Serves OH, Population served: 47, Primary Water Source Type: Groundwater)
- URBAN WASFARE (Population served: 25, Primary Water Source Type: Groundwater)
| This city: | 2.4 people |
| Illinois: | 2.6 people |
| This city: | 59.6% |
| Whole state: | 65.8% |
| This city: | 6.9% |
| Whole state: | 6.3% |
Likely homosexual households (counted as self-reported same-sex unmarried-partner households)
- Lesbian couples: 0.5% of all households
- Gay men: 0.2% of all households
People in group quarters in Bloomington in 2010:
- 1,427 people in college/university student housing
- 280 people in nursing facilities/skilled-nursing facilities
- 235 people in local jails and other municipal confinement facilities
- 119 people in emergency and transitional shelters (with sleeping facilities) for people experiencing homelessness
- 61 people in group homes intended for adults
- 61 people in other noninstitutional facilities
- 51 people in residential treatment centers for juveniles (non-correctional)
People in group quarters in Bloomington in 2000:
- 1,578 people in college dormitories (includes college quarters off campus)
- 330 people in nursing homes
- 203 people in local jails and other confinement facilities (including police lockups)
- 177 people in other noninstitutional group quarters
- 117 people in homes or halfway houses for drug/alcohol abuse
- 22 people in homes for abused, dependent, and neglected children
- 13 people in religious group quarters
- 7 people in homes for the mentally ill
Banks with most branches in Bloomington (2011 data):
- Heartland Bank and Trust Company: Heartland Bank And Trust Company, Main Street Bloomington Branch, East Oakland Avenue Branch, Market Street Branch, Illinois Wesleyan University Seasona. Info updated 2011/08/08: Bank assets: $1,943.8 mil, Deposits: $1,632.9 mil, local headquarters, positive income, Commercial Lending Specialization, 49 total offices, Holding Company: Heartland Bancorp, Inc.
- PNC Bank, National Association: East Empire Branch, Jefferson Street Branch, Hershey Road Branch, Bloomington Downtown, Market And Jc Parkway Branch. Info updated 2012/03/20: Bank assets: $263,309.6 mil, Deposits: $197,343.0 mil, headquarters in Wilmington, DE, positive income, Commercial Lending Specialization, 3085 total offices, Holding Company: Pnc Financial Services Group, Inc., The
- Busey Bank: E Washington Branch, Bloomington Citizens Savings Branch, Bloomington Branch, Veterans Branch. Info updated 2010/01/25: Bank assets: $3,345.6 mil, Deposits: $2,767.4 mil, headquarters in Champaign, IL, positive income, Commercial Lending Specialization, 49 total offices, Holding Company: First Busey Corporation
- First State Bank of Bloomington: First State Bank Of Bloomington, Luther Oaks Branch, Westminster Village Facility. Info updated 2009/01/05: Bank assets: $97.6 mil, Deposits: $83.5 mil, local headquarters, positive income, Commercial Lending Specialization, 4 total offices, Holding Company: First State Bancorp Of Monticello, Inc. Employee Stock Ownership Plan
- Commerce Bank: Bloomington Downtown Branch, Bloomington Main Branch, Bloomington Airport Branch. Info updated 2011/07/07: Bank assets: $20,493.6 mil, Deposits: $16,805.3 mil, headquarters in Kansas City, MO, positive income, 206 total offices, Holding Company: Commerce Bancshares, Inc.
- JPMorgan Chase Bank, National Association: Bloomington Main Branch, West Market Branch, Bloomington Downtown Branch. Info updated 2011/11/10: Bank assets: $1,811,678.0 mil, Deposits: $1,190,738.0 mil, headquarters in Columbus, OH, positive income, International Specialization, 5577 total offices, Holding Company: Jpmorgan Chase & Co.
- First Financial Bank, National Association: Brickyard Branch at 1 Brickyard Drive, Suite 301, branch established on 2001/09/21; Bloomington Branch at 1218 Towanda Avenue, branch established on 1995/09/01. Info updated 2012/01/04: Bank assets: $2,852.7 mil, Deposits: $2,227.7 mil, headquarters in Terre Haute, IN, positive income, Commercial Lending Specialization, 66 total offices, Holding Company: First Financial Corporation
- CIBM Bank: Bloomington Branch at 1801 East Empire Street, branch established on 1995/12/18. Info updated 2010/08/18: Bank assets: $500.2 mil, Deposits: $431.1 mil, headquarters in Champaign, IL, negative income in the last year, Commercial Lending Specialization, 14 total offices, Holding Company: Cib Marine Bancshares, Inc.
- Flanagan State Bank: Bloomington Branch at 2401 East Washinton Street, branch established on 2005/06/16. Info updated 2006/11/03: Bank assets: $143.5 mil, Deposits: $124.6 mil, headquarters in Flanagan, IL, positive income, Agricultural Specialization, 5 total offices, Holding Company: Hometown Financial Group, Inc.
- 10 other banks with 10 local branches
For population 15 years and over in Bloomington:
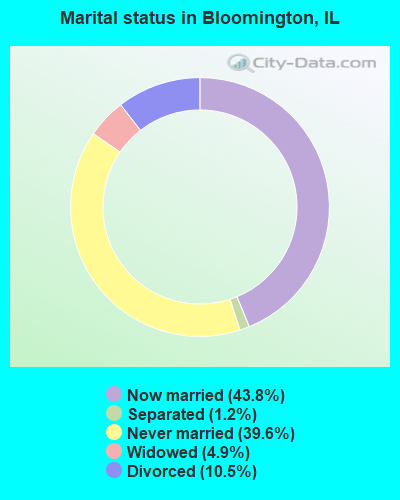
- Never married: 39.6%
- Now married: 43.8%
- Separated: 1.2%
- Widowed: 4.9%
- Divorced: 10.5%
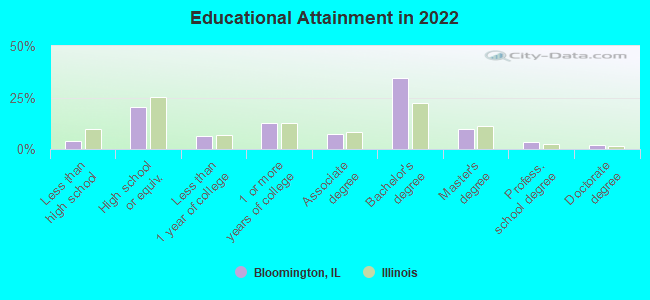
For population 25 years and over in Bloomington:
- High school or higher: 96.1%
- Bachelor's degree or higher: 49.7%
- Graduate or professional degree: 15.3%
- Unemployed: 3.9%
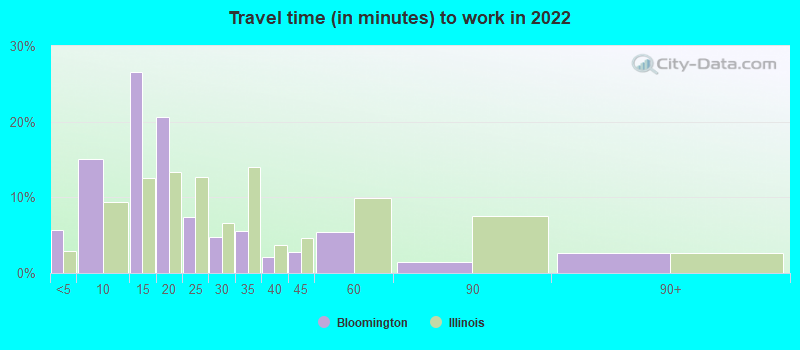
- Mean travel time to work (commute): 12.6 minutes
| Here: | 10.5 |
| Illinois average: | 12.5 |
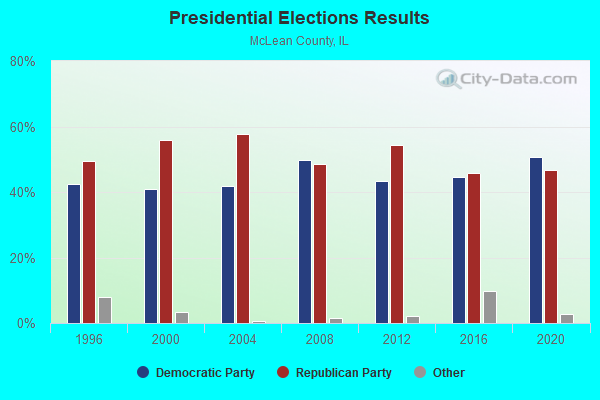
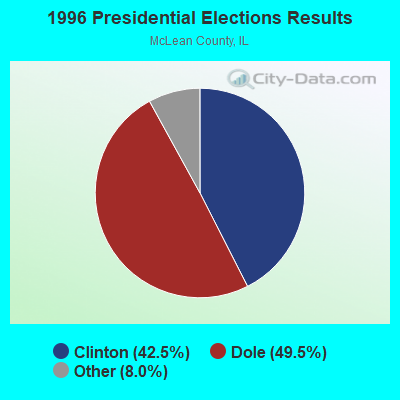

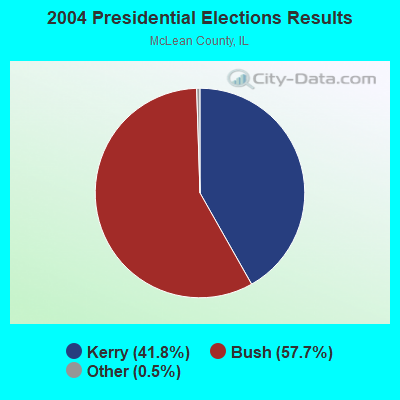
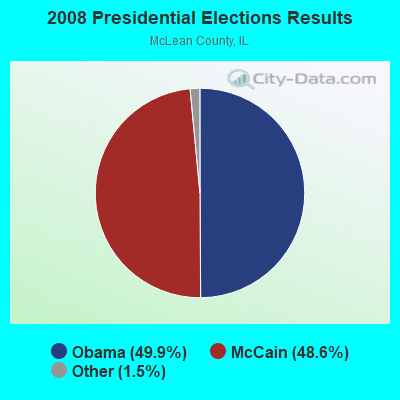
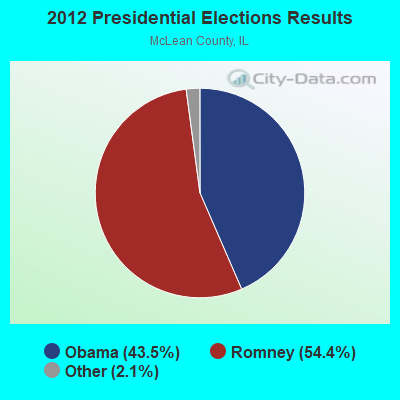
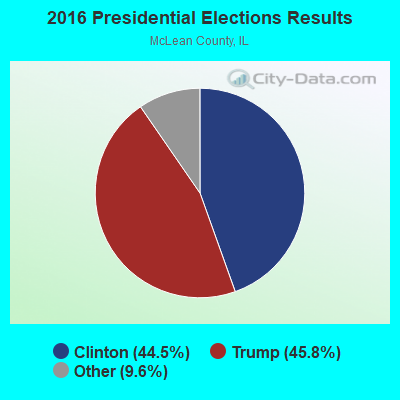
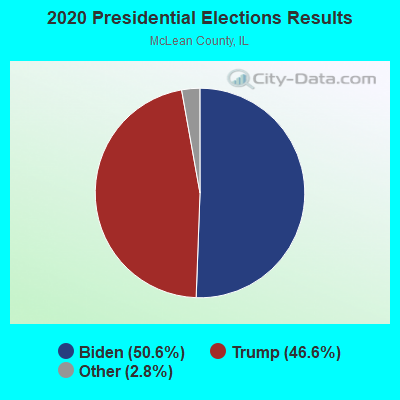
Graphs represent county-level data. Detailed 2008 Election Results
Religion statistics for Bloomington, IL (based on McLean County data)
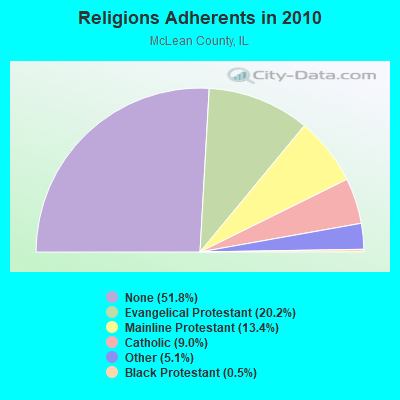
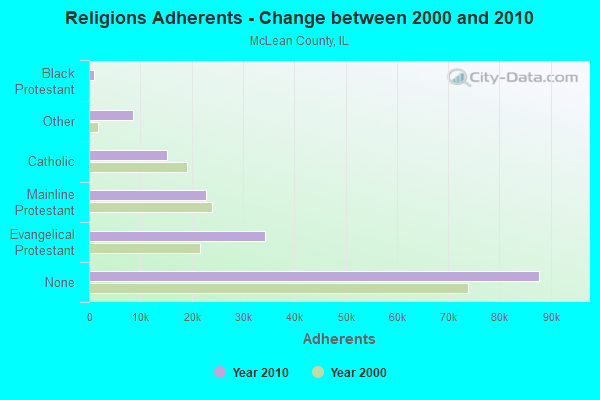
| Religion | Adherents | Congregations |
|---|---|---|
| Evangelical Protestant | 34,238 | 93 |
| Mainline Protestant | 22,803 | 56 |
| Catholic | 15,215 | 10 |
| Other | 8,580 | 16 |
| Black Protestant | 880 | 5 |
| Orthodox | 58 | 1 |
| None | 87,798 | - |
Food Environment Statistics:
| McLean County: | 1.77 / 10,000 pop. |
| State: | 2.24 / 10,000 pop. |
| This county: | 0.24 / 10,000 pop. |
| State: | 0.08 / 10,000 pop. |
| McLean County: | 0.18 / 10,000 pop. |
| State: | 0.75 / 10,000 pop. |
| McLean County: | 4.52 / 10,000 pop. |
| Illinois: | 2.61 / 10,000 pop. |
| This county: | 7.58 / 10,000 pop. |
| Illinois: | 6.86 / 10,000 pop. |
| McLean County: | 7.6% |
| Illinois: | 8.3% |
| This county: | 26.9% |
| State: | 25.2% |
| McLean County: | 13.7% |
| Illinois: | 14.5% |
Health and Nutrition:
| Bloomington: | 50.4% |
| Illinois: | 49.5% |
| Bloomington: | 48.7% |
| State: | 47.2% |
| Bloomington: | 28.5 |
| Illinois: | 28.6 |
| This city: | 20.8% |
| State: | 20.5% |
| Here: | 10.5% |
| Illinois: | 10.8% |
| Bloomington: | 6.8 |
| Illinois: | 6.8 |
| Bloomington: | 32.8% |
| Illinois: | 33.4% |
| Here: | 58.3% |
| Illinois: | 56.4% |
| This city: | 80.7% |
| Illinois: | 79.9% |
More about Health and Nutrition of Bloomington, IL Residents
| Local government employment and payroll (March 2022) | |||||
| Function | Full-time employees | Monthly full-time payroll | Average yearly full-time wage | Part-time employees | Monthly part-time payroll |
|---|---|---|---|---|---|
| Transit | 132 | $663,780 | $60,344 | 0 | $0 |
| Police Protection - Officers | 115 | $1,042,774 | $108,811 | 0 | $0 |
| Firefighters | 112 | $993,076 | $106,401 | 0 | $0 |
| Parks and Recreation | 61 | $344,614 | $67,793 | 148 | $106,775 |
| Water Supply | 47 | $308,142 | $78,675 | 4 | $1,149 |
| Local Libraries | 44 | $207,182 | $56,504 | 34 | $15,932 |
| Solid Waste Management | 32 | $232,932 | $87,350 | 0 | $0 |
| Police - Other | 31 | $242,588 | $93,905 | 11 | $10,251 |
| Other Government Administration | 28 | $187,054 | $80,166 | 9 | $4,650 |
| Other and Unallocable | 27 | $165,757 | $73,670 | 1 | $432 |
| Streets and Highways | 27 | $206,701 | $91,867 | 2 | $4,511 |
| Financial Administration | 24 | $139,717 | $69,859 | 0 | $0 |
| Sewerage | 19 | $140,711 | $88,870 | 2 | $1,983 |
| Judicial and Legal | 12 | $85,677 | $85,677 | 0 | $0 |
| Housing and Community Development (Local) | 7 | $29,756 | $51,010 | 0 | $0 |
| Fire - Other | 3 | $13,691 | $54,764 | 0 | $0 |
| Totals for Government | 721 | $5,004,152 | $83,287 | 211 | $145,682 |
Bloomington government finances - Expenditure in 2021 (per resident):
- Construction - Regular Highways: $2,811,000 ($35.64)
Water Utilities: $1,521,000 ($19.29)
Parks and Recreation: $902,000 ($11.44)
Solid Waste Management: $461,000 ($5.85)
General - Other: $276,000 ($3.50)
Sewerage: $251,000 ($3.18)
Police Protection: $228,000 ($2.89)
Local Fire Protection: $199,000 ($2.52)
Central Staff Services: $63,000 ($0.80)
- Current Operations - Police Protection: $32,192,000 ($408.20)
Local Fire Protection: $24,321,000 ($308.39)
General Public Buildings: $17,898,000 ($226.95)
General - Other: $16,309,000 ($206.80)
Parks and Recreation: $14,300,000 ($181.32)
Water Utilities: $11,929,000 ($151.26)
Regular Highways: $8,395,000 ($106.45)
Housing and Community Development: $1,217,000 ($15.43)
Libraries: $24,000 ($0.30)
- General - Interest on Debt: $10,276,000 ($130.30)
- Other Capital Outlay - Water Utilities: $912,000 ($11.56)
Regular Highways: $746,000 ($9.46)
Sewerage: $651,000 ($8.25)
General - Other: $509,000 ($6.45)
Parks and Recreation: $455,000 ($5.77)
Local Fire Protection: $385,000 ($4.88)
Solid Waste Management: $332,000 ($4.21)
Central Staff Services: $225,000 ($2.85)
Police Protection: $177,000 ($2.24)
- Total Salaries and Wages: $51,854,000 ($657.51)
Bloomington government finances - Revenue in 2021 (per resident):
- Charges - Other: $16,585,000 ($210.30)
Sewerage: $14,894,000 ($188.86)
Parks and Recreation: $10,000 ($0.13)
- Local Intergovernmental - Other: $799,000 ($10.13)
- Miscellaneous - General Revenue - Other: $2,969,000 ($37.65)
Interest Earnings: $1,480,000 ($18.77)
Fines and Forfeits: $810,000 ($10.27)
- Revenue - Water Utilities: $16,008,000 ($202.98)
- State Intergovernmental - General Local Government Support: $28,893,000 ($366.36)
Highways: $8,192,000 ($103.88)
Housing and Community Development: $1,283,000 ($16.27)
Other: $220,000 ($2.79)
Public Welfare: $72,000 ($0.91)
- Tax - Property: $25,433,000 ($322.49)
General Sales and Gross Receipts: $20,808,000 ($263.85)
Other Selective Sales: $17,357,000 ($220.09)
Public Utilities Sales: $5,708,000 ($72.38)
Other License: $1,383,000 ($17.54)
Bloomington government finances - Debt in 2021 (per resident):
- Long Term Debt - Beginning Outstanding - Unspecified Public Purpose: $256,898,000 ($3257.48)
Outstanding Unspecified Public Purpose: $192,054,000 ($2435.26)
Retired Unspecified Public Purpose: $119,669,000 ($1517.41)
Issue, Unspecified Public Purpose: $54,825,000 ($695.18)
Bloomington government finances - Cash and Securities in 2021 (per resident):
- Other Funds - Cash and Securities: $120,292,000 ($1525.31)
| Businesses in Bloomington, IL | ||||
| Name | Count | Name | Count | |
|---|---|---|---|---|
| ALDI | 1 | La-Z-Boy | 1 | |
| AMF Bowling | 1 | LensCrafters | 1 | |
| AT&T | 2 | Little Caesars Pizza | 2 | |
| Advance Auto Parts | 2 | Long John Silver's | 1 | |
| Aeropostale | 1 | Lowe's | 1 | |
| American Eagle Outfitters | 1 | Macy's | 1 | |
| Applebee's | 1 | Marriott | 1 | |
| Arby's | 2 | MasterBrand Cabinets | 8 | |
| AutoZone | 1 | Maurices | 1 | |
| BMW | 1 | Mazda | 1 | |
| Barnes & Noble | 1 | McDonald's | 4 | |
| Baskin-Robbins | 1 | Men's Wearhouse | 1 | |
| Bath & Body Works | 1 | Motherhood Maternity | 1 | |
| Baymont Inn | 1 | New Balance | 3 | |
| Blockbuster | 1 | Nike | 10 | |
| Budget Car Rental | 1 | Nissan | 1 | |
| Buffalo Wild Wings | 1 | OfficeMax | 1 | |
| Burger King | 2 | Old Navy | 1 | |
| CVS | 2 | Olive Garden | 1 | |
| Carson Pirie Scott | 1 | Outback | 1 | |
| Casual Male XL | 1 | Outback Steakhouse | 1 | |
| Chevrolet | 1 | Pac Sun | 1 | |
| Chick-Fil-A | 2 | Panda Express | 1 | |
| Chipotle | 1 | Panera Bread | 1 | |
| Chuck E. Cheese's | 1 | Papa John's Pizza | 1 | |
| Circle K | 4 | Payless | 2 | |
| Comfort Suites | 1 | Penske | 1 | |
| Cracker Barrel | 1 | Pier 1 Imports | 1 | |
| Curves | 2 | Pizza Hut | 1 | |
| DHL | 2 | Plato's Closet | 1 | |
| Dairy Queen | 2 | Popeyes | 2 | |
| Days Inn | 1 | Qdoba Mexican Grill | 1 | |
| Deb | 1 | Quality | 2 | |
| Decora Cabinetry | 1 | Quiznos | 1 | |
| Dennys | 1 | RadioShack | 2 | |
| Domino's Pizza | 1 | Ramada | 1 | |
| Dunkin Donuts | 1 | Red Lobster | 1 | |
| Econo Lodge | 1 | Red Roof Inn | 1 | |
| Express | 1 | SAS Shoes | 1 | |
| Extended Stay America | 1 | Sears | 3 | |
| FedEx | 13 | Spencer Gifts | 1 | |
| Finish Line | 1 | Sprint Nextel | 4 | |
| Foot Locker | 1 | Starbucks | 2 | |
| Ford | 1 | Steak 'n Shake | 2 | |
| GNC | 1 | Subway | 2 | |
| GameStop | 2 | Super 8 | 1 | |
| Gap | 1 | T-Mobile | 3 | |
| H&R Block | 4 | T.G.I. Driday's | 1 | |
| Hardee's | 1 | T.J.Maxx | 1 | |
| Hawthorn | 1 | Taco Bell | 1 | |
| Hilton | 2 | Talbots | 1 | |
| Holiday Inn | 2 | The Limited | 1 | |
| Hollister Co. | 1 | The Room Place | 1 | |
| Honda | 1 | Toyota | 1 | |
| IHOP | 1 | Toys"R"Us | 1 | |
| JCPenney | 1 | U-Haul | 4 | |
| Jewel-Osco | 2 | U.S. Cellular | 3 | |
| Jimmy John's | 2 | UPS | 19 | |
| Jones New York | 3 | Vans | 2 | |
| Journeys | 1 | Verizon Wireless | 1 | |
| Justice | 1 | Victoria's Secret | 1 | |
| KFC | 2 | Walgreens | 4 | |
| Kmart | 1 | Walmart | 1 | |
| Kohl's | 1 | Wendy's | 1 | |
| Kroger | 2 | YMCA | 1 | |
| La Quinta | 1 | |||
Strongest AM radio stations in Bloomington:
- WJBC (1230 AM; 1 kW; BLOOMINGTON, IL; Owner: CITADEL BROADCASTING COMPANY)
- WLS (890 AM; 50 kW; CHICAGO, IL; Owner: WLS, INC.)
- WSCR (670 AM; 50 kW; CHICAGO, IL; Owner: INFINITY BROADCASTING OPERATIONS, INC.)
- WYLL (1160 AM; 50 kW; CHICAGO, IL; Owner: SCA LICENSE CORPORATION)
- WGN (720 AM; 50 kW; CHICAGO, IL; Owner: WGN CONTINENTAL BROADCASTING CO.)
- WBBM (780 AM; 50 kW; CHICAGO, IL; Owner: INFINITY BROADCASTING OPERATIONS, INC.)
- WMVP (1000 AM; 50 kW; CHICAGO, IL; Owner: ABC, INC.)
- WMBD (1470 AM; 5 kW; PEORIA, IL; Owner: MONTEREY LICENSES, LLC)
- WVEL (1140 AM; daytime; 5 kW; PEKIN, IL)
- WWFS (1290 AM; 5 kW; PEORIA, IL; Owner: MONTEREY LICENSES, LLC)
- WILL (580 AM; 5 kW; URBANA, IL; Owner: UNIV. OF ILLINOIS BOARD OF TRUSTEES)
- WTMJ (620 AM; 50 kW; MILWAUKEE, WI; Owner: JOURNAL BROADCAST CORPORATION)
- KXEN (1010 AM; 50 kW; FESTUS-ST. LOUIS, MO; Owner: BDJ RADIO ENTERPRISES, LLC)
Strongest FM radio stations in Bloomington:
- W264AG (100.7 FM; BLOOMINGTON, IL; Owner: CENTRAL ILLINOIS RADIO FELLOWSHIP, INC.)
- WBNQ (101.5 FM; BLOOMINGTON, IL; Owner: CITADEL BROADCASTING COMPANY)
- WBWN (104.1 FM; LE ROY, IL; Owner: CITADEL BROADCASTING COMPANY)
- WIHN (96.7 FM; NORMAL, IL; Owner: AAA ENTERTAINMENT LICENSING LLC)
- WESN (88.1 FM; BLOOMINGTON, IL; Owner: ILLINOIS WESLEYAN UNIVERSITY)
- WGLT (89.1 FM; NORMAL, IL; Owner: ILLINOIS STATE UNIVERSITY)
- W255AI (98.9 FM; BLOOMINGTON, IL; Owner: ILLINOIS BIBLE INSTITUTE, INC.)
- WDQZ (99.5 FM; LEXINGTON, IL; Owner: AAA ENTERTAINMENT LICENSING, LLC)
- WRPW (92.9 FM; COLFAX, IL; Owner: AAA ENTERTAINMENT LICENSING LLC)
- WILL-FM (90.9 FM; URBANA, IL; Owner: UNIV. OF ILLINOIS BOARD OF TRUSTEES)
- WTRX-FM (93.7 FM; PONTIAC, IL; Owner: LIVINGSTON COUNTY BROADCASTERS, INC.)
- WWHP (98.3 FM; FARMER CITY, IL; Owner: WMS1, INC.)
- WGLO (95.5 FM; PEKIN, IL; Owner: REGENT BROADCASTING OF PEORIA, INC.)
- WCBU (89.9 FM; PEORIA, IL; Owner: BRADLEY UNIVERSITY)
- WXMP (105.7 FM; PEORIA, IL; Owner: AAA ENTERTAINMENT LICENSING LLC)
- WYST (107.7 FM; FAIRBURY, IL; Owner: AAA ENTERTAINMENT LICENSING LLC)
- WBNH (88.5 FM; PEKIN, IL; Owner: CENTRAL ILLINOIS RADIO FELLOWSHIP, INC.)
- WPBG (93.3 FM; PEORIA, IL; Owner: MONTEREY LICENSES, LLC)
- WCIC (91.5 FM; PEKIN, IL; Owner: ILLINOIS BIBLE INSTITUTE, INC.)
- WRVP (98.5 FM; EUREKA, IL; Owner: REGENT BROADCASTING OF PEORIA, INC.)
TV broadcast stations around Bloomington:
- W51CT (Channel 51; BLOOMINGTON, IL; Owner: TRINITY BROADCASTING NETWORK)
- WYZZ-TV (Channel 43; BLOOMINGTON, IL; Owner: WYZZ LICENSEE, INC.)
- WCIA (Channel 3; CHAMPAIGN, IL; Owner: NEXSTAR BROADCASTING OF CHAMPAIGN, L.L.C.)
- WBUI (Channel 23; DECATUR, IL; Owner: ACME TV LICENSES OF ILLINOIS, LLC)
- WAND (Channel 17; DECATUR, IL; Owner: WAND(TV) PARTNERSHIP)
- WILL-TV (Channel 12; URBANA, IL; Owner: UNIV. OF ILLINOIS BD. OF TRUSTEES)
- W52BR (Channel 52; CHAMPAIGN-URBANA, IL; Owner: MARCIA COHEN)
- WRSP-TV (Channel 55; SPRINGFIELD, IL; Owner: SPRINGFIELD BROADCASTING PARTNERS)
- WICS (Channel 20; SPRINGFIELD, IL; Owner: WICS LICENSEE, LLC)
- WEEK-TV (Channel 25; PEORIA, IL; Owner: WEEK-TV LICENSE, INC.)
- WHOI (Channel 19; PEORIA, IL; Owner: CHELSEY BROADCASTING COMPANY OF PEORIA, LLC)
- WTVP (Channel 47; PEORIA, IL; Owner: ILLINOIS VALLEY PUB TELECOMM CORP)
- WAOE (Channel 59; PEORIA, IL; Owner: FOUR SEASONS PEORIA, LLC)
Medal of Honor Recipients
Medal of Honor Recipient born in Bloomington: James I. Poynter.
- National Bridge Inventory (NBI) Statistics
- 121Number of bridges
- 1,142ft / 348mTotal length
- $8,392,000Total costs
- 965,150Total average daily traffic
- 224,967Total average daily truck traffic
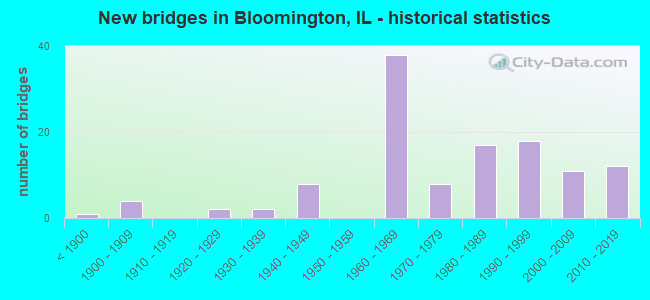
- New bridges - historical statistics
- 1Before 1900
- 41900-1909
- 21920-1929
- 21930-1939
- 81940-1949
- 381960-1969
- 81970-1979
- 171980-1989
- 181990-1999
- 112000-2009
- 122010-2019
FCC Registered Commercial Land Mobile Towers: 1 (See the full list of FCC Registered Commercial Land Mobile Towers in Bloomington, IL)
FCC Registered Private Land Mobile Towers: 9 (See the full list of FCC Registered Private Land Mobile Towers)
FCC Registered Broadcast Land Mobile Towers: 77 (See the full list of FCC Registered Broadcast Land Mobile Towers)
FCC Registered Microwave Towers: 69 (See the full list of FCC Registered Microwave Towers in this town)
FCC Registered Paging Towers: 12 (See the full list of FCC Registered Paging Towers)
FCC Registered Maritime Coast & Aviation Ground Towers: 23 (See the full list of FCC Registered Maritime Coast & Aviation Ground Towers)
FCC Registered Amateur Radio Licenses: 382 (See the full list of FCC Registered Amateur Radio Licenses in Bloomington)
FAA Registered Aircraft Manufacturers and Dealers: 3 (See the full list of FAA Registered Manufacturers and Dealers in Bloomington)
FAA Registered Aircraft: 72 (See the full list of FAA Registered Aircraft)
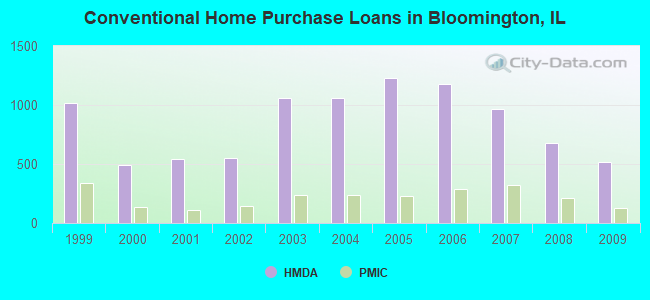
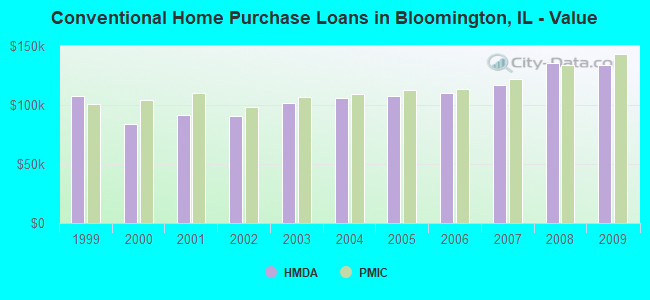
| Home Mortgage Disclosure Act Aggregated Statistics For Year 2009 (Based on 13 full and 9 partial tracts) | ||||||||||||||
| A) FHA, FSA/RHS & VA Home Purchase Loans | B) Conventional Home Purchase Loans | C) Refinancings | D) Home Improvement Loans | E) Loans on Dwellings For 5+ Families | F) Non-occupant Loans on < 5 Family Dwellings (A B C & D) | G) Loans On Manufactured Home Dwelling (A B C & D) | ||||||||
|---|---|---|---|---|---|---|---|---|---|---|---|---|---|---|
| Number | Average Value | Number | Average Value | Number | Average Value | Number | Average Value | Number | Average Value | Number | Average Value | Number | Average Value | |
| LOANS ORIGINATED | 311 | $122,939 | 514 | $133,743 | 1,997 | $136,435 | 91 | $73,955 | 28 | $481,986 | 173 | $98,951 | 3 | $49,077 |
| APPLICATIONS APPROVED, NOT ACCEPTED | 6 | $108,320 | 17 | $128,524 | 90 | $129,732 | 14 | $64,331 | 0 | $0 | 4 | $65,037 | 4 | $48,708 |
| APPLICATIONS DENIED | 27 | $122,453 | 29 | $89,641 | 263 | $135,027 | 40 | $33,844 | 1 | $2,247,860 | 22 | $153,012 | 8 | $23,229 |
| APPLICATIONS WITHDRAWN | 28 | $115,170 | 28 | $120,637 | 244 | $133,324 | 6 | $48,077 | 0 | $0 | 14 | $90,180 | 1 | $68,000 |
| FILES CLOSED FOR INCOMPLETENESS | 4 | $93,452 | 3 | $118,943 | 32 | $152,652 | 1 | $138,010 | 0 | $0 | 2 | $85,820 | 0 | $0 |
Detailed mortgage data for all 21 tracts in Bloomington, IL
| Private Mortgage Insurance Companies Aggregated Statistics For Year 2009 (Based on 13 full and 9 partial tracts) | ||||||
| A) Conventional Home Purchase Loans | B) Refinancings | C) Non-occupant Loans on < 5 Family Dwellings (A & B) | ||||
|---|---|---|---|---|---|---|
| Number | Average Value | Number | Average Value | Number | Average Value | |
| LOANS ORIGINATED | 127 | $142,807 | 115 | $152,993 | 1 | $102,000 |
| APPLICATIONS APPROVED, NOT ACCEPTED | 21 | $117,847 | 21 | $140,212 | 0 | $0 |
| APPLICATIONS DENIED | 15 | $128,637 | 11 | $160,575 | 0 | $0 |
| APPLICATIONS WITHDRAWN | 4 | $174,052 | 11 | $133,850 | 0 | $0 |
| FILES CLOSED FOR INCOMPLETENESS | 0 | $0 | 0 | $0 | 0 | $0 |
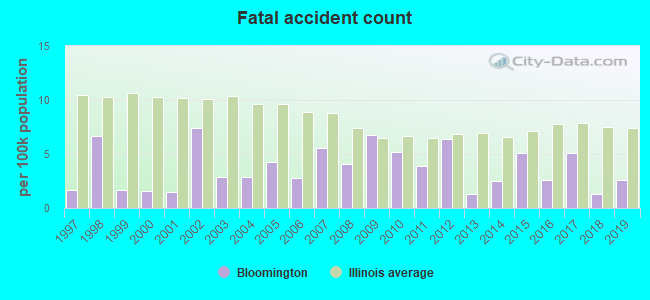
2003 - 2018 National Fire Incident Reporting System (NFIRS) incidents
- Fire incident types reported to NFIRS in Bloomington, IL
- 1,69745.3%Structure Fires
- 1,43438.3%Outside Fires
- 56915.2%Mobile Property/Vehicle Fires
- 491.3%Other
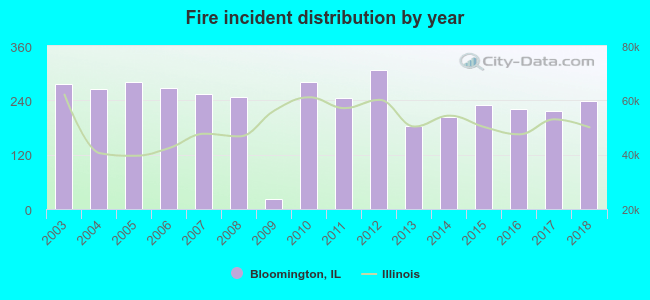 Based on the data from the years 2003 - 2018 the average number of fire incidents per year is 234. The highest number of fires - 308 took place in 2012, and the least - 22 in 2009. The data has a declining trend.
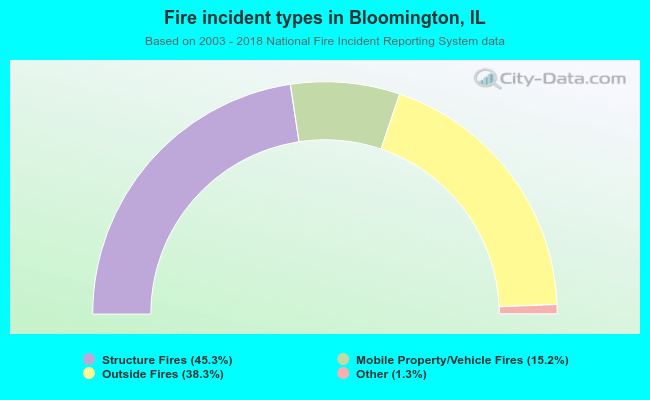 When looking into fire subcategories, the most reports belonged to: Structure Fires (45.3%), and Outside Fires (38.3%).
Fire-safe hotels and motels in Bloomington, Illinois:
- Quality Inn & Suites, 1803 E Empire St, Bloomington, Illinois 61704 , Phone: (309) 663-1361, Fax: (309) 834-0808
- Chateau At Bloomington, 1601 Jumer Dr, Bloomington, Illinois 61704 , Phone: (309) 662-2020, Fax: (309) 662-6522
- Clarion Hotel, 1219 Holiday Ln, Bloomington, Illinois 61704 , Phone: (309) 662-5311, Fax: (609) 662-6283
- Quality Suites, 403 Brock Dr, Bloomington, Illinois 61701 , Phone: (309) 829-7602
- Country Inn & Suites West, 923 Maple Hill Dr, Bloomington, Illinois 61704 , Phone: (309) 828-7177, Fax: (309) 828-4601
- Ramada Limited & Suites, 919 Maple Hill Rd, Bloomington, Illinois 61704 , Phone: (309) 828-0900, Fax: (309) 828-0131
- Best Western Plus Bloomington East, 604 1/2 IAA Dr, Bloomington, Illinois 61701 , Phone: (309) 808-0628, Fax: (309) 808-0656
- Bloomington Holiday Inn Express-West, 1031 Wylie Dr, Bloomington, Illinois 61704 , Phone: (309) 820-9990, Fax: (309) 820-1926
- 9 other hotels and motels
| Most common first names in Bloomington, IL among deceased individuals | ||
| Name | Count | Lived (average) |
|---|---|---|
| Mary | 709 | 79.5 years |
| Robert | 586 | 72.6 years |
| William | 542 | 74.4 years |
| John | 496 | 75.1 years |
| James | 458 | 72.1 years |
| Helen | 379 | 81.4 years |
| Charles | 339 | 76.4 years |
| Ruth | 322 | 82.6 years |
| Donald | 306 | 71.7 years |
| George | 293 | 77.7 years |
| Most common last names in Bloomington, IL among deceased individuals | ||
| Last name | Count | Lived (average) |
|---|---|---|
| Smith | 271 | 78.2 years |
| Johnson | 212 | 79.0 years |
| Williams | 142 | 79.0 years |
| Miller | 139 | 77.4 years |
| Brown | 135 | 75.5 years |
| Anderson | 129 | 74.2 years |
| Jones | 92 | 79.1 years |
| Wilson | 86 | 74.4 years |
| Davis | 85 | 75.4 years |
| Moore | 84 | 76.0 years |
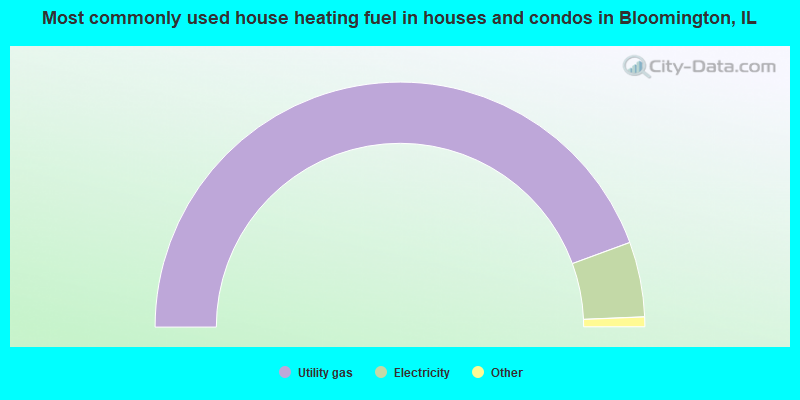
- 88.8%Utility gas
- 9.9%Electricity
- 0.8%Bottled, tank, or LP gas
- 0.3%No fuel used
- 0.2%Other fuel
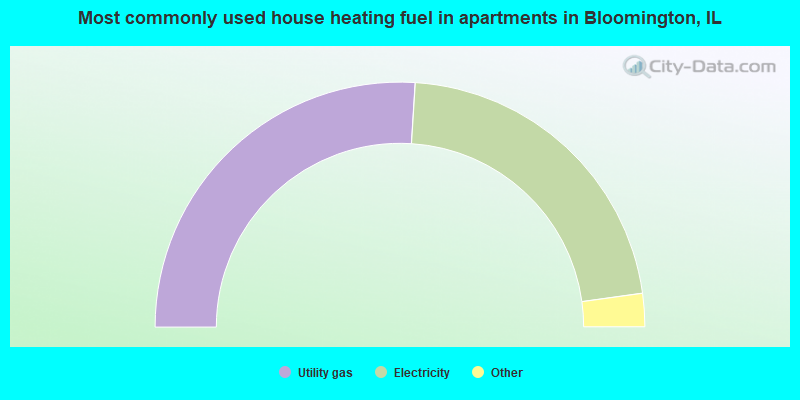
- 52.0%Utility gas
- 43.6%Electricity
- 1.8%Bottled, tank, or LP gas
- 1.5%No fuel used
- 1.1%Other fuel
Bloomington compared to Illinois state average:
- Unemployed percentage significantly below state average.
- Hispanic race population percentage below state average.
- Median age below state average.
- Length of stay since moving in below state average.
- Percentage of population with a bachelor's degree or higher above state average.
Bloomington on our top lists:
- #2 on the list of "Top 101 cities with largest percentage of males in industries: finance and insurance (population 50,000+)"
- #2 on the list of "Top 101 cities with largest percentage of females in industries: finance and insurance (population 50,000+)"
- #10 on the list of "Top 101 cities with the largest wind speed differences during a year (population 50,000+)"
- #13 on the list of "Top 101 cities with largest percentage of females in occupations: computer and mathematical occupations (population 50,000+)"
- #16 on the list of "Top 101 cities with largest percentage of females in industries: management of companies and enterprises (population 50,000+)"
- #31 on the list of "Top 101 cities with largest percentage of males in occupations: computer and mathematical occupations (population 50,000+)"
- #33 on the list of "Top 101 cities with largest percentage of females in occupations: business and financial operations occupations (population 50,000+)"
- #36 on the list of "Top 101 cities with the largest city-data.com crime index decrease from 2011 to 2012 (population 50,000+)"
- #41 on the list of "Top 101 cities with largest percentage of females in occupations: architecture and engineering occupations (population 50,000+)"
- #45 on the list of "Top 101 cities with the lowest number of auto thefts per 100,000 residents (population 50,000+)"
- #46 on the list of "Top 101 cities with the largest city-data.com crime index decrease from 2002 to 2012 (population 50,000+)"
- #48 on the list of "Top 100 cities with shortest commuting times (pop. 50,000+)"
- #51 on the list of "Top 101 cities with largest percentage of males in occupations: business and financial operations occupations (population 50,000+)"
- #54 on the list of "Top 101 cities with the largest temperature differences during a year (population 50,000+)"
- #58 on the list of "Top 101 cities with largest percentage of males in occupations: fire fighting and prevention workers including supervisors (population 50,000+)"
- #64 on the list of "Top 101 cities with the highest ratio of rapes to murders between 2002 and 2012 (population 50,000+)"
- #69 on the list of "Top 101 cities with the most people born in the same U.S. state as the city (population 50,000+)"
- #82 on the list of "Top 101 cities with the most recent year of entry for the foreign-born population (2,000+ people)+"
- #84 on the list of "Top 101 cities with the coldest winters (population 50,000+)"
- #88 on the list of "Top 101 cities with the lowest daily low temperatures (population 50,000+)"
- #65 on the list of "Top 101 counties with the lowest percentage of residents relocating from foreign countries between 2010 and 2011"

|
|
Total of 537 patent applications in 2008-2024.