Canyon, Texas Submit your own pictures of this city and show them to the world
OSM Map
General Map
Google Map
MSN Map
OSM Map
General Map
Google Map
MSN Map
OSM Map
General Map
Google Map
MSN Map
OSM Map
General Map
Google Map
MSN Map
Please wait while loading the map...
Population in 2022: 15,771 (99% urban, 1% rural). Population change since 2000: +22.5%Males: 7,706 Females: 8,065
March 2022 cost of living index in Canyon: 83.3 (low, U.S. average is 100) Percentage of residents living in poverty in 2022: 14.2%for White Non-Hispanic residents , 13.5% for Black residents , 14.2% for Hispanic or Latino residents , 8.8% for other race residents , 19.3% for two or more races residents )Business Search - 14 Million verified businesses
Data:
Median household income ($)
Median household income (% change since 2000)
Household income diversity
Ratio of average income to average house value (%)
Ratio of average income to average rent
Median household income ($) - White
Median household income ($) - Black or African American
Median household income ($) - Asian
Median household income ($) - Hispanic or Latino
Median household income ($) - American Indian and Alaska Native
Median household income ($) - Multirace
Median household income ($) - Other Race
Median household income for houses/condos with a mortgage ($)
Median household income for apartments without a mortgage ($)
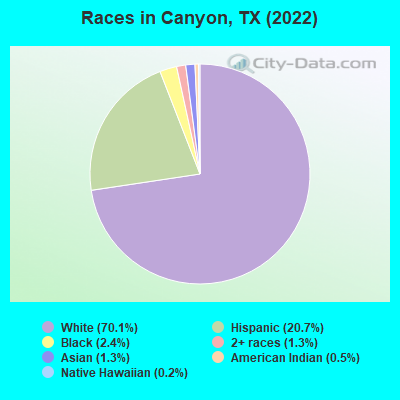
Races - White alone (%)
Races - White alone (% change since 2000)
Races - Black alone (%)
Races - Black alone (% change since 2000)
Races - American Indian alone (%)
Races - American Indian alone (% change since 2000)
Races - Asian alone (%)
Races - Asian alone (% change since 2000)
Races - Hispanic (%)
Races - Hispanic (% change since 2000)
Races - Native Hawaiian and Other Pacific Islander alone (%)
Races - Native Hawaiian and Other Pacific Islander alone (% change since 2000)
Races - Two or more races (%)
Races - Two or more races (% change since 2000)
Races - Other race alone (%)
Races - Other race alone (% change since 2000)
Racial diversity
Unemployment (%)
Unemployment (% change since 2000)
Unemployment (%) - White
Unemployment (%) - Black or African American
Unemployment (%) - Asian
Unemployment (%) - Hispanic or Latino
Unemployment (%) - American Indian and Alaska Native
Unemployment (%) - Multirace
Unemployment (%) - Other Race
Population density (people per square mile)
Population - Males (%)
Population - Females (%)
Population - Males (%) - White
Population - Males (%) - Black or African American
Population - Males (%) - Asian
Population - Males (%) - Hispanic or Latino
Population - Males (%) - American Indian and Alaska Native
Population - Males (%) - Multirace
Population - Males (%) - Other Race
Population - Females (%) - White
Population - Females (%) - Black or African American
Population - Females (%) - Asian
Population - Females (%) - Hispanic or Latino
Population - Females (%) - American Indian and Alaska Native
Population - Females (%) - Multirace
Population - Females (%) - Other Race
Coronavirus confirmed cases (Apr 27, 2024)
Deaths caused by coronavirus (Apr 27, 2024)
Coronavirus confirmed cases (per 100k population) (Apr 27, 2024)
Deaths caused by coronavirus (per 100k population) (Apr 27, 2024)
Daily increase in number of cases (Apr 27, 2024)
Weekly increase in number of cases (Apr 27, 2024)
Cases doubled (in days) (Apr 27, 2024)
Hospitalized patients (Apr 18, 2022)
Negative test results (Apr 18, 2022)
Total test results (Apr 18, 2022)
COVID Vaccine doses distributed (per 100k population) (Sep 19, 2023)
COVID Vaccine doses administered (per 100k population) (Sep 19, 2023)
COVID Vaccine doses distributed (Sep 19, 2023)
COVID Vaccine doses administered (Sep 19, 2023)
Likely homosexual households (%)
Likely homosexual households (% change since 2000)
Likely homosexual households - Lesbian couples (%)
Likely homosexual households - Lesbian couples (% change since 2000)
Likely homosexual households - Gay men (%)
Likely homosexual households - Gay men (% change since 2000)
Cost of living index
Median gross rent ($)
Median contract rent ($)
Median monthly housing costs ($)
Median house or condo value ($)
Median house or condo value ($ change since 2000)
Mean house or condo value by units in structure - 1, detached ($)
Mean house or condo value by units in structure - 1, attached ($)
Mean house or condo value by units in structure - 2 ($)
Mean house or condo value by units in structure by units in structure - 3 or 4 ($)
Mean house or condo value by units in structure - 5 or more ($)
Mean house or condo value by units in structure - Boat, RV, van, etc. ($)
Mean house or condo value by units in structure - Mobile home ($)
Median house or condo value ($) - White
Median house or condo value ($) - Black or African American
Median house or condo value ($) - Asian
Median house or condo value ($) - Hispanic or Latino
Median house or condo value ($) - American Indian and Alaska Native
Median house or condo value ($) - Multirace
Median house or condo value ($) - Other Race
Median resident age
Resident age diversity
Median resident age - Males
Median resident age - Females
Median resident age - White
Median resident age - Black or African American
Median resident age - Asian
Median resident age - Hispanic or Latino
Median resident age - American Indian and Alaska Native
Median resident age - Multirace
Median resident age - Other Race
Median resident age - Males - White
Median resident age - Males - Black or African American
Median resident age - Males - Asian
Median resident age - Males - Hispanic or Latino
Median resident age - Males - American Indian and Alaska Native
Median resident age - Males - Multirace
Median resident age - Males - Other Race
Median resident age - Females - White
Median resident age - Females - Black or African American
Median resident age - Females - Asian
Median resident age - Females - Hispanic or Latino
Median resident age - Females - American Indian and Alaska Native
Median resident age - Females - Multirace
Median resident age - Females - Other Race
Commute - mean travel time to work (minutes)
Travel time to work - Less than 5 minutes (%)
Travel time to work - Less than 5 minutes (% change since 2000)
Travel time to work - 5 to 9 minutes (%)
Travel time to work - 5 to 9 minutes (% change since 2000)
Travel time to work - 10 to 19 minutes (%)
Travel time to work - 10 to 19 minutes (% change since 2000)
Travel time to work - 20 to 29 minutes (%)
Travel time to work - 20 to 29 minutes (% change since 2000)
Travel time to work - 30 to 39 minutes (%)
Travel time to work - 30 to 39 minutes (% change since 2000)
Travel time to work - 40 to 59 minutes (%)
Travel time to work - 40 to 59 minutes (% change since 2000)
Travel time to work - 60 to 89 minutes (%)
Travel time to work - 60 to 89 minutes (% change since 2000)
Travel time to work - 90 or more minutes (%)
Travel time to work - 90 or more minutes (% change since 2000)
Marital status - Never married (%)
Marital status - Now married (%)
Marital status - Separated (%)
Marital status - Widowed (%)
Marital status - Divorced (%)
Median family income ($)
Median family income (% change since 2000)
Median non-family income ($)
Median non-family income (% change since 2000)
Median per capita income ($)
Median per capita income (% change since 2000)
Median family income ($) - White
Median family income ($) - Black or African American
Median family income ($) - Asian
Median family income ($) - Hispanic or Latino
Median family income ($) - American Indian and Alaska Native
Median family income ($) - Multirace
Median family income ($) - Other Race
Median year house/condo built
Median year apartment built
Year house built - Built 2005 or later (%)
Year house built - Built 2000 to 2004 (%)
Year house built - Built 1990 to 1999 (%)
Year house built - Built 1980 to 1989 (%)
Year house built - Built 1970 to 1979 (%)
Year house built - Built 1960 to 1969 (%)
Year house built - Built 1950 to 1959 (%)
Year house built - Built 1940 to 1949 (%)
Year house built - Built 1939 or earlier (%)
Average household size
Household density (households per square mile)
Average household size - White
Average household size - Black or African American
Average household size - Asian
Average household size - Hispanic or Latino
Average household size - American Indian and Alaska Native
Average household size - Multirace
Average household size - Other Race
Occupied housing units (%)
Vacant housing units (%)
Owner occupied housing units (%)
Renter occupied housing units (%)
Vacancy status - For rent (%)
Vacancy status - For sale only (%)
Vacancy status - Rented or sold, not occupied (%)
Vacancy status - For seasonal, recreational, or occasional use (%)
Vacancy status - For migrant workers (%)
Vacancy status - Other vacant (%)
Residents with income below the poverty level (%)
Residents with income below 50% of the poverty level (%)
Children below poverty level (%)
Poor families by family type - Married-couple family (%)
Poor families by family type - Male, no wife present (%)
Poor families by family type - Female, no husband present (%)
Poverty status for native-born residents (%)
Poverty status for foreign-born residents (%)
Poverty among high school graduates not in families (%)
Poverty among people who did not graduate high school not in families (%)
Residents with income below the poverty level (%) - White
Residents with income below the poverty level (%) - Black or African American
Residents with income below the poverty level (%) - Asian
Residents with income below the poverty level (%) - Hispanic or Latino
Residents with income below the poverty level (%) - American Indian and Alaska Native
Residents with income below the poverty level (%) - Multirace
Residents with income below the poverty level (%) - Other Race
Air pollution - Air Quality Index (AQI)
Air pollution - CO
Air pollution - NO2
Air pollution - SO2
Air pollution - Ozone
Air pollution - PM10
Air pollution - PM25
Air pollution - Pb
Crime - Murders per 100,000 population
Crime - Rapes per 100,000 population
Crime - Robberies per 100,000 population
Crime - Assaults per 100,000 population
Crime - Burglaries per 100,000 population
Crime - Thefts per 100,000 population
Crime - Auto thefts per 100,000 population
Crime - Arson per 100,000 population
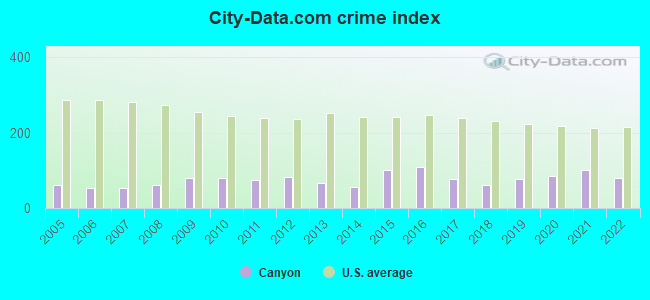
Crime - City-data.com crime index
Crime - Violent crime index
Crime - Property crime index
Crime - Murders per 100,000 population (5 year average)
Crime - Rapes per 100,000 population (5 year average)
Crime - Robberies per 100,000 population (5 year average)
Crime - Assaults per 100,000 population (5 year average)
Crime - Burglaries per 100,000 population (5 year average)
Crime - Thefts per 100,000 population (5 year average)
Crime - Auto thefts per 100,000 population (5 year average)
Crime - Arson per 100,000 population (5 year average)
Crime - City-data.com crime index (5 year average)
Crime - Violent crime index (5 year average)
Crime - Property crime index (5 year average)
1996 Presidential Elections Results (%) - Democratic Party (Clinton)
1996 Presidential Elections Results (%) - Republican Party (Dole)
1996 Presidential Elections Results (%) - Other
2000 Presidential Elections Results (%) - Democratic Party (Gore)
2000 Presidential Elections Results (%) - Republican Party (Bush)
2000 Presidential Elections Results (%) - Other
2004 Presidential Elections Results (%) - Democratic Party (Kerry)
2004 Presidential Elections Results (%) - Republican Party (Bush)
2004 Presidential Elections Results (%) - Other
2008 Presidential Elections Results (%) - Democratic Party (Obama)
2008 Presidential Elections Results (%) - Republican Party (McCain)
2008 Presidential Elections Results (%) - Other
2012 Presidential Elections Results (%) - Democratic Party (Obama)
2012 Presidential Elections Results (%) - Republican Party (Romney)
2012 Presidential Elections Results (%) - Other
2016 Presidential Elections Results (%) - Democratic Party (Clinton)
2016 Presidential Elections Results (%) - Republican Party (Trump)
2016 Presidential Elections Results (%) - Other
2020 Presidential Elections Results (%) - Democratic Party (Biden)
2020 Presidential Elections Results (%) - Republican Party (Trump)
2020 Presidential Elections Results (%) - Other
Ancestries Reported - Arab (%)
Ancestries Reported - Czech (%)
Ancestries Reported - Danish (%)
Ancestries Reported - Dutch (%)
Ancestries Reported - English (%)
Ancestries Reported - French (%)
Ancestries Reported - French Canadian (%)
Ancestries Reported - German (%)
Ancestries Reported - Greek (%)
Ancestries Reported - Hungarian (%)
Ancestries Reported - Irish (%)
Ancestries Reported - Italian (%)
Ancestries Reported - Lithuanian (%)
Ancestries Reported - Norwegian (%)
Ancestries Reported - Polish (%)
Ancestries Reported - Portuguese (%)
Ancestries Reported - Russian (%)
Ancestries Reported - Scotch-Irish (%)
Ancestries Reported - Scottish (%)
Ancestries Reported - Slovak (%)
Ancestries Reported - Subsaharan African (%)
Ancestries Reported - Swedish (%)
Ancestries Reported - Swiss (%)
Ancestries Reported - Ukrainian (%)
Ancestries Reported - United States (%)
Ancestries Reported - Welsh (%)
Ancestries Reported - West Indian (%)
Ancestries Reported - Other (%)
Educational Attainment - No schooling completed (%)
Educational Attainment - Less than high school (%)
Educational Attainment - High school or equivalent (%)
Educational Attainment - Less than 1 year of college (%)
Educational Attainment - 1 or more years of college (%)
Educational Attainment - Associate degree (%)
Educational Attainment - Bachelor's degree (%)
Educational Attainment - Master's degree (%)
Educational Attainment - Professional school degree (%)
Educational Attainment - Doctorate degree (%)
School Enrollment - Nursery, preschool (%)
School Enrollment - Kindergarten (%)
School Enrollment - Grade 1 to 4 (%)
School Enrollment - Grade 5 to 8 (%)
School Enrollment - Grade 9 to 12 (%)
School Enrollment - College undergrad (%)
School Enrollment - Graduate or professional (%)
School Enrollment - Not enrolled in school (%)
School enrollment - Public schools (%)
School enrollment - Private schools (%)
School enrollment - Not enrolled (%)
Median number of rooms in houses and condos
Median number of rooms in apartments
Housing units lacking complete plumbing facilities (%)
Housing units lacking complete kitchen facilities (%)
Density of houses
Urban houses (%)
Rural houses (%)
Households with people 60 years and over (%)
Households with people 65 years and over (%)
Households with people 75 years and over (%)
Households with one or more nonrelatives (%)
Households with no nonrelatives (%)
Population in households (%)
Family households (%)
Nonfamily households (%)
Population in families (%)
Family households with own children (%)
Median number of bedrooms in owner occupied houses
Mean number of bedrooms in owner occupied houses
Median number of bedrooms in renter occupied houses
Mean number of bedrooms in renter occupied houses
Median number of vehichles in owner occupied houses
Mean number of vehichles in owner occupied houses
Median number of vehichles in renter occupied houses
Mean number of vehichles in renter occupied houses
Mortgage status - with mortgage (%)
Mortgage status - with second mortgage (%)
Mortgage status - with home equity loan (%)
Mortgage status - with both second mortgage and home equity loan (%)
Mortgage status - without a mortgage (%)
Average family size
Average family size - White
Average family size - Black or African American
Average family size - Asian
Average family size - Hispanic or Latino
Average family size - American Indian and Alaska Native
Average family size - Multirace
Average family size - Other Race
Geographical mobility - Same house 1 year ago (%)
Geographical mobility - Moved within same county (%)
Geographical mobility - Moved from different county within same state (%)
Geographical mobility - Moved from different state (%)
Geographical mobility - Moved from abroad (%)
Place of birth - Born in state of residence (%)
Place of birth - Born in other state (%)
Place of birth - Native, outside of US (%)
Place of birth - Foreign born (%)
Housing units in structures - 1, detached (%)
Housing units in structures - 1, attached (%)
Housing units in structures - 2 (%)
Housing units in structures - 3 or 4 (%)
Housing units in structures - 5 to 9 (%)
Housing units in structures - 10 to 19 (%)
Housing units in structures - 20 to 49 (%)
Housing units in structures - 50 or more (%)
Housing units in structures - Mobile home (%)
Housing units in structures - Boat, RV, van, etc. (%)
House/condo owner moved in on average (years ago)
Renter moved in on average (years ago)
Year householder moved into unit - Moved in 1999 to March 2000 (%)
Year householder moved into unit - Moved in 1995 to 1998 (%)
Year householder moved into unit - Moved in 1990 to 1994 (%)
Year householder moved into unit - Moved in 1980 to 1989 (%)
Year householder moved into unit - Moved in 1970 to 1979 (%)
Year householder moved into unit - Moved in 1969 or earlier (%)
Means of transportation to work - Drove car alone (%)
Means of transportation to work - Carpooled (%)
Means of transportation to work - Public transportation (%)
Means of transportation to work - Bus or trolley bus (%)
Means of transportation to work - Streetcar or trolley car (%)
Means of transportation to work - Subway or elevated (%)
Means of transportation to work - Railroad (%)
Means of transportation to work - Ferryboat (%)
Means of transportation to work - Taxicab (%)
Means of transportation to work - Motorcycle (%)
Means of transportation to work - Bicycle (%)
Means of transportation to work - Walked (%)
Means of transportation to work - Other means (%)
Working at home (%)
Industry diversity
Most Common Industries - Agriculture, forestry, fishing and hunting, and mining (%)
Most Common Industries - Agriculture, forestry, fishing and hunting (%)
Most Common Industries - Mining, quarrying, and oil and gas extraction (%)
Most Common Industries - Construction (%)
Most Common Industries - Manufacturing (%)
Most Common Industries - Wholesale trade (%)
Most Common Industries - Retail trade (%)
Most Common Industries - Transportation and warehousing, and utilities (%)
Most Common Industries - Transportation and warehousing (%)
Most Common Industries - Utilities (%)
Most Common Industries - Information (%)
Most Common Industries - Finance and insurance, and real estate and rental and leasing (%)
Most Common Industries - Finance and insurance (%)
Most Common Industries - Real estate and rental and leasing (%)
Most Common Industries - Professional, scientific, and management, and administrative and waste management services (%)
Most Common Industries - Professional, scientific, and technical services (%)
Most Common Industries - Management of companies and enterprises (%)
Most Common Industries - Administrative and support and waste management services (%)
Most Common Industries - Educational services, and health care and social assistance (%)
Most Common Industries - Educational services (%)
Most Common Industries - Health care and social assistance (%)
Most Common Industries - Arts, entertainment, and recreation, and accommodation and food services (%)
Most Common Industries - Arts, entertainment, and recreation (%)
Most Common Industries - Accommodation and food services (%)
Most Common Industries - Other services, except public administration (%)
Most Common Industries - Public administration (%)
Occupation diversity
Most Common Occupations - Management, business, science, and arts occupations (%)
Most Common Occupations - Management, business, and financial occupations (%)
Most Common Occupations - Management occupations (%)
Most Common Occupations - Business and financial operations occupations (%)
Most Common Occupations - Computer, engineering, and science occupations (%)
Most Common Occupations - Computer and mathematical occupations (%)
Most Common Occupations - Architecture and engineering occupations (%)
Most Common Occupations - Life, physical, and social science occupations (%)
Most Common Occupations - Education, legal, community service, arts, and media occupations (%)
Most Common Occupations - Community and social service occupations (%)
Most Common Occupations - Legal occupations (%)
Most Common Occupations - Education, training, and library occupations (%)
Most Common Occupations - Arts, design, entertainment, sports, and media occupations (%)
Most Common Occupations - Healthcare practitioners and technical occupations (%)
Most Common Occupations - Health diagnosing and treating practitioners and other technical occupations (%)
Most Common Occupations - Health technologists and technicians (%)
Most Common Occupations - Service occupations (%)
Most Common Occupations - Healthcare support occupations (%)
Most Common Occupations - Protective service occupations (%)
Most Common Occupations - Fire fighting and prevention, and other protective service workers including supervisors (%)
Most Common Occupations - Law enforcement workers including supervisors (%)
Most Common Occupations - Food preparation and serving related occupations (%)
Most Common Occupations - Building and grounds cleaning and maintenance occupations (%)
Most Common Occupations - Personal care and service occupations (%)
Most Common Occupations - Sales and office occupations (%)
Most Common Occupations - Sales and related occupations (%)
Most Common Occupations - Office and administrative support occupations (%)
Most Common Occupations - Natural resources, construction, and maintenance occupations (%)
Most Common Occupations - Farming, fishing, and forestry occupations (%)
Most Common Occupations - Construction and extraction occupations (%)
Most Common Occupations - Installation, maintenance, and repair occupations (%)
Most Common Occupations - Production, transportation, and material moving occupations (%)
Most Common Occupations - Production occupations (%)
Most Common Occupations - Transportation occupations (%)
Most Common Occupations - Material moving occupations (%)
People in Group quarters - Institutionalized population (%)
People in Group quarters - Correctional institutions (%)
People in Group quarters - Federal prisons and detention centers (%)
People in Group quarters - Halfway houses (%)
People in Group quarters - Local jails and other confinement facilities (including police lockups) (%)
People in Group quarters - Military disciplinary barracks (%)
People in Group quarters - State prisons (%)
People in Group quarters - Other types of correctional institutions (%)
People in Group quarters - Nursing homes (%)
People in Group quarters - Hospitals/wards, hospices, and schools for the handicapped (%)
People in Group quarters - Hospitals/wards and hospices for chronically ill (%)
People in Group quarters - Hospices or homes for chronically ill (%)
People in Group quarters - Military hospitals or wards for chronically ill (%)
People in Group quarters - Other hospitals or wards for chronically ill (%)
People in Group quarters - Hospitals or wards for drug/alcohol abuse (%)
People in Group quarters - Mental (Psychiatric) hospitals or wards (%)
People in Group quarters - Schools, hospitals, or wards for the mentally retarded (%)
People in Group quarters - Schools, hospitals, or wards for the physically handicapped (%)
People in Group quarters - Institutions for the deaf (%)
People in Group quarters - Institutions for the blind (%)
People in Group quarters - Orthopedic wards and institutions for the physically handicapped (%)
People in Group quarters - Wards in general hospitals for patients who have no usual home elsewhere (%)
People in Group quarters - Wards in military hospitals for patients who have no usual home elsewhere (%)
People in Group quarters - Juvenile institutions (%)
People in Group quarters - Long-term care (%)
People in Group quarters - Homes for abused, dependent, and neglected children (%)
People in Group quarters - Residential treatment centers for emotionally disturbed children (%)
People in Group quarters - Training schools for juvenile delinquents (%)
People in Group quarters - Short-term care, detention or diagnostic centers for delinquent children (%)
People in Group quarters - Type of juvenile institution unknown (%)
People in Group quarters - Noninstitutionalized population (%)
People in Group quarters - College dormitories (includes college quarters off campus) (%)
People in Group quarters - Military quarters (%)
People in Group quarters - On base (%)
People in Group quarters - Barracks, unaccompanied personnel housing (UPH), (Enlisted/Officer), ;and similar group living quarters for military personnel (%)
People in Group quarters - Transient quarters for temporary residents (%)
People in Group quarters - Military ships (%)
People in Group quarters - Group homes (%)
People in Group quarters - Homes or halfway houses for drug/alcohol abuse (%)
People in Group quarters - Homes for the mentally ill (%)
People in Group quarters - Homes for the mentally retarded (%)
People in Group quarters - Homes for the physically handicapped (%)
People in Group quarters - Other group homes (%)
People in Group quarters - Religious group quarters (%)
People in Group quarters - Dormitories (%)
People in Group quarters - Agriculture workers' dormitories on farms (%)
People in Group quarters - Job Corps and vocational training facilities (%)
People in Group quarters - Other workers' dormitories (%)
People in Group quarters - Crews of maritime vessels (%)
People in Group quarters - Other nonhousehold living situations (%)
People in Group quarters - Other noninstitutional group quarters (%)
Residents speaking English at home (%)
Residents speaking English at home - Born in the United States (%)
Residents speaking English at home - Native, born elsewhere (%)
Residents speaking English at home - Foreign born (%)
Residents speaking Spanish at home (%)
Residents speaking Spanish at home - Born in the United States (%)
Residents speaking Spanish at home - Native, born elsewhere (%)
Residents speaking Spanish at home - Foreign born (%)
Residents speaking other language at home (%)
Residents speaking other language at home - Born in the United States (%)
Residents speaking other language at home - Native, born elsewhere (%)
Residents speaking other language at home - Foreign born (%)
Class of Workers - Employee of private company (%)
Class of Workers - Self-employed in own incorporated business (%)
Class of Workers - Private not-for-profit wage and salary workers (%)
Class of Workers - Local government workers (%)
Class of Workers - State government workers (%)
Class of Workers - Federal government workers (%)
Class of Workers - Self-employed workers in own not incorporated business and Unpaid family workers (%)
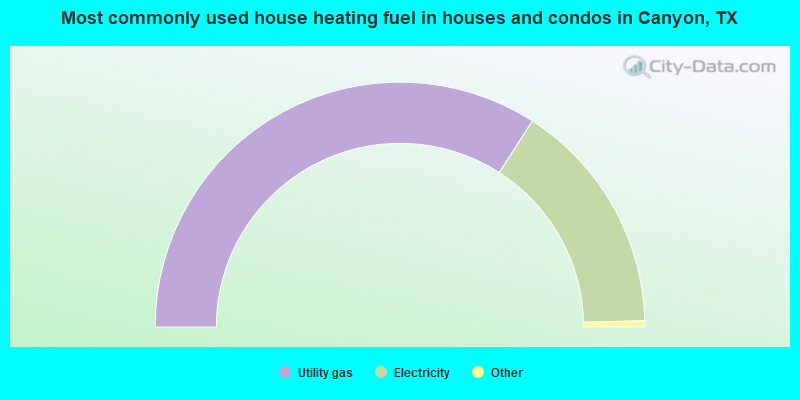
House heating fuel used in houses and condos - Utility gas (%)
House heating fuel used in houses and condos - Bottled, tank, or LP gas (%)
House heating fuel used in houses and condos - Electricity (%)
House heating fuel used in houses and condos - Fuel oil, kerosene, etc. (%)
House heating fuel used in houses and condos - Coal or coke (%)
House heating fuel used in houses and condos - Wood (%)
House heating fuel used in houses and condos - Solar energy (%)
House heating fuel used in houses and condos - Other fuel (%)
House heating fuel used in houses and condos - No fuel used (%)
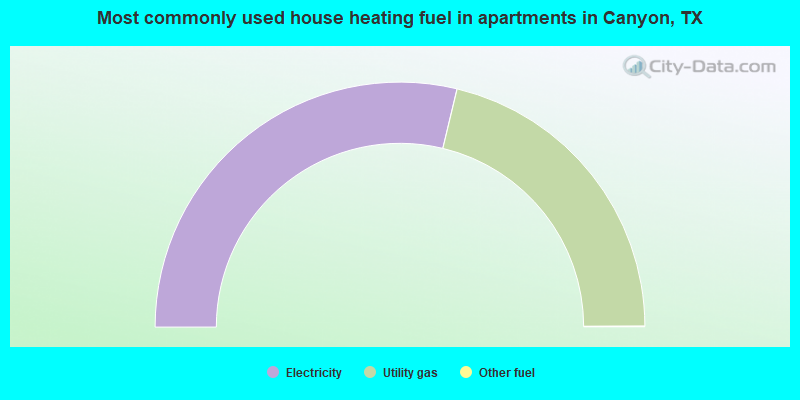
House heating fuel used in apartments - Utility gas (%)
House heating fuel used in apartments - Bottled, tank, or LP gas (%)
House heating fuel used in apartments - Electricity (%)
House heating fuel used in apartments - Fuel oil, kerosene, etc. (%)
House heating fuel used in apartments - Coal or coke (%)
House heating fuel used in apartments - Wood (%)
House heating fuel used in apartments - Solar energy (%)
House heating fuel used in apartments - Other fuel (%)
House heating fuel used in apartments - No fuel used (%)
Armed forces status - In Armed Forces (%)
Armed forces status - Civilian (%)
Armed forces status - Civilian - Veteran (%)
Armed forces status - Civilian - Nonveteran (%)
Fatal accidents locations in years 2005-2021
Fatal accidents locations in 2005
Fatal accidents locations in 2006
Fatal accidents locations in 2007
Fatal accidents locations in 2008
Fatal accidents locations in 2009
Fatal accidents locations in 2010
Fatal accidents locations in 2011
Fatal accidents locations in 2012
Fatal accidents locations in 2013
Fatal accidents locations in 2014
Fatal accidents locations in 2015
Fatal accidents locations in 2016
Fatal accidents locations in 2017
Fatal accidents locations in 2018
Fatal accidents locations in 2019
Fatal accidents locations in 2020
Fatal accidents locations in 2021
Alcohol use - People drinking some alcohol every month (%)
Alcohol use - People not drinking at all (%)
Alcohol use - Average days/month drinking alcohol
Alcohol use - Average drinks/week
Alcohol use - Average days/year people drink much
Audiometry - Average condition of hearing (%)
Audiometry - People that can hear a whisper from across a quiet room (%)
Audiometry - People that can hear normal voice from across a quiet room (%)
Audiometry - Ears ringing, roaring, buzzing (%)
Audiometry - Had a job exposure to loud noise (%)
Audiometry - Had off-work exposure to loud noise (%)
Blood Pressure & Cholesterol - Has high blood pressure (%)
Blood Pressure & Cholesterol - Checking blood pressure at home (%)
Blood Pressure & Cholesterol - Frequently checking blood cholesterol (%)
Blood Pressure & Cholesterol - Has high cholesterol level (%)
Consumer Behavior - Money monthly spent on food at supermarket/grocery store
Consumer Behavior - Money monthly spent on food at other stores
Consumer Behavior - Money monthly spent on eating out
Consumer Behavior - Money monthly spent on carryout/delivered foods
Consumer Behavior - Income spent on food at supermarket/grocery store (%)
Consumer Behavior - Income spent on food at other stores (%)
Consumer Behavior - Income spent on eating out (%)
Consumer Behavior - Income spent on carryout/delivered foods (%)
Current Health Status - General health condition (%)
Current Health Status - Blood donors (%)
Current Health Status - Has blood ever tested for HIV virus (%)
Current Health Status - Left-handed people (%)
Dermatology - People using sunscreen (%)
Diabetes - Diabetics (%)
Diabetes - Had a blood test for high blood sugar (%)
Diabetes - People taking insulin (%)
Diet Behavior & Nutrition - Diet health (%)
Diet Behavior & Nutrition - Milk product consumption (# of products/month)
Diet Behavior & Nutrition - Meals not home prepared (#/week)
Diet Behavior & Nutrition - Meals from fast food or pizza place (#/week)
Diet Behavior & Nutrition - Ready-to-eat foods (#/month)
Diet Behavior & Nutrition - Frozen meals/pizza (#/month)
Drug Use - People that ever used marijuana or hashish (%)
Drug Use - Ever used hard drugs (%)
Drug Use - Ever used any form of cocaine (%)
Drug Use - Ever used heroin (%)
Drug Use - Ever used methamphetamine (%)
Health Insurance - People covered by health insurance (%)
Kidney Conditions-Urology - Avg. # of times urinating at night
Medical Conditions - People with asthma (%)
Medical Conditions - People with anemia (%)
Medical Conditions - People with psoriasis (%)
Medical Conditions - People with overweight (%)
Medical Conditions - Elderly people having difficulties in thinking or remembering (%)
Medical Conditions - People who ever received blood transfusion (%)
Medical Conditions - People having trouble seeing even with glass/contacts (%)
Medical Conditions - People with arthritis (%)
Medical Conditions - People with gout (%)
Medical Conditions - People with congestive heart failure (%)
Medical Conditions - People with coronary heart disease (%)
Medical Conditions - People with angina pectoris (%)
Medical Conditions - People who ever had heart attack (%)
Medical Conditions - People who ever had stroke (%)
Medical Conditions - People with emphysema (%)
Medical Conditions - People with thyroid problem (%)
Medical Conditions - People with chronic bronchitis (%)
Medical Conditions - People with any liver condition (%)
Medical Conditions - People who ever had cancer or malignancy (%)
Mental Health - People who have little interest in doing things (%)
Mental Health - People feeling down, depressed, or hopeless (%)
Mental Health - People who have trouble sleeping or sleeping too much (%)
Mental Health - People feeling tired or having little energy (%)
Mental Health - People with poor appetite or overeating (%)
Mental Health - People feeling bad about themself (%)
Mental Health - People who have trouble concentrating on things (%)
Mental Health - People moving or speaking slowly or too fast (%)
Mental Health - People having thoughts they would be better off dead (%)
Oral Health - Average years since last visit a dentist
Oral Health - People embarrassed because of mouth (%)
Oral Health - People with gum disease (%)
Oral Health - General health of teeth and gums (%)
Oral Health - Average days a week using dental floss/device
Oral Health - Average days a week using mouthwash for dental problem
Oral Health - Average number of teeth
Pesticide Use - Households using pesticides to control insects (%)
Pesticide Use - Households using pesticides to kill weeds (%)
Physical Activity - People doing vigorous-intensity work activities (%)
Physical Activity - People doing moderate-intensity work activities (%)
Physical Activity - People walking or bicycling (%)
Physical Activity - People doing vigorous-intensity recreational activities (%)
Physical Activity - People doing moderate-intensity recreational activities (%)
Physical Activity - Average hours a day doing sedentary activities
Physical Activity - Average hours a day watching TV or videos
Physical Activity - Average hours a day using computer
Physical Functioning - People having limitations keeping them from working (%)
Physical Functioning - People limited in amount of work they can do (%)
Physical Functioning - People that need special equipment to walk (%)
Physical Functioning - People experiencing confusion/memory problems (%)
Physical Functioning - People requiring special healthcare equipment (%)
Prescription Medications - Average number of prescription medicines taking
Preventive Aspirin Use - Adults 40+ taking low-dose aspirin (%)
Reproductive Health - Vaginal deliveries (%)
Reproductive Health - Cesarean deliveries (%)
Reproductive Health - Deliveries resulted in a live birth (%)
Reproductive Health - Pregnancies resulted in a delivery (%)
Reproductive Health - Women breastfeeding newborns (%)
Reproductive Health - Women that had a hysterectomy (%)
Reproductive Health - Women that had both ovaries removed (%)
Reproductive Health - Women that have ever taken birth control pills (%)
Reproductive Health - Women taking birth control pills (%)
Reproductive Health - Women that have ever used Depo-Provera or injectables (%)
Reproductive Health - Women that have ever used female hormones (%)
Sexual Behavior - People 18+ that ever had sex (vaginal, anal, or oral) (%)
Sexual Behavior - Males 18+ that ever had vaginal sex with a woman (%)
Sexual Behavior - Males 18+ that ever performed oral sex on a woman (%)
Sexual Behavior - Males 18+ that ever had anal sex with a woman (%)
Sexual Behavior - Males 18+ that ever had any sex with a man (%)
Sexual Behavior - Females 18+ that ever had vaginal sex with a man (%)
Sexual Behavior - Females 18+ that ever performed oral sex on a man (%)
Sexual Behavior - Females 18+ that ever had anal sex with a man (%)
Sexual Behavior - Females 18+ that ever had any kind of sex with a woman (%)
Sexual Behavior - Average age people first had sex
Sexual Behavior - Average number of female sex partners in lifetime (males 18+)
Sexual Behavior - Average number of female vaginal sex partners in lifetime (males 18+)
Sexual Behavior - Average age people first performed oral sex on a woman (18+)
Sexual Behavior - Average number of woman performed oral sex on in lifetime (18+)
Sexual Behavior - Average number of male sex partners in lifetime (males 18+)
Sexual Behavior - Average number of male anal sex partners in lifetime (males 18+)
Sexual Behavior - Average age people first performed oral sex on a man (18+)
Sexual Behavior - Average number of male oral sex partners in lifetime (18+)
Sexual Behavior - People using protection when performing oral sex (%)
Sexual Behavior - Average number of times people have vaginal or anal sex a year
Sexual Behavior - People having sex without condom (%)
Sexual Behavior - Average number of male sex partners in lifetime (females 18+)
Sexual Behavior - Average number of male vaginal sex partners in lifetime (females 18+)
Sexual Behavior - Average number of female sex partners in lifetime (females 18+)
Sexual Behavior - Circumcised males 18+ (%)
Sleep Disorders - Average hours sleeping at night
Sleep Disorders - People that has trouble sleeping (%)
Smoking-Cigarette Use - People smoking cigarettes (%)
Taste & Smell - People 40+ having problems with smell (%)
Taste & Smell - People 40+ having problems with taste (%)
Taste & Smell - People 40+ that ever had wisdom teeth removed (%)
Taste & Smell - People 40+ that ever had tonsils teeth removed (%)
Taste & Smell - People 40+ that ever had a loss of consciousness because of a head injury (%)
Taste & Smell - People 40+ that ever had a broken nose or other serious injury to face or skull (%)
Taste & Smell - People 40+ that ever had two or more sinus infections (%)
Weight - Average height (inches)
Weight - Average weight (pounds)
Weight - Average BMI
Weight - People that are obese (%)
Weight - People that ever were obese (%)
Weight - People trying to lose weight (%)
Officers per 1,000 residents here:
1.55Texas average:
2.07
Latest news from Canyon, TX collected exclusively by city-data.com from local newspapers, TV, and radio stations
Ancestries: German (15.7%), American (13.1%), English (7.6%), Scottish (6.2%), Irish (5.5%), European (2.0%).
Current Local Time:
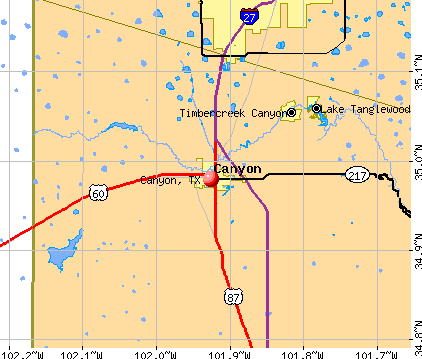
Land area: 4.95 square miles.
Population density: 3,185 people per square mile (average).
1,060 residents are foreign born (3.6% Latin America , 1.4% Asia , 1.1% Europe ).
This city:
6.8%Texas:
17.1%
Median real estate property taxes paid for housing units with mortgages in 2022: $4,141 (1.5%)Median real estate property taxes paid for housing units with no mortgage in 2022: $2,778 (1.3%)
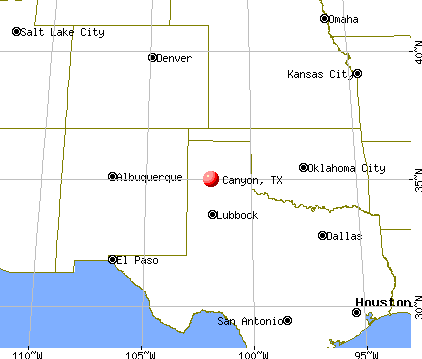
Nearest city with pop. 50,000+: Amarillo, TX
Nearest city with pop. 200,000+: Oklahoma City, OK
Nearest city with pop. 1,000,000+: Dallas, TX
Nearest cities:
Latitude: 34.98 N, Longitude: 101.93 W
Daytime population change due to commuting: -1,029 (-6.6%)Workers who live and work in this city: 3,351 (44.4%)
Property values in Canyon, TX
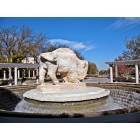
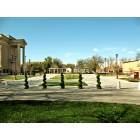
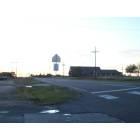
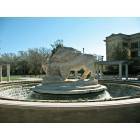
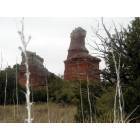
Canyon tourist attractions:
Single-family new house construction building permits:
2022: 79 buildings , average cost: $246,5002021: 120 buildings , average cost: $239,2002020: 150 buildings , average cost: $233,1002019: 89 buildings , average cost: $237,5002018: 81 buildings , average cost: $244,0002017: 62 buildings , average cost: $277,7002016: 74 buildings , average cost: $230,3002015: 47 buildings , average cost: $238,8002014: 22 buildings , average cost: $259,7002013: 61 buildings , average cost: $224,4002012: 53 buildings , average cost: $218,4002011: 45 buildings , average cost: $201,7002010: 57 buildings , average cost: $193,2002009: 35 buildings , average cost: $169,9002008: 22 buildings , average cost: $189,3002007: 18 buildings , average cost: $220,6002006: 27 buildings , average cost: $219,7002005: 25 buildings , average cost: $174,8002004: 26 buildings , average cost: $182,1002003: 23 buildings , average cost: $160,5002002: 36 buildings , average cost: $115,3002001: 23 buildings , average cost: $130,4002000: 19 buildings , average cost: $136,3001999: 14 buildings , average cost: $168,0001998: 33 buildings , average cost: $100,2001997: 41 buildings , average cost: $113,100Unemployment in December 2023:
Population change in the 1990s: +1,452 (+12.7%).
Most common occupations in Canyon, TX (%)
Both Males Females
Preschool, kindergarten, elementary, and middle school teachers (6.4%)
Other management occupations, except farmers and farm managers (4.7%)
Retail sales workers, except cashiers (4.2%)
Building and grounds cleaning and maintenance occupations (3.5%)
Other sales and related occupations, including supervisors (3.4%)
Waiters and waitresses (2.9%)
Secretaries and administrative assistants (2.8%)
Other sales and related occupations, including supervisors (5.8%)
Other management occupations, except farmers and farm managers (5.3%)
Retail sales workers, except cashiers (4.6%)
Building and grounds cleaning and maintenance occupations (4.2%)
Electrical equipment mechanics and other installation, maintenance, and repair workers, including supervisors (4.2%)
Sales representatives, services, wholesale and manufacturing (3.8%)
Driver/sales workers and truck drivers (3.0%)
Preschool, kindergarten, elementary, and middle school teachers (11.0%)
Secretaries and administrative assistants (6.1%)
Child care workers (5.8%)
Waiters and waitresses (4.3%)
Other management occupations, except farmers and farm managers (4.2%)
Retail sales workers, except cashiers (3.8%)
Other office and administrative support workers, including supervisors (3.8%)
Tornado activity:
Canyon-area historical tornado activity is slightly above Texas state average. It is 71% greater than the overall U.S. average.
On 4/18/1970, a category F4 (max. wind speeds 207-260 mph) tornado 32.0 miles away from the Canyon city center killed 16 people and injured 42 people and caused between $500,000 and $5,000,000 in damages.
On 5/9/1982, a category F3 (max. wind speeds 158-206 mph) tornado 14.7 miles away from the city center injured one person and caused between $500,000 and $5,000,000 in damages.
Earthquake activity:
Canyon-area historical earthquake activity is significantly above Texas state average. It is 527% greater than the overall U.S. average. On 6/16/1978 at 11:46:54, a magnitude 5.3 (4.4 MB, 4.6 UK, 5.3 ML, Class: Moderate, Intensity: VI - VII) earthquake occurred 150.3 miles away from the city center On 9/3/2016 at 12:02:44, a magnitude 5.8 (5.8 MW, Depth: 3.5 mi) earthquake occurred 297.9 miles away from the city center On 8/23/2011 at 05:46:18, a magnitude 5.3 (5.3 MW, Depth: 2.5 mi) earthquake occurred 211.8 miles away from the city center On 11/6/2011 at 03:53:10, a magnitude 5.7 (5.7 MW, Depth: 3.2 mi) earthquake occurred 294.0 miles away from the city center On 2/13/2016 at 17:07:06, a magnitude 5.1 (5.1 MW, Depth: 5.2 mi) earthquake occurred 208.6 miles away from the city center On 1/2/1992 at 11:45:35, a magnitude 5.0 (4.6 MB, 5.0 LG, Depth: 3.1 mi) earthquake occurred 195.0 miles away from the city center Magnitude types: regional Lg-wave magnitude (LG), body-wave magnitude (MB), local magnitude (ML), moment magnitude (MW) Natural disasters: The number of natural disasters in Randall County (11) is smaller than the US average (15).Major Disasters (Presidential) Declared: 3Emergencies Declared: 5Fires: 4, Hurricanes: 4, Flood: 1, Storm: 1, Tornado: 1, Winter Storm: 1, Other: 1 (Note: some incidents may be assigned to more than one category). Hospitals and medical centers in Canyon: HOSPICE OF CANYON (4 HOSPITAL DRIVE) IDLEWOOD COMMUNITY HOME (4 IDLEWOOD) PALO DURO HOSPITAL (P O BOX 359) CANYON HEALTHCARE (15 HOSPITAL DR)
College/University in Canyon: West Texas A & M University Full-time enrollment: 6,820; Location: 2501 4th Ave; Public; Website: www.wtamu.edu; Offers Doctor's degree )
Other colleges/universities with over 2000 students near Canyon:
Amarillo College (about 16 miles; Amarillo, TX ; Full-time enrollment: 6,622)
Wayland Baptist University (about 56 miles; Plainview, TX ; FT enrollment: 5,526)
Texas Tech University Health Sciences Center (about 96 miles; Lubbock, TX ; FT enrollment: 3,269)
Texas Tech University (about 97 miles; Lubbock, TX ; FT enrollment: 29,251)
Eastern New Mexico University-Main Campus (about 99 miles; Portales, NM ; FT enrollment: 4,263)
South Plains College (about 101 miles; Levelland, TX ; FT enrollment: 7,007)
Western Oklahoma State College (about 149 miles; Altus, OK ; FT enrollment: 2,054)
Public high school in Canyon: CANYON H S Students: 674, Location: 1701 23RD ST, Grades: 9-12)Public elementary/middle schools in Canyon: CANYON J H Students: 1,069, Location: 910 9TH AVE, Grades: 7-8)REEVES-HINGER EL Students: 750, Location: 1005 21ST ST, Grades: PK-4)CANYON INT Students: 591, Location: 506 8TH ST, Grades: 5-6)CRESTVIEW EL Students: 467, Location: 80 HUNSLEY RD, Grades: PK-4)See full list of schools located in Canyon Library in Canyon: CANYON AREA LIBRARY Operating income: $292,135; Location: 1501 3RD AVE; 45,553 books ; 361 e-books ; 3,334 audio materials ; 2,298 video materials ; 50 state licensed databases ; 4 other licensed databases ; 74 print serial subscriptions )
Notable locations in Canyon: (A) , Canyon Fire Department Station 2 (B) , Panhandle-Plains Historical Museum (C) , Canyon Fire Department Station 1 (D) . Display/hide their locations on the map
Churches in Canyon include: (A) , First Baptist Church of Canyon (B) , Presbyterian Church of Canyon (C) , United Pentecostal Church of Canyon (D) , Saint Paul Lutheran Church (E) , Saint Georges Episcopal Church (F) , Church of Christ - University (G) . Display/hide their locations on the map
Parks in Canyon include: (1) , Conner Park (2) . Display/hide their locations on the map
Hotel:
Birthplace of: Christopher Yohmei Blasdel - Musician, Dalton Bell - Football player.
Randall County has a predicted average indoor radon screening level between 2 and 4 pCi/L (pico curies per liter) - Moderate Potential Drinking water stations with addresses in Canyon and their reported violations in the past:
CANYON MUNICIPAL WATER SYSTEM (Population served: 13,300, Purch surface water):
Past monitoring violations:
Lead Consumer Notice - In DEC-30-2013, Contaminant: Lead and Copper Rule
Drinking water stations with addresses in Canyon that have no violations reported:
COURTS OF AMARILLO (Population served: 400, Primary Water Source Type: Groundwater)
Average household size: This city:
2.3 peopleTexas:
2.8 people
Percentage of family households: This city:
56.4%Whole state:
69.9%
Percentage of households with unmarried partners: This city:
4.4%Whole state:
6.0%
Likely homosexual households (counted as self-reported same-sex unmarried-partner households)
Lesbian couples: 0.3% of all households Gay men: 0.2% of all households
People in group quarters in Canyon in 2010:
1,201 people in college/university student housing
66 people in nursing facilities/skilled-nursing facilities
14 people in residential treatment centers for adults
7 people in group homes intended for adults
People in group quarters in Canyon in 2000:
1,103 people in college dormitories (includes college quarters off campus)
157 people in local jails and other confinement facilities (including police lockups)
60 people in homes for the physically handicapped
30 people in nursing homes
12 people in homes for the mentally retarded
2 people in other noninstitutional group quarters
Arena or stadium:
First United Bank Center. West Texas A&M University.
Banks with branches in Canyon (2011 data):
First United Bank: Canyon Branch at 801 23rd Street, branch established on 2005/12/12. Info updated 2007/02/12: Bank assets: $1,081.2 mil, Deposits: $962.8 mil, headquarters in Dimmitt, TX, positive income , Agricultural Specialization, 18 total offices , Holding Company: Plains Bancorp, Inc.
Wells Fargo Bank, National Association: Canyon Branch at 2111 4th Ave, branch established on 1900/01/01. Info updated 2011/04/05: Bank assets: $1,161,490.0 mil, Deposits: $905,653.0 mil, headquarters in Sioux Falls, SD, positive income , 6395 total offices , Holding Company: Wells Fargo & Company
Happy State Bank: Canyon Branch at 1908 4th Avenue, branch established on 1990/05/01. Info updated 2011/07/12: Bank assets: $1,840.0 mil, Deposits: $1,625.4 mil, headquarters in Happy, TX, positive income , Agricultural Specialization, 29 total offices , Holding Company: Happy Bancshares, Inc.
Bank of America, National Association: Canyon Branch at 1700 East 4th Avenue, branch established on 1967/02/18. Info updated 2009/11/18: Bank assets: $1,451,969.3 mil, Deposits: $1,077,176.8 mil, headquarters in Charlotte, NC, positive income , 5782 total offices , Holding Company: Bank Of America Corporation
First National Bank Texas: Canyon Banking Center - Rc 895 at 1701 North 23rd St., branch established on 2005/03/23. Info updated 2006/11/03: Bank assets: $944.3 mil, Deposits: $815.9 mil, headquarters in Killeen, TX, positive income , Mortgage Lending Specialization, 250 total offices , Holding Company: First Community Bancshares, Inc.
For population 15 years and over in Canyon:
Never married: 43.1%Now married: 42.6%Separated: 0.3%Widowed: 3.2%Divorced: 10.7% For population 25 years and over in Canyon:
High school or higher: 94.5%Bachelor's degree or higher: 45.8%Graduate or professional degree: 15.5%Unemployed: 8.8%Mean travel time to work (commute): 19.2 minutes
Education Gini index (Inequality in education) Here:
11.4Texas average:
14.0
Religion statistics for Canyon, TX (based on Randall County data)
Religion Adherents Congregations Evangelical Protestant 59,132 81 Mainline Protestant 6,465 11 Other 3,612 6 Catholic 1,561 2 None 49,955 -
Source: Clifford Grammich, Kirk Hadaway, Richard Houseal, Dale E.Jones, Alexei Krindatch, Richie Stanley and Richard H.Taylor. 2012. 2010 U.S.Religion Census: Religious Congregations & Membership Study. Association of Statisticians of American Religious Bodies. Jones, Dale E., et al. 2002. Congregations and Membership in the United States 2000. Nashville, TN: Glenmary Research Center. Graphs represent county-level data
Food Environment Statistics: Number of grocery stores : 6Randall County :
0.53 / 10,000 pop.State :
1.47 / 10,000 pop.
Number of supercenters and club stores : 2Randall County :
0.18 / 10,000 pop.Texas :
0.14 / 10,000 pop.
Number of convenience stores (no gas) : 2This county :
0.18 / 10,000 pop.Texas :
1.11 / 10,000 pop.
Number of convenience stores (with gas) : 41This county :
3.62 / 10,000 pop.State :
3.95 / 10,000 pop.
Number of full-service restaurants : 51Randall County :
4.50 / 10,000 pop.Texas :
6.13 / 10,000 pop.
Adult diabetes rate : This county :
8.6%Texas :
8.9%
Adult obesity rate : Randall County :
25.2%Texas :
26.6%
Low-income preschool obesity rate : Health and Nutrition:
Average overall health of teeth and gums : People feeling badly about themselves : People not drinking alcohol at all : Average hours sleeping at night : Overweight people : This city:
30.7%Texas:
33.1%
General health condition : Average condition of hearing : This city:
82.9%Texas:
80.7%
More about Health and Nutrition of Canyon, TX Residents
Local government employment and payroll (March 2022)
Function
Full-time employees
Monthly full-time payroll
Average yearly full-time wage
Part-time employees
Monthly part-time payroll
Police Protection - Officers
27 $114,078 $50,701 0 $0 Water Supply
11 $40,084 $43,728 0 $0 Solid Waste Management
9 $30,128 $40,171 0 $0 Streets and Highways
8 $30,356 $45,534 0 $0 Parks and Recreation
8 $35,904 $53,856 3 $2,783 Other Government Administration
7 $62,944 $107,904 0 $0 Firefighters
7 $38,707 $66,355 0 $0 Sewerage
5 $23,396 $56,150 0 $0 Other and Unallocable
5 $39,095 $93,828 0 $0 Local Libraries
3 $15,396 $61,584 9 $7,380 Financial Administration
2 $16,094 $96,564 0 $0 Police - Other
2 $8,492 $50,952 0 $0 Fire - Other
1 $4,792 $57,504 0 $0 Judicial and Legal
1 $5,138 $61,656 1 $2,500
Totals for Government
96 $464,605 $58,076 13 $12,663
Canyon government finances - Expenditure in 2017 (per resident):
Current Operations - Water Utilities: $2,506,000 ($158.90)
Police Protection: $2,275,000 ($144.25)Parks and Recreation: $905,000 ($57.38)General - Other: $854,000 ($54.15)Local Fire Protection: $807,000 ($51.17)Solid Waste Management: $789,000 ($50.03)Central Staff Services: $699,000 ($44.32)Sewerage: $512,000 ($32.46)Libraries: $434,000 ($27.52)General Public Buildings: $387,000 ($24.54)Financial Administration: $175,000 ($11.10)Judicial and Legal Services: $76,000 ($4.82)General - Interest on Debt: $510,000 ($32.34)
Intergovernmental to Local - Other - Local Fire Protection: $168,000 ($10.65)
Other Capital Outlay - Police Protection: $75,000 ($4.76)
Total Salaries and Wages: $4,308,000 ($273.16)
Canyon government finances - Revenue in 2017 (per resident):
Charges - Sewerage: $2,347,000 ($148.82)
Solid Waste Management: $1,553,000 ($98.47)Parks and Recreation: $80,000 ($5.07)Federal Intergovernmental - Sewerage: $500,000 ($31.70)
Local Intergovernmental - General Local Government Support: $2,000 ($0.13)
Miscellaneous - Fines and Forfeits: $320,000 ($20.29)
Donations From Private Sources: $100,000 ($6.34)Rents: $78,000 ($4.95)Interest Earnings: $40,000 ($2.54)General Revenue - Other: $17,000 ($1.08)Revenue - Water Utilities: $4,504,000 ($285.59)
State Intergovernmental - General Local Government Support: $11,000 ($0.70)
Tax - Property: $2,368,000 ($150.15)
General Sales and Gross Receipts: $2,056,000 ($130.37)Public Utilities Sales: $622,000 ($39.44)
Canyon government finances - Debt in 2017 (per resident):
Long Term Debt - Beginning Outstanding - Unspecified Public Purpose: $12,745,000 ($808.13)
Outstanding Unspecified Public Purpose: $12,745,000 ($808.13)
Canyon government finances - Cash and Securities in 2017 (per resident):
Other Funds - Cash and Securities: $10,114,000 ($641.30)
Businesses in Canyon, TX
Name Count Name Count
Ace Hardware 1 Pizza Hut 1 Best Western 1 Quiznos 1 Chick-Fil-A 1 SONIC Drive-In 1 Domino's Pizza 1 Subway 2 FedEx 2 Taco Bell 1 H&R Block 1 U-Haul 1 Holiday Inn 1 UPS 2 Knights Inn 1 Walmart 1 MasterBrand Cabinets 1 Wendy's 1 McDonald's 1
Strongest AM radio stations in Canyon:
KZRK (1550 AM; 1 kW; CANYON, TX; Owner: CUMULUS LICENSING CORP.)
KPUR (1440 AM; 5 kW; AMARILLO, TX; Owner: CUMULUS LICENSING CORP.)
KIXZ (940 AM; 5 kW; AMARILLO, TX; Owner: CAPSTAR TX LIMITED PARTNERSHIP)
KTNZ (1010 AM; 5 kW; AMARILLO, TX; Owner: AMIGO RADIO, LTD.)
KGNC (710 AM; 10 kW; AMARILLO, TX; Owner: MCC RADIO, LLC)
KICA (980 AM; 50 kW; CLOVIS, NM; Owner: BROADCAST ENTERTAINMENT CORPORATION)
KMUL (1380 AM; 50 kW; MULESHOE, TX; Owner: BROADCAST ENTERTAINMENT CORPORATION)
KZIP (1310 AM; 1 kW; AMARILLO, TX; Owner: DEL NORTE COMMUNICATIONS, INC.)
KGYN (1210 AM; 50 kW; GUYMON, OK; Owner: TELNS BROADCASTING COMPANY, INC.)
KIJN (1060 AM; daytime; 10 kW; FARWELL, TX; Owner: METROPOLITIAN RADIO GROUP, INC.)
KINF (1020 AM; 50 kW; ROSWELL, NM; Owner: JAMES CRYSTAL HOLDINGS OF NEW MEXICO, INC.)
KKOB (770 AM; 50 kW; ALBUQUERQUE, NM; Owner: CITADEL BROADCASTING COMPANY)
KVOP (1090 AM; 5 kW; PLAINVIEW, TX; Owner: EQUICOM, INC)
Strongest FM radio stations in Canyon:
KWTS (91.1 FM; CANYON, TX; Owner: WEST TEXAS A&M UNIVERSITY)
KPUR-FM (107.1 FM; CANYON, TX; Owner: CUMULUS LICENSING CORP.)
KXGL (100.9 FM; AMARILLO, TX; Owner: FEUER/MCCORD COMMUNICATIONS, INC.)
KGNC-FM (97.9 FM; AMARILLO, TX; Owner: MCC RADIO, LLC)
KMXJ-FM (94.1 FM; AMARILLO, TX; Owner: CAPSTAR TX LIMITED PARTNERSHIP)
KZRK-FM (107.9 FM; CANYON, TX; Owner: CUMULUS LICENSING CORP.)
KACV-FM (89.9 FM; AMARILLO, TX; Owner: AMARILLO JUNIOR COLLEGE DISTRICT)
KBZD (99.7 FM; AMARILLO, TX; Owner: AMIGO RADIO, LTD.)
KPRF (98.7 FM; AMARILLO, TX; Owner: CAPSTAR TX LIMITED PARTNERSHIP)
KATP (101.9 FM; AMARILLO, TX; Owner: AMFM RADIO LICENSES, L.L.C.)
KQIZ-FM (93.1 FM; AMARILLO, TX; Owner: CUMULUS LICENSING CORP.)
KMML-FM (96.9 FM; AMARILLO, TX; Owner: CAPSTAR TX LIMITED PARTNERSHIP)
KBTE (104.9 FM; TULIA, TX; Owner: DOVE MEDIA, INC.)
KQFX (104.3 FM; BORGER, TX; Owner: AMIGO RADIO, LTD.)
KXRI (91.9 FM; AMARILLO, TX; Owner: EDUCATIONAL MEDIA FOUNDATION)
KAEZ (105.7 FM; AMARILLO, TX; Owner: KXOJ, INC.)
KXLV (89.1 FM; AMARILLO, TX; Owner: EDUCATIONAL MEDIA FOUNDATION)
KJRT (88.3 FM; AMARILLO, TX; Owner: TOP O' TEXAS ED B/CASTING FOUNDATION)
KJNZ (103.5 FM; HEREFORD, TX; Owner: TAHOKA RADIO, LLC)
KRGN (103.1 FM; AMARILLO, TX; Owner: FAMILY LIFE BROADCASTING, INC.)
TV broadcast stations around Canyon:
KACV-TV (Channel 2; AMARILLO, TX; Owner: AMARILLO JUNIOR COLLEGE DISTRICT)
KVII-TV (Channel 7; AMARILLO, TX; Owner: NVG-AMARILLO, LLC)
KFDA-TV (Channel 10; AMARILLO, TX; Owner: PANHANDLE TELECASTING CO.)
KCIT (Channel 14; AMARILLO, TX; Owner: MISSION BROADCASTING OF AMARILLO LICENSE, INC.)
KAMR-TV (Channel 4; AMARILLO, TX; Owner: QUORUM OF AMARILLO LICENSE, LLC)
KEAT-LP (Channel 22; AMARILLO, TX; Owner: KUVN LICENSE PARTNERSHIP, L.P.)
K25GI (Channel 25; AMARILLO, TX; Owner: NATIONAL MINORITY T.V., INC.)
KTMO-LP (Channel 36; AMARILLO, TX; Owner: ADELANTE TELEVISION LIMITED PARTNERSHIP)
K56DF (Channel 56; AMARILLO, TX; Owner: SPECTRUM MEDIA)
KCPN-LP (Channel 33; AMARILLO, TX; Owner: MISSION BROADCASTING OF AMARILLO LICENSE, INC.)
KAMT-LP (Channel 31; AMARILLO, TX; Owner: TIGER EYE BROADCASTING CORPORATION)
KTXD-LP (Channel 43; AMARILLO, TX; Owner: TIGER EYE BROADCASTING CORPORATION)
National Bridge Inventory (NBI) Statistics 50 Number of bridges656ft / 200m Total length $251,630,000 Total costs379,857 Total average daily traffic65,447 Total average daily truck traffic
New bridges - historical statistics
1 1920-1929 1 1930-1939 11 1950-1959 1 1960-1969 7 1970-1979 16 1980-1989 3 1990-1999 3 2000-2009 7 2010-2019
See full National Bridge Inventory statistics for Canyon, TX
Home Mortgage Disclosure Act Aggregated Statistics For Year 2009(Based on 3 partial tracts) A) FHA, FSA/RHS & VA B) Conventional C) Refinancings D) Home Improvement Loans E) Loans on Dwellings For 5+ Families F) Non-occupant Loans on G) Loans On Manufactured Number Average Value Number Average Value Number Average Value Number Average Value Number Average Value Number Average Value Number Average Value
LOANS ORIGINATED 45 $119,261 43 $112,878 94 $109,421 16 $28,525 2 $888,415 23 $88,446 0 $0 APPLICATIONS APPROVED, NOT ACCEPTED 2 $73,875 8 $92,182 13 $110,494 1 $2,250 0 $0 4 $62,155 0 $0 APPLICATIONS DENIED 4 $137,825 3 $112,217 20 $98,820 7 $17,984 0 $0 2 $116,415 1 $136,470 APPLICATIONS WITHDRAWN 3 $99,583 1 $175,330 16 $105,692 1 $43,660 0 $0 1 $90,340 0 $0 FILES CLOSED FOR INCOMPLETENESS 0 $0 0 $0 4 $98,270 0 $0 0 $0 0 $0 0 $0
Aggregated Statistics For Year 2008(Based on 3 partial tracts) A) FHA, FSA/RHS & VA B) Conventional C) Refinancings D) Home Improvement Loans E) Loans on Dwellings For 5+ Families F) Non-occupant Loans on G) Loans On Manufactured Number Average Value Number Average Value Number Average Value Number Average Value Number Average Value Number Average Value Number Average Value
LOANS ORIGINATED 44 $113,206 63 $100,834 43 $100,512 13 $39,904 2 $290,935 32 $85,913 1 $89,560 APPLICATIONS APPROVED, NOT ACCEPTED 2 $122,685 8 $128,079 5 $119,090 2 $22,055 0 $0 3 $91,427 1 $98,480 APPLICATIONS DENIED 3 $114,863 6 $116,023 27 $108,408 7 $17,756 1 $127,170 4 $95,950 1 $40,030 APPLICATIONS WITHDRAWN 1 $160,610 4 $116,848 8 $101,195 1 $33,600 0 $0 1 $171,050 0 $0 FILES CLOSED FOR INCOMPLETENESS 0 $0 1 $89,200 2 $41,180 0 $0 0 $0 0 $0 0 $0
Aggregated Statistics For Year 2007(Based on 3 partial tracts) A) FHA, FSA/RHS & VA B) Conventional C) Refinancings D) Home Improvement Loans E) Loans on Dwellings For 5+ Families F) Non-occupant Loans on G) Loans On Manufactured Number Average Value Number Average Value Number Average Value Number Average Value Number Average Value Number Average Value Number Average Value
LOANS ORIGINATED 16 $104,446 102 $101,191 45 $83,477 19 $39,032 2 $599,900 29 $82,289 2 $85,920 APPLICATIONS APPROVED, NOT ACCEPTED 0 $0 19 $94,912 7 $73,526 5 $20,972 0 $0 3 $81,033 0 $0 APPLICATIONS DENIED 32 $45,844 19 $90,934 28 $68,916 16 $39,769 1 $78,470 9 $59,097 3 $49,340 APPLICATIONS WITHDRAWN 2 $46,250 8 $105,206 22 $104,295 3 $30,830 0 $0 5 $74,938 0 $0 FILES CLOSED FOR INCOMPLETENESS 4 $66,392 1 $165,420 3 $74,350 0 $0 0 $0 0 $0 0 $0
Aggregated Statistics For Year 2006(Based on 3 partial tracts) A) FHA, FSA/RHS & VA B) Conventional C) Refinancings D) Home Improvement Loans E) Loans on Dwellings For 5+ Families F) Non-occupant Loans on G) Loans On Manufactured Number Average Value Number Average Value Number Average Value Number Average Value Number Average Value Number Average Value Number Average Value
LOANS ORIGINATED 24 $93,357 111 $84,639 45 $89,123 19 $31,727 1 $357,160 31 $79,085 4 $44,170 APPLICATIONS APPROVED, NOT ACCEPTED 2 $96,240 7 $88,034 8 $90,278 3 $59,623 1 $10,420 0 $0 1 $29,410 APPLICATIONS DENIED 2 $65,370 25 $89,782 26 $86,349 11 $35,106 0 $0 4 $88,518 3 $46,477 APPLICATIONS WITHDRAWN 3 $100,917 11 $99,132 26 $87,069 1 $25,680 0 $0 2 $48,710 0 $0 FILES CLOSED FOR INCOMPLETENESS 2 $91,270 2 $192,965 8 $94,475 1 $26,970 0 $0 0 $0 0 $0
Aggregated Statistics For Year 2005(Based on 3 partial tracts) A) FHA, FSA/RHS & VA B) Conventional C) Refinancings D) Home Improvement Loans E) Loans on Dwellings For 5+ Families F) Non-occupant Loans on G) Loans On Manufactured Number Average Value Number Average Value Number Average Value Number Average Value Number Average Value Number Average Value Number Average Value
LOANS ORIGINATED 27 $83,245 108 $86,099 72 $79,848 17 $28,998 1 $203,450 35 $72,396 1 $22,800 APPLICATIONS APPROVED, NOT ACCEPTED 2 $72,980 14 $73,634 11 $66,970 2 $47,630 0 $0 7 $92,576 3 $59,720 APPLICATIONS DENIED 1 $32,330 21 $70,948 41 $72,019 13 $32,059 0 $0 4 $90,830 8 $43,696 APPLICATIONS WITHDRAWN 1 $94,590 7 $141,299 22 $80,162 6 $158,367 0 $0 2 $192,610 0 $0 FILES CLOSED FOR INCOMPLETENESS 0 $0 2 $106,480 11 $110,433 0 $0 0 $0 3 $62,247 0 $0
Aggregated Statistics For Year 2004(Based on 3 partial tracts) A) FHA, FSA/RHS & VA B) Conventional C) Refinancings D) Home Improvement Loans E) Loans on Dwellings For 5+ Families F) Non-occupant Loans on G) Loans On Manufactured Number Average Value Number Average Value Number Average Value Number Average Value Number Average Value Number Average Value Number Average Value
LOANS ORIGINATED 17 $102,161 104 $85,768 105 $75,848 15 $43,359 1 $1,855,740 32 $74,891 4 $29,185 APPLICATIONS APPROVED, NOT ACCEPTED 1 $50,550 17 $94,508 11 $66,576 4 $44,605 0 $0 6 $46,052 1 $28,730 APPLICATIONS DENIED 4 $74,190 34 $59,569 59 $71,131 15 $28,163 0 $0 10 $55,317 17 $50,035 APPLICATIONS WITHDRAWN 2 $101,135 10 $90,223 26 $81,014 2 $48,995 0 $0 2 $94,160 0 $0 FILES CLOSED FOR INCOMPLETENESS 0 $0 1 $177,660 12 $94,223 0 $0 0 $0 0 $0 0 $0
Aggregated Statistics For Year 2003(Based on 3 partial tracts) A) FHA, FSA/RHS & VA B) Conventional C) Refinancings D) Home Improvement Loans E) Loans on Dwellings For 5+ Families F) Non-occupant Loans on Number Average Value Number Average Value Number Average Value Number Average Value Number Average Value Number Average Value
LOANS ORIGINATED 26 $83,401 98 $85,837 178 $71,992 12 $27,880 1 $30,520 43 $58,920 APPLICATIONS APPROVED, NOT ACCEPTED 2 $90,420 4 $97,562 16 $86,251 1 $64,410 0 $0 1 $164,020 APPLICATIONS DENIED 5 $65,990 11 $67,105 75 $74,964 7 $15,740 0 $0 15 $57,871 APPLICATIONS WITHDRAWN 1 $57,450 7 $89,816 44 $75,386 2 $39,025 0 $0 5 $56,382 FILES CLOSED FOR INCOMPLETENESS 1 $52,320 1 $117,330 7 $62,833 0 $0 0 $0 1 $89,430
Aggregated Statistics For Year 2002(Based on 2 partial tracts) A) FHA, FSA/RHS & VA B) Conventional C) Refinancings D) Home Improvement Loans E) Loans on Dwellings For 5+ Families F) Non-occupant Loans on Number Average Value Number Average Value Number Average Value Number Average Value Number Average Value Number Average Value
LOANS ORIGINATED 28 $81,336 86 $75,540 116 $70,209 16 $16,717 5 $610,490 37 $60,044 APPLICATIONS APPROVED, NOT ACCEPTED 2 $83,390 6 $92,392 11 $86,040 3 $5,713 0 $0 4 $50,552 APPLICATIONS DENIED 7 $85,824 14 $63,664 29 $75,128 5 $16,038 0 $0 5 $56,762 APPLICATIONS WITHDRAWN 4 $66,080 7 $90,107 19 $70,431 2 $7,445 0 $0 1 $100,270 FILES CLOSED FOR INCOMPLETENESS 0 $0 1 $185,280 4 $76,295 0 $0 0 $0 1 $34,400
Aggregated Statistics For Year 2001(Based on 2 partial tracts) A) FHA, FSA/RHS & VA B) Conventional C) Refinancings D) Home Improvement Loans E) Loans on Dwellings For 5+ Families F) Non-occupant Loans on Number Average Value Number Average Value Number Average Value Number Average Value Number Average Value Number Average Value
LOANS ORIGINATED 32 $71,519 71 $71,084 110 $66,200 8 $15,841 1 $166,780 32 $51,115 APPLICATIONS APPROVED, NOT ACCEPTED 1 $33,420 6 $66,933 18 $72,980 3 $21,397 0 $0 5 $81,460 APPLICATIONS DENIED 3 $70,237 16 $46,635 30 $54,057 11 $13,006 0 $0 5 $30,324 APPLICATIONS WITHDRAWN 1 $85,740 7 $55,260 25 $78,041 1 $21,800 0 $0 2 $75,835 FILES CLOSED FOR INCOMPLETENESS 1 $39,240 3 $56,607 3 $77,857 0 $0 0 $0 0 $0
Aggregated Statistics For Year 2000(Based on 2 partial tracts) A) FHA, FSA/RHS & VA B) Conventional C) Refinancings D) Home Improvement Loans E) Loans on Dwellings For 5+ Families F) Non-occupant Loans on Number Average Value Number Average Value Number Average Value Number Average Value Number Average Value Number Average Value
LOANS ORIGINATED 38 $78,503 81 $69,109 33 $64,653 22 $20,155 1 $7,270 24 $58,906 APPLICATIONS APPROVED, NOT ACCEPTED 1 $102,750 20 $46,962 7 $43,663 4 $27,100 0 $0 4 $39,600 APPLICATIONS DENIED 4 $71,410 36 $52,888 15 $76,564 5 $24,124 0 $0 7 $140,980 APPLICATIONS WITHDRAWN 4 $66,625 9 $62,030 15 $47,470 1 $5,810 0 $0 2 $39,965 FILES CLOSED FOR INCOMPLETENESS 2 $47,230 0 $0 1 $37,780 0 $0 0 $0 0 $0
Aggregated Statistics For Year 1999(Based on 3 partial tracts) A) FHA, FSA/RHS & VA B) Conventional C) Refinancings D) Home Improvement Loans E) Loans on Dwellings For 5+ Families F) Non-occupant Loans on Number Average Value Number Average Value Number Average Value Number Average Value Number Average Value Number Average Value
LOANS ORIGINATED 33 $71,248 73 $80,955 77 $59,118 20 $14,560 4 $528,990 24 $46,582 APPLICATIONS APPROVED, NOT ACCEPTED 1 $25,800 10 $53,424 9 $49,696 2 $20,315 0 $0 2 $58,140 APPLICATIONS DENIED 4 $76,615 41 $44,860 19 $38,504 12 $8,832 0 $0 2 $26,990 APPLICATIONS WITHDRAWN 5 $76,768 9 $73,182 12 $68,209 1 $117,910 1 $35,450 1 $77,170 FILES CLOSED FOR INCOMPLETENESS 0 $0 1 $69,430 1 $57,650 1 $3,630 0 $0 0 $0
Detailed HMDA statistics for the following Tracts:
0217.01
, 0218.01 , 0218.02
Private Mortgage Insurance Companies Aggregated Statistics For Year 2009(Based on 3 partial tracts) A) Conventional B) Refinancings C) Non-occupant Loans on Number Average Value Number Average Value Number Average Value
LOANS ORIGINATED 7 $105,896 9 $134,439 1 $47,440 APPLICATIONS APPROVED, NOT ACCEPTED 4 $91,722 0 $0 1 $45,050 APPLICATIONS DENIED 1 $47,400 1 $97,910 1 $46,980 APPLICATIONS WITHDRAWN 1 $48,190 0 $0 0 $0 FILES CLOSED FOR INCOMPLETENESS 0 $0 0 $0 0 $0
Aggregated Statistics For Year 2008(Based on 3 partial tracts) A) Conventional B) Refinancings C) Non-occupant Loans on Number Average Value Number Average Value Number Average Value
LOANS ORIGINATED 21 $102,603 3 $89,217 2 $123,015 APPLICATIONS APPROVED, NOT ACCEPTED 3 $68,590 0 $0 0 $0 APPLICATIONS DENIED 1 $47,990 0 $0 1 $47,530 APPLICATIONS WITHDRAWN 2 $117,965 1 $53,770 1 $78,180 FILES CLOSED FOR INCOMPLETENESS 0 $0 0 $0 0 $0
Aggregated Statistics For Year 2007(Based on 3 partial tracts) A) Conventional B) Refinancings C) Non-occupant Loans on Number Average Value Number Average Value Number Average Value
LOANS ORIGINATED 52 $105,387 3 $90,713 8 $85,951 APPLICATIONS APPROVED, NOT ACCEPTED 3 $97,413 0 $0 0 $0 APPLICATIONS DENIED 0 $0 0 $0 0 $0 APPLICATIONS WITHDRAWN 1 $64,810 0 $0 1 $64,670 FILES CLOSED FOR INCOMPLETENESS 0 $0 0 $0 0 $0
Aggregated Statistics For Year 2006(Based on 3 partial tracts) A) Conventional B) Refinancings C) Non-occupant Loans on Number Average Value Number Average Value Number Average Value
LOANS ORIGINATED 32 $97,246 1 $216,400 4 $108,675 APPLICATIONS APPROVED, NOT ACCEPTED 2 $88,790 1 $48,070 0 $0 APPLICATIONS DENIED 0 $0 0 $0 0 $0 APPLICATIONS WITHDRAWN 2 $137,195 0 $0 1 $138,640 FILES CLOSED FOR INCOMPLETENESS 0 $0 0 $0 0 $0
Aggregated Statistics For Year 2005(Based on 3 partial tracts) A) Conventional B) Refinancings C) Non-occupant Loans on Number Average Value Number Average Value Number Average Value
LOANS ORIGINATED 39 $101,887 6 $88,188 8 $75,115 APPLICATIONS APPROVED, NOT ACCEPTED 1 $62,440 0 $0 0 $0 APPLICATIONS DENIED 0 $0 0 $0 0 $0 APPLICATIONS WITHDRAWN 2 $62,295 0 $0 0 $0 FILES CLOSED FOR INCOMPLETENESS 0 $0 0 $0 0 $0
Aggregated Statistics For Year 2004(Based on 3 partial tracts) A) Conventional B) Refinancings C) Non-occupant Loans on Number Average Value Number Average Value Number Average Value
LOANS ORIGINATED 40 $109,864 8 $122,088 8 $72,030 APPLICATIONS APPROVED, NOT ACCEPTED 2 $131,600 1 $74,960 0 $0 APPLICATIONS DENIED 1 $97,580 0 $0 0 $0 APPLICATIONS WITHDRAWN 3 $95,480 1 $34,640 0 $0 FILES CLOSED FOR INCOMPLETENESS 0 $0 0 $0 0 $0
Aggregated Statistics For Year 2003(Based on 3 partial tracts) A) Conventional B) Refinancings C) Non-occupant Loans on Number Average Value Number Average Value Number Average Value
LOANS ORIGINATED 45 $98,264 21 $89,070 4 $83,138 APPLICATIONS APPROVED, NOT ACCEPTED 2 $93,110 1 $102,310 1 $71,210 APPLICATIONS DENIED 1 $27,100 0 $0 1 $27,100 APPLICATIONS WITHDRAWN 2 $69,190 1 $80,780 1 $18,370 FILES CLOSED FOR INCOMPLETENESS 0 $0 0 $0 0 $0
Aggregated Statistics For Year 2002(Based on 2 partial tracts) A) Conventional B) Refinancings C) Non-occupant Loans on Number Average Value Number Average Value Number Average Value
LOANS ORIGINATED 41 $88,894 9 $96,686 7 $60,363 APPLICATIONS APPROVED, NOT ACCEPTED 2 $119,865 1 $279,010 0 $0 APPLICATIONS DENIED 1 $31,970 0 $0 0 $0 APPLICATIONS WITHDRAWN 0 $0 0 $0 0 $0 FILES CLOSED FOR INCOMPLETENESS 0 $0 0 $0 0 $0
Aggregated Statistics For Year 2001(Based on 2 partial tracts) A) Conventional B) Refinancings C) Non-occupant Loans on Number Average Value Number Average Value Number Average Value
LOANS ORIGINATED 29 $78,197 6 $111,072 9 $73,357 APPLICATIONS APPROVED, NOT ACCEPTED 5 $73,864 1 $188,220 2 $102,465 APPLICATIONS DENIED 1 $22,410 1 $201,300 1 $22,410 APPLICATIONS WITHDRAWN 1 $29,790 1 $29,790 1 $59,580 FILES CLOSED FOR INCOMPLETENESS 0 $0 0 $0 0 $0
Aggregated Statistics For Year 2000(Based on 2 partial tracts) A) Conventional B) Refinancings C) Non-occupant Loans on Number Average Value Number Average Value Number Average Value
LOANS ORIGINATED 28 $83,082 1 $241,230 5 $86,134 APPLICATIONS APPROVED, NOT ACCEPTED 1 $154,800 1 $36,480 1 $154,800 APPLICATIONS DENIED 1 $31,270 1 $154,800 0 $0 APPLICATIONS WITHDRAWN 1 $71,410 0 $0 1 $23,450 FILES CLOSED FOR INCOMPLETENESS 0 $0 0 $0 0 $0
Aggregated Statistics For Year 1999(Based on 3 partial tracts) A) Conventional B) Refinancings C) Non-occupant Loans on Number Average Value Number Average Value Number Average Value
LOANS ORIGINATED 26 $86,526 5 $70,484 2 $50,905 APPLICATIONS APPROVED, NOT ACCEPTED 2 $105,270 1 $113,790 0 $0 APPLICATIONS DENIED 1 $82,500 0 $0 0 $0 APPLICATIONS WITHDRAWN 1 $25,810 1 $34,670 1 $34,630 FILES CLOSED FOR INCOMPLETENESS 0 $0 0 $0 0 $0
Detailed PMIC statistics for the following Tracts:
0217.01
, 0218.01 , 0218.02
Most common first names in Canyon, TX among deceased individuals Name Count Lived (average)
John 64 75.6 years Mary 52 81.3 years James 50 76.0 years William 49 74.5 years Robert 39 72.5 years George 30 80.9 years Charles 29 75.8 years Ruth 29 78.2 years Thomas 24 78.9 years Joe 18 75.9 years
Most common last names in Canyon, TX among deceased individuals Last name Count Lived (average)
Davis 28 75.3 years Miller 26 79.4 years Smith 24 78.1 years Moore 23 83.8 years Brown 20 80.8 years Williams 16 74.0 years Johnson 16 71.2 years Foster 16 75.4 years Allen 14 79.3 years Taylor 14 79.3 years
Canyon compared to Texas state average:
Unemployed percentage below state average. Black race population percentage significantly below state average. Median age below state average. Foreign-born population percentage below state average. Length of stay since moving in above state average. Number of college students significantly above state average. Percentage of population with a bachelor's degree or higher above state average.
#41 on the list of "Top 101 cities with the largest percentage of people in homes for the physically handicapped (population 1,000+)"
#2 on the list of "Top 101 counties with the largest number of children under 18 without health insurance coverage in 2000 (pop. 50,000+)"
#4 on the list of "Top 101 counties with highest percentage of residents voting for Romney (Republican) in the 2012 Presidential Election (pop. 50,000+)"
#8 on the list of "Top 101 counties with the largest number of people without health insurance coverage in 2000 (pop. 50,000+)"
#9 on the list of "Top 101 counties with the largest increase in the number of births per 1000 residents 2000-2006 to 2007-2013 (pop 50,000+)"
#20 on the list of "Top 101 counties with the lowest total withdrawal of fresh water for public supply (pop. 50,000+)"
Top Patent Applicants
William C. Pratt (7)
David Parker (4)
Alan Nicholson (4)
David Bruce Parker (3)
Jeff King (3)
Kevin Owen (2)
Kevin Q. Owen (2)
John T. Haynes (2)
Robert Clarence Mills (2)
Stephen E. Bachman (2)
Total of 56 patent applications in 2008-2024.


 Recent articles from our blog. Our writers, many of them Ph.D. graduates or candidates, create easy-to-read articles on a wide variety of topics.

 (15.9 miles
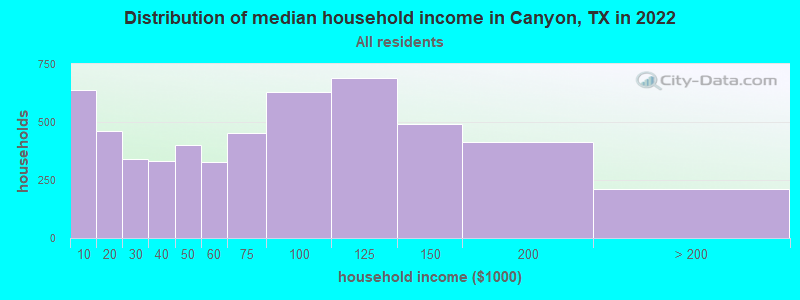
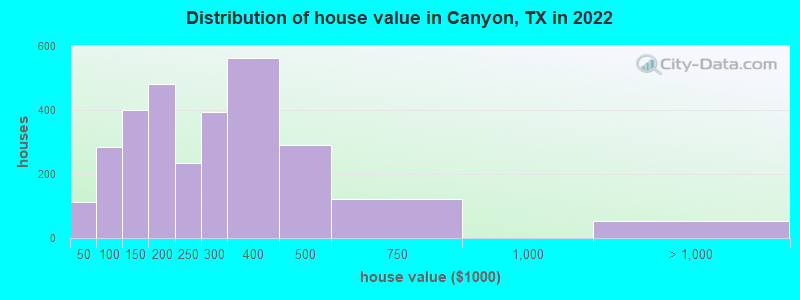
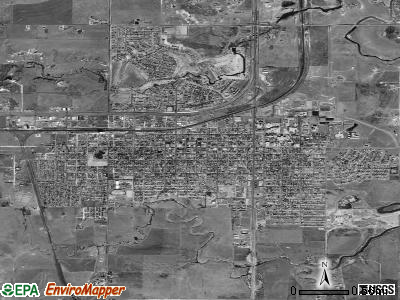
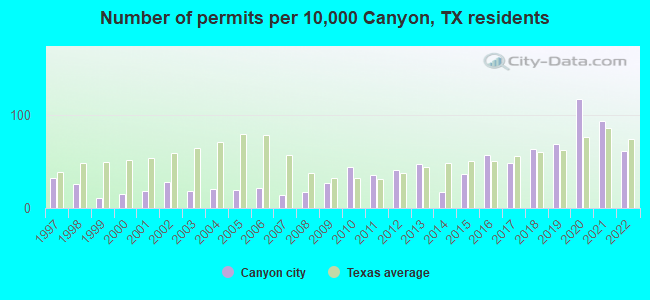
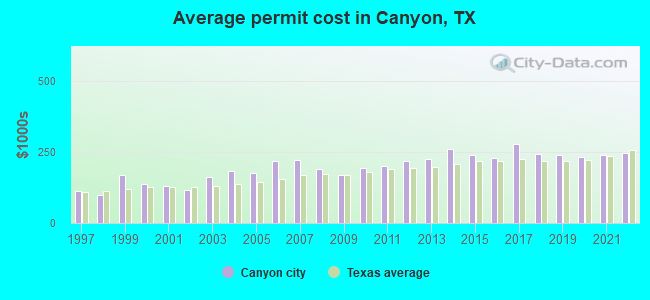
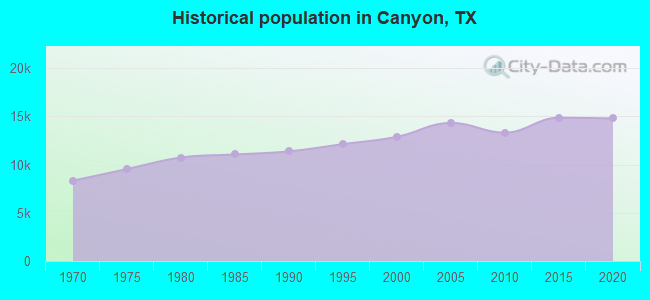
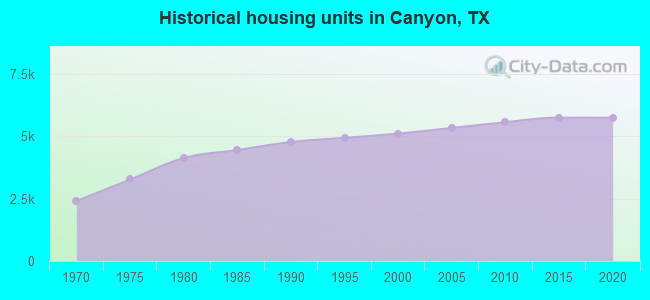
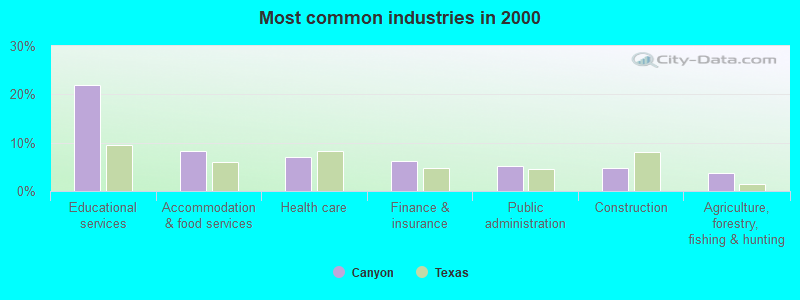

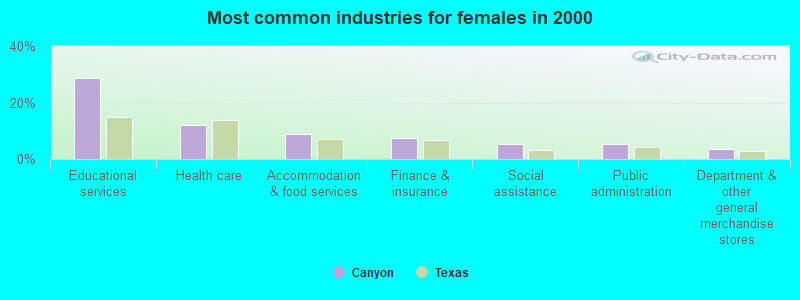
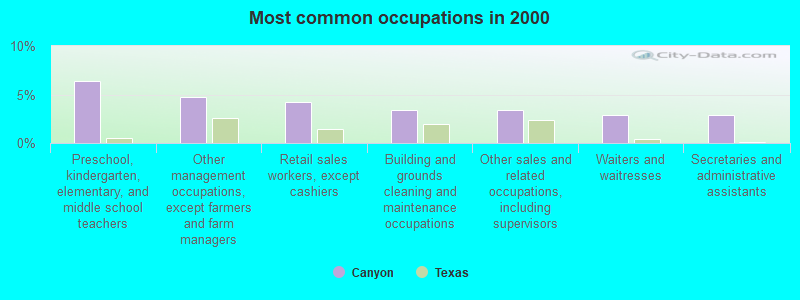
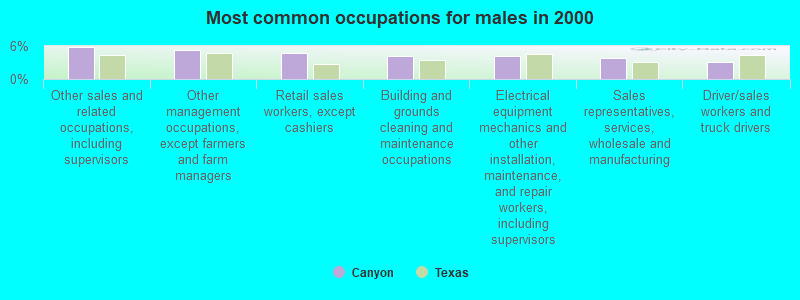
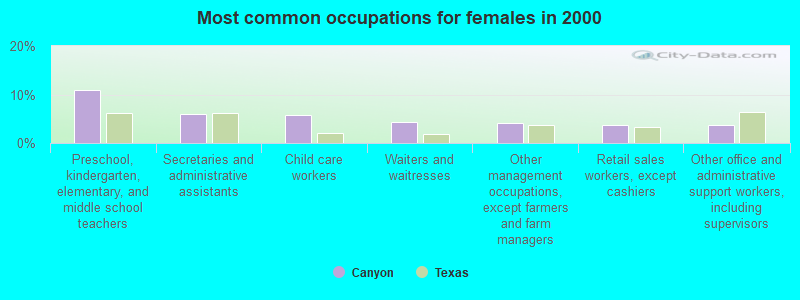
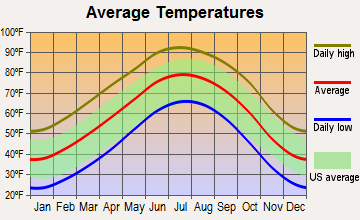
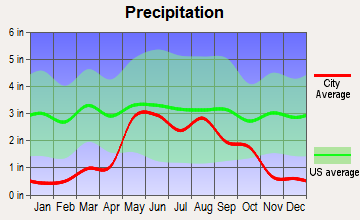
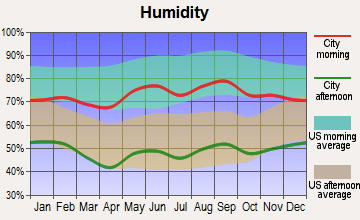
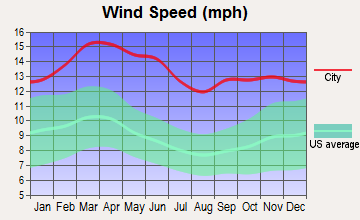
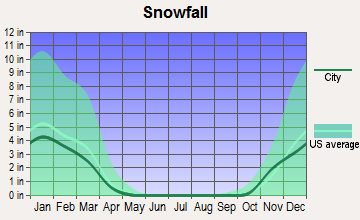
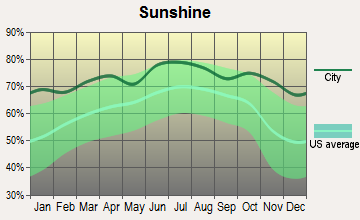
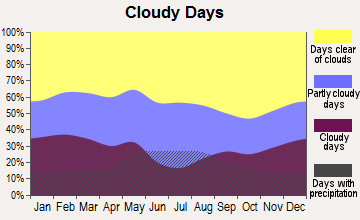
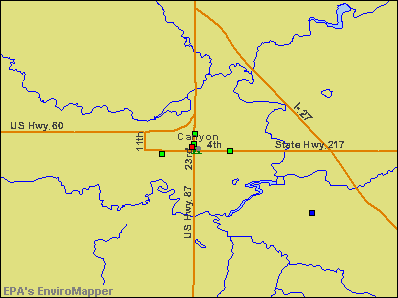

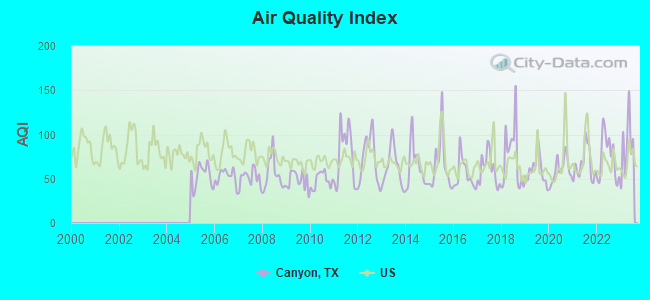
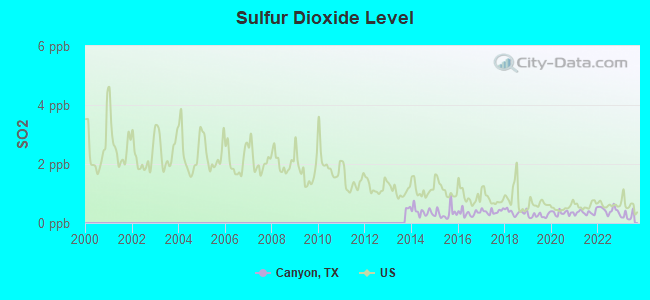
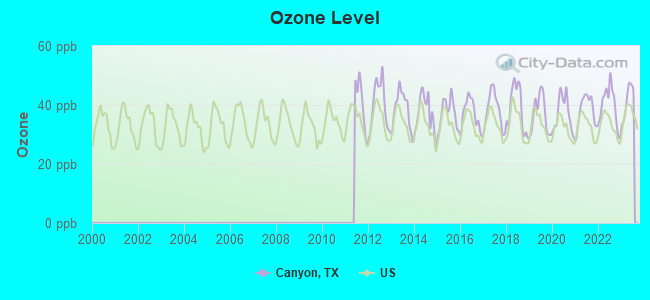
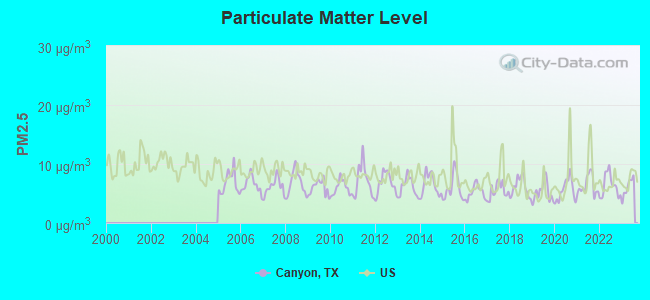

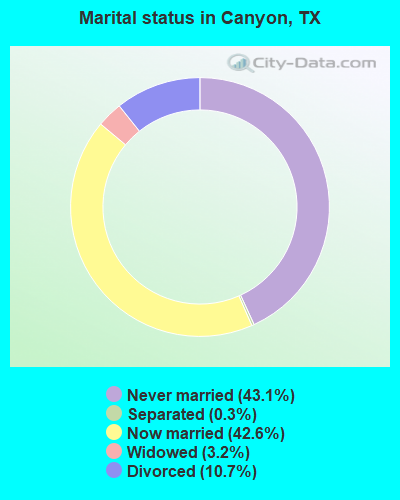
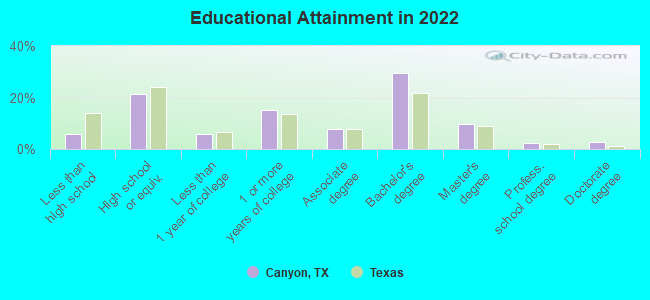
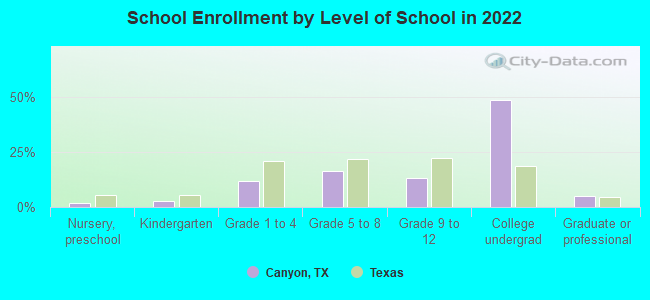
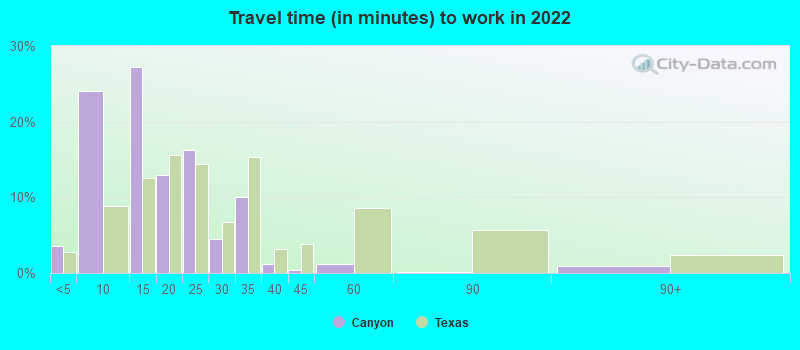
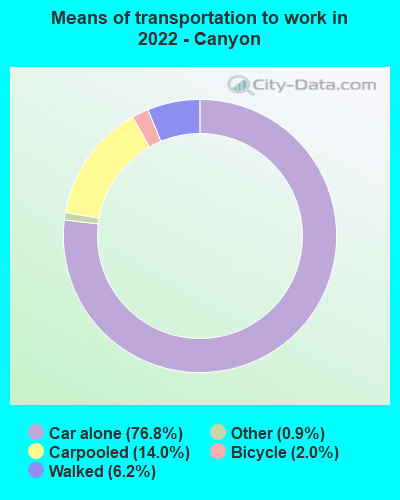
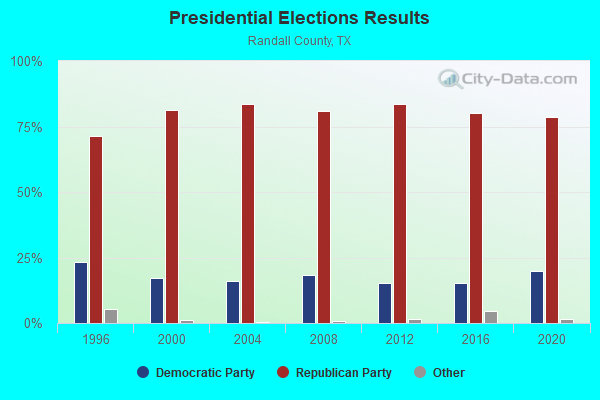
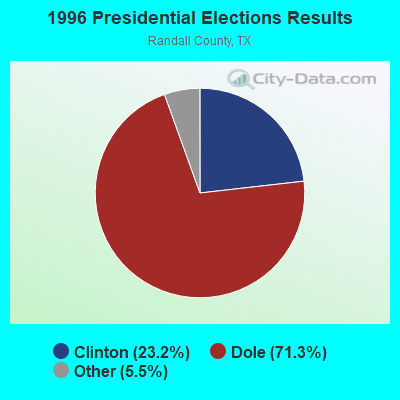
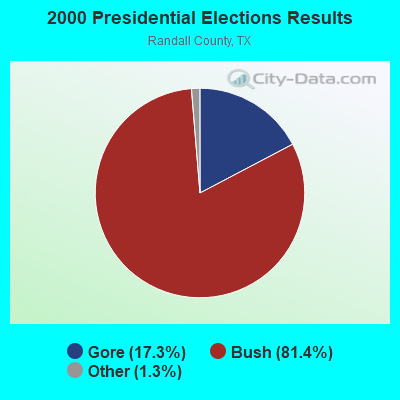
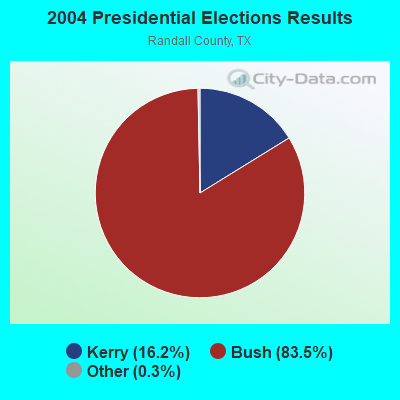
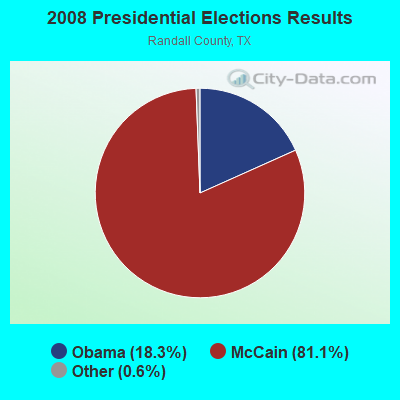
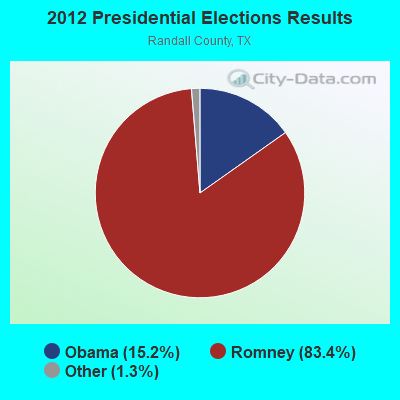
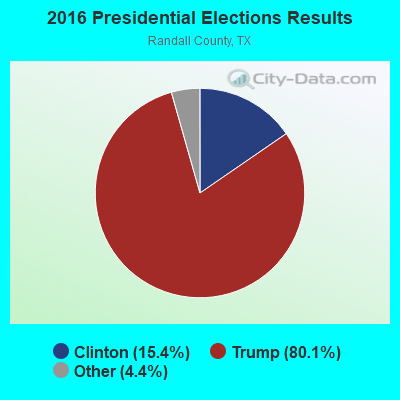
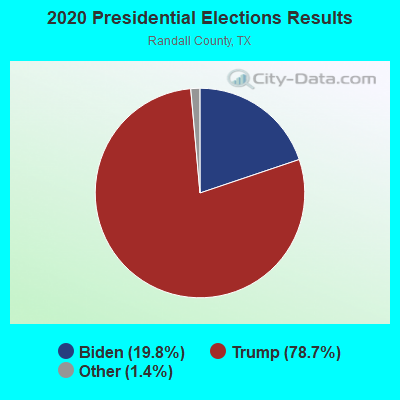
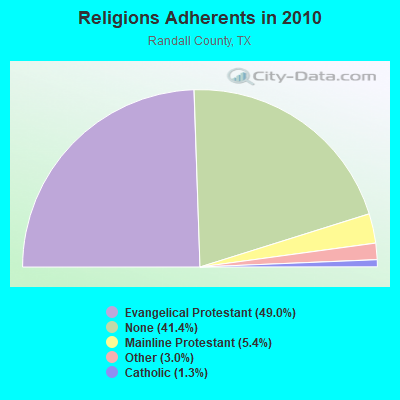
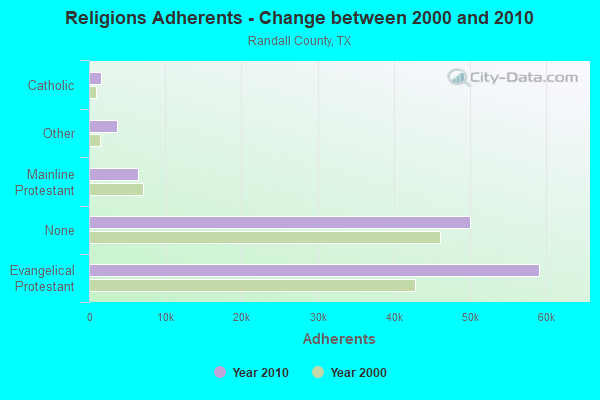
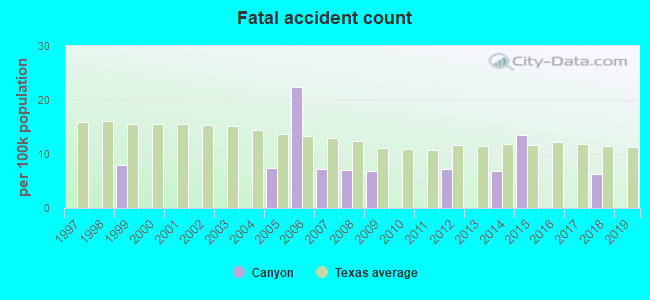
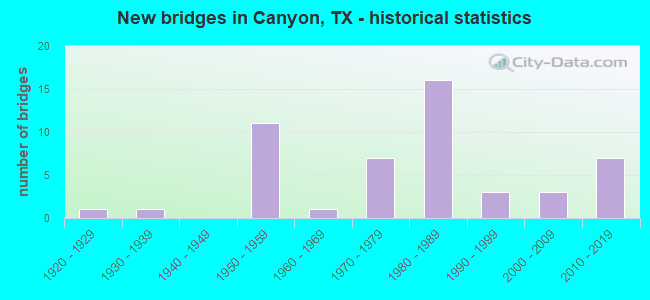
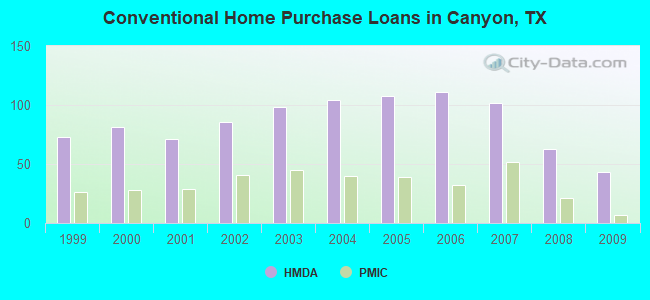
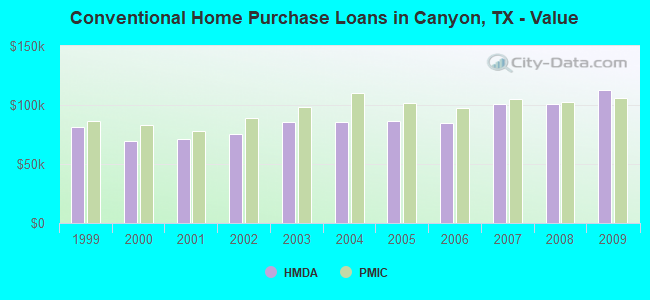
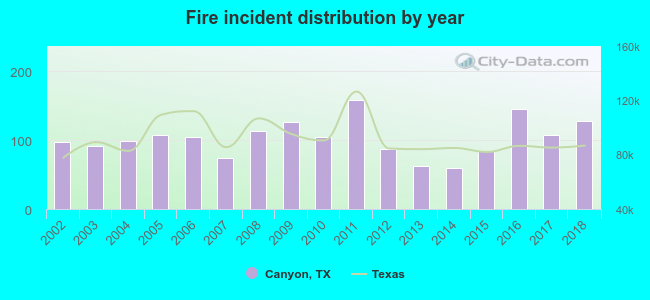 Based on the data from the years 2002 - 2018 the average number of fires per year is 103. The highest number of reported fire incidents - 158 took place in 2011, and the least - 59 in 2014. The data has a growing trend.
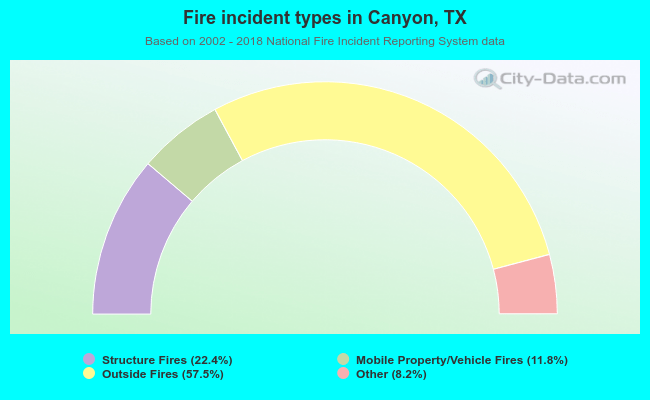 When looking into fire subcategories, the most incidents belonged to: Outside Fires (57.5%), and Structure Fires (22.4%).