Clovis, California Submit your own pictures of this city and show them to the world
OSM Map
General Map
Google Map
MSN Map
OSM Map
General Map
Google Map
MSN Map
OSM Map
General Map
Google Map
MSN Map
OSM Map
General Map
Google Map
MSN Map
Please wait while loading the map...
Population in 2022: 124,556 (100% urban, 0% rural). Population change since 2000: +81.9%Males: 59,148 Females: 65,408
March 2022 cost of living index in Clovis: 96.1 (near average, U.S. average is 100) Percentage of residents living in poverty in 2022: 7.0%for White Non-Hispanic residents , 7.7% for Black residents , 8.2% for Hispanic or Latino residents , 33.4% for American Indian residents , 17.4% for other race residents , 8.6% for two or more races residents )
Profiles of local businesses
Business Search - 14 Million verified businesses
Data:
Median household income ($)
Median household income (% change since 2000)
Household income diversity
Ratio of average income to average house value (%)
Ratio of average income to average rent
Median household income ($) - White
Median household income ($) - Black or African American
Median household income ($) - Asian
Median household income ($) - Hispanic or Latino
Median household income ($) - American Indian and Alaska Native
Median household income ($) - Multirace
Median household income ($) - Other Race
Median household income for houses/condos with a mortgage ($)
Median household income for apartments without a mortgage ($)
Races - White alone (%)
Races - White alone (% change since 2000)
Races - Black alone (%)
Races - Black alone (% change since 2000)
Races - American Indian alone (%)
Races - American Indian alone (% change since 2000)
Races - Asian alone (%)
Races - Asian alone (% change since 2000)
Races - Hispanic (%)
Races - Hispanic (% change since 2000)
Races - Native Hawaiian and Other Pacific Islander alone (%)
Races - Native Hawaiian and Other Pacific Islander alone (% change since 2000)
Races - Two or more races (%)
Races - Two or more races (% change since 2000)
Races - Other race alone (%)
Races - Other race alone (% change since 2000)
Racial diversity
Unemployment (%)
Unemployment (% change since 2000)
Unemployment (%) - White
Unemployment (%) - Black or African American
Unemployment (%) - Asian
Unemployment (%) - Hispanic or Latino
Unemployment (%) - American Indian and Alaska Native
Unemployment (%) - Multirace
Unemployment (%) - Other Race
Population density (people per square mile)
Population - Males (%)
Population - Females (%)
Population - Males (%) - White
Population - Males (%) - Black or African American
Population - Males (%) - Asian
Population - Males (%) - Hispanic or Latino
Population - Males (%) - American Indian and Alaska Native
Population - Males (%) - Multirace
Population - Males (%) - Other Race
Population - Females (%) - White
Population - Females (%) - Black or African American
Population - Females (%) - Asian
Population - Females (%) - Hispanic or Latino
Population - Females (%) - American Indian and Alaska Native
Population - Females (%) - Multirace
Population - Females (%) - Other Race
Coronavirus confirmed cases (Apr 27, 2024)
Deaths caused by coronavirus (Apr 27, 2024)
Coronavirus confirmed cases (per 100k population) (Apr 27, 2024)
Deaths caused by coronavirus (per 100k population) (Apr 27, 2024)
Daily increase in number of cases (Apr 27, 2024)
Weekly increase in number of cases (Apr 27, 2024)
Cases doubled (in days) (Apr 27, 2024)
Hospitalized patients (Apr 18, 2022)
Negative test results (Apr 18, 2022)
Total test results (Apr 18, 2022)
COVID Vaccine doses distributed (per 100k population) (Sep 19, 2023)
COVID Vaccine doses administered (per 100k population) (Sep 19, 2023)
COVID Vaccine doses distributed (Sep 19, 2023)
COVID Vaccine doses administered (Sep 19, 2023)
Likely homosexual households (%)
Likely homosexual households (% change since 2000)
Likely homosexual households - Lesbian couples (%)
Likely homosexual households - Lesbian couples (% change since 2000)
Likely homosexual households - Gay men (%)
Likely homosexual households - Gay men (% change since 2000)
Cost of living index
Median gross rent ($)
Median contract rent ($)
Median monthly housing costs ($)
Median house or condo value ($)
Median house or condo value ($ change since 2000)
Mean house or condo value by units in structure - 1, detached ($)
Mean house or condo value by units in structure - 1, attached ($)
Mean house or condo value by units in structure - 2 ($)
Mean house or condo value by units in structure by units in structure - 3 or 4 ($)
Mean house or condo value by units in structure - 5 or more ($)
Mean house or condo value by units in structure - Boat, RV, van, etc. ($)
Mean house or condo value by units in structure - Mobile home ($)
Median house or condo value ($) - White
Median house or condo value ($) - Black or African American
Median house or condo value ($) - Asian
Median house or condo value ($) - Hispanic or Latino
Median house or condo value ($) - American Indian and Alaska Native
Median house or condo value ($) - Multirace
Median house or condo value ($) - Other Race
Median resident age
Resident age diversity
Median resident age - Males
Median resident age - Females
Median resident age - White
Median resident age - Black or African American
Median resident age - Asian
Median resident age - Hispanic or Latino
Median resident age - American Indian and Alaska Native
Median resident age - Multirace
Median resident age - Other Race
Median resident age - Males - White
Median resident age - Males - Black or African American
Median resident age - Males - Asian
Median resident age - Males - Hispanic or Latino
Median resident age - Males - American Indian and Alaska Native
Median resident age - Males - Multirace
Median resident age - Males - Other Race
Median resident age - Females - White
Median resident age - Females - Black or African American
Median resident age - Females - Asian
Median resident age - Females - Hispanic or Latino
Median resident age - Females - American Indian and Alaska Native
Median resident age - Females - Multirace
Median resident age - Females - Other Race
Commute - mean travel time to work (minutes)
Travel time to work - Less than 5 minutes (%)
Travel time to work - Less than 5 minutes (% change since 2000)
Travel time to work - 5 to 9 minutes (%)
Travel time to work - 5 to 9 minutes (% change since 2000)
Travel time to work - 10 to 19 minutes (%)
Travel time to work - 10 to 19 minutes (% change since 2000)
Travel time to work - 20 to 29 minutes (%)
Travel time to work - 20 to 29 minutes (% change since 2000)
Travel time to work - 30 to 39 minutes (%)
Travel time to work - 30 to 39 minutes (% change since 2000)
Travel time to work - 40 to 59 minutes (%)
Travel time to work - 40 to 59 minutes (% change since 2000)
Travel time to work - 60 to 89 minutes (%)
Travel time to work - 60 to 89 minutes (% change since 2000)
Travel time to work - 90 or more minutes (%)
Travel time to work - 90 or more minutes (% change since 2000)
Marital status - Never married (%)
Marital status - Now married (%)
Marital status - Separated (%)
Marital status - Widowed (%)
Marital status - Divorced (%)
Median family income ($)
Median family income (% change since 2000)
Median non-family income ($)
Median non-family income (% change since 2000)
Median per capita income ($)
Median per capita income (% change since 2000)
Median family income ($) - White
Median family income ($) - Black or African American
Median family income ($) - Asian
Median family income ($) - Hispanic or Latino
Median family income ($) - American Indian and Alaska Native
Median family income ($) - Multirace
Median family income ($) - Other Race
Median year house/condo built
Median year apartment built
Year house built - Built 2005 or later (%)
Year house built - Built 2000 to 2004 (%)
Year house built - Built 1990 to 1999 (%)
Year house built - Built 1980 to 1989 (%)
Year house built - Built 1970 to 1979 (%)
Year house built - Built 1960 to 1969 (%)
Year house built - Built 1950 to 1959 (%)
Year house built - Built 1940 to 1949 (%)
Year house built - Built 1939 or earlier (%)
Average household size
Household density (households per square mile)
Average household size - White
Average household size - Black or African American
Average household size - Asian
Average household size - Hispanic or Latino
Average household size - American Indian and Alaska Native
Average household size - Multirace
Average household size - Other Race
Occupied housing units (%)
Vacant housing units (%)
Owner occupied housing units (%)
Renter occupied housing units (%)
Vacancy status - For rent (%)
Vacancy status - For sale only (%)
Vacancy status - Rented or sold, not occupied (%)
Vacancy status - For seasonal, recreational, or occasional use (%)
Vacancy status - For migrant workers (%)
Vacancy status - Other vacant (%)
Residents with income below the poverty level (%)
Residents with income below 50% of the poverty level (%)
Children below poverty level (%)
Poor families by family type - Married-couple family (%)
Poor families by family type - Male, no wife present (%)
Poor families by family type - Female, no husband present (%)
Poverty status for native-born residents (%)
Poverty status for foreign-born residents (%)
Poverty among high school graduates not in families (%)
Poverty among people who did not graduate high school not in families (%)
Residents with income below the poverty level (%) - White
Residents with income below the poverty level (%) - Black or African American
Residents with income below the poverty level (%) - Asian
Residents with income below the poverty level (%) - Hispanic or Latino
Residents with income below the poverty level (%) - American Indian and Alaska Native
Residents with income below the poverty level (%) - Multirace
Residents with income below the poverty level (%) - Other Race
Air pollution - Air Quality Index (AQI)
Air pollution - CO
Air pollution - NO2
Air pollution - SO2
Air pollution - Ozone
Air pollution - PM10
Air pollution - PM25
Air pollution - Pb
Crime - Murders per 100,000 population
Crime - Rapes per 100,000 population
Crime - Robberies per 100,000 population
Crime - Assaults per 100,000 population
Crime - Burglaries per 100,000 population
Crime - Thefts per 100,000 population
Crime - Auto thefts per 100,000 population
Crime - Arson per 100,000 population
Crime - City-data.com crime index
Crime - Violent crime index
Crime - Property crime index
Crime - Murders per 100,000 population (5 year average)
Crime - Rapes per 100,000 population (5 year average)
Crime - Robberies per 100,000 population (5 year average)
Crime - Assaults per 100,000 population (5 year average)
Crime - Burglaries per 100,000 population (5 year average)
Crime - Thefts per 100,000 population (5 year average)
Crime - Auto thefts per 100,000 population (5 year average)
Crime - Arson per 100,000 population (5 year average)
Crime - City-data.com crime index (5 year average)
Crime - Violent crime index (5 year average)
Crime - Property crime index (5 year average)
1996 Presidential Elections Results (%) - Democratic Party (Clinton)
1996 Presidential Elections Results (%) - Republican Party (Dole)
1996 Presidential Elections Results (%) - Other
2000 Presidential Elections Results (%) - Democratic Party (Gore)
2000 Presidential Elections Results (%) - Republican Party (Bush)
2000 Presidential Elections Results (%) - Other
2004 Presidential Elections Results (%) - Democratic Party (Kerry)
2004 Presidential Elections Results (%) - Republican Party (Bush)
2004 Presidential Elections Results (%) - Other
2008 Presidential Elections Results (%) - Democratic Party (Obama)
2008 Presidential Elections Results (%) - Republican Party (McCain)
2008 Presidential Elections Results (%) - Other
2012 Presidential Elections Results (%) - Democratic Party (Obama)
2012 Presidential Elections Results (%) - Republican Party (Romney)
2012 Presidential Elections Results (%) - Other
2016 Presidential Elections Results (%) - Democratic Party (Clinton)
2016 Presidential Elections Results (%) - Republican Party (Trump)
2016 Presidential Elections Results (%) - Other
2020 Presidential Elections Results (%) - Democratic Party (Biden)
2020 Presidential Elections Results (%) - Republican Party (Trump)
2020 Presidential Elections Results (%) - Other
Ancestries Reported - Arab (%)
Ancestries Reported - Czech (%)
Ancestries Reported - Danish (%)
Ancestries Reported - Dutch (%)
Ancestries Reported - English (%)
Ancestries Reported - French (%)
Ancestries Reported - French Canadian (%)
Ancestries Reported - German (%)
Ancestries Reported - Greek (%)
Ancestries Reported - Hungarian (%)
Ancestries Reported - Irish (%)
Ancestries Reported - Italian (%)
Ancestries Reported - Lithuanian (%)
Ancestries Reported - Norwegian (%)
Ancestries Reported - Polish (%)
Ancestries Reported - Portuguese (%)
Ancestries Reported - Russian (%)
Ancestries Reported - Scotch-Irish (%)
Ancestries Reported - Scottish (%)
Ancestries Reported - Slovak (%)
Ancestries Reported - Subsaharan African (%)
Ancestries Reported - Swedish (%)
Ancestries Reported - Swiss (%)
Ancestries Reported - Ukrainian (%)
Ancestries Reported - United States (%)
Ancestries Reported - Welsh (%)
Ancestries Reported - West Indian (%)
Ancestries Reported - Other (%)
Educational Attainment - No schooling completed (%)
Educational Attainment - Less than high school (%)
Educational Attainment - High school or equivalent (%)
Educational Attainment - Less than 1 year of college (%)
Educational Attainment - 1 or more years of college (%)
Educational Attainment - Associate degree (%)
Educational Attainment - Bachelor's degree (%)
Educational Attainment - Master's degree (%)
Educational Attainment - Professional school degree (%)
Educational Attainment - Doctorate degree (%)
School Enrollment - Nursery, preschool (%)
School Enrollment - Kindergarten (%)
School Enrollment - Grade 1 to 4 (%)
School Enrollment - Grade 5 to 8 (%)
School Enrollment - Grade 9 to 12 (%)
School Enrollment - College undergrad (%)
School Enrollment - Graduate or professional (%)
School Enrollment - Not enrolled in school (%)
School enrollment - Public schools (%)
School enrollment - Private schools (%)
School enrollment - Not enrolled (%)
Median number of rooms in houses and condos
Median number of rooms in apartments
Housing units lacking complete plumbing facilities (%)
Housing units lacking complete kitchen facilities (%)
Density of houses
Urban houses (%)
Rural houses (%)
Households with people 60 years and over (%)
Households with people 65 years and over (%)
Households with people 75 years and over (%)
Households with one or more nonrelatives (%)
Households with no nonrelatives (%)
Population in households (%)
Family households (%)
Nonfamily households (%)
Population in families (%)
Family households with own children (%)
Median number of bedrooms in owner occupied houses
Mean number of bedrooms in owner occupied houses
Median number of bedrooms in renter occupied houses
Mean number of bedrooms in renter occupied houses
Median number of vehichles in owner occupied houses
Mean number of vehichles in owner occupied houses
Median number of vehichles in renter occupied houses
Mean number of vehichles in renter occupied houses
Mortgage status - with mortgage (%)
Mortgage status - with second mortgage (%)
Mortgage status - with home equity loan (%)
Mortgage status - with both second mortgage and home equity loan (%)
Mortgage status - without a mortgage (%)
Average family size
Average family size - White
Average family size - Black or African American
Average family size - Asian
Average family size - Hispanic or Latino
Average family size - American Indian and Alaska Native
Average family size - Multirace
Average family size - Other Race
Geographical mobility - Same house 1 year ago (%)
Geographical mobility - Moved within same county (%)
Geographical mobility - Moved from different county within same state (%)
Geographical mobility - Moved from different state (%)
Geographical mobility - Moved from abroad (%)
Place of birth - Born in state of residence (%)
Place of birth - Born in other state (%)
Place of birth - Native, outside of US (%)
Place of birth - Foreign born (%)
Housing units in structures - 1, detached (%)
Housing units in structures - 1, attached (%)
Housing units in structures - 2 (%)
Housing units in structures - 3 or 4 (%)
Housing units in structures - 5 to 9 (%)
Housing units in structures - 10 to 19 (%)
Housing units in structures - 20 to 49 (%)
Housing units in structures - 50 or more (%)
Housing units in structures - Mobile home (%)
Housing units in structures - Boat, RV, van, etc. (%)
House/condo owner moved in on average (years ago)
Renter moved in on average (years ago)
Year householder moved into unit - Moved in 1999 to March 2000 (%)
Year householder moved into unit - Moved in 1995 to 1998 (%)
Year householder moved into unit - Moved in 1990 to 1994 (%)
Year householder moved into unit - Moved in 1980 to 1989 (%)
Year householder moved into unit - Moved in 1970 to 1979 (%)
Year householder moved into unit - Moved in 1969 or earlier (%)
Means of transportation to work - Drove car alone (%)
Means of transportation to work - Carpooled (%)
Means of transportation to work - Public transportation (%)
Means of transportation to work - Bus or trolley bus (%)
Means of transportation to work - Streetcar or trolley car (%)
Means of transportation to work - Subway or elevated (%)
Means of transportation to work - Railroad (%)
Means of transportation to work - Ferryboat (%)
Means of transportation to work - Taxicab (%)
Means of transportation to work - Motorcycle (%)
Means of transportation to work - Bicycle (%)
Means of transportation to work - Walked (%)
Means of transportation to work - Other means (%)
Working at home (%)
Industry diversity
Most Common Industries - Agriculture, forestry, fishing and hunting, and mining (%)
Most Common Industries - Agriculture, forestry, fishing and hunting (%)
Most Common Industries - Mining, quarrying, and oil and gas extraction (%)
Most Common Industries - Construction (%)
Most Common Industries - Manufacturing (%)
Most Common Industries - Wholesale trade (%)
Most Common Industries - Retail trade (%)
Most Common Industries - Transportation and warehousing, and utilities (%)
Most Common Industries - Transportation and warehousing (%)
Most Common Industries - Utilities (%)
Most Common Industries - Information (%)
Most Common Industries - Finance and insurance, and real estate and rental and leasing (%)
Most Common Industries - Finance and insurance (%)
Most Common Industries - Real estate and rental and leasing (%)
Most Common Industries - Professional, scientific, and management, and administrative and waste management services (%)
Most Common Industries - Professional, scientific, and technical services (%)
Most Common Industries - Management of companies and enterprises (%)
Most Common Industries - Administrative and support and waste management services (%)
Most Common Industries - Educational services, and health care and social assistance (%)
Most Common Industries - Educational services (%)
Most Common Industries - Health care and social assistance (%)
Most Common Industries - Arts, entertainment, and recreation, and accommodation and food services (%)
Most Common Industries - Arts, entertainment, and recreation (%)
Most Common Industries - Accommodation and food services (%)
Most Common Industries - Other services, except public administration (%)
Most Common Industries - Public administration (%)
Occupation diversity
Most Common Occupations - Management, business, science, and arts occupations (%)
Most Common Occupations - Management, business, and financial occupations (%)
Most Common Occupations - Management occupations (%)
Most Common Occupations - Business and financial operations occupations (%)
Most Common Occupations - Computer, engineering, and science occupations (%)
Most Common Occupations - Computer and mathematical occupations (%)
Most Common Occupations - Architecture and engineering occupations (%)
Most Common Occupations - Life, physical, and social science occupations (%)
Most Common Occupations - Education, legal, community service, arts, and media occupations (%)
Most Common Occupations - Community and social service occupations (%)
Most Common Occupations - Legal occupations (%)
Most Common Occupations - Education, training, and library occupations (%)
Most Common Occupations - Arts, design, entertainment, sports, and media occupations (%)
Most Common Occupations - Healthcare practitioners and technical occupations (%)
Most Common Occupations - Health diagnosing and treating practitioners and other technical occupations (%)
Most Common Occupations - Health technologists and technicians (%)
Most Common Occupations - Service occupations (%)
Most Common Occupations - Healthcare support occupations (%)
Most Common Occupations - Protective service occupations (%)
Most Common Occupations - Fire fighting and prevention, and other protective service workers including supervisors (%)
Most Common Occupations - Law enforcement workers including supervisors (%)
Most Common Occupations - Food preparation and serving related occupations (%)
Most Common Occupations - Building and grounds cleaning and maintenance occupations (%)
Most Common Occupations - Personal care and service occupations (%)
Most Common Occupations - Sales and office occupations (%)
Most Common Occupations - Sales and related occupations (%)
Most Common Occupations - Office and administrative support occupations (%)
Most Common Occupations - Natural resources, construction, and maintenance occupations (%)
Most Common Occupations - Farming, fishing, and forestry occupations (%)
Most Common Occupations - Construction and extraction occupations (%)
Most Common Occupations - Installation, maintenance, and repair occupations (%)
Most Common Occupations - Production, transportation, and material moving occupations (%)
Most Common Occupations - Production occupations (%)
Most Common Occupations - Transportation occupations (%)
Most Common Occupations - Material moving occupations (%)
People in Group quarters - Institutionalized population (%)
People in Group quarters - Correctional institutions (%)
People in Group quarters - Federal prisons and detention centers (%)
People in Group quarters - Halfway houses (%)
People in Group quarters - Local jails and other confinement facilities (including police lockups) (%)
People in Group quarters - Military disciplinary barracks (%)
People in Group quarters - State prisons (%)
People in Group quarters - Other types of correctional institutions (%)
People in Group quarters - Nursing homes (%)
People in Group quarters - Hospitals/wards, hospices, and schools for the handicapped (%)
People in Group quarters - Hospitals/wards and hospices for chronically ill (%)
People in Group quarters - Hospices or homes for chronically ill (%)
People in Group quarters - Military hospitals or wards for chronically ill (%)
People in Group quarters - Other hospitals or wards for chronically ill (%)
People in Group quarters - Hospitals or wards for drug/alcohol abuse (%)
People in Group quarters - Mental (Psychiatric) hospitals or wards (%)
People in Group quarters - Schools, hospitals, or wards for the mentally retarded (%)
People in Group quarters - Schools, hospitals, or wards for the physically handicapped (%)
People in Group quarters - Institutions for the deaf (%)
People in Group quarters - Institutions for the blind (%)
People in Group quarters - Orthopedic wards and institutions for the physically handicapped (%)
People in Group quarters - Wards in general hospitals for patients who have no usual home elsewhere (%)
People in Group quarters - Wards in military hospitals for patients who have no usual home elsewhere (%)
People in Group quarters - Juvenile institutions (%)
People in Group quarters - Long-term care (%)
People in Group quarters - Homes for abused, dependent, and neglected children (%)
People in Group quarters - Residential treatment centers for emotionally disturbed children (%)
People in Group quarters - Training schools for juvenile delinquents (%)
People in Group quarters - Short-term care, detention or diagnostic centers for delinquent children (%)
People in Group quarters - Type of juvenile institution unknown (%)
People in Group quarters - Noninstitutionalized population (%)
People in Group quarters - College dormitories (includes college quarters off campus) (%)
People in Group quarters - Military quarters (%)
People in Group quarters - On base (%)
People in Group quarters - Barracks, unaccompanied personnel housing (UPH), (Enlisted/Officer), ;and similar group living quarters for military personnel (%)
People in Group quarters - Transient quarters for temporary residents (%)
People in Group quarters - Military ships (%)
People in Group quarters - Group homes (%)
People in Group quarters - Homes or halfway houses for drug/alcohol abuse (%)
People in Group quarters - Homes for the mentally ill (%)
People in Group quarters - Homes for the mentally retarded (%)
People in Group quarters - Homes for the physically handicapped (%)
People in Group quarters - Other group homes (%)
People in Group quarters - Religious group quarters (%)
People in Group quarters - Dormitories (%)
People in Group quarters - Agriculture workers' dormitories on farms (%)
People in Group quarters - Job Corps and vocational training facilities (%)
People in Group quarters - Other workers' dormitories (%)
People in Group quarters - Crews of maritime vessels (%)
People in Group quarters - Other nonhousehold living situations (%)
People in Group quarters - Other noninstitutional group quarters (%)
Residents speaking English at home (%)
Residents speaking English at home - Born in the United States (%)
Residents speaking English at home - Native, born elsewhere (%)
Residents speaking English at home - Foreign born (%)
Residents speaking Spanish at home (%)
Residents speaking Spanish at home - Born in the United States (%)
Residents speaking Spanish at home - Native, born elsewhere (%)
Residents speaking Spanish at home - Foreign born (%)
Residents speaking other language at home (%)
Residents speaking other language at home - Born in the United States (%)
Residents speaking other language at home - Native, born elsewhere (%)
Residents speaking other language at home - Foreign born (%)
Class of Workers - Employee of private company (%)
Class of Workers - Self-employed in own incorporated business (%)
Class of Workers - Private not-for-profit wage and salary workers (%)
Class of Workers - Local government workers (%)
Class of Workers - State government workers (%)
Class of Workers - Federal government workers (%)
Class of Workers - Self-employed workers in own not incorporated business and Unpaid family workers (%)
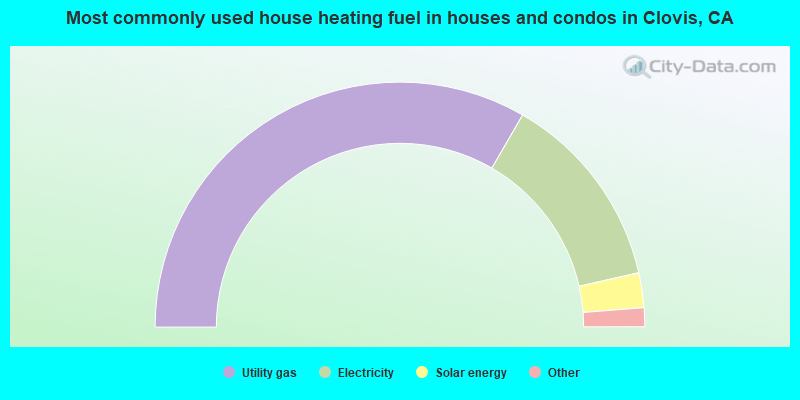
House heating fuel used in houses and condos - Utility gas (%)
House heating fuel used in houses and condos - Bottled, tank, or LP gas (%)
House heating fuel used in houses and condos - Electricity (%)
House heating fuel used in houses and condos - Fuel oil, kerosene, etc. (%)
House heating fuel used in houses and condos - Coal or coke (%)
House heating fuel used in houses and condos - Wood (%)
House heating fuel used in houses and condos - Solar energy (%)
House heating fuel used in houses and condos - Other fuel (%)
House heating fuel used in houses and condos - No fuel used (%)
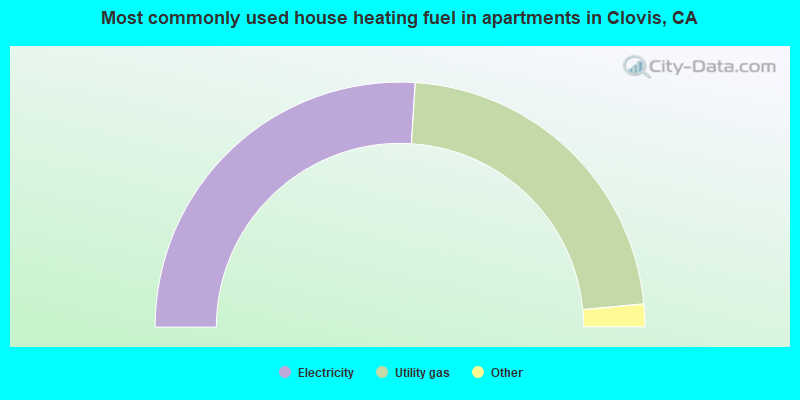
House heating fuel used in apartments - Utility gas (%)
House heating fuel used in apartments - Bottled, tank, or LP gas (%)
House heating fuel used in apartments - Electricity (%)
House heating fuel used in apartments - Fuel oil, kerosene, etc. (%)
House heating fuel used in apartments - Coal or coke (%)
House heating fuel used in apartments - Wood (%)
House heating fuel used in apartments - Solar energy (%)
House heating fuel used in apartments - Other fuel (%)
House heating fuel used in apartments - No fuel used (%)
Armed forces status - In Armed Forces (%)
Armed forces status - Civilian (%)
Armed forces status - Civilian - Veteran (%)
Armed forces status - Civilian - Nonveteran (%)
Fatal accidents locations in years 2005-2021
Fatal accidents locations in 2005
Fatal accidents locations in 2006
Fatal accidents locations in 2007
Fatal accidents locations in 2008
Fatal accidents locations in 2009
Fatal accidents locations in 2010
Fatal accidents locations in 2011
Fatal accidents locations in 2012
Fatal accidents locations in 2013
Fatal accidents locations in 2014
Fatal accidents locations in 2015
Fatal accidents locations in 2016
Fatal accidents locations in 2017
Fatal accidents locations in 2018
Fatal accidents locations in 2019
Fatal accidents locations in 2020
Fatal accidents locations in 2021
Alcohol use - People drinking some alcohol every month (%)
Alcohol use - People not drinking at all (%)
Alcohol use - Average days/month drinking alcohol
Alcohol use - Average drinks/week
Alcohol use - Average days/year people drink much
Audiometry - Average condition of hearing (%)
Audiometry - People that can hear a whisper from across a quiet room (%)
Audiometry - People that can hear normal voice from across a quiet room (%)
Audiometry - Ears ringing, roaring, buzzing (%)
Audiometry - Had a job exposure to loud noise (%)
Audiometry - Had off-work exposure to loud noise (%)
Blood Pressure & Cholesterol - Has high blood pressure (%)
Blood Pressure & Cholesterol - Checking blood pressure at home (%)
Blood Pressure & Cholesterol - Frequently checking blood cholesterol (%)
Blood Pressure & Cholesterol - Has high cholesterol level (%)
Consumer Behavior - Money monthly spent on food at supermarket/grocery store
Consumer Behavior - Money monthly spent on food at other stores
Consumer Behavior - Money monthly spent on eating out
Consumer Behavior - Money monthly spent on carryout/delivered foods
Consumer Behavior - Income spent on food at supermarket/grocery store (%)
Consumer Behavior - Income spent on food at other stores (%)
Consumer Behavior - Income spent on eating out (%)
Consumer Behavior - Income spent on carryout/delivered foods (%)
Current Health Status - General health condition (%)
Current Health Status - Blood donors (%)
Current Health Status - Has blood ever tested for HIV virus (%)
Current Health Status - Left-handed people (%)
Dermatology - People using sunscreen (%)
Diabetes - Diabetics (%)
Diabetes - Had a blood test for high blood sugar (%)
Diabetes - People taking insulin (%)
Diet Behavior & Nutrition - Diet health (%)
Diet Behavior & Nutrition - Milk product consumption (# of products/month)
Diet Behavior & Nutrition - Meals not home prepared (#/week)
Diet Behavior & Nutrition - Meals from fast food or pizza place (#/week)
Diet Behavior & Nutrition - Ready-to-eat foods (#/month)
Diet Behavior & Nutrition - Frozen meals/pizza (#/month)
Drug Use - People that ever used marijuana or hashish (%)
Drug Use - Ever used hard drugs (%)
Drug Use - Ever used any form of cocaine (%)
Drug Use - Ever used heroin (%)
Drug Use - Ever used methamphetamine (%)
Health Insurance - People covered by health insurance (%)
Kidney Conditions-Urology - Avg. # of times urinating at night
Medical Conditions - People with asthma (%)
Medical Conditions - People with anemia (%)
Medical Conditions - People with psoriasis (%)
Medical Conditions - People with overweight (%)
Medical Conditions - Elderly people having difficulties in thinking or remembering (%)
Medical Conditions - People who ever received blood transfusion (%)
Medical Conditions - People having trouble seeing even with glass/contacts (%)
Medical Conditions - People with arthritis (%)
Medical Conditions - People with gout (%)
Medical Conditions - People with congestive heart failure (%)
Medical Conditions - People with coronary heart disease (%)
Medical Conditions - People with angina pectoris (%)
Medical Conditions - People who ever had heart attack (%)
Medical Conditions - People who ever had stroke (%)
Medical Conditions - People with emphysema (%)
Medical Conditions - People with thyroid problem (%)
Medical Conditions - People with chronic bronchitis (%)
Medical Conditions - People with any liver condition (%)
Medical Conditions - People who ever had cancer or malignancy (%)
Mental Health - People who have little interest in doing things (%)
Mental Health - People feeling down, depressed, or hopeless (%)
Mental Health - People who have trouble sleeping or sleeping too much (%)
Mental Health - People feeling tired or having little energy (%)
Mental Health - People with poor appetite or overeating (%)
Mental Health - People feeling bad about themself (%)
Mental Health - People who have trouble concentrating on things (%)
Mental Health - People moving or speaking slowly or too fast (%)
Mental Health - People having thoughts they would be better off dead (%)
Oral Health - Average years since last visit a dentist
Oral Health - People embarrassed because of mouth (%)
Oral Health - People with gum disease (%)
Oral Health - General health of teeth and gums (%)
Oral Health - Average days a week using dental floss/device
Oral Health - Average days a week using mouthwash for dental problem
Oral Health - Average number of teeth
Pesticide Use - Households using pesticides to control insects (%)
Pesticide Use - Households using pesticides to kill weeds (%)
Physical Activity - People doing vigorous-intensity work activities (%)
Physical Activity - People doing moderate-intensity work activities (%)
Physical Activity - People walking or bicycling (%)
Physical Activity - People doing vigorous-intensity recreational activities (%)
Physical Activity - People doing moderate-intensity recreational activities (%)
Physical Activity - Average hours a day doing sedentary activities
Physical Activity - Average hours a day watching TV or videos
Physical Activity - Average hours a day using computer
Physical Functioning - People having limitations keeping them from working (%)
Physical Functioning - People limited in amount of work they can do (%)
Physical Functioning - People that need special equipment to walk (%)
Physical Functioning - People experiencing confusion/memory problems (%)
Physical Functioning - People requiring special healthcare equipment (%)
Prescription Medications - Average number of prescription medicines taking
Preventive Aspirin Use - Adults 40+ taking low-dose aspirin (%)
Reproductive Health - Vaginal deliveries (%)
Reproductive Health - Cesarean deliveries (%)
Reproductive Health - Deliveries resulted in a live birth (%)
Reproductive Health - Pregnancies resulted in a delivery (%)
Reproductive Health - Women breastfeeding newborns (%)
Reproductive Health - Women that had a hysterectomy (%)
Reproductive Health - Women that had both ovaries removed (%)
Reproductive Health - Women that have ever taken birth control pills (%)
Reproductive Health - Women taking birth control pills (%)
Reproductive Health - Women that have ever used Depo-Provera or injectables (%)
Reproductive Health - Women that have ever used female hormones (%)
Sexual Behavior - People 18+ that ever had sex (vaginal, anal, or oral) (%)
Sexual Behavior - Males 18+ that ever had vaginal sex with a woman (%)
Sexual Behavior - Males 18+ that ever performed oral sex on a woman (%)
Sexual Behavior - Males 18+ that ever had anal sex with a woman (%)
Sexual Behavior - Males 18+ that ever had any sex with a man (%)
Sexual Behavior - Females 18+ that ever had vaginal sex with a man (%)
Sexual Behavior - Females 18+ that ever performed oral sex on a man (%)
Sexual Behavior - Females 18+ that ever had anal sex with a man (%)
Sexual Behavior - Females 18+ that ever had any kind of sex with a woman (%)
Sexual Behavior - Average age people first had sex
Sexual Behavior - Average number of female sex partners in lifetime (males 18+)
Sexual Behavior - Average number of female vaginal sex partners in lifetime (males 18+)
Sexual Behavior - Average age people first performed oral sex on a woman (18+)
Sexual Behavior - Average number of woman performed oral sex on in lifetime (18+)
Sexual Behavior - Average number of male sex partners in lifetime (males 18+)
Sexual Behavior - Average number of male anal sex partners in lifetime (males 18+)
Sexual Behavior - Average age people first performed oral sex on a man (18+)
Sexual Behavior - Average number of male oral sex partners in lifetime (18+)
Sexual Behavior - People using protection when performing oral sex (%)
Sexual Behavior - Average number of times people have vaginal or anal sex a year
Sexual Behavior - People having sex without condom (%)
Sexual Behavior - Average number of male sex partners in lifetime (females 18+)
Sexual Behavior - Average number of male vaginal sex partners in lifetime (females 18+)
Sexual Behavior - Average number of female sex partners in lifetime (females 18+)
Sexual Behavior - Circumcised males 18+ (%)
Sleep Disorders - Average hours sleeping at night
Sleep Disorders - People that has trouble sleeping (%)
Smoking-Cigarette Use - People smoking cigarettes (%)
Taste & Smell - People 40+ having problems with smell (%)
Taste & Smell - People 40+ having problems with taste (%)
Taste & Smell - People 40+ that ever had wisdom teeth removed (%)
Taste & Smell - People 40+ that ever had tonsils teeth removed (%)
Taste & Smell - People 40+ that ever had a loss of consciousness because of a head injury (%)
Taste & Smell - People 40+ that ever had a broken nose or other serious injury to face or skull (%)
Taste & Smell - People 40+ that ever had two or more sinus infections (%)
Weight - Average height (inches)
Weight - Average weight (pounds)
Weight - Average BMI
Weight - People that are obese (%)
Weight - People that ever were obese (%)
Weight - People trying to lose weight (%)
57,962 46.5% White alone 43,494 34.9% Hispanic 14,429 11.6% Asian alone 4,062 3.3% Two or more races 1,876 1.5% Black alone 1,841 1.5% Other race alone 821 0.7% American Indian alone 61 0.05% Native Hawaiian and Other
According to our research of California and other state lists, there were 127 registered sex offenders living in Clovis, California as of April 27, 2024 . The ratio of all residents to sex offenders in Clovis is 839 to 1.The ratio of registered sex offenders to all residents in this city is near the state average.
The City-Data.com crime index weighs serious crimes and violent crimes more heavily. Higher means more crime, U.S. average is 246.1. It adjusts for the number of visitors and daily workers commuting into cities.
- means the value is smaller than the state average.
- means the value is about the same as the state average.
- means the value is bigger than the state average.
- means the value is much bigger than the state average.
Crime rate in Clovis detailed stats: murders, rapes, robberies, assaults, burglaries, thefts, arson Officers per 1,000 residents here:
0.84California average:
2.30
Latest news from Clovis, CA collected exclusively by city-data.com from local newspapers, TV, and radio stations
Ancestries: German (5.4%), English (4.9%), Irish (3.9%), American (2.7%), Italian (2.5%), European (2.2%).
Current Local Time:
Land area: 17.1 square miles.
Population density: 7,277 people per square mile (high).
15,072 residents are foreign born (6.8% Asia , 4.3% Latin America ).
This city:
12.4%California:
26.5%
Median real estate property taxes paid for housing units with mortgages in 2022: $3,966 (0.8%)Median real estate property taxes paid for housing units with no mortgage in 2022: $3,861 (0.9%)
Nearest city with pop. 200,000+: Fresno, CA
Nearest city with pop. 1,000,000+: Los Angeles, CA
Nearest cities:
Latitude: 36.82 N, Longitude: 119.69 W
Nickname or alias (official or unofficial): Gateway to the Sierra
Daytime population change due to commuting: -19,923 (-16.0%)Workers who live and work in this city: 20,412 (33.7%)
Property values in Clovis, CA
Single-family new house construction building permits:
2022: 476 buildings , average cost: $374,0002021: 824 buildings , average cost: $292,5002020: 1049 buildings , average cost: $305,9002019: 760 buildings , average cost: $294,9002018: 892 buildings , average cost: $285,7002017: 766 buildings , average cost: $275,8002016: 1086 buildings , average cost: $277,3002015: 852 buildings , average cost: $273,4002014: 604 buildings , average cost: $262,7002013: 828 buildings , average cost: $268,3002012: 367 buildings , average cost: $240,2002011: 320 buildings , average cost: $220,0002010: 387 buildings , average cost: $223,8002009: 571 buildings , average cost: $228,2002008: 393 buildings , average cost: $227,7002007: 570 buildings , average cost: $237,8002006: 685 buildings , average cost: $234,1002005: 1300 buildings , average cost: $251,2002004: 1431 buildings , average cost: $233,5002003: 1379 buildings , average cost: $211,7002002: 1312 buildings , average cost: $194,2002001: 1036 buildings , average cost: $191,3002000: 507 buildings , average cost: $187,0001999: 362 buildings , average cost: $177,9001998: 390 buildings , average cost: $170,3001997: 280 buildings , average cost: $149,300Unemployment in December 2023:
Population change in the 1990s: +17,414 (+34.1%).
Most common occupations in Clovis, CA (%)
Both Males Females
Cooks and food preparation workers (5.7%)
Other management occupations, except farmers and farm managers (5.1%)
Registered nurses (3.5%)
Building and grounds cleaning and maintenance occupations (3.1%)
Retail sales workers, except cashiers (2.8%)
Other office and administrative support workers, including supervisors (2.5%)
Cashiers (2.4%)
Other management occupations, except farmers and farm managers (6.4%)
Building and grounds cleaning and maintenance occupations (5.0%)
Cooks and food preparation workers (4.3%)
Driver/sales workers and truck drivers (3.9%)
Retail sales workers, except cashiers (3.4%)
Law enforcement workers, including supervisors (2.8%)
Electrical equipment mechanics and other installation, maintenance, and repair workers, including supervisors (2.6%)
Cooks and food preparation workers (7.2%)
Registered nurses (6.5%)
Secretaries and administrative assistants (4.5%)
Other office and administrative support workers, including supervisors (4.4%)
Cashiers (4.2%)
Supervisors and other personal care and service workers, except child care workers (4.1%)
Other management occupations, except farmers and farm managers (3.7%)
Earthquake activity:
Clovis-area historical earthquake activity is significantly above California state average. It is 8539% greater than the overall U.S. average. On 7/21/1952 at 11:52:14, a magnitude 7.7 (7.7 UK, Class: Major, Intensity: VIII - XII) earthquake occurred 131.7 miles away from Clovis center, causing $50,000,000 total damage On 4/18/1906 at 13:12:21, a magnitude 7.9 (7.9 UK) earthquake occurred 199.1 miles away from the city center, causing $524,000,000 total damage On 11/4/1927 at 13:51:53, a magnitude 7.5 (7.5 UK) earthquake occurred 151.5 miles away from Clovis center On 10/18/1989 at 00:04:15, a magnitude 7.1 (6.5 MB, 7.1 MS, 6.9 MW, 7.0 ML) earthquake occurred 116.4 miles away from the city center, causing 62 deaths ( 62 shaking deaths) and 3757 injuries, causing $1,305,032,704 total damage On 12/21/1932 at 06:10:09, a magnitude 7.2 (7.2 UK) earthquake occurred 146.5 miles away from the city center On 6/28/1992 at 11:57:34, a magnitude 7.6 (6.2 MB, 7.6 MS, 7.3 MW, Depth: 0.7 mi) earthquake occurred 254.8 miles away from Clovis center, causing 3 deaths ( 1 shaking deaths, 2 other deaths) and 400 injuries, causing $100,000,000 total damage and $40,000,000 insured lossesMagnitude types: body-wave magnitude (MB), local magnitude (ML), surface-wave magnitude (MS), moment magnitude (MW) Natural disasters: The number of natural disasters in Fresno County (12) is smaller than the US average (15).Major Disasters (Presidential) Declared: 8Emergencies Declared: 2Floods: 6, Storms: 4, Winter Storms: 3, Freezes: 2, Landslides: 2, Drought: 1, Fire: 1, Hurricane: 1, Other: 1 (Note: some incidents may be assigned to more than one category). Main business address for: CENTRAL VALLEY COMMUNITY BANCORP STATE COMMERCIAL BANKS ).
Hospitals and medical centers in Clovis: CLOVIS COMMUNITY MEDICAL CENTER (Voluntary non-profit - Private, provides emergency services, 2755 HERNDON AVE) CPC-SIERRA GATEWAY HOSPITAL (650 WEST ALLUVIAL) GOOD SHEPHERD COMMUNITIES-DEWITT (898 NORTH DEWITT) WELCOME CARE HOME, BUCKINGHAM (1427 BUCKINGHAM WAY) CLOVIS NURSING HOME (2604 CLOVIS AVE)
GOLDEN LIVINGCENTER - CLOVIS (111 BARSTOW AVE.)
WILLOW CREEK HEALTHCARE CENTER (650 W. ALLUVIAL)
COMMUNITY DIALYSIS CENTER - CLOVIS (685 MEDICAL CENTER DR. WEST #105X)
Amtrak station near Clovis: 8 miles: FRESNO (2650 TULARE ST.) Services: ticket office, fully wheelchair accessible, enclosed waiting area, public restrooms, public payphones, vending machines, free short-term parking, free long-term parking, call for car rental service, call for taxi service, intercity bus service, public transit connection.
Colleges/Universities in Clovis: Institute of Technology Inc Full-time enrollment: 2,483; Location: 564 W Herndon; Private, for-profit; Website: www.it-colleges.edu)
Milan Institute-Clovis Full-time enrollment: 741; Location: 731 A West Shaw Ave.; Private, for-profit; Website: www.milaninstitute.edu)
Clovis Adult Education Full-time enrollment: 561; Location: 1452 David E Cook Way; Public; Website: www.clovisadultschool.com)
Kaplan College-Fresno Full-time enrollment: 557; Location: 44 Shaw Avenue, Rodeo Plaza; Private, for-profit; Website: www.kaplancollege.com/fresno-ca/)
ITT Technical Institute-Clovis Full-time enrollment: 506; Location: 362 North Clovis Ave; Private, for-profit; Website: www.itt-tech.edu)
San Joaquin College of Law Location: 901 Fifth St; Private, not-for-profit; Website: www.sjcl.edu; Offers Doctor's degree )
Galen College of Medical and Dental Assistants Location: 1840 Shaw Ave Ste 105; Private, for-profit; Website: www.galencollege.com)
Other colleges/universities with over 2000 students near Clovis:
California State University-Fresno (about 3 miles; Fresno, CA ; Full-time enrollment: 18,993)
Heald College-Fresno (about 6 miles; Fresno, CA ; FT enrollment: 2,199)
University of Phoenix-Central Valley Campus (about 6 miles; Fresno, CA ; FT enrollment: 2,109)
Fresno City College (about 7 miles; Fresno, CA ; FT enrollment: 12,994)
Fresno Pacific University (about 7 miles; Fresno, CA ; FT enrollment: 3,083)
Reedley College (about 20 miles; Reedley, CA ; FT enrollment: 8,144)
West Hills College-Lemoore (about 38 miles; Lemoore, CA ; FT enrollment: 2,314)
Public high schools in Clovis: BUCHANAN HIGH Students: 1,925, Location: 1560 N. MINNEWAWA AVE., Grades: 9-12)CLOVIS HIGH Students: 1,748, Location: 1055 FOWLER AVE., Grades: 9-12)CLOVIS EAST HIGH Students: 1,663, Location: 2940 LEONARD AVE., Grades: 9-12)CLOVIS ONLINE CHARTER Students: 40, Location: 1655 DAVID E. COOK WAY, Grades: 7-12, Charter school )GATEWAY HIGH (CONTINUATION) Students: 39, Location: 1550 HERNDON AVE., Grades: 9-12)CLOVIS COMMUNITY DAY SECONDARY Students: 38, Location: 1655 DAVID E. COOK WAY, Grades: 7-12)ENTERPRISE ALTERNATIVE Students: 27, Location: 1550 HERNDON AVE., Grades: KG-12)ACADEMY OF ARTS AND SCIENCES: FRESNO Location: 1865 HERNDON AVE. K88, Grades: KG-12, Charter school )
Biggest public elementary/middle schools in Clovis: CLARK INTERMEDIATE Students: 1,340, Location: 902 FIFTH ST., Grades: 7-8)ALTA SIERRA INTERMEDIATE Students: 1,207, Location: 380 W. TEAGUE AVE., Grades: 7-8)REYBURN INTERMEDIATE Students: 1,045, Location: 2901 DEWOLF AVE., Grades: 7-8)GARFIELD ELEMENTARY Students: 542, Location: 1315 N. PEACH AVE., Grades: KG-6)DRY CREEK ELEMENTARY Students: 540, Location: 1273 N. ARMSTRONG AVE., Grades: KG-6)CENTURY ELEMENTARY Students: 515, Location: 965 N. SUNNYSIDE AVE., Grades: KG-6)RED BANK ELEMENTARY Students: 504, Location: 1454 LOCAN AVE., Grades: KG-6)WOODS (HAROLD L.) ELEMENTARY Students: 496, Location: 700 TEAGUE AVE., Grades: KG-6)COLE ELEMENTARY Students: 493, Location: 615 W. STUART AVE., Grades: KG-6)CEDARWOOD ELEMENTARY Students: 489, Location: 2851 PALO ALTO AVE., Grades: KG-6)Private elementary/middle schools in Clovis: OUR LADY OF PERPETUAL HELP SCHOOL Students: 200, Location: 836 DEWITT AVE, Grades: PK-8)
CHARLIE KEYAN ARMENIAN COMMUNITY SCHOOL Students: 97, Location: 108 N VILLA AVE, Grades: PK-6)
VALLEY CRESCENT SCHOOL Students: 90, Location: 547 W NEES AVE, Grades: KG-8)
See full list of schools located in Clovis User-submitted facts and corrections:
Clovis has a new zip code: 93619
Notable locations in Clovis: (A) , Carnegie Community Center (B) , Veterans Memorial Building (C) , Clovis Senior Center (D) , Clovis School District Office (E) , Clovis Regional Library (F) , Clovis Civic Center (G) , Fresno County Fire Protection District Station 85 Clovis (H) , Clovis Fire Department Station 45 (I) , Clovis Fire Department Station 44 (J) , Clovis Fire Department Station 43 (K) , Clovis Fire Department Station 42 (L) , Clovis Fire Department Station 41 (M) . Display/hide their locations on the map
Shopping Centers: (1) , Wild West Village Shopping Center (2) , Western Village Shopping Center (3) , Sierra Vista Shopping Center (4) , Sierra Pavillon Shopping Center (5) , Rodeo Plaza Shopping Center (6) , Clovis Shopping Center (7) , Bonanza Shopping Center (8) . Display/hide their locations on the map
Main business address in Clovis: (A) . Display/hide its location on the map
Churches in Clovis include: (A) , Mount Moriah Baptist Church (B) , Our Lady of Perpetual Help Roman Catholic Church (C) , Vineyard Christian Fellowship Church (D) , Church of Christ (E) , Church of God of Prophecy (F) , Clovis Christian Church (G) , Clovis Foursquare Church (H) , Clovis Japanese Free Methodist Church (I) . Display/hide their locations on the map
Cemetery: (1) . Display/hide its location on the map
Parks in Clovis include: (1) , Sierra Bicentennial Park (2) , Jefferson Park (3) , Lamonica Stadium (4) , San Gabriel Park (5) , Letterman Park (6) . Display/hide their locations on the map
Tourist attractions: (1) , C&D Property Management (284 Caesar Avenue) (2) . Display/hide their approximate locations on the map
Hotel: (1) . Display/hide its approximate location on the map
Birthplace of: Chris Colfer - Actor, Amanda Dobbs - Figure skater, Stephen Spach - 2005 NFL player (Philadelphia Eagles, born : Jul 18, 1982), Tyler Bray - Football quarterback, Zack Follett - Football player, Jack Shepard (baseball) - Baseball player, Andre Nestle - College football player (Cal Poly Mustangs), Dave Lewis (punter) - Football player, Jake Sandvig - Child actor, Lloyd Merriman - Baseball player.
Fresno County has a predicted average indoor radon screening level between 2 and 4 pCi/L (pico curies per liter) - Moderate Potential Drinking water stations with addresses in Clovis and their reported violations in the past:
WILD WATER ADVENTURES (Population served: 3,000, Groundwater):
Past health violations:
MCL, Monthly (TCR) - In JUL-2010, Contaminant: Coliform. Follow-up actions: St AO (w/o penalty) issued (SEP-27-2010)
MCL, Monthly (TCR) - In AUG-2008, Contaminant: Coliform. Follow-up actions: St AO (w/o penalty) issued (OCT-30-2008)
Past monitoring violations:
2 regular monitoring violations
Population served: 450, Groundwater):
Past health violations:
MCL, Monthly (TCR) - In SEP-2011, Contaminant: Coliform. Follow-up actions: St AO (w/o penalty) issued (NOV-15-2011)
MCL, Monthly (TCR) - In MAR-2006, Contaminant: Coliform. Follow-up actions: St AO (w/o penalty) issued (JAN-01-2006)
MCL, Monthly (TCR) - In JUN-2005, Contaminant: Coliform. Follow-up actions: St AO (w/o penalty) issued (APR-01-2005)
Past monitoring violations:
3 routine major monitoring violations
One regular monitoring violation
Population served: 225, Groundwater):
Past health violations:
MCL, Monthly (TCR) - In JUL-2008, Contaminant: Coliform. Follow-up actions: St Public Notif requested (SEP-05-2008), St Violation/Reminder Notice (SEP-05-2008)
MCL, Acute (TCR) - In JUN-2008, Contaminant: Coliform. Follow-up actions: St Public Notif requested (JUN-23-2008), St Violation/Reminder Notice (JUN-23-2008)
MCL, Monthly (TCR) - In SEP-2007, Contaminant: Coliform. Follow-up actions: St Violation/Reminder Notice (NOV-15-2007)
MCL, Monthly (TCR) - In AUG-2007, Contaminant: Coliform. Follow-up actions: St Public Notif requested (JUL-19-2007), St Formal NOV issued (OCT-03-2007)
MCL, Monthly (TCR) - In JUL-2007, Contaminant: Coliform. Follow-up actions: St Violation/Reminder Notice (JUN-18-2007), St Public Notif requested (JUL-19-2007), St Formal NOV issued (JUL-19-2007)
MCL, Monthly (TCR) - In MAY-2007, Contaminant: Coliform. Follow-up actions: St Formal NOV issued (AUG-28-2006), St Violation/Reminder Notice (JUN-18-2007)
Past monitoring violations:
5 routine major monitoring violations
One regular monitoring violation
Population served: 175, Groundwater):
Past monitoring violations:
3 regular monitoring violations
Population served: 175, Groundwater):
Past health violations:
MCL, Monthly (TCR) - In JUL-2013, Contaminant: Coliform. Follow-up actions: St AO (w/o penalty) issued (NOV-12-2013)
MCL, Monthly (TCR) - In SEP-2012, Contaminant: Coliform. Follow-up actions: St AO (w/o penalty) issued (NOV-07-2012)
MCL, Monthly (TCR) - In OCT-2010, Contaminant: Coliform. Follow-up actions: St AO (w/o penalty) issued (MAR-04-2011)
MCL, Monthly (TCR) - In OCT-2008, Contaminant: Coliform. Follow-up actions: St AO (w/o penalty) issued (JAN-16-2009)
MCL, Monthly (TCR) - In SEP-2008, Contaminant: Coliform. Follow-up actions: St AO (w/o penalty) issued (JAN-16-2009)
MCL, Monthly (TCR) - In JUL-2008, Contaminant: Coliform. Follow-up actions: St AO (w/o penalty) issued (SEP-24-2008)
Past monitoring violations:
2 minor monitoring violations
2 regular monitoring violations
Population served: 175, Groundwater):
Past monitoring violations:
4 regular monitoring violations
Population served: 175, Groundwater):
Past health violations:
MCL, Monthly (TCR) - In SEP-2012, Contaminant: Coliform. Follow-up actions: St AO (w/o penalty) issued (NOV-07-2012)
MCL, Monthly (TCR) - In JUL-2012, Contaminant: Coliform. Follow-up actions: St AO (w/o penalty) issued (SEP-21-2012), St Compliance achieved (NOV-06-2012)
MCL, Monthly (TCR) - In JUL-2011, Contaminant: Coliform. Follow-up actions: St AO (w/o penalty) issued (SEP-23-2011), St Compliance achieved (NOV-06-2012)
Past monitoring violations:
One routine major monitoring violation
2 regular monitoring violations
Population served: 175, Groundwater):
Past monitoring violations:
2 minor monitoring violations
3 regular monitoring violations
Average household size: This city:
2.9 peopleCalifornia:
2.9 people
Percentage of family households: This city:
73.1%Whole state:
68.7%
Percentage of households with unmarried partners: This city:
6.5%Whole state:
7.2%
Likely homosexual households (counted as self-reported same-sex unmarried-partner households)
Lesbian couples: 0.4% of all households Gay men: 0.2% of all households
People in group quarters in Clovis in 2010:
221 people in nursing facilities/skilled-nursing facilities
79 people in group homes intended for adults
32 people in workers' group living quarters and job corps centers
28 people in group homes for juveniles (non-correctional)
14 people in residential treatment centers for adults
6 people in in-patient hospice facilities
5 people in other noninstitutional facilities
3 people in residential treatment centers for juveniles (non-correctional)
People in group quarters in Clovis in 2000:
224 people in nursing homes
179 people in other noninstitutional group quarters
29 people in schools, hospitals, or wards for the intellectually disabled
28 people in other nonhousehold living situations
18 people in homes for the mentally retarded
2 people in religious group quarters
Banks with most branches in Clovis (2011 data):
JPMorgan Chase Bank, National Association: 556 Shaw Avenue Branch, Clovis Branch, Herndon & Fowler Banking Center, Shaw Ave Savemart Branch, North Willow Avenue Branch. Info updated 2011/11/10: Bank assets: $1,811,678.0 mil, Deposits: $1,190,738.0 mil, headquarters in Columbus, OH, positive income , International Specialization, 5577 total offices , Holding Company: Jpmorgan Chase & Co.
Wells Fargo Bank, National Association: Clovis Branch, Windmill Plaza Branch, Shaw Avenue Save Mart Banking Center. Info updated 2011/04/05: Bank assets: $1,161,490.0 mil, Deposits: $905,653.0 mil, headquarters in Sioux Falls, SD, positive income , 6395 total offices , Holding Company: Wells Fargo & Company
Union Bank, National Association: Clovis Branch at 840 Herndon Ave, branch established on 1998/10/05; West Clovis Instore Branch at 1157 N Willow Ave, branch established on 2011/06/30. Info updated 2011/09/01: Bank assets: $88,967.5 mil, Deposits: $65,286.4 mil, headquarters in San Francisco, CA, positive income , Commercial Lending Specialization, 403 total offices , Holding Company: Mitsubishi Ufj Financial Group, Inc.
Central Valley Community Bank: Herndon & Fowler Branch at 1795 Herndon Ave Ste 101, branch established on 1995/08/15; Clovis Branch at 600 Pollasky Avenue, branch established on 2007/10/01. Info updated 2008/11/25: Bank assets: $848.4 mil, Deposits: $714.0 mil, headquarters in Fresno, CA, positive income , Commercial Lending Specialization, 17 total offices , Holding Company: Central Valley Community Bancorp
Westamerica Bank: South Clovis Branch at 536 Shaw Ave, branch established on 2005/08/01. Info updated 2011/06/21: Bank assets: $4,998.1 mil, Deposits: $4,253.2 mil, headquarters in San Rafael, CA, positive income , Commercial Lending Specialization, 98 total offices , Holding Company: Westamerica Bancorporation
Bank of the West: Clovis Branch at 200 Shaw Avenue, branch established on 1976/03/26. Info updated 2009/11/16: Bank assets: $62,408.3 mil, Deposits: $43,995.2 mil, headquarters in San Francisco, CA, positive income , 647 total offices , Holding Company: Bnp Paribas
Bank of America, National Association: Clovis Branch at 855 Pollasky Avenue, branch established on 1904/10/17. Info updated 2009/11/18: Bank assets: $1,451,969.3 mil, Deposits: $1,077,176.8 mil, headquarters in Charlotte, NC, positive income , 5782 total offices , Holding Company: Bank Of America Corporation
Citibank, National Association: 20 W Shaw Ave Branch at 20 W Shaw Ave, branch established on 1919/01/01. Info updated 2012/01/10: Bank assets: $1,288,658.0 mil, Deposits: $882,541.0 mil, headquarters in Sioux Falls, SD, positive income , International Specialization, 1048 total offices , Holding Company: Citigroup Inc.
Bank of the Sierra: Clovis Branch at 1710 Clovis Avenue, branch established on 2004/06/15. Info updated 2006/11/03: Bank assets: $1,332.3 mil, Deposits: $1,091.7 mil, headquarters in Porterville, CA, positive income , Commercial Lending Specialization, 26 total offices , Holding Company: Sierra Bancorp
For population 15 years and over in Clovis:
Never married: 28.7%Now married: 56.4%Separated: 1.3%Widowed: 4.5%Divorced: 9.1% For population 25 years and over in Clovis:
High school or higher: 90.9%Bachelor's degree or higher: 34.8%Graduate or professional degree: 14.4%Unemployed: 4.2%Mean travel time to work (commute): 22.1 minutes
Education Gini index (Inequality in education) Here:
12.2California average:
15.5
Religion statistics for Clovis, CA (based on Fresno County data)
Religion Adherents Congregations Catholic 288,324 43 Evangelical Protestant 126,004 463 Other 37,977 95 Mainline Protestant 16,843 70 Orthodox 7,768 9 Black Protestant 4,160 21 None 449,374 -
Source: Clifford Grammich, Kirk Hadaway, Richard Houseal, Dale E.Jones, Alexei Krindatch, Richie Stanley and Richard H.Taylor. 2012. 2010 U.S.Religion Census: Religious Congregations & Membership Study. Association of Statisticians of American Religious Bodies. Jones, Dale E., et al. 2002. Congregations and Membership in the United States 2000. Nashville, TN: Glenmary Research Center. Graphs represent county-level data
Food Environment Statistics: Number of grocery stores : 215This county :
2.40 / 10,000 pop.State :
2.14 / 10,000 pop.
Number of supercenters and club stores : 4This county :
0.04 / 10,000 pop.California :
0.04 / 10,000 pop.
Number of convenience stores (no gas) : 108Fresno County :
1.21 / 10,000 pop.California :
0.62 / 10,000 pop.
Number of convenience stores (with gas) : 190Fresno County :
2.12 / 10,000 pop.California :
1.49 / 10,000 pop.
Number of full-service restaurants : 516This county :
5.77 / 10,000 pop.California :
7.42 / 10,000 pop.
Adult diabetes rate : This county :
7.6%California :
7.3%
Adult obesity rate : Fresno County :
26.4%State :
21.3%
Low-income preschool obesity rate : This county :
17.5%California :
17.9%
Health and Nutrition: Healthy diet rate : Clovis:
51.0%California:
49.4%
Average overall health of teeth and gums : Average BMI : This city:
28.4California:
28.1
People feeling badly about themselves : Clovis:
19.8%California:
20.2%
People not drinking alcohol at all : Average hours sleeping at night : Overweight people : Clovis:
33.9%California:
31.5%
General health condition : This city:
58.5%California:
56.4%
Average condition of hearing : Here:
81.2%California:
80.9%
More about Health and Nutrition of Clovis, CA Residents
Local government employment and payroll (March 2022)
Function
Full-time employees
Monthly full-time payroll
Average yearly full-time wage
Part-time employees
Monthly part-time payroll
Police Protection - Officers
103 $1,069,584 $124,612 0 $0 Firefighters
67 $715,320 $128,117 0 $0 Solid Waste Management
60 $395,213 $79,043 1 $2,856 Police - Other
55 $402,358 $87,787 21 $49,509 Water Supply
45 $317,291 $84,611 0 $0 Other and Unallocable
38 $270,108 $85,297 3 $7,964 Financial Administration
36 $283,652 $94,551 5 $9,404 Housing and Community Development (Local)
27 $247,611 $110,049 2 $2,394 Other Government Administration
25 $227,917 $109,400 5 $7,275 Parks and Recreation
23 $136,614 $71,277 17 $24,578 Welfare
16 $93,970 $70,478 28 $45,467 Streets and Highways
15 $91,346 $73,077 0 $0 Transit
14 $74,283 $63,671 16 $6,922 Sewerage
10 $63,538 $76,246 0 $0 Health
7 $50,202 $86,061 6 $11,213 Fire - Other
6 $48,974 $97,948 1 $2,716
Totals for Government
547 $4,487,979 $98,457 105 $170,298
Clovis government finances - Expenditure in 2021 (per resident):
Construction - Regular Highways: $20,083,000 ($161.24)
Parks and Recreation: $940,000 ($7.55)Current Operations - Police Protection: $37,776,000 ($303.29)
Solid Waste Management: $21,643,000 ($173.76)Water Utilities: $21,090,000 ($169.32)Local Fire Protection: $18,498,000 ($148.51)Central Staff Services: $15,499,000 ($124.43)Transit Utilities: $12,261,000 ($98.44)Sewerage: $10,649,000 ($85.50)Regular Highways: $10,601,000 ($85.11)General - Other: $4,332,000 ($34.78)Financial Administration: $3,144,000 ($25.24)Housing and Community Development: $2,615,000 ($20.99)Health - Other: $2,197,000 ($17.64)Judicial and Legal Services: $894,000 ($7.18)Parks and Recreation: $613,000 ($4.92)Protective Inspection and Regulation - Other: $9,000 ($0.07)General - Interest on Debt: $4,579,000 ($36.76)
Other Capital Outlay - Regular Highways: $372,000 ($2.99)
Transit Utilities: $153,000 ($1.23)Police Protection: $30,000 ($0.24)Water Utilities - Interest on Debt: $925,000 ($7.43)
Clovis government finances - Revenue in 2021 (per resident):
Charges - Other: $23,886,000 ($191.77)
Solid Waste Management: $22,068,000 ($177.17)Sewerage: $20,770,000 ($166.75)Parks and Recreation: $5,357,000 ($43.01)Federal Intergovernmental - Other: $14,545,000 ($116.77)
Housing and Community Development: $2,320,000 ($18.63)Local Intergovernmental - Transit Utilities: $1,826,000 ($14.66)
Other: $612,000 ($4.91)Miscellaneous - Special Assessments: $2,652,000 ($21.29)
Interest Earnings: $2,440,000 ($19.59)Fines and Forfeits: $279,000 ($2.24)Donations From Private Sources: $224,000 ($1.80)General Revenue - Other: $218,000 ($1.75)Rents: $2,000 ($0.02)Revenue - Water Utilities: $22,887,000 ($183.75)
Transit Utilities: $39,000 ($0.31)State Intergovernmental - Transit Utilities: $9,095,000 ($73.02)
Other: $6,628,000 ($53.21)Highways: $4,743,000 ($38.08)General Local Government Support: $125,000 ($1.00)Tax - General Sales and Gross Receipts: $33,120,000 ($265.90)
Property: $28,855,000 ($231.66)Occupation and Business License - Other: $3,761,000 ($30.20)Other Selective Sales: $2,674,000 ($21.47)Public Utilities Sales: $2,599,000 ($20.87)Other License: $1,099,000 ($8.82)Documentary and Stock Transfer: $777,000 ($6.24)
Clovis government finances - Debt in 2021 (per resident):
Long Term Debt - Outstanding Unspecified Public Purpose: $172,617,000 ($1385.86)
Beginning Outstanding - Unspecified Public Purpose: $155,341,000 ($1247.16)Issue, Unspecified Public Purpose: $28,012,000 ($224.89)Retired Unspecified Public Purpose: $10,735,000 ($86.19)
Clovis government finances - Cash and Securities in 2021 (per resident):
Bond Funds - Cash and Securities: $11,593,000 ($93.07)
Other Funds - Cash and Securities: $70,850,000 ($568.82)
Sinking Funds - Cash and Securities: $1,426,000 ($11.45)
3.57% of this county's 2021 resident taxpayers lived in other counties in 2020 ($51,894 average adjusted gross income )
Here:
3.57%California average:
5.19%
0.01% of residents moved from foreign countries ($87 average AGI )Fresno County:
0.01%California average:
0.03%
Top counties from which taxpayers relocated into this county between 2020 and 2021:
3.88% of this county's 2020 resident taxpayers moved to other counties in 2021 ($61,665 average adjusted gross income )
Here:
3.88%California average:
6.14%
0.01% of residents moved to foreign countries ($93 average AGI )Fresno County:
0.01%California average:
0.02%
Top counties to which taxpayers relocated from this county between 2020 and 2021:
Businesses in Clovis, CA
Name Count Name Count
7-Eleven 2 Lowe's 1 99 Cents Only Stores 1 Marriott 1 AMF Bowling 1 Marshalls 1 AT&T 4 MasterBrand Cabinets 2 Applebee's 1 McDonald's 4 AutoZone 2 New York & Co 1 Avenue 1 Nike 3 Bally Total Fitness 1 Nissan 1 Baskin-Robbins 2 Office Depot 2 Bath & Body Works 1 OfficeMax 1 Bed Bath & Beyond 1 Old Navy 1 Best Western 1 Olive Garden 1 Blockbuster 3 Panda Express 2 Burger King 2 Panera Bread 1 CVS 5 Papa John's Pizza 1 Carl\s Jr. 3 Payless 3 Chevrolet 1 Penske 1 Chipotle 1 PetSmart 2 Cold Stone Creamery 1 Pier 1 Imports 1 Comfort Suites 1 Pizza Hut 1 Costco 1 Qdoba Mexican Grill 1 Cricket Wireless 3 Quiznos 4 Dennys 1 RadioShack 2 Discount Tire 1 Red Robin 1 Dressbarn 1 Rite Aid 2 El Pollo Loco 2 SONIC Drive-In 2 Famous Footwear 2 Safeway 2 Fashion Bug 1 Sears 2 FedEx 10 Sprint Nextel 1 Firestone Complete Auto Care 1 Starbucks 10 Ford 1 Subway 6 GNC 2 T-Mobile 6 GameStop 2 T.J.Maxx 1 Goodwill 2 Taco Bell 5 H&R Block 7 Target 2 Haworth 1 The Room Place 1 Holiday Inn 1 Toyota 1 Home Depot 1 Toys"R"Us 1 HomeTown Buffet 1 Trader Joe's 1 Honda 1 U-Haul 4 IHOP 1 UPS 11 Jack In The Box 2 Vans 1 Jamba Juice 2 Verizon Wireless 2 Jimmy John's 1 Victoria's Secret 1 KFC 2 Volkswagen 1 Kmart 1 Vons 2 Kohl's 1 Walgreens 2 Lane Furniture 1 Walmart 1 Little Caesars Pizza 2 Wendy's 1 Long John Silver's 2
Strongest AM radio stations in Clovis:
KOOR (790 AM; 10 kW; CLOVIS, CA; Owner: INFINITY RADIO OPERATIONS INC.)
KFIG (1430 AM; 5 kW; FRESNO, CA; Owner: BIG DAWG BROADCASTING, LLC)
KYNO (1300 AM; 5 kW; FRESNO, CA; Owner: SPANISH CATHOLIC RADIO OF FRESNO, LLC)
KMJ (580 AM; 50 kW; FRESNO, CA; Owner: INFINITY RADIO OPERATIONS INC.)
KIRV (1510 AM; daytime; 10 kW; FRESNO, CA; Owner: GORE-OVERGAARD BROADCASTING, INC)
KWRU (940 AM; 50 kW; FRESNO, CA)
KXEX (1550 AM; 10 kW; FRESNO, CA; Owner: RAK COMMUNICATIONS, INC.)
KAVT (1680 AM; 10 kW; FRESNO, CA; Owner: RAK COMMUNICATIONS, INC.)
KGST (1600 AM; 5 kW; FRESNO, CA; Owner: LOTUS COMMUNICATIONS CORP.)
KCBL (1340 AM; 1 kW; FRESNO, CA; Owner: CAPSTAR TX LIMITED PARTNERSHIP)
KBIF (900 AM; 1 kW; FRESNO, CA; Owner: GORE-OVERGAARD BROADCASTING, INC.)
KCBC (770 AM; 50 kW; RIVERBANK, CA; Owner: KIERTRON, INC.)
KERI (1180 AM; 50 kW; WASCO-GREENACRES, CA; Owner: KWSO, INC.)
Strongest FM radio stations in Clovis:
KMGV (97.9 FM; FRESNO, CA; Owner: INFINITY RADIO OPERATIONS INC.)
KJWL (99.3 FM; FRESNO, CA; Owner: JOHN EDWARD OSTLUND)
KMAK (100.3 FM; ORANGE COVE, CA; Owner: RICHARD B. SMITH)
KWYE (101.1 FM; FRESNO, CA; Owner: INFINITY RADIO OPERATIONS INC.)
K203CM (88.5 FM; SANGER, CA; Owner: EDUCATIONAL MEDIA FOUNDATION)
KFNO (90.3 FM; FRESNO, CA; Owner: FAMILY STATIONS, INC.)
KLBN (105.1 FM; AUBERRY, CA; Owner: LOTUS COMMUNICATIONS CORP.)
KRNC (105.9 FM; FRESNO, CA; Owner: INFINITY RADIO OPERATIONS INC.)
KOQO-FM (101.9 FM; FRESNO, CA; Owner: INFINITY RADIO OPERATIONS INC.)
KFCF (88.1 FM; FRESNO, CA; Owner: FRESNO FREE COLLEGE FOUNDATION)
KVPR (89.3 FM; FRESNO, CA; Owner: WHITE ASH BROADCASTING, INC.)
KSKS (93.7 FM; FRESNO, CA; Owner: INFINITY RADIO OPERATIONS INC.)
KMMM (107.1 FM; MADERA, CA; Owner: ILLINOIS LOTUS CORP)
KJFX (95.7 FM; FRESNO, CA; Owner: MESOSPHERE BROADCASTING LTD. PARTNERSHIP)
KALZ (102.7 FM; FRESNO, CA; Owner: CAPSTAR TX LIMITED PARTNERSHIP)
KEZL (96.7 FM; FOWLER, CA; Owner: CAPSTAR TX LIMITED PARTNERSHIP)
KFSR (90.7 FM; FRESNO, CA; Owner: CALIFORNIA STATE UNIVERSITY - FRESNO)
KZPO (103.3 FM; LINDSAY, CA; Owner: LINDSAY BROADCASTING)
KZOL (107.9 FM; NORTH FORK, CA; Owner: HBC LICENSE CORPORATION)
K217EQ (91.3 FM; COALINGA, CA; Owner: CALVARY CHAPEL OF TWIN FALLS, INC.)
TV broadcast stations around Clovis:
K02OH (Channel 2; FRESNO, CA; Owner: W. R. PORTEE AND LORRAINE PORTEE)
KVHF-LP (Channel 4; FRESNO, CA; Owner: GARY M. COCOLA FAMILY TRUST, GARY M. COCOLA TRUSTEE)
K56DZ (Channel 56; FRESNO, CA; Owner: NATIONAL MINORITY T.V., INC.)
KHMM-CA (Channel 16; HANFORD, CA; Owner: CABALLERO TELEVISION TEXAS, L.L.C.)
KNSO (Channel 51; MERCED, CA; Owner: TELEMUNDO OF FRESNO, LLC)
K05KM (Channel 5; FRESNO, CA; Owner: THREE ANGELS BROADCASTING NETWORK, INC.)
KSEE (Channel 24; FRESNO, CA; Owner: KSEE LICENSE, INC.)
K12OZ (Channel 12; FRESNO, CA; Owner: THREE ANGELS BROADCASTING NETWORK)
National Bridge Inventory (NBI) Statistics 57 Number of bridges531ft / 162m Total length539,443 Total average daily traffic25,935 Total average daily truck traffic
New bridges - historical statistics
9 1920-1929 1 1930-1939 2 1940-1949 2 1950-1959 2 1960-1969 4 1970-1979 3 1980-1989 9 1990-1999 21 2000-2009 4 2010-2019
See full National Bridge Inventory statistics for Clovis, CA
Home Mortgage Disclosure Act Aggregated Statistics For Year 2009(Based on 10 full and 5 partial tracts) A) FHA, FSA/RHS & VA B) Conventional C) Refinancings D) Home Improvement Loans E) Loans on Dwellings For 5+ Families F) Non-occupant Loans on G) Loans On Manufactured Number Average Value Number Average Value Number Average Value Number Average Value Number Average Value Number Average Value Number Average Value
LOANS ORIGINATED 320 $191,780 200 $181,531 744 $189,144 36 $106,890 1 $1,200,000 84 $129,591 2 $34,630 APPLICATIONS APPROVED, NOT ACCEPTED 30 $184,959 20 $129,690 90 $202,791 6 $73,033 0 $0 9 $168,017 3 $34,440 APPLICATIONS DENIED 38 $206,851 39 $178,738 294 $204,210 30 $59,732 0 $0 35 $142,337 6 $31,627 APPLICATIONS WITHDRAWN 36 $180,661 44 $202,348 177 $201,880 10 $77,149 0 $0 26 $139,202 0 $0 FILES CLOSED FOR INCOMPLETENESS 7 $177,163 2 $142,355 54 $210,608 6 $69,105 0 $0 5 $141,080 0 $0
Aggregated Statistics For Year 2008(Based on 10 full and 5 partial tracts) A) FHA, FSA/RHS & VA B) Conventional C) Refinancings D) Home Improvement Loans E) Loans on Dwellings For 5+ Families F) Non-occupant Loans on G) Loans On Manufactured Number Average Value Number Average Value Number Average Value Number Average Value Number Average Value Number Average Value Number Average Value
LOANS ORIGINATED 217 $220,124 326 $208,312 506 $193,975 87 $77,434 3 $1,957,680 121 $176,936 5 $52,310 APPLICATIONS APPROVED, NOT ACCEPTED 13 $192,686 65 $204,111 132 $202,632 18 $73,092 0 $0 29 $190,451 5 $52,316 APPLICATIONS DENIED 29 $217,759 90 $203,831 506 $240,102 87 $97,850 1 $673,000 60 $186,026 10 $45,148 APPLICATIONS WITHDRAWN 17 $210,836 61 $201,401 162 $214,508 17 $152,650 0 $0 33 $154,183 1 $55,640 FILES CLOSED FOR INCOMPLETENESS 3 $239,117 11 $217,036 45 $227,277 6 $49,803 0 $0 6 $169,888 0 $0
Aggregated Statistics For Year 2007(Based on 10 full and 5 partial tracts) A) FHA, FSA/RHS & VA B) Conventional C) Refinancings D) Home Improvement Loans E) Loans on Dwellings For 5+ Families F) Non-occupant Loans on G) Loans On Manufactured Number Average Value Number Average Value Number Average Value Number Average Value Number Average Value Number Average Value Number Average Value
LOANS ORIGINATED 4 $276,742 546 $233,377 1,205 $212,395 276 $100,665 13 $1,751,679 253 $207,439 10 $52,532 APPLICATIONS APPROVED, NOT ACCEPTED 0 $0 127 $215,021 319 $231,184 51 $125,066 0 $0 62 $190,219 5 $68,098 APPLICATIONS DENIED 2 $210,185 206 $235,703 893 $243,557 156 $123,770 1 $676,000 103 $257,226 11 $51,873 APPLICATIONS WITHDRAWN 2 $353,590 68 $247,488 417 $241,578 45 $158,470 0 $0 56 $220,274 2 $50,210 FILES CLOSED FOR INCOMPLETENESS 0 $0 25 $310,284 129 $234,590 7 $132,009 0 $0 9 $220,782 0 $0
Aggregated Statistics For Year 2006(Based on 10 full and 5 partial tracts) A) FHA, FSA/RHS & VA B) Conventional C) Refinancings D) Home Improvement Loans E) Loans on Dwellings For 5+ Families F) Non-occupant Loans on G) Loans On Manufactured Number Average Value Number Average Value Number Average Value Number Average Value Number Average Value Number Average Value Number Average Value
LOANS ORIGINATED 6 $241,488 1,165 $228,654 1,901 $225,021 396 $115,765 10 $3,287,754 391 $217,393 9 $95,738 APPLICATIONS APPROVED, NOT ACCEPTED 0 $0 286 $217,938 365 $238,605 81 $125,225 0 $0 99 $226,385 3 $43,447 APPLICATIONS DENIED 0 $0 349 $235,410 857 $248,842 195 $124,706 0 $0 101 $201,664 6 $81,360 APPLICATIONS WITHDRAWN 0 $0 222 $251,844 663 $249,877 87 $149,122 1 $1,624,410 80 $217,980 0 $0 FILES CLOSED FOR INCOMPLETENESS 1 $182,000 49 $237,453 145 $248,543 14 $172,369 0 $0 10 $276,864 0 $0
Aggregated Statistics For Year 2005(Based on 10 full and 5 partial tracts) A) FHA, FSA/RHS & VA B) Conventional C) Refinancings D) Home Improvement Loans E) Loans on Dwellings For 5+ Families F) Non-occupant Loans on G) Loans On Manufactured Number Average Value Number Average Value Number Average Value Number Average Value Number Average Value Number Average Value Number Average Value
LOANS ORIGINATED 2 $188,055 1,792 $220,378 2,670 $209,558 484 $113,199 12 $1,302,114 547 $202,150 13 $65,424 APPLICATIONS APPROVED, NOT ACCEPTED 2 $230,565 320 $213,768 411 $212,529 88 $107,198 0 $0 106 $207,781 10 $49,840 APPLICATIONS DENIED 1 $306,000 438 $223,525 877 $208,527 181 $110,927 0 $0 109 $212,357 15 $60,980 APPLICATIONS WITHDRAWN 2 $246,510 327 $232,742 971 $213,193 113 $161,595 0 $0 90 $188,682 3 $108,687 FILES CLOSED FOR INCOMPLETENESS 0 $0 60 $241,200 162 $223,864 25 $96,054 0 $0 12 $180,052 0 $0
Aggregated Statistics For Year 2004(Based on 10 full and 5 partial tracts) A) FHA, FSA/RHS & VA B) Conventional C) Refinancings D) Home Improvement Loans E) Loans on Dwellings For 5+ Families F) Non-occupant Loans on G) Loans On Manufactured Number Average Value Number Average Value Number Average Value Number Average Value Number Average Value Number Average Value Number Average Value
LOANS ORIGINATED 12 $195,867 2,015 $194,801 2,833 $176,158 399 $86,329 14 $2,185,090 565 $167,385 6 $183,843 APPLICATIONS APPROVED, NOT ACCEPTED 0 $0 262 $194,063 477 $168,852 80 $86,394 1 $896,580 68 $170,312 5 $44,134 APPLICATIONS DENIED 2 $180,020 297 $200,744 866 $168,104 209 $88,231 3 $612,940 99 $156,882 6 $51,958 APPLICATIONS WITHDRAWN 2 $140,465 248 $194,927 903 $173,238 97 $93,439 0 $0 76 $172,417 3 $70,957 FILES CLOSED FOR INCOMPLETENESS 0 $0 98 $213,376 161 $209,383 18 $60,188 0 $0 26 $178,593 0 $0
Aggregated Statistics For Year 2003(Based on 10 full and 5 partial tracts) A) FHA, FSA/RHS & VA B) Conventional C) Refinancings D) Home Improvement Loans E) Loans on Dwellings For 5+ Families F) Non-occupant Loans on Number Average Value Number Average Value Number Average Value Number Average Value Number Average Value Number Average Value
LOANS ORIGINATED 47 $146,469 1,491 $173,657 5,053 $142,037 231 $40,697 15 $2,025,236 571 $123,372 APPLICATIONS APPROVED, NOT ACCEPTED 5 $139,220 131 $165,046 623 $134,180 72 $49,300 1 $2,599,770 59 $121,358 APPLICATIONS DENIED 10 $127,883 209 $150,377 992 $134,752 117 $45,376 3 $916,277 97 $127,547 APPLICATIONS WITHDRAWN 3 $105,590 135 $160,470 858 $143,849 22 $55,307 3 $863,820 63 $125,826 FILES CLOSED FOR INCOMPLETENESS 1 $138,100 47 $192,972 186 $146,236 16 $39,877 0 $0 15 $124,172
Aggregated Statistics For Year 2002(Based on 8 full and 2 partial tracts) A) FHA, FSA/RHS & VA B) Conventional C) Refinancings D) Home Improvement Loans E) Loans on Dwellings For 5+ Families F) Non-occupant Loans on Number Average Value Number Average Value Number Average Value Number Average Value Number Average Value Number Average Value
LOANS ORIGINATED 136 $115,326 887 $130,095 2,078 $118,023 117 $36,350 15 $885,729 319 $102,398 APPLICATIONS APPROVED, NOT ACCEPTED 11 $106,069 87 $121,394 247 $111,209 47 $28,166 1 $1,275,140 37 $106,322 APPLICATIONS DENIED 14 $109,729 82 $118,949 461 $109,209 56 $28,787 2 $3,036,490 28 $99,738 APPLICATIONS WITHDRAWN 15 $105,633 93 $130,941 445 $116,560 16 $26,026 0 $0 35 $96,525 FILES CLOSED FOR INCOMPLETENESS 1 $166,290 24 $141,521 101 $117,142 0 $0 1 $1,225,330 10 $77,037
Aggregated Statistics For Year 2001(Based on 8 full and 2 partial tracts) A) FHA, FSA/RHS & VA B) Conventional C) Refinancings D) Home Improvement Loans E) Loans on Dwellings For 5+ Families F) Non-occupant Loans on Number Average Value Number Average Value Number Average Value Number Average Value Number Average Value Number Average Value
LOANS ORIGINATED 219 $113,937 631 $119,594 1,208 $106,174 70 $26,310 13 $1,260,821 174 $83,604 APPLICATIONS APPROVED, NOT ACCEPTED 7 $103,327 41 $110,393 133 $94,519 30 $37,885 0 $0 21 $113,571 APPLICATIONS DENIED 14 $97,064 96 $98,467 440 $88,073 55 $21,521 1 $406,000 34 $71,976 APPLICATIONS WITHDRAWN 15 $114,594 71 $118,062 429 $101,485 16 $40,580 0 $0 24 $88,591 FILES CLOSED FOR INCOMPLETENESS 7 $113,583 14 $151,551 77 $106,856 3 $41,000 0 $0 7 $115,430
Aggregated Statistics For Year 2000(Based on 8 full and 2 partial tracts) A) FHA, FSA/RHS & VA B) Conventional C) Refinancings D) Home Improvement Loans E) Loans on Dwellings For 5+ Families F) Non-occupant Loans on Number Average Value Number Average Value Number Average Value Number Average Value Number Average Value Number Average Value
LOANS ORIGINATED 224 $105,574 480 $102,836 292 $73,956 138 $25,153 6 $1,686,845 94 $79,565 APPLICATIONS APPROVED, NOT ACCEPTED 8 $101,589 37 $93,913 72 $66,335 55 $28,856 0 $0 6 $53,727 APPLICATIONS DENIED 21 $109,255 88 $84,508 319 $71,014 108 $25,200 2 $136,465 28 $61,985 APPLICATIONS WITHDRAWN 19 $96,517 47 $100,017 147 $76,002 13 $22,514 1 $600,000 10 $58,280 FILES CLOSED FOR INCOMPLETENESS 6 $138,643 13 $129,822 43 $82,994 3 $14,957 2 $1,985,360 6 $131,280
Aggregated Statistics For Year 1999(Based on 8 full and 4 partial tracts) A) FHA, FSA/RHS & VA B) Conventional C) Refinancings D) Home Improvement Loans E) Loans on Dwellings For 5+ Families F) Non-occupant Loans on Number Average Value Number Average Value Number Average Value Number Average Value Number Average Value Number Average Value
LOANS ORIGINATED 289 $105,290 418 $104,455 684 $86,560 133 $21,493 9 $1,643,416 114 $77,098 APPLICATIONS APPROVED, NOT ACCEPTED 8 $93,255 37 $109,928 135 $94,234 66 $22,113 0 $0 5 $110,142 APPLICATIONS DENIED 41 $105,059 70 $81,159 427 $76,064 84 $22,045 2 $123,335 31 $84,396 APPLICATIONS WITHDRAWN 24 $102,654 66 $101,157 266 $97,086 9 $51,648 3 $79,893 14 $87,413 FILES CLOSED FOR INCOMPLETENESS 3 $67,803 15 $89,669 89 $92,643 0 $0 1 $78,000 6 $61,243
Detailed mortgage data for all 15 tracts in Clovis, CA
Private Mortgage Insurance Companies Aggregated Statistics For Year 2009(Based on 9 full and 4 partial tracts) A) Conventional B) Refinancings Number Average Value Number Average Value
LOANS ORIGINATED 33 $232,137 11 $288,009 APPLICATIONS APPROVED, NOT ACCEPTED 7 $240,890 5 $281,484 APPLICATIONS DENIED 9 $190,703 2 $181,540 APPLICATIONS WITHDRAWN 6 $167,378 1 $288,000 FILES CLOSED FOR INCOMPLETENESS 2 $206,175 0 $0
Aggregated Statistics For Year 2008(Based on 10 full and 5 partial tracts) A) Conventional B) Refinancings C) Non-occupant Loans on Number Average Value Number Average Value Number Average Value
LOANS ORIGINATED 116 $243,081 33 $239,335 5 $207,770 APPLICATIONS APPROVED, NOT ACCEPTED 52 $256,637 37 $268,246 4 $256,100 APPLICATIONS DENIED 9 $194,179 3 $286,980 4 $174,668 APPLICATIONS WITHDRAWN 4 $256,000 4 $236,488 0 $0 FILES CLOSED FOR INCOMPLETENESS 1 $301,000 2 $257,610 0 $0
Aggregated Statistics For Year 2007(Based on 10 full and 5 partial tracts) A) Conventional B) Refinancings C) Non-occupant Loans on Number Average Value Number Average Value Number Average Value
LOANS ORIGINATED 117 $279,008 58 $281,866 13 $238,705 APPLICATIONS APPROVED, NOT ACCEPTED 15 $318,395 18 $259,788 2 $256,320 APPLICATIONS DENIED 4 $388,260 5 $302,688 0 $0 APPLICATIONS WITHDRAWN 3 $215,230 11 $323,975 2 $323,335 FILES CLOSED FOR INCOMPLETENESS 1 $268,250 0 $0 0 $0
Aggregated Statistics For Year 2006(Based on 10 full and 5 partial tracts) A) Conventional B) Refinancings C) Non-occupant Loans on Number Average Value Number Average Value Number Average Value
LOANS ORIGINATED 37 $310,272 37 $324,569 6 $260,122 APPLICATIONS APPROVED, NOT ACCEPTED 8 $314,918 8 $285,368 1 $260,000 APPLICATIONS DENIED 2 $340,500 2 $313,000 0 $0 APPLICATIONS WITHDRAWN 0 $0 5 $372,260 0 $0 FILES CLOSED FOR INCOMPLETENESS 1 $350,000 0 $0 0 $0
Aggregated Statistics For Year 2005(Based on 9 full and 5 partial tracts) A) Conventional B) Refinancings C) Non-occupant Loans on Number Average Value Number Average Value Number Average Value
LOANS ORIGINATED 90 $289,518 54 $274,621 14 $243,292 APPLICATIONS APPROVED, NOT ACCEPTED 14 $280,494 13 $256,046 1 $277,410 APPLICATIONS DENIED 1 $202,110 1 $284,000 0 $0 APPLICATIONS WITHDRAWN 3 $328,333 6 $235,833 1 $311,000 FILES CLOSED FOR INCOMPLETENESS 0 $0 0 $0 0 $0
Aggregated Statistics For Year 2004(Based on 10 full and 5 partial tracts) A) Conventional B) Refinancings C) Non-occupant Loans on Number Average Value Number Average Value Number Average Value
LOANS ORIGINATED 228 $235,063 81 $221,932 49 $198,789 APPLICATIONS APPROVED, NOT ACCEPTED 38 $236,298 34 $195,606 8 $174,178 APPLICATIONS DENIED 8 $208,036 1 $173,340 6 $184,248 APPLICATIONS WITHDRAWN 6 $225,853 5 $251,886 1 $202,000 FILES CLOSED FOR INCOMPLETENESS 3 $261,333 0 $0 0 $0
Aggregated Statistics For Year 2003(Based on 10 full and 5 partial tracts) A) Conventional B) Refinancings C) Non-occupant Loans on Number Average Value Number Average Value Number Average Value
LOANS ORIGINATED 348 $192,010 242 $166,923 50 $149,947 APPLICATIONS APPROVED, NOT ACCEPTED 37 $189,892 77 $165,982 6 $136,830 APPLICATIONS DENIED 5 $142,386 6 $183,582 1 $64,000 APPLICATIONS WITHDRAWN 9 $201,939 6 $141,945 1 $158,000 FILES CLOSED FOR INCOMPLETENESS 0 $0 0 $0 0 $0
Aggregated Statistics For Year 2002(Based on 8 full and 2 partial tracts) A) Conventional B) Refinancings C) Non-occupant Loans on Number Average Value Number Average Value Number Average Value
LOANS ORIGINATED 241 $154,106 180 $145,291 41 $110,941 APPLICATIONS APPROVED, NOT ACCEPTED 29 $154,453 35 $148,363 5 $81,644 APPLICATIONS DENIED 3 $119,127 2 $147,500 0 $0 APPLICATIONS WITHDRAWN 9 $149,417 5 $121,930 2 $189,575 FILES CLOSED FOR INCOMPLETENESS 0 $0 0 $0 0 $0
Aggregated Statistics For Year 2001(Based on 8 full and 2 partial tracts) A) Conventional B) Refinancings C) Non-occupant Loans on Number Average Value Number Average Value Number Average Value
LOANS ORIGINATED 196 $141,183 127 $136,777 20 $87,076 APPLICATIONS APPROVED, NOT ACCEPTED 13 $131,977 18 $127,794 3 $90,170 APPLICATIONS DENIED 6 $132,418 1 $119,500 0 $0 APPLICATIONS WITHDRAWN 2 $152,540 11 $159,986 0 $0 FILES CLOSED FOR INCOMPLETENESS 1 $185,000 0 $0 0 $0
Aggregated Statistics For Year 2000(Based on 8 full and 2 partial tracts) A) Conventional B) Refinancings C) Non-occupant Loans on Number Average Value Number Average Value Number Average Value
LOANS ORIGINATED 136 $125,564 32 $118,102 19 $85,666 APPLICATIONS APPROVED, NOT ACCEPTED 11 $137,373 7 $133,087 1 $62,000 APPLICATIONS DENIED 0 $0 1 $114,000 0 $0 APPLICATIONS WITHDRAWN 0 $0 1 $203,000 0 $0 FILES CLOSED FOR INCOMPLETENESS 0 $0 0 $0 0 $0
Aggregated Statistics For Year 1999(Based on 8 full and 4 partial tracts) A) Conventional B) Refinancings C) Non-occupant Loans on Number Average Value Number Average Value Number Average Value
LOANS ORIGINATED 162 $127,295 106 $118,059 21 $98,804 APPLICATIONS APPROVED, NOT ACCEPTED 8 $116,904 18 $112,660 2 $100,375 APPLICATIONS DENIED 8 $119,065 2 $118,420 3 $111,660 APPLICATIONS WITHDRAWN 2 $111,770 0 $0 0 $0 FILES CLOSED FOR INCOMPLETENESS 1 $78,190 1 $199,990 0 $0
Fire-safe hotels and motels in Clovis, California:
Comfort Suites Clovis, 143 Clovis Ave, Clovis, California 93612 Phone: (559) 299-9992, Fax: (559) 299-9994
Holiday Inn Express & Suites, 650 W Shaw Ave, Clovis, California 93612 Phone: (559) 297-0555, Fax: (559) 297-1555
Fairfield Inn & Suites Clovis, 50 N Clovis Ave, Clovis, California 93612 Phone: (559) 323-8080, Fax: (559) 323-8020
Americas Best Value Inn & Suites Clovis, 1616 Clovis Ave, Clovis, California 93612 Phone: (559) 298-0775, Fax: (559) 322-8749
Clovis Hilton Garden Inn, 520 W Shaw Ave, Clovis, California 93612 Phone: (559) 299-2203, Fax: (559) 299-2206
Hampton Inn And Suites, 855 Gettysburg Ave, Clovis, California 93612 Phone: (559) 348-0000, Fax: (559) 348-0001
Homewood Suites By Hilton, 835 Gettysburg Ave, Clovis, California 93612 Phone: (559) 292-4004, Fax: (559) 292-4005
All 7 fire-safe hotels and motels in Clovis, California
Most common first names in Clovis, CA among deceased individuals Name Count Lived (average)
John 217 75.0 years Mary 210 79.0 years William 197 74.1 years Robert 189 72.4 years James 170 72.9 years George 134 74.8 years Charles 124 73.4 years Dorothy 110 78.0 years Richard 89 67.4 years Frank 82 76.5 years
Most common last names in Clovis, CA among deceased individuals Last name Count Lived (average)
Smith 109 76.6 years Johnson 77 75.5 years Brown 71 76.3 years Jones 65 72.5 years Davis 61 75.2 years Miller 59 77.2 years Thompson 38 78.2 years Williams 38 75.6 years Garcia 34 74.1 years Moore 34 75.1 years
Clovis compared to California state average:
Median house value below state average. Unemployed percentage significantly below state average. Black race population percentage below state average. Length of stay since moving in significantly below state average. House age significantly below state average.
#1 on the list of "Top 101 cities with the largest differences between morning and afternoon humidity (population 50,000+)"
#1 on the list of "Top 101 cities with the largest humidity differences during a year (population 50,000+)"
#5 on the list of "Top 101 cities with the highest maximum monthly sunshine amount (population 50,000+)"
#7 on the list of "Top 101 cities with the largest sunshine amount differences during a year (population 50,000+)"
#10 on the list of "Top 101 cities with largest percentage of females in industries: management of companies and enterprises (population 50,000+)"
#12 on the list of "Top 100 high-educated but low-earning cities (pop. 50,000+)"
#14 on the list of "Top 101 cities with the smallest percentage of high school students in private schools (3,000+ students)"
#20 on the list of "Top 101 larger cities with the highest increase in household income from 2000 (population 50,000+)"
#24 on the list of "Top 101 cities with largest percentage of males in occupations: sales and related occupations (population 50,000+)"
#27 on the list of "Top 101 cities with the highest number of days clear of clouds (population 50,000+)"
#27 on the list of "Top 101 cities with the lowest number of days clear of clouds (population 50,000+)"
#36 on the list of "Top 101 cities with largest percentage of males in occupations: health technologists and technicians (population 50,000+)"
#39 on the list of "Top 101 cities with the lowest number of police officers per 1000 residents (population 50,000+)"
#40 on the list of "Top 101 cities with largest percentage of males in industries: health care and social assistance (population 50,000+)"
#41 on the list of "Top 101 cities with largest percentage of males in occupations: education, training, and library occupations (population 50,000+)"
#43 on the list of "Top 101 cities with the highest average sunshine amount (population 50,000+)"
#50 on the list of "Top 101 cities with the lowest minimum monthly morning or afternoon humidity (population 50,000+)"
#51 on the list of "Top 101 cities with largest percentage of females in occupations: farming, fishing, and forestry occupations (population 50,000+)"
#53 on the list of "Top 101 cities with the highest daily high temperatures (population 50,000+)"
#56 on the list of "Top 101 cities with the largest city-data.com crime index per police officer (population 50,000+)"
#5 on the list of "Top 101 counties with the highest Particulate Matter (PM2.5 ) Annual air pollution readings in 2012 (µg/m3 )"
#11 on the list of "Top 101 counties with the highest ground withdrawal of fresh water for public supply"
#15 on the list of "Top 101 counties with the highest lead air pollution readings in 2012 (µg/m3 )"
#15 on the list of "Top 101 counties with the lowest lead air pollution readings in 2012 (µg/m3 )"
#15 on the list of "Top 101 counties with the highest Particulate Matter (PM10 ) Annual air pollution readings in 2012 (µg/m3 )"
Top Patent Applicants
Farzin Aghdasi (36)
Lei Wang (22)
Bradley P. Actis (11)
Chien-Min Huang (10)
James Scott Voss (8)
Tim Swift (7)
Timothy Hemesath (6)
Shu Yang (6)
Marc Gendron (5)
Wei Su (5)
Total of 208 patent applications in 2008-2024.
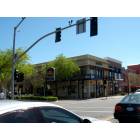
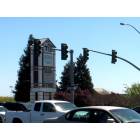
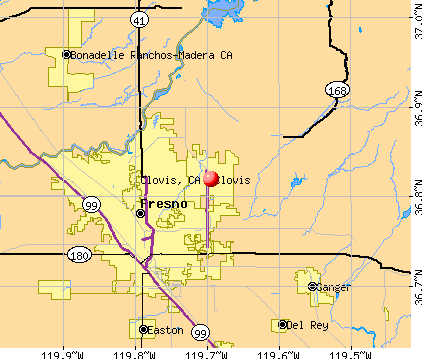


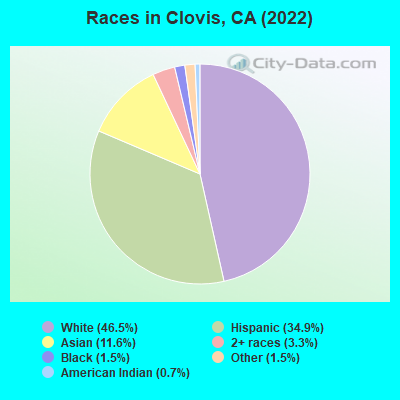
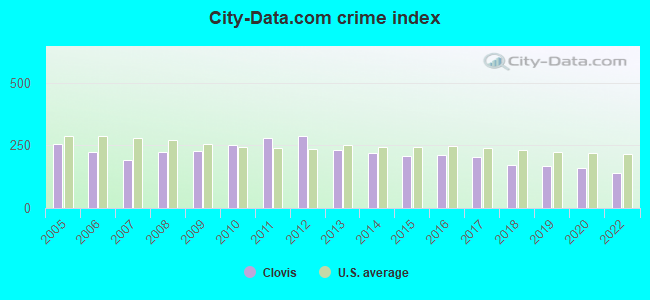
 Recent articles from our blog. Our writers, many of them Ph.D. graduates or candidates, create easy-to-read articles on a wide variety of topics.

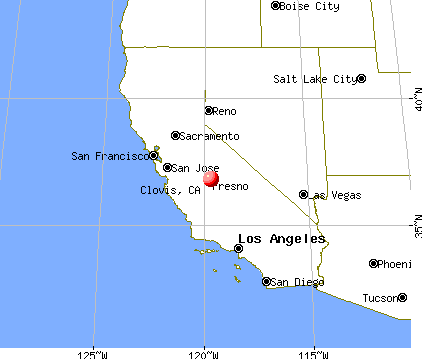
 (6.0 miles
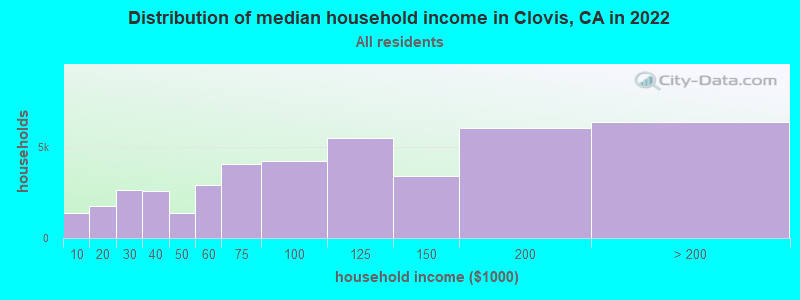
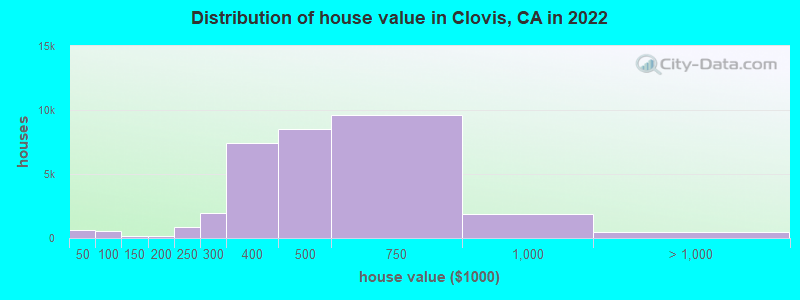
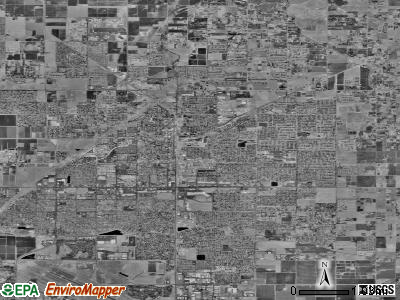
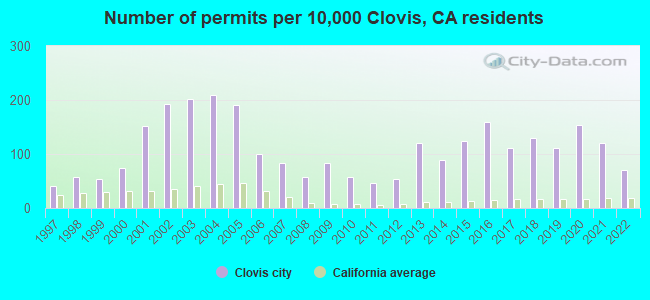
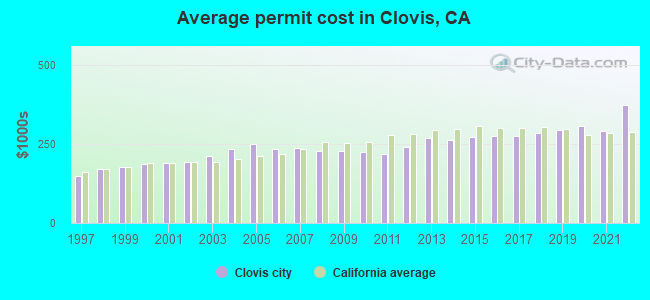
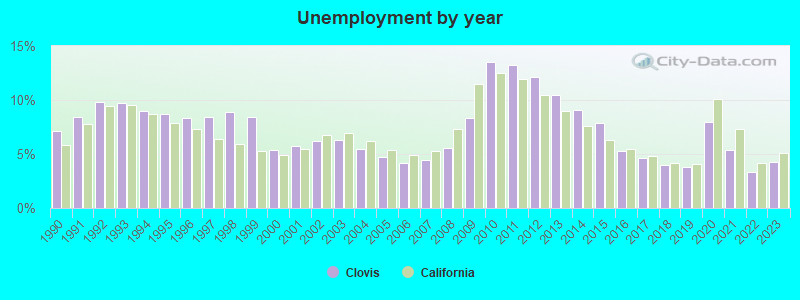
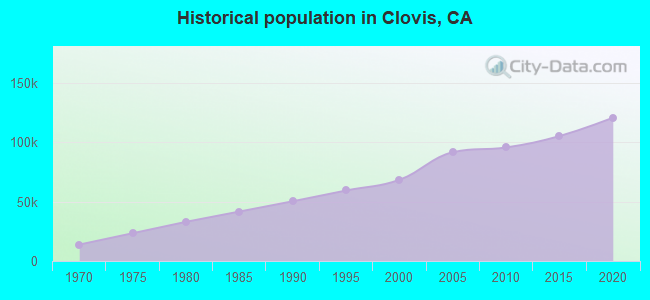
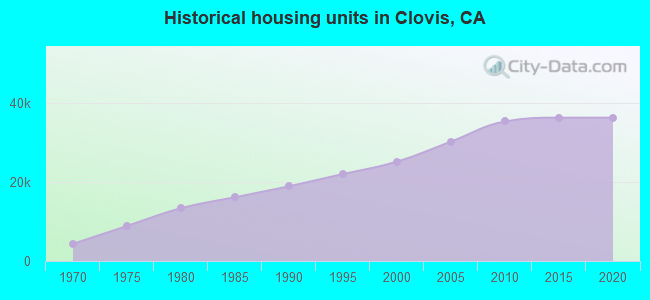
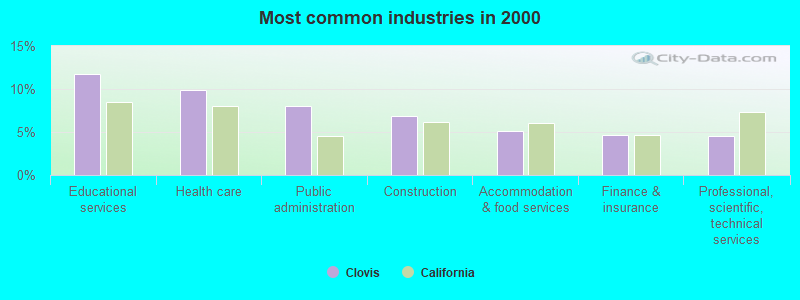
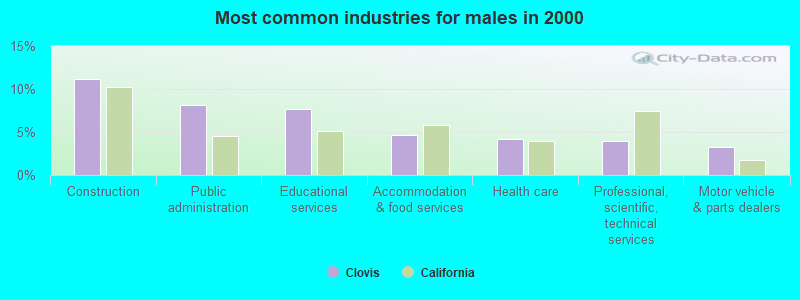
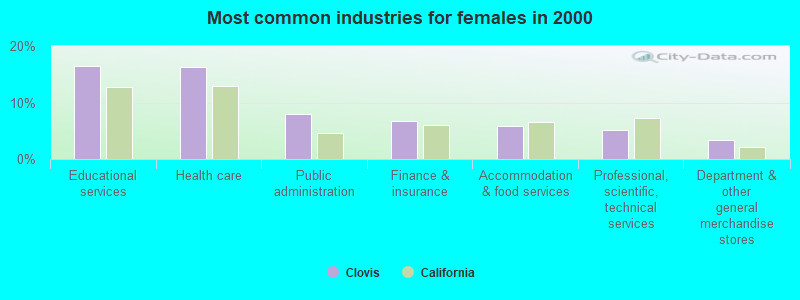
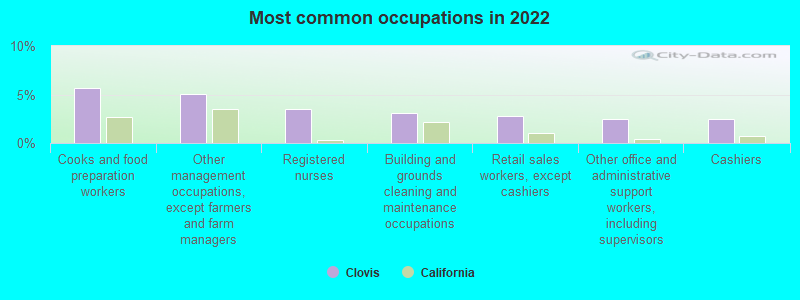
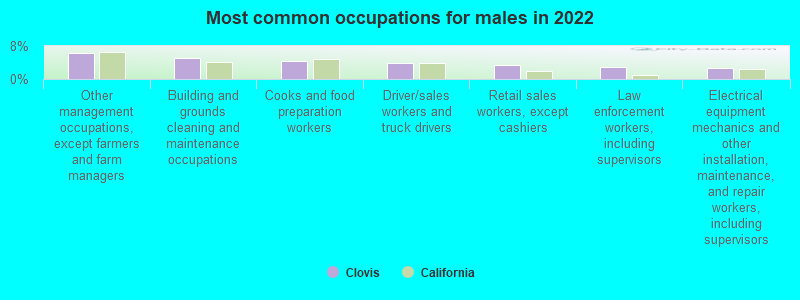
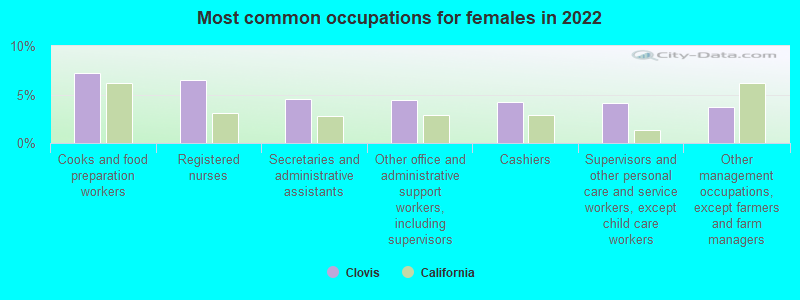

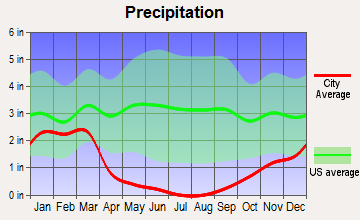
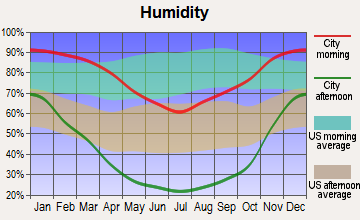
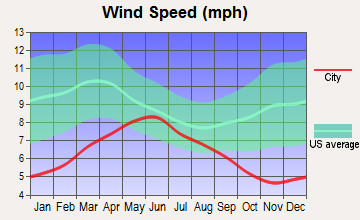
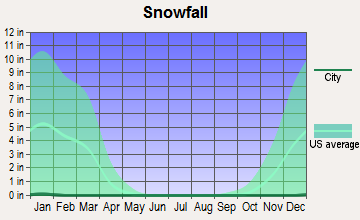
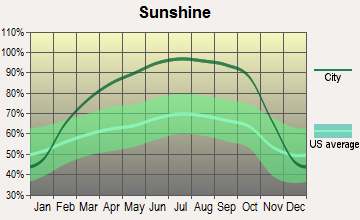
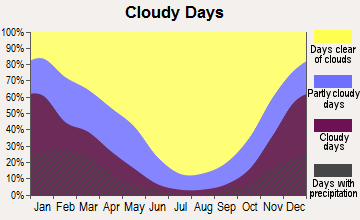
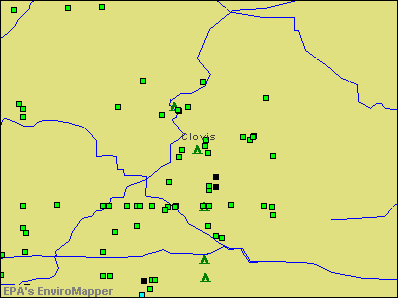

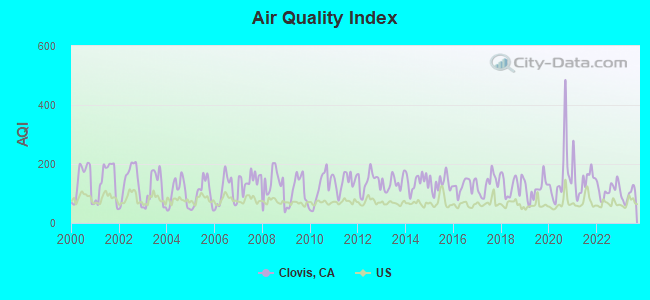
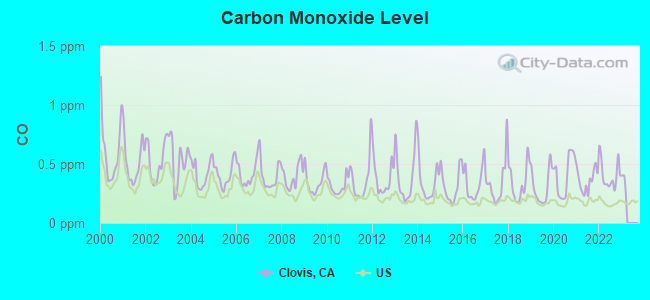
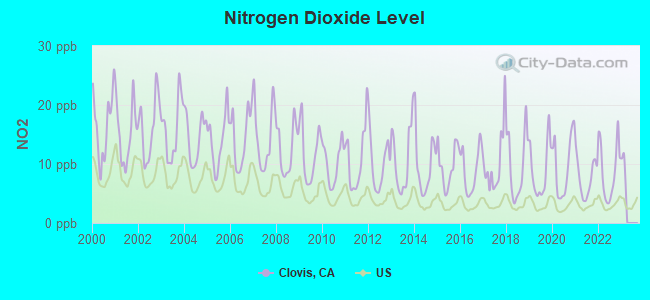
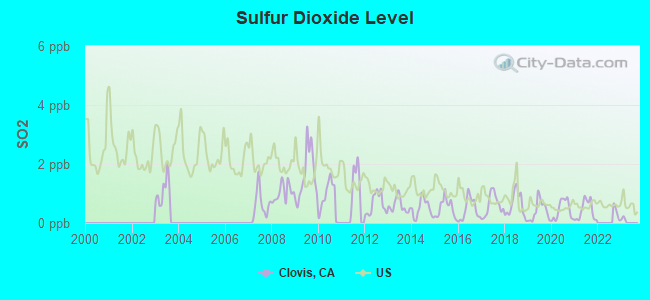
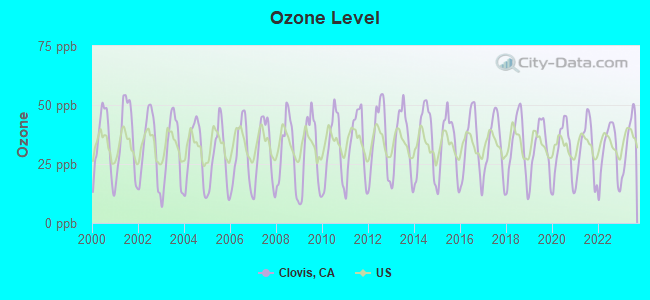
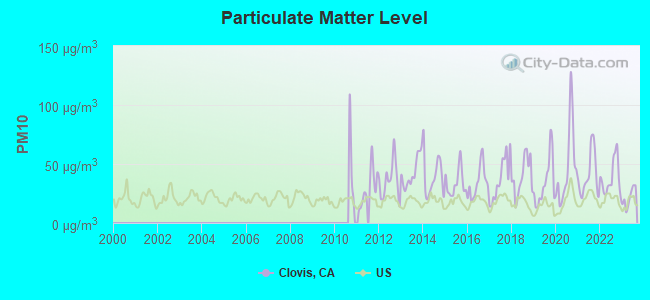
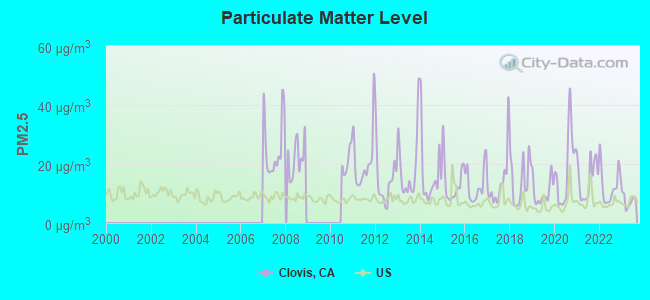
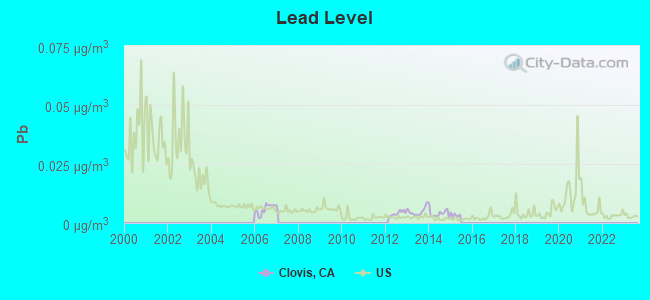

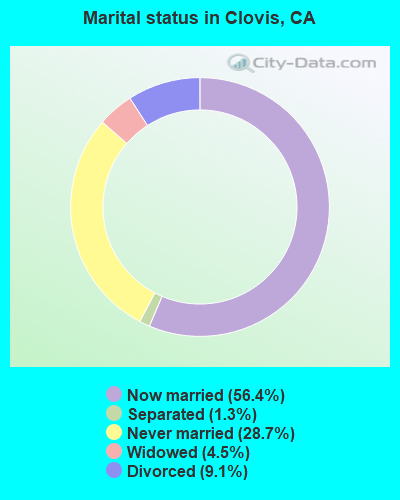
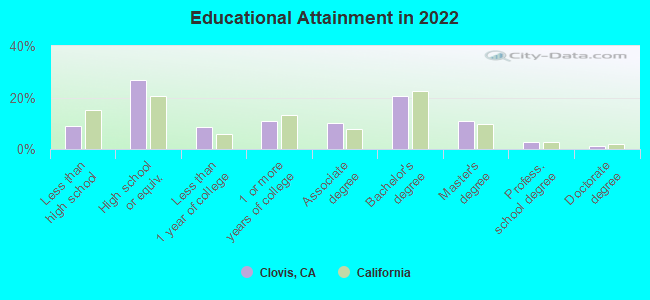
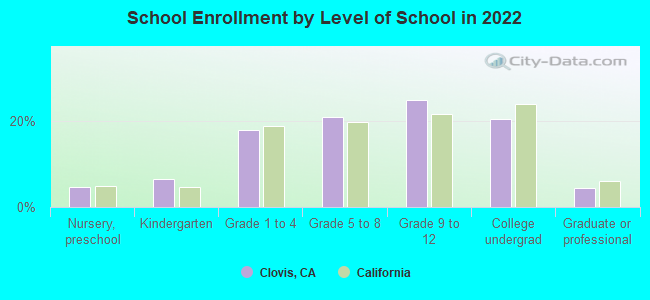
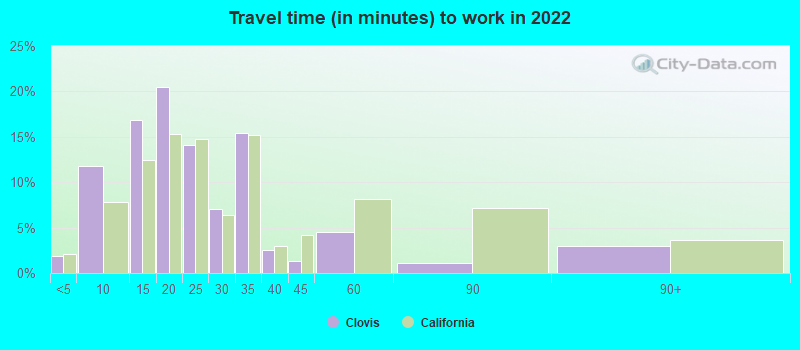
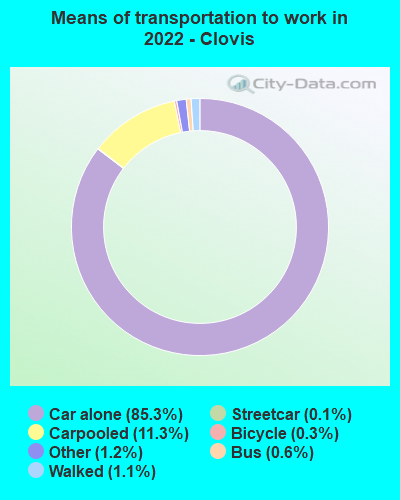
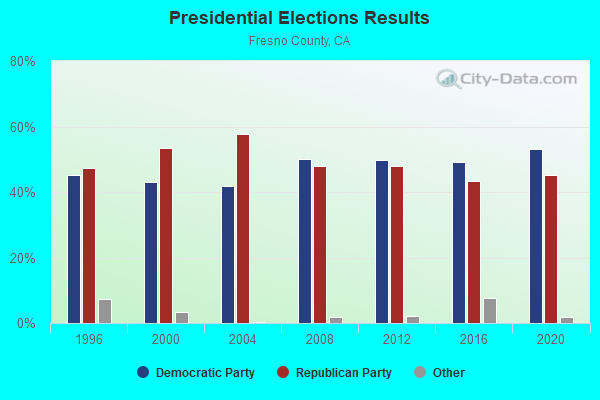
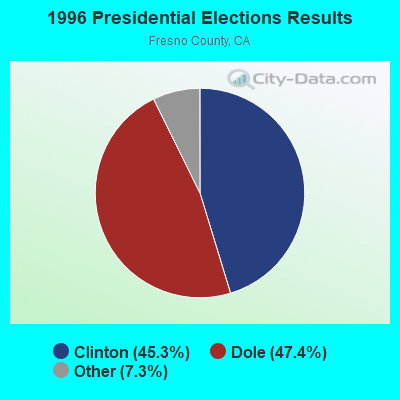
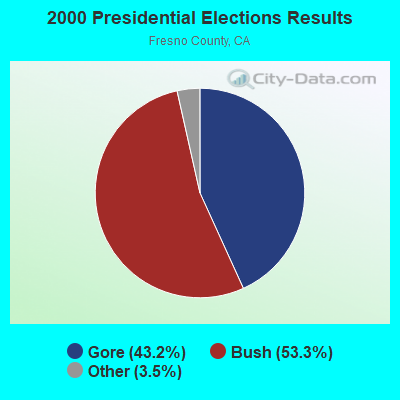
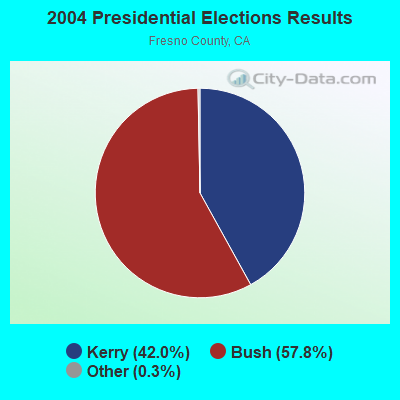
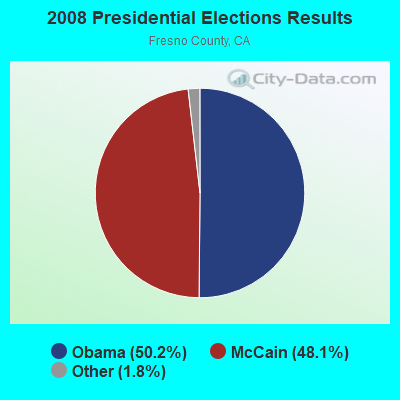
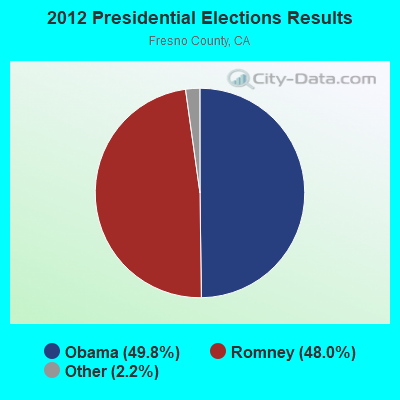
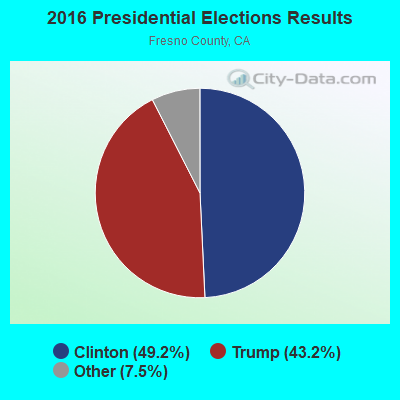
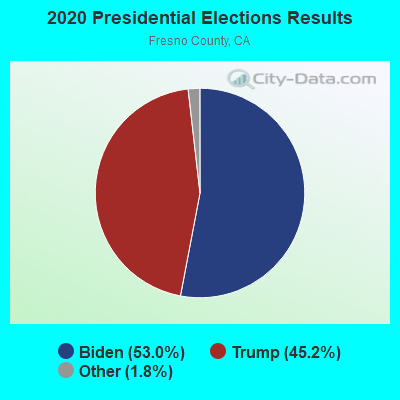
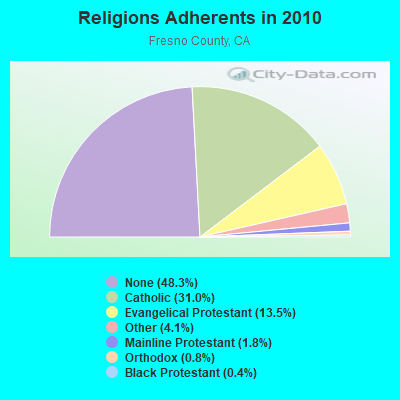
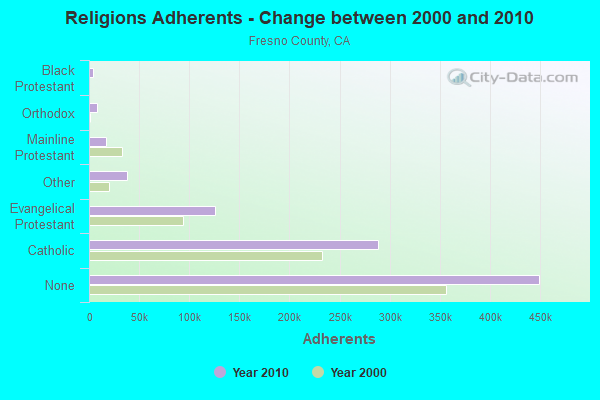
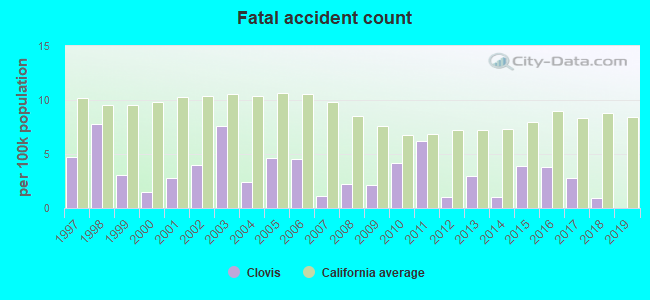
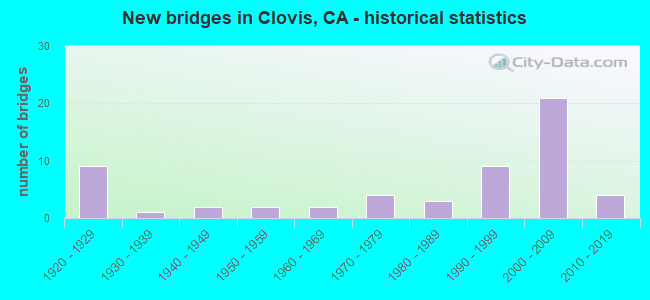
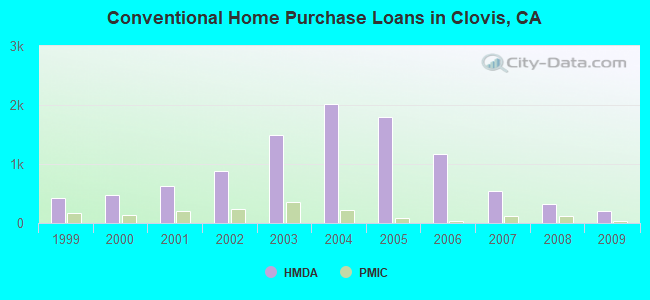
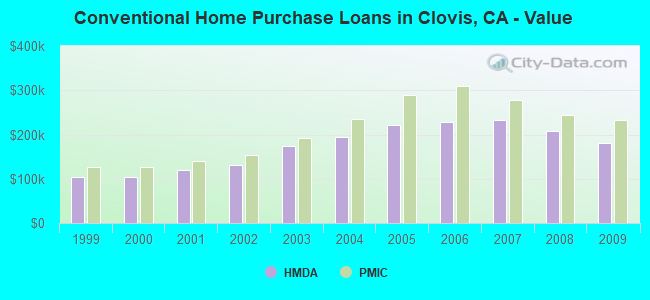
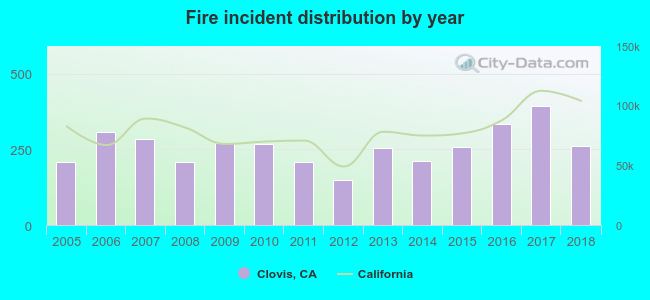 Based on the data from the years 2005 - 2018 the average number of fire incidents per year is 258. The highest number of fire incidents - 395 took place in 2017, and the least - 148 in 2012. The data has an increasing trend.
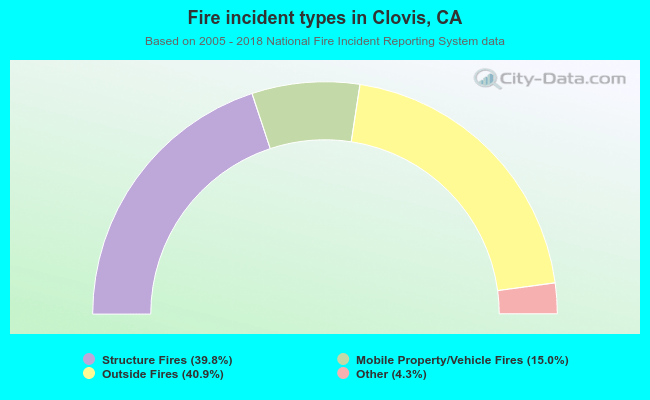 When looking into fire subcategories, the most reports belonged to: Outside Fires (40.9%), and Structure Fires (39.8%).