Corcoran, California Submit your own pictures of this city and show them to the world
OSM Map
General Map
Google Map
MSN Map
OSM Map
General Map
Google Map
MSN Map
OSM Map
General Map
Google Map
MSN Map
OSM Map
General Map
Google Map
MSN Map
Please wait while loading the map...
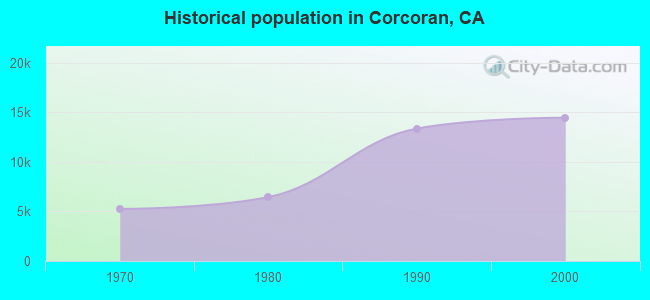
Population in 2022: 22,837 (100% urban, 0% rural). Population change since 2000: +58.0%Males: 14,632 Females: 8,205
March 2022 cost of living index in Corcoran: 93.2 (less than average, U.S. average is 100) Percentage of residents living in poverty in 2022: 27.6%for White Non-Hispanic residents , 16.1% for Black residents , 29.1% for Hispanic or Latino residents , 1.9% for American Indian residents , 17.6% for other race residents , 23.6% for two or more races residents )
Profiles of local businesses
Business Search - 14 Million verified businesses
Data:
Median household income ($)
Median household income (% change since 2000)
Household income diversity
Ratio of average income to average house value (%)
Ratio of average income to average rent
Median household income ($) - White
Median household income ($) - Black or African American
Median household income ($) - Asian
Median household income ($) - Hispanic or Latino
Median household income ($) - American Indian and Alaska Native
Median household income ($) - Multirace
Median household income ($) - Other Race
Median household income for houses/condos with a mortgage ($)
Median household income for apartments without a mortgage ($)
Races - White alone (%)
Races - White alone (% change since 2000)
Races - Black alone (%)
Races - Black alone (% change since 2000)
Races - American Indian alone (%)
Races - American Indian alone (% change since 2000)
Races - Asian alone (%)
Races - Asian alone (% change since 2000)
Races - Hispanic (%)
Races - Hispanic (% change since 2000)
Races - Native Hawaiian and Other Pacific Islander alone (%)
Races - Native Hawaiian and Other Pacific Islander alone (% change since 2000)
Races - Two or more races (%)
Races - Two or more races (% change since 2000)
Races - Other race alone (%)
Races - Other race alone (% change since 2000)
Racial diversity
Unemployment (%)
Unemployment (% change since 2000)
Unemployment (%) - White
Unemployment (%) - Black or African American
Unemployment (%) - Asian
Unemployment (%) - Hispanic or Latino
Unemployment (%) - American Indian and Alaska Native
Unemployment (%) - Multirace
Unemployment (%) - Other Race
Population density (people per square mile)
Population - Males (%)
Population - Females (%)
Population - Males (%) - White
Population - Males (%) - Black or African American
Population - Males (%) - Asian
Population - Males (%) - Hispanic or Latino
Population - Males (%) - American Indian and Alaska Native
Population - Males (%) - Multirace
Population - Males (%) - Other Race
Population - Females (%) - White
Population - Females (%) - Black or African American
Population - Females (%) - Asian
Population - Females (%) - Hispanic or Latino
Population - Females (%) - American Indian and Alaska Native
Population - Females (%) - Multirace
Population - Females (%) - Other Race
Coronavirus confirmed cases (Apr 27, 2024)
Deaths caused by coronavirus (Apr 27, 2024)
Coronavirus confirmed cases (per 100k population) (Apr 27, 2024)
Deaths caused by coronavirus (per 100k population) (Apr 27, 2024)
Daily increase in number of cases (Apr 27, 2024)
Weekly increase in number of cases (Apr 27, 2024)
Cases doubled (in days) (Apr 27, 2024)
Hospitalized patients (Apr 18, 2022)
Negative test results (Apr 18, 2022)
Total test results (Apr 18, 2022)
COVID Vaccine doses distributed (per 100k population) (Sep 19, 2023)
COVID Vaccine doses administered (per 100k population) (Sep 19, 2023)
COVID Vaccine doses distributed (Sep 19, 2023)
COVID Vaccine doses administered (Sep 19, 2023)
Likely homosexual households (%)
Likely homosexual households (% change since 2000)
Likely homosexual households - Lesbian couples (%)
Likely homosexual households - Lesbian couples (% change since 2000)
Likely homosexual households - Gay men (%)
Likely homosexual households - Gay men (% change since 2000)
Cost of living index
Median gross rent ($)
Median contract rent ($)
Median monthly housing costs ($)
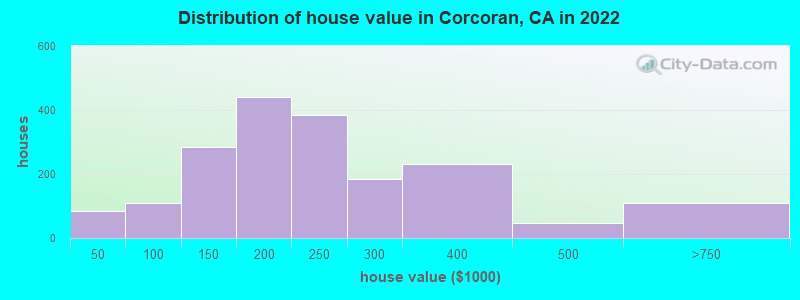
Median house or condo value ($)
Median house or condo value ($ change since 2000)
Mean house or condo value by units in structure - 1, detached ($)
Mean house or condo value by units in structure - 1, attached ($)
Mean house or condo value by units in structure - 2 ($)
Mean house or condo value by units in structure by units in structure - 3 or 4 ($)
Mean house or condo value by units in structure - 5 or more ($)
Mean house or condo value by units in structure - Boat, RV, van, etc. ($)
Mean house or condo value by units in structure - Mobile home ($)
Median house or condo value ($) - White
Median house or condo value ($) - Black or African American
Median house or condo value ($) - Asian
Median house or condo value ($) - Hispanic or Latino
Median house or condo value ($) - American Indian and Alaska Native
Median house or condo value ($) - Multirace
Median house or condo value ($) - Other Race
Median resident age
Resident age diversity
Median resident age - Males
Median resident age - Females
Median resident age - White
Median resident age - Black or African American
Median resident age - Asian
Median resident age - Hispanic or Latino
Median resident age - American Indian and Alaska Native
Median resident age - Multirace
Median resident age - Other Race
Median resident age - Males - White
Median resident age - Males - Black or African American
Median resident age - Males - Asian
Median resident age - Males - Hispanic or Latino
Median resident age - Males - American Indian and Alaska Native
Median resident age - Males - Multirace
Median resident age - Males - Other Race
Median resident age - Females - White
Median resident age - Females - Black or African American
Median resident age - Females - Asian
Median resident age - Females - Hispanic or Latino
Median resident age - Females - American Indian and Alaska Native
Median resident age - Females - Multirace
Median resident age - Females - Other Race
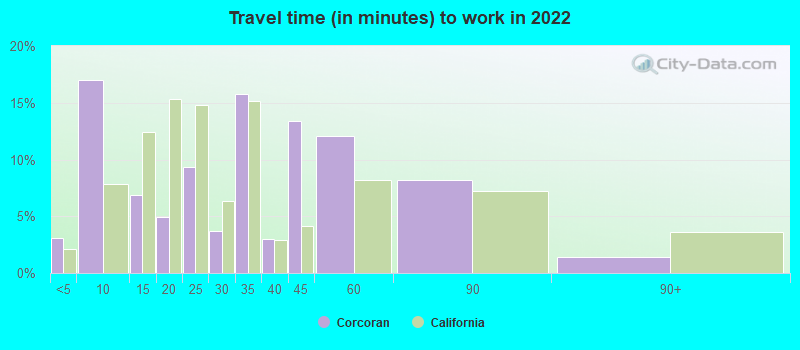
Commute - mean travel time to work (minutes)
Travel time to work - Less than 5 minutes (%)
Travel time to work - Less than 5 minutes (% change since 2000)
Travel time to work - 5 to 9 minutes (%)
Travel time to work - 5 to 9 minutes (% change since 2000)
Travel time to work - 10 to 19 minutes (%)
Travel time to work - 10 to 19 minutes (% change since 2000)
Travel time to work - 20 to 29 minutes (%)
Travel time to work - 20 to 29 minutes (% change since 2000)
Travel time to work - 30 to 39 minutes (%)
Travel time to work - 30 to 39 minutes (% change since 2000)
Travel time to work - 40 to 59 minutes (%)
Travel time to work - 40 to 59 minutes (% change since 2000)
Travel time to work - 60 to 89 minutes (%)
Travel time to work - 60 to 89 minutes (% change since 2000)
Travel time to work - 90 or more minutes (%)
Travel time to work - 90 or more minutes (% change since 2000)
Marital status - Never married (%)
Marital status - Now married (%)
Marital status - Separated (%)
Marital status - Widowed (%)
Marital status - Divorced (%)
Median family income ($)
Median family income (% change since 2000)
Median non-family income ($)
Median non-family income (% change since 2000)
Median per capita income ($)
Median per capita income (% change since 2000)
Median family income ($) - White
Median family income ($) - Black or African American
Median family income ($) - Asian
Median family income ($) - Hispanic or Latino
Median family income ($) - American Indian and Alaska Native
Median family income ($) - Multirace
Median family income ($) - Other Race
Median year house/condo built
Median year apartment built
Year house built - Built 2005 or later (%)
Year house built - Built 2000 to 2004 (%)
Year house built - Built 1990 to 1999 (%)
Year house built - Built 1980 to 1989 (%)
Year house built - Built 1970 to 1979 (%)
Year house built - Built 1960 to 1969 (%)
Year house built - Built 1950 to 1959 (%)
Year house built - Built 1940 to 1949 (%)
Year house built - Built 1939 or earlier (%)
Average household size
Household density (households per square mile)
Average household size - White
Average household size - Black or African American
Average household size - Asian
Average household size - Hispanic or Latino
Average household size - American Indian and Alaska Native
Average household size - Multirace
Average household size - Other Race
Occupied housing units (%)
Vacant housing units (%)
Owner occupied housing units (%)
Renter occupied housing units (%)
Vacancy status - For rent (%)
Vacancy status - For sale only (%)
Vacancy status - Rented or sold, not occupied (%)
Vacancy status - For seasonal, recreational, or occasional use (%)
Vacancy status - For migrant workers (%)
Vacancy status - Other vacant (%)
Residents with income below the poverty level (%)
Residents with income below 50% of the poverty level (%)
Children below poverty level (%)
Poor families by family type - Married-couple family (%)
Poor families by family type - Male, no wife present (%)
Poor families by family type - Female, no husband present (%)
Poverty status for native-born residents (%)
Poverty status for foreign-born residents (%)
Poverty among high school graduates not in families (%)
Poverty among people who did not graduate high school not in families (%)
Residents with income below the poverty level (%) - White
Residents with income below the poverty level (%) - Black or African American
Residents with income below the poverty level (%) - Asian
Residents with income below the poverty level (%) - Hispanic or Latino
Residents with income below the poverty level (%) - American Indian and Alaska Native
Residents with income below the poverty level (%) - Multirace
Residents with income below the poverty level (%) - Other Race
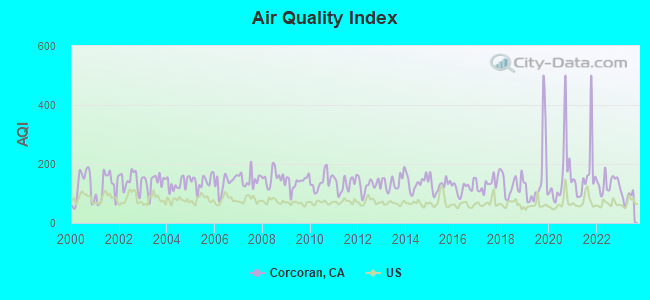
Air pollution - Air Quality Index (AQI)
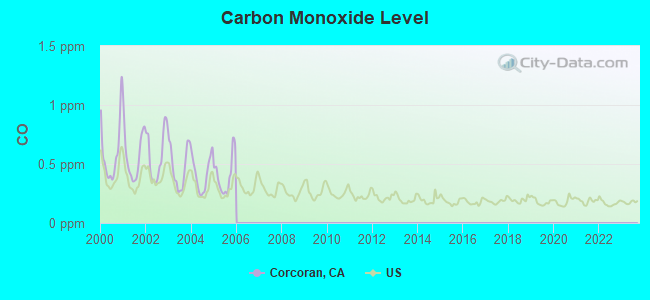
Air pollution - CO
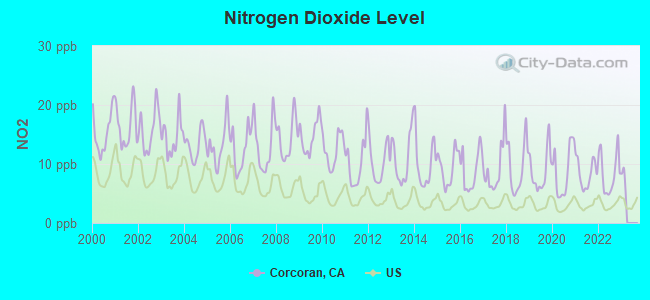
Air pollution - NO2
Air pollution - SO2
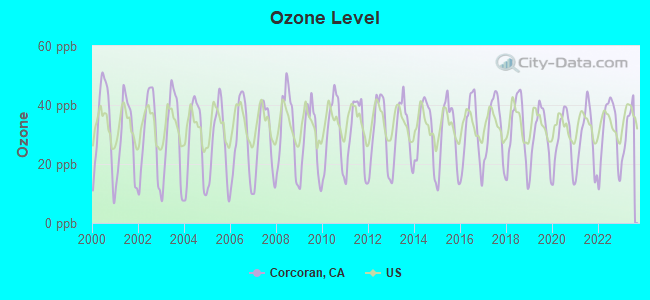
Air pollution - Ozone
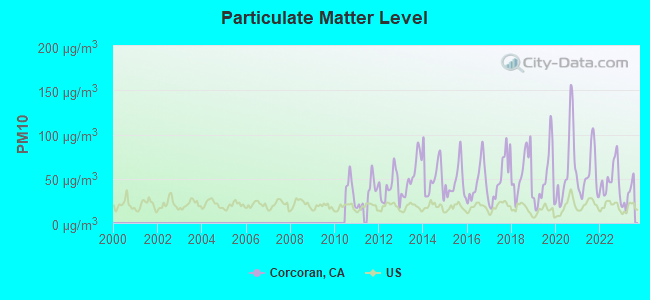
Air pollution - PM10
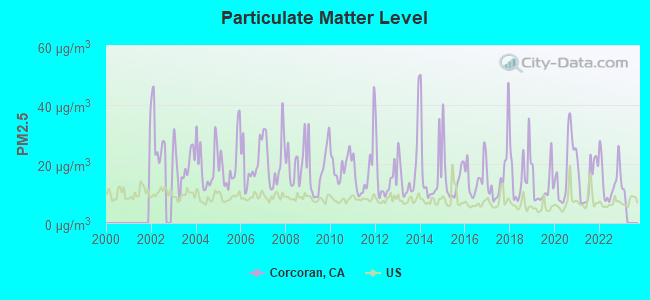
Air pollution - PM25
Air pollution - Pb
Crime - Murders per 100,000 population
Crime - Rapes per 100,000 population
Crime - Robberies per 100,000 population
Crime - Assaults per 100,000 population
Crime - Burglaries per 100,000 population
Crime - Thefts per 100,000 population
Crime - Auto thefts per 100,000 population
Crime - Arson per 100,000 population
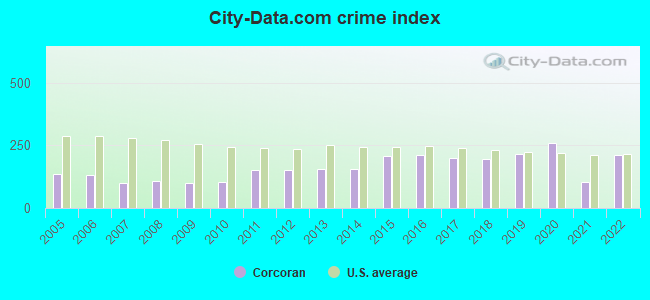
Crime - City-data.com crime index
Crime - Violent crime index
Crime - Property crime index
Crime - Murders per 100,000 population (5 year average)
Crime - Rapes per 100,000 population (5 year average)
Crime - Robberies per 100,000 population (5 year average)
Crime - Assaults per 100,000 population (5 year average)
Crime - Burglaries per 100,000 population (5 year average)
Crime - Thefts per 100,000 population (5 year average)
Crime - Auto thefts per 100,000 population (5 year average)
Crime - Arson per 100,000 population (5 year average)
Crime - City-data.com crime index (5 year average)
Crime - Violent crime index (5 year average)
Crime - Property crime index (5 year average)
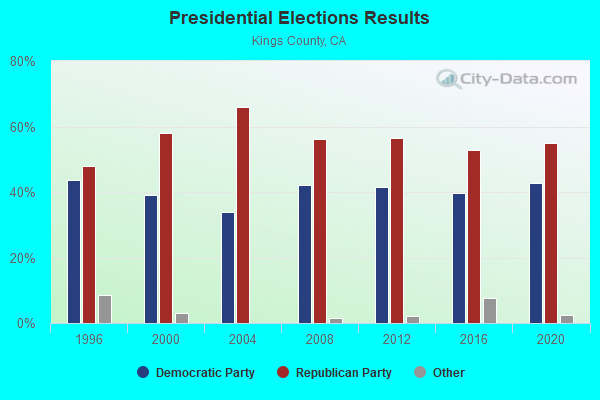
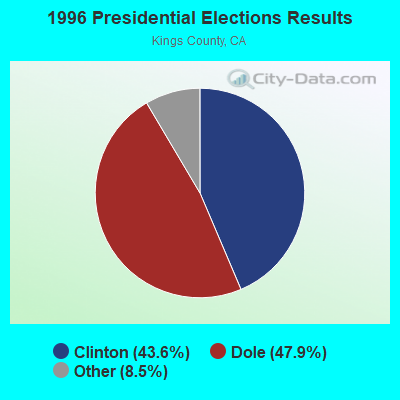
1996 Presidential Elections Results (%) - Democratic Party (Clinton)
1996 Presidential Elections Results (%) - Republican Party (Dole)
1996 Presidential Elections Results (%) - Other
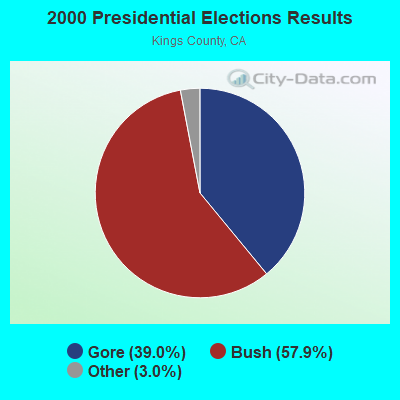
2000 Presidential Elections Results (%) - Democratic Party (Gore)
2000 Presidential Elections Results (%) - Republican Party (Bush)
2000 Presidential Elections Results (%) - Other
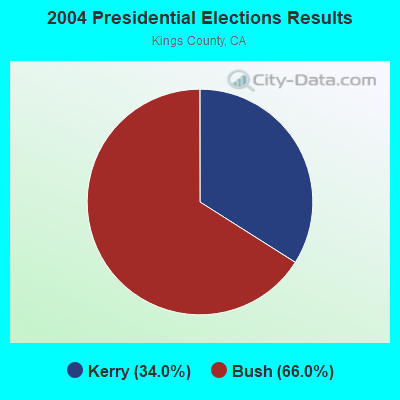
2004 Presidential Elections Results (%) - Democratic Party (Kerry)
2004 Presidential Elections Results (%) - Republican Party (Bush)
2004 Presidential Elections Results (%) - Other
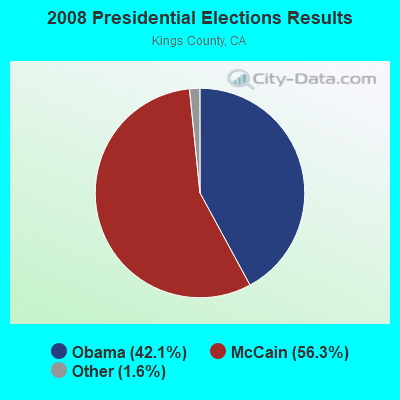
2008 Presidential Elections Results (%) - Democratic Party (Obama)
2008 Presidential Elections Results (%) - Republican Party (McCain)
2008 Presidential Elections Results (%) - Other
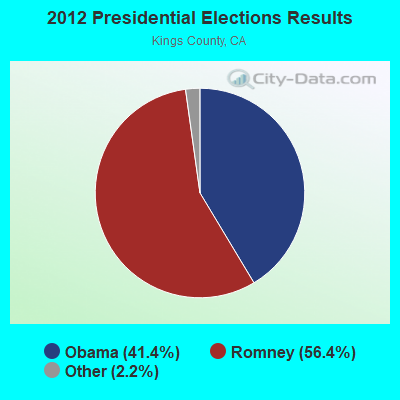
2012 Presidential Elections Results (%) - Democratic Party (Obama)
2012 Presidential Elections Results (%) - Republican Party (Romney)
2012 Presidential Elections Results (%) - Other
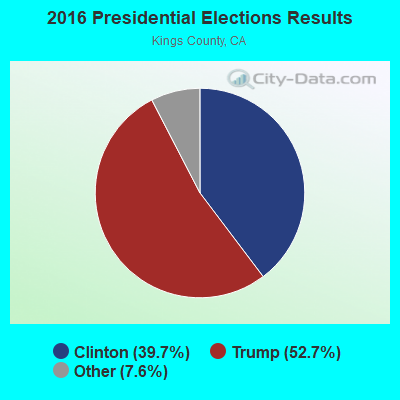
2016 Presidential Elections Results (%) - Democratic Party (Clinton)
2016 Presidential Elections Results (%) - Republican Party (Trump)
2016 Presidential Elections Results (%) - Other
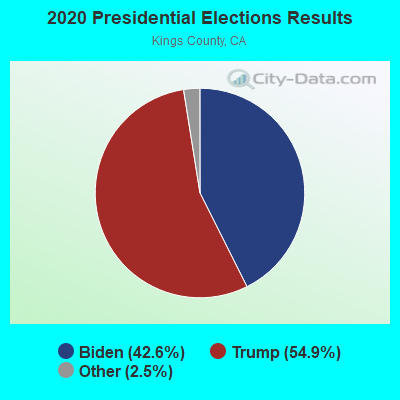
2020 Presidential Elections Results (%) - Democratic Party (Biden)
2020 Presidential Elections Results (%) - Republican Party (Trump)
2020 Presidential Elections Results (%) - Other
Ancestries Reported - Arab (%)
Ancestries Reported - Czech (%)
Ancestries Reported - Danish (%)
Ancestries Reported - Dutch (%)
Ancestries Reported - English (%)
Ancestries Reported - French (%)
Ancestries Reported - French Canadian (%)
Ancestries Reported - German (%)
Ancestries Reported - Greek (%)
Ancestries Reported - Hungarian (%)
Ancestries Reported - Irish (%)
Ancestries Reported - Italian (%)
Ancestries Reported - Lithuanian (%)
Ancestries Reported - Norwegian (%)
Ancestries Reported - Polish (%)
Ancestries Reported - Portuguese (%)
Ancestries Reported - Russian (%)
Ancestries Reported - Scotch-Irish (%)
Ancestries Reported - Scottish (%)
Ancestries Reported - Slovak (%)
Ancestries Reported - Subsaharan African (%)
Ancestries Reported - Swedish (%)
Ancestries Reported - Swiss (%)
Ancestries Reported - Ukrainian (%)
Ancestries Reported - United States (%)
Ancestries Reported - Welsh (%)
Ancestries Reported - West Indian (%)
Ancestries Reported - Other (%)
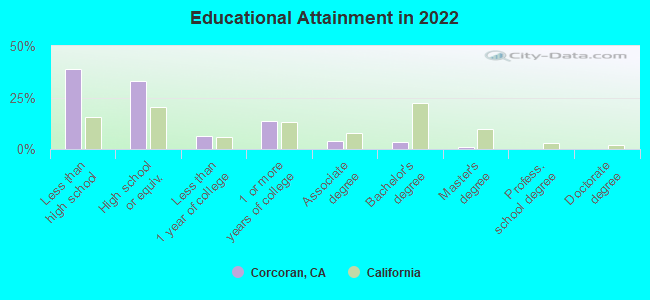
Educational Attainment - No schooling completed (%)
Educational Attainment - Less than high school (%)
Educational Attainment - High school or equivalent (%)
Educational Attainment - Less than 1 year of college (%)
Educational Attainment - 1 or more years of college (%)
Educational Attainment - Associate degree (%)
Educational Attainment - Bachelor's degree (%)
Educational Attainment - Master's degree (%)
Educational Attainment - Professional school degree (%)
Educational Attainment - Doctorate degree (%)
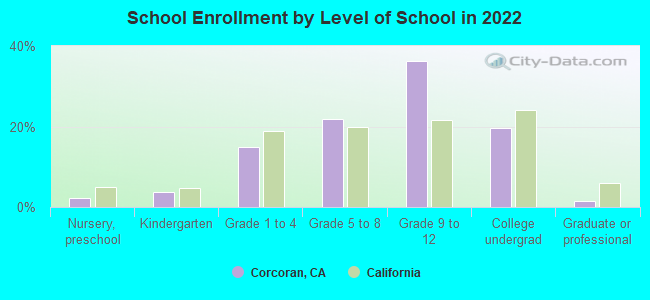
School Enrollment - Nursery, preschool (%)
School Enrollment - Kindergarten (%)
School Enrollment - Grade 1 to 4 (%)
School Enrollment - Grade 5 to 8 (%)
School Enrollment - Grade 9 to 12 (%)
School Enrollment - College undergrad (%)
School Enrollment - Graduate or professional (%)
School Enrollment - Not enrolled in school (%)
School enrollment - Public schools (%)
School enrollment - Private schools (%)
School enrollment - Not enrolled (%)
Median number of rooms in houses and condos
Median number of rooms in apartments
Housing units lacking complete plumbing facilities (%)
Housing units lacking complete kitchen facilities (%)
Density of houses
Urban houses (%)
Rural houses (%)
Households with people 60 years and over (%)
Households with people 65 years and over (%)
Households with people 75 years and over (%)
Households with one or more nonrelatives (%)
Households with no nonrelatives (%)
Population in households (%)
Family households (%)
Nonfamily households (%)
Population in families (%)
Family households with own children (%)
Median number of bedrooms in owner occupied houses
Mean number of bedrooms in owner occupied houses
Median number of bedrooms in renter occupied houses
Mean number of bedrooms in renter occupied houses
Median number of vehichles in owner occupied houses
Mean number of vehichles in owner occupied houses
Median number of vehichles in renter occupied houses
Mean number of vehichles in renter occupied houses
Mortgage status - with mortgage (%)
Mortgage status - with second mortgage (%)
Mortgage status - with home equity loan (%)
Mortgage status - with both second mortgage and home equity loan (%)
Mortgage status - without a mortgage (%)
Average family size
Average family size - White
Average family size - Black or African American
Average family size - Asian
Average family size - Hispanic or Latino
Average family size - American Indian and Alaska Native
Average family size - Multirace
Average family size - Other Race
Geographical mobility - Same house 1 year ago (%)
Geographical mobility - Moved within same county (%)
Geographical mobility - Moved from different county within same state (%)
Geographical mobility - Moved from different state (%)
Geographical mobility - Moved from abroad (%)
Place of birth - Born in state of residence (%)
Place of birth - Born in other state (%)
Place of birth - Native, outside of US (%)
Place of birth - Foreign born (%)
Housing units in structures - 1, detached (%)
Housing units in structures - 1, attached (%)
Housing units in structures - 2 (%)
Housing units in structures - 3 or 4 (%)
Housing units in structures - 5 to 9 (%)
Housing units in structures - 10 to 19 (%)
Housing units in structures - 20 to 49 (%)
Housing units in structures - 50 or more (%)
Housing units in structures - Mobile home (%)
Housing units in structures - Boat, RV, van, etc. (%)
House/condo owner moved in on average (years ago)
Renter moved in on average (years ago)
Year householder moved into unit - Moved in 1999 to March 2000 (%)
Year householder moved into unit - Moved in 1995 to 1998 (%)
Year householder moved into unit - Moved in 1990 to 1994 (%)
Year householder moved into unit - Moved in 1980 to 1989 (%)
Year householder moved into unit - Moved in 1970 to 1979 (%)
Year householder moved into unit - Moved in 1969 or earlier (%)
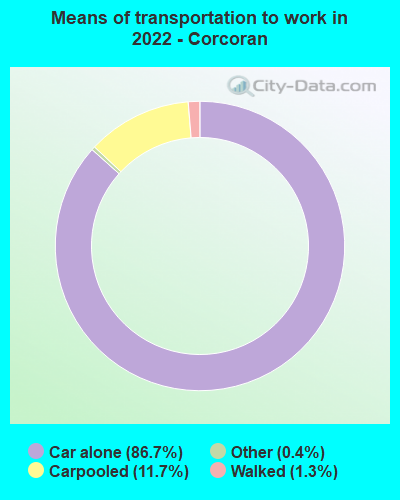
Means of transportation to work - Drove car alone (%)
Means of transportation to work - Carpooled (%)
Means of transportation to work - Public transportation (%)
Means of transportation to work - Bus or trolley bus (%)
Means of transportation to work - Streetcar or trolley car (%)
Means of transportation to work - Subway or elevated (%)
Means of transportation to work - Railroad (%)
Means of transportation to work - Ferryboat (%)
Means of transportation to work - Taxicab (%)
Means of transportation to work - Motorcycle (%)
Means of transportation to work - Bicycle (%)
Means of transportation to work - Walked (%)
Means of transportation to work - Other means (%)
Working at home (%)
Industry diversity
Most Common Industries - Agriculture, forestry, fishing and hunting, and mining (%)
Most Common Industries - Agriculture, forestry, fishing and hunting (%)
Most Common Industries - Mining, quarrying, and oil and gas extraction (%)
Most Common Industries - Construction (%)
Most Common Industries - Manufacturing (%)
Most Common Industries - Wholesale trade (%)
Most Common Industries - Retail trade (%)
Most Common Industries - Transportation and warehousing, and utilities (%)
Most Common Industries - Transportation and warehousing (%)
Most Common Industries - Utilities (%)
Most Common Industries - Information (%)
Most Common Industries - Finance and insurance, and real estate and rental and leasing (%)
Most Common Industries - Finance and insurance (%)
Most Common Industries - Real estate and rental and leasing (%)
Most Common Industries - Professional, scientific, and management, and administrative and waste management services (%)
Most Common Industries - Professional, scientific, and technical services (%)
Most Common Industries - Management of companies and enterprises (%)
Most Common Industries - Administrative and support and waste management services (%)
Most Common Industries - Educational services, and health care and social assistance (%)
Most Common Industries - Educational services (%)
Most Common Industries - Health care and social assistance (%)
Most Common Industries - Arts, entertainment, and recreation, and accommodation and food services (%)
Most Common Industries - Arts, entertainment, and recreation (%)
Most Common Industries - Accommodation and food services (%)
Most Common Industries - Other services, except public administration (%)
Most Common Industries - Public administration (%)
Occupation diversity
Most Common Occupations - Management, business, science, and arts occupations (%)
Most Common Occupations - Management, business, and financial occupations (%)
Most Common Occupations - Management occupations (%)
Most Common Occupations - Business and financial operations occupations (%)
Most Common Occupations - Computer, engineering, and science occupations (%)
Most Common Occupations - Computer and mathematical occupations (%)
Most Common Occupations - Architecture and engineering occupations (%)
Most Common Occupations - Life, physical, and social science occupations (%)
Most Common Occupations - Education, legal, community service, arts, and media occupations (%)
Most Common Occupations - Community and social service occupations (%)
Most Common Occupations - Legal occupations (%)
Most Common Occupations - Education, training, and library occupations (%)
Most Common Occupations - Arts, design, entertainment, sports, and media occupations (%)
Most Common Occupations - Healthcare practitioners and technical occupations (%)
Most Common Occupations - Health diagnosing and treating practitioners and other technical occupations (%)
Most Common Occupations - Health technologists and technicians (%)
Most Common Occupations - Service occupations (%)
Most Common Occupations - Healthcare support occupations (%)
Most Common Occupations - Protective service occupations (%)
Most Common Occupations - Fire fighting and prevention, and other protective service workers including supervisors (%)
Most Common Occupations - Law enforcement workers including supervisors (%)
Most Common Occupations - Food preparation and serving related occupations (%)
Most Common Occupations - Building and grounds cleaning and maintenance occupations (%)
Most Common Occupations - Personal care and service occupations (%)
Most Common Occupations - Sales and office occupations (%)
Most Common Occupations - Sales and related occupations (%)
Most Common Occupations - Office and administrative support occupations (%)
Most Common Occupations - Natural resources, construction, and maintenance occupations (%)
Most Common Occupations - Farming, fishing, and forestry occupations (%)
Most Common Occupations - Construction and extraction occupations (%)
Most Common Occupations - Installation, maintenance, and repair occupations (%)
Most Common Occupations - Production, transportation, and material moving occupations (%)
Most Common Occupations - Production occupations (%)
Most Common Occupations - Transportation occupations (%)
Most Common Occupations - Material moving occupations (%)
People in Group quarters - Institutionalized population (%)
People in Group quarters - Correctional institutions (%)
People in Group quarters - Federal prisons and detention centers (%)
People in Group quarters - Halfway houses (%)
People in Group quarters - Local jails and other confinement facilities (including police lockups) (%)
People in Group quarters - Military disciplinary barracks (%)
People in Group quarters - State prisons (%)
People in Group quarters - Other types of correctional institutions (%)
People in Group quarters - Nursing homes (%)
People in Group quarters - Hospitals/wards, hospices, and schools for the handicapped (%)
People in Group quarters - Hospitals/wards and hospices for chronically ill (%)
People in Group quarters - Hospices or homes for chronically ill (%)
People in Group quarters - Military hospitals or wards for chronically ill (%)
People in Group quarters - Other hospitals or wards for chronically ill (%)
People in Group quarters - Hospitals or wards for drug/alcohol abuse (%)
People in Group quarters - Mental (Psychiatric) hospitals or wards (%)
People in Group quarters - Schools, hospitals, or wards for the mentally retarded (%)
People in Group quarters - Schools, hospitals, or wards for the physically handicapped (%)
People in Group quarters - Institutions for the deaf (%)
People in Group quarters - Institutions for the blind (%)
People in Group quarters - Orthopedic wards and institutions for the physically handicapped (%)
People in Group quarters - Wards in general hospitals for patients who have no usual home elsewhere (%)
People in Group quarters - Wards in military hospitals for patients who have no usual home elsewhere (%)
People in Group quarters - Juvenile institutions (%)
People in Group quarters - Long-term care (%)
People in Group quarters - Homes for abused, dependent, and neglected children (%)
People in Group quarters - Residential treatment centers for emotionally disturbed children (%)
People in Group quarters - Training schools for juvenile delinquents (%)
People in Group quarters - Short-term care, detention or diagnostic centers for delinquent children (%)
People in Group quarters - Type of juvenile institution unknown (%)
People in Group quarters - Noninstitutionalized population (%)
People in Group quarters - College dormitories (includes college quarters off campus) (%)
People in Group quarters - Military quarters (%)
People in Group quarters - On base (%)
People in Group quarters - Barracks, unaccompanied personnel housing (UPH), (Enlisted/Officer), ;and similar group living quarters for military personnel (%)
People in Group quarters - Transient quarters for temporary residents (%)
People in Group quarters - Military ships (%)
People in Group quarters - Group homes (%)
People in Group quarters - Homes or halfway houses for drug/alcohol abuse (%)
People in Group quarters - Homes for the mentally ill (%)
People in Group quarters - Homes for the mentally retarded (%)
People in Group quarters - Homes for the physically handicapped (%)
People in Group quarters - Other group homes (%)
People in Group quarters - Religious group quarters (%)
People in Group quarters - Dormitories (%)
People in Group quarters - Agriculture workers' dormitories on farms (%)
People in Group quarters - Job Corps and vocational training facilities (%)
People in Group quarters - Other workers' dormitories (%)
People in Group quarters - Crews of maritime vessels (%)
People in Group quarters - Other nonhousehold living situations (%)
People in Group quarters - Other noninstitutional group quarters (%)
Residents speaking English at home (%)
Residents speaking English at home - Born in the United States (%)
Residents speaking English at home - Native, born elsewhere (%)
Residents speaking English at home - Foreign born (%)
Residents speaking Spanish at home (%)
Residents speaking Spanish at home - Born in the United States (%)
Residents speaking Spanish at home - Native, born elsewhere (%)
Residents speaking Spanish at home - Foreign born (%)
Residents speaking other language at home (%)
Residents speaking other language at home - Born in the United States (%)
Residents speaking other language at home - Native, born elsewhere (%)
Residents speaking other language at home - Foreign born (%)
Class of Workers - Employee of private company (%)
Class of Workers - Self-employed in own incorporated business (%)
Class of Workers - Private not-for-profit wage and salary workers (%)
Class of Workers - Local government workers (%)
Class of Workers - State government workers (%)
Class of Workers - Federal government workers (%)
Class of Workers - Self-employed workers in own not incorporated business and Unpaid family workers (%)
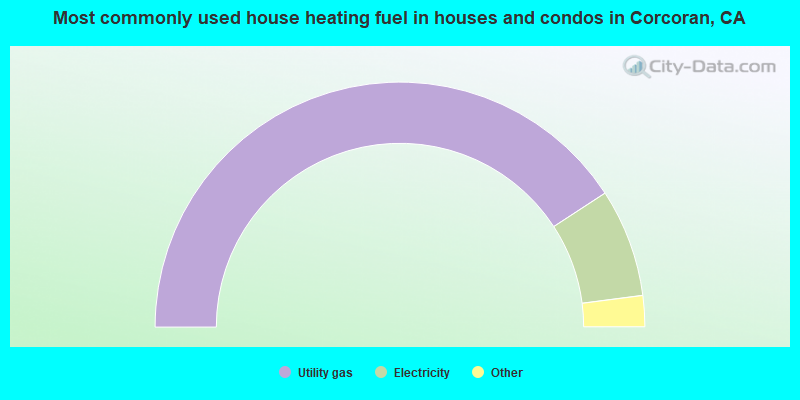
House heating fuel used in houses and condos - Utility gas (%)
House heating fuel used in houses and condos - Bottled, tank, or LP gas (%)
House heating fuel used in houses and condos - Electricity (%)
House heating fuel used in houses and condos - Fuel oil, kerosene, etc. (%)
House heating fuel used in houses and condos - Coal or coke (%)
House heating fuel used in houses and condos - Wood (%)
House heating fuel used in houses and condos - Solar energy (%)
House heating fuel used in houses and condos - Other fuel (%)
House heating fuel used in houses and condos - No fuel used (%)
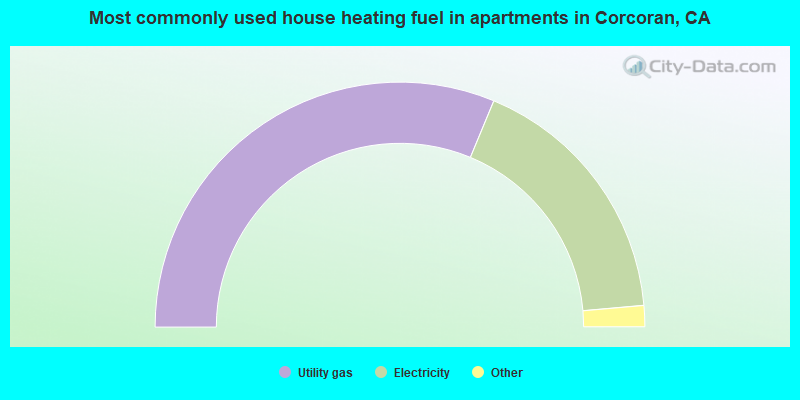
House heating fuel used in apartments - Utility gas (%)
House heating fuel used in apartments - Bottled, tank, or LP gas (%)
House heating fuel used in apartments - Electricity (%)
House heating fuel used in apartments - Fuel oil, kerosene, etc. (%)
House heating fuel used in apartments - Coal or coke (%)
House heating fuel used in apartments - Wood (%)
House heating fuel used in apartments - Solar energy (%)
House heating fuel used in apartments - Other fuel (%)
House heating fuel used in apartments - No fuel used (%)
Armed forces status - In Armed Forces (%)
Armed forces status - Civilian (%)
Armed forces status - Civilian - Veteran (%)
Armed forces status - Civilian - Nonveteran (%)
Fatal accidents locations in years 2005-2021
Fatal accidents locations in 2005
Fatal accidents locations in 2006
Fatal accidents locations in 2007
Fatal accidents locations in 2008
Fatal accidents locations in 2009
Fatal accidents locations in 2010
Fatal accidents locations in 2011
Fatal accidents locations in 2012
Fatal accidents locations in 2013
Fatal accidents locations in 2014
Fatal accidents locations in 2015
Fatal accidents locations in 2016
Fatal accidents locations in 2017
Fatal accidents locations in 2018
Fatal accidents locations in 2019
Fatal accidents locations in 2020
Fatal accidents locations in 2021
Alcohol use - People drinking some alcohol every month (%)
Alcohol use - People not drinking at all (%)
Alcohol use - Average days/month drinking alcohol
Alcohol use - Average drinks/week
Alcohol use - Average days/year people drink much
Audiometry - Average condition of hearing (%)
Audiometry - People that can hear a whisper from across a quiet room (%)
Audiometry - People that can hear normal voice from across a quiet room (%)
Audiometry - Ears ringing, roaring, buzzing (%)
Audiometry - Had a job exposure to loud noise (%)
Audiometry - Had off-work exposure to loud noise (%)
Blood Pressure & Cholesterol - Has high blood pressure (%)
Blood Pressure & Cholesterol - Checking blood pressure at home (%)
Blood Pressure & Cholesterol - Frequently checking blood cholesterol (%)
Blood Pressure & Cholesterol - Has high cholesterol level (%)
Consumer Behavior - Money monthly spent on food at supermarket/grocery store
Consumer Behavior - Money monthly spent on food at other stores
Consumer Behavior - Money monthly spent on eating out
Consumer Behavior - Money monthly spent on carryout/delivered foods
Consumer Behavior - Income spent on food at supermarket/grocery store (%)
Consumer Behavior - Income spent on food at other stores (%)
Consumer Behavior - Income spent on eating out (%)
Consumer Behavior - Income spent on carryout/delivered foods (%)
Current Health Status - General health condition (%)
Current Health Status - Blood donors (%)
Current Health Status - Has blood ever tested for HIV virus (%)
Current Health Status - Left-handed people (%)
Dermatology - People using sunscreen (%)
Diabetes - Diabetics (%)
Diabetes - Had a blood test for high blood sugar (%)
Diabetes - People taking insulin (%)
Diet Behavior & Nutrition - Diet health (%)
Diet Behavior & Nutrition - Milk product consumption (# of products/month)
Diet Behavior & Nutrition - Meals not home prepared (#/week)
Diet Behavior & Nutrition - Meals from fast food or pizza place (#/week)
Diet Behavior & Nutrition - Ready-to-eat foods (#/month)
Diet Behavior & Nutrition - Frozen meals/pizza (#/month)
Drug Use - People that ever used marijuana or hashish (%)
Drug Use - Ever used hard drugs (%)
Drug Use - Ever used any form of cocaine (%)
Drug Use - Ever used heroin (%)
Drug Use - Ever used methamphetamine (%)
Health Insurance - People covered by health insurance (%)
Kidney Conditions-Urology - Avg. # of times urinating at night
Medical Conditions - People with asthma (%)
Medical Conditions - People with anemia (%)
Medical Conditions - People with psoriasis (%)
Medical Conditions - People with overweight (%)
Medical Conditions - Elderly people having difficulties in thinking or remembering (%)
Medical Conditions - People who ever received blood transfusion (%)
Medical Conditions - People having trouble seeing even with glass/contacts (%)
Medical Conditions - People with arthritis (%)
Medical Conditions - People with gout (%)
Medical Conditions - People with congestive heart failure (%)
Medical Conditions - People with coronary heart disease (%)
Medical Conditions - People with angina pectoris (%)
Medical Conditions - People who ever had heart attack (%)
Medical Conditions - People who ever had stroke (%)
Medical Conditions - People with emphysema (%)
Medical Conditions - People with thyroid problem (%)
Medical Conditions - People with chronic bronchitis (%)
Medical Conditions - People with any liver condition (%)
Medical Conditions - People who ever had cancer or malignancy (%)
Mental Health - People who have little interest in doing things (%)
Mental Health - People feeling down, depressed, or hopeless (%)
Mental Health - People who have trouble sleeping or sleeping too much (%)
Mental Health - People feeling tired or having little energy (%)
Mental Health - People with poor appetite or overeating (%)
Mental Health - People feeling bad about themself (%)
Mental Health - People who have trouble concentrating on things (%)
Mental Health - People moving or speaking slowly or too fast (%)
Mental Health - People having thoughts they would be better off dead (%)
Oral Health - Average years since last visit a dentist
Oral Health - People embarrassed because of mouth (%)
Oral Health - People with gum disease (%)
Oral Health - General health of teeth and gums (%)
Oral Health - Average days a week using dental floss/device
Oral Health - Average days a week using mouthwash for dental problem
Oral Health - Average number of teeth
Pesticide Use - Households using pesticides to control insects (%)
Pesticide Use - Households using pesticides to kill weeds (%)
Physical Activity - People doing vigorous-intensity work activities (%)
Physical Activity - People doing moderate-intensity work activities (%)
Physical Activity - People walking or bicycling (%)
Physical Activity - People doing vigorous-intensity recreational activities (%)
Physical Activity - People doing moderate-intensity recreational activities (%)
Physical Activity - Average hours a day doing sedentary activities
Physical Activity - Average hours a day watching TV or videos
Physical Activity - Average hours a day using computer
Physical Functioning - People having limitations keeping them from working (%)
Physical Functioning - People limited in amount of work they can do (%)
Physical Functioning - People that need special equipment to walk (%)
Physical Functioning - People experiencing confusion/memory problems (%)
Physical Functioning - People requiring special healthcare equipment (%)
Prescription Medications - Average number of prescription medicines taking
Preventive Aspirin Use - Adults 40+ taking low-dose aspirin (%)
Reproductive Health - Vaginal deliveries (%)
Reproductive Health - Cesarean deliveries (%)
Reproductive Health - Deliveries resulted in a live birth (%)
Reproductive Health - Pregnancies resulted in a delivery (%)
Reproductive Health - Women breastfeeding newborns (%)
Reproductive Health - Women that had a hysterectomy (%)
Reproductive Health - Women that had both ovaries removed (%)
Reproductive Health - Women that have ever taken birth control pills (%)
Reproductive Health - Women taking birth control pills (%)
Reproductive Health - Women that have ever used Depo-Provera or injectables (%)
Reproductive Health - Women that have ever used female hormones (%)
Sexual Behavior - People 18+ that ever had sex (vaginal, anal, or oral) (%)
Sexual Behavior - Males 18+ that ever had vaginal sex with a woman (%)
Sexual Behavior - Males 18+ that ever performed oral sex on a woman (%)
Sexual Behavior - Males 18+ that ever had anal sex with a woman (%)
Sexual Behavior - Males 18+ that ever had any sex with a man (%)
Sexual Behavior - Females 18+ that ever had vaginal sex with a man (%)
Sexual Behavior - Females 18+ that ever performed oral sex on a man (%)
Sexual Behavior - Females 18+ that ever had anal sex with a man (%)
Sexual Behavior - Females 18+ that ever had any kind of sex with a woman (%)
Sexual Behavior - Average age people first had sex
Sexual Behavior - Average number of female sex partners in lifetime (males 18+)
Sexual Behavior - Average number of female vaginal sex partners in lifetime (males 18+)
Sexual Behavior - Average age people first performed oral sex on a woman (18+)
Sexual Behavior - Average number of woman performed oral sex on in lifetime (18+)
Sexual Behavior - Average number of male sex partners in lifetime (males 18+)
Sexual Behavior - Average number of male anal sex partners in lifetime (males 18+)
Sexual Behavior - Average age people first performed oral sex on a man (18+)
Sexual Behavior - Average number of male oral sex partners in lifetime (18+)
Sexual Behavior - People using protection when performing oral sex (%)
Sexual Behavior - Average number of times people have vaginal or anal sex a year
Sexual Behavior - People having sex without condom (%)
Sexual Behavior - Average number of male sex partners in lifetime (females 18+)
Sexual Behavior - Average number of male vaginal sex partners in lifetime (females 18+)
Sexual Behavior - Average number of female sex partners in lifetime (females 18+)
Sexual Behavior - Circumcised males 18+ (%)
Sleep Disorders - Average hours sleeping at night
Sleep Disorders - People that has trouble sleeping (%)
Smoking-Cigarette Use - People smoking cigarettes (%)
Taste & Smell - People 40+ having problems with smell (%)
Taste & Smell - People 40+ having problems with taste (%)
Taste & Smell - People 40+ that ever had wisdom teeth removed (%)
Taste & Smell - People 40+ that ever had tonsils teeth removed (%)
Taste & Smell - People 40+ that ever had a loss of consciousness because of a head injury (%)
Taste & Smell - People 40+ that ever had a broken nose or other serious injury to face or skull (%)
Taste & Smell - People 40+ that ever had two or more sinus infections (%)
Weight - Average height (inches)
Weight - Average weight (pounds)
Weight - Average BMI
Weight - People that are obese (%)
Weight - People that ever were obese (%)
Weight - People trying to lose weight (%)
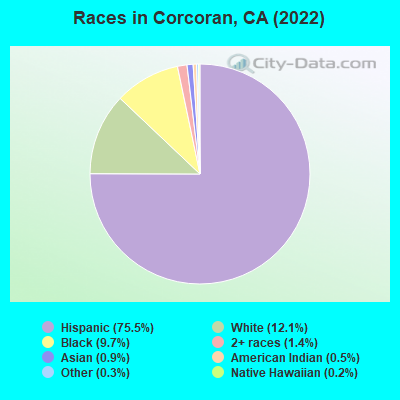
17,275 75.5% Hispanic 2,778 12.1% White alone 2,215 9.7% Black alone 311 1.4% Two or more races 208 0.9% Asian alone 114 0.5% American Indian alone 64 0.3% Other race alone 43 0.2% Native Hawaiian and Other
Officers per 1,000 residents here:
0.79California average:
2.30
Latest news from Corcoran, CA collected exclusively by city-data.com from local newspapers, TV, and radio stations
Ancestries: English (1.1%).
Current Local Time:
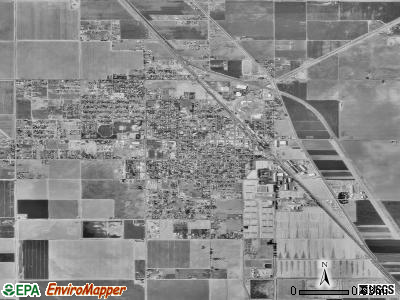
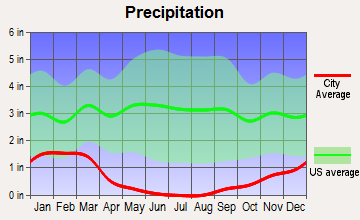
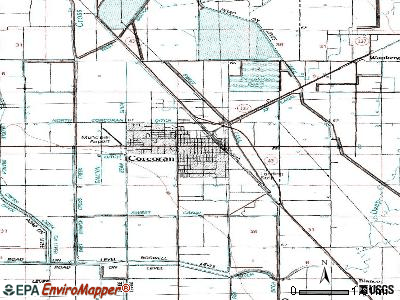
Land area: 6.40 square miles.
Population density: 3,570 people per square mile (average).
4,799 residents are foreign born (20.0% Latin America ).
This city:
21.0%California:
26.5%
Median real estate property taxes paid for housing units with mortgages in 2022: $1,758 (0.7%)Median real estate property taxes paid for housing units with no mortgage in 2022: $801 (0.5%)
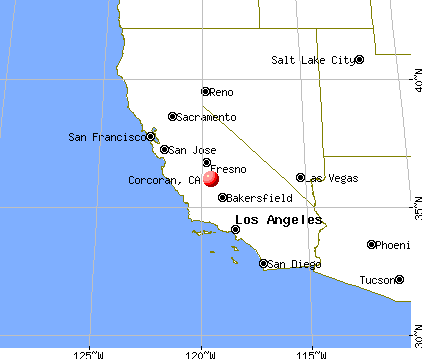
Nearest city with pop. 50,000+: Visalia, CA
Nearest city with pop. 200,000+: Fresno, CA
Nearest city with pop. 1,000,000+: Los Angeles, CA
Nearest cities:
Waukena, CA (2.1 miles),
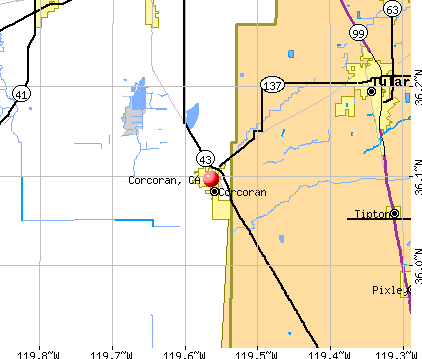
Latitude: 36.10 N, Longitude: 119.56 W
Daytime population change due to commuting: +709 (+3.1%)Workers who live and work in this city: 1,854 (34.2%)
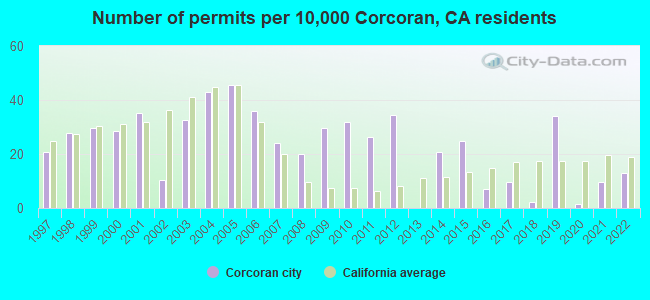
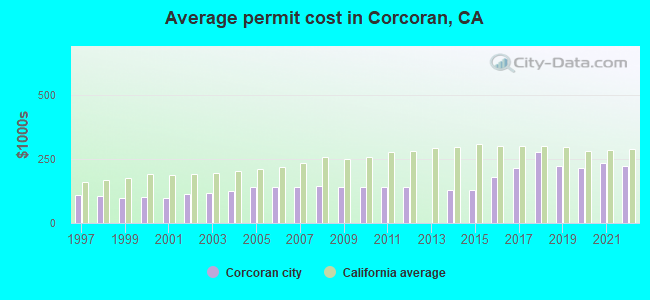
Single-family new house construction building permits:
2022: 19 buildings , average cost: $223,2002021: 14 buildings , average cost: $233,3002020: 2 buildings , average cost: $216,9002019: 49 buildings , average cost: $224,6002018: 3 buildings , average cost: $277,8002017: 14 buildings , average cost: $214,3002016: 10 buildings , average cost: $182,3002015: 36 buildings , average cost: $130,5002014: 30 buildings , average cost: $130,5002012: 50 buildings , average cost: $141,6002011: 38 buildings , average cost: $141,6002010: 46 buildings , average cost: $141,6002009: 43 buildings , average cost: $141,6002008: 29 buildings , average cost: $144,2002007: 35 buildings , average cost: $138,6002006: 52 buildings , average cost: $138,6002005: 66 buildings , average cost: $138,6002004: 62 buildings , average cost: $126,8002003: 47 buildings , average cost: $117,0002002: 15 buildings , average cost: $112,3002001: 51 buildings , average cost: $95,6002000: 41 buildings , average cost: $101,1001999: 43 buildings , average cost: $99,3001998: 40 buildings , average cost: $106,3001997: 30 buildings , average cost: $110,700Unemployment in December 2023: Here:
18.7%California:
5.1%
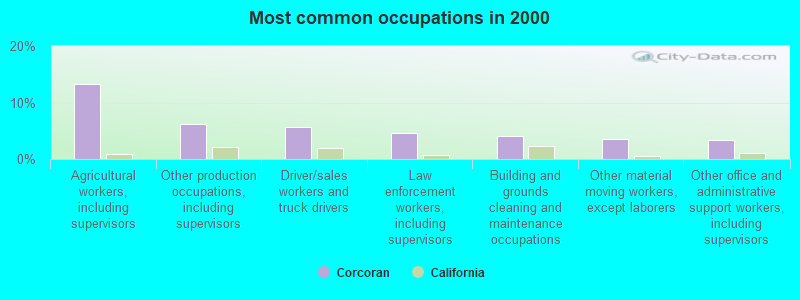
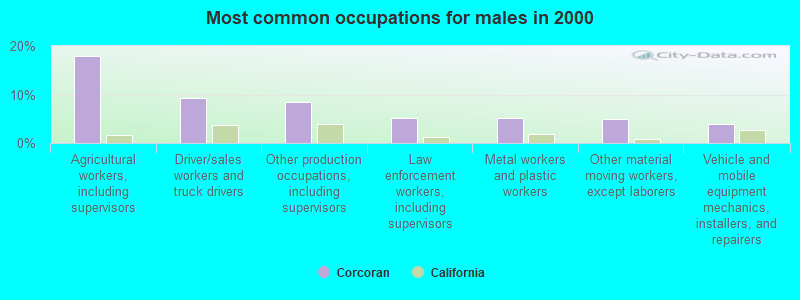
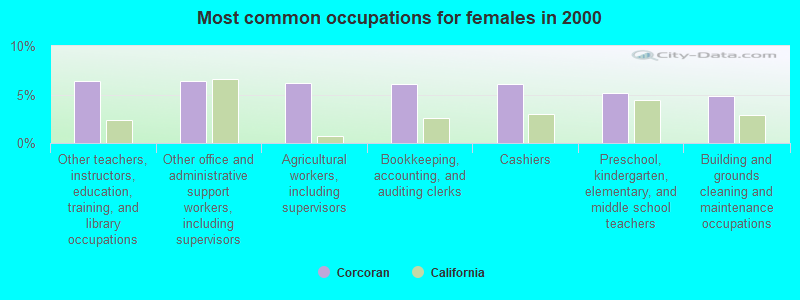
Most common occupations in Corcoran, CA (%)
Both Males Females
Agricultural workers, including supervisors (13.3%)
Other production occupations, including supervisors (6.2%)
Driver/sales workers and truck drivers (5.6%)
Law enforcement workers, including supervisors (4.6%)
Building and grounds cleaning and maintenance occupations (4.1%)
Other material moving workers, except laborers (3.5%)
Other office and administrative support workers, including supervisors (3.3%)
Agricultural workers, including supervisors (18.0%)
Driver/sales workers and truck drivers (9.2%)
Other production occupations, including supervisors (8.4%)
Law enforcement workers, including supervisors (5.2%)
Metal workers and plastic workers (5.1%)
Other material moving workers, except laborers (5.0%)
Vehicle and mobile equipment mechanics, installers, and repairers (4.0%)
Other teachers, instructors, education, training, and library occupations (6.4%)
Other office and administrative support workers, including supervisors (6.3%)
Agricultural workers, including supervisors (6.2%)
Bookkeeping, accounting, and auditing clerks (6.1%)
Cashiers (6.1%)
Preschool, kindergarten, elementary, and middle school teachers (5.1%)
Building and grounds cleaning and maintenance occupations (4.9%)
Earthquake activity:
Corcoran-area historical earthquake activity is significantly above California state average. It is 8361% greater than the overall U.S. average. On 7/21/1952 at 11:52:14, a magnitude 7.7 (7.7 UK, Class: Major, Intensity: VIII - XII) earthquake occurred 82.2 miles away from the city center, causing $50,000,000 total damage On 11/4/1927 at 13:51:53, a magnitude 7.5 (7.5 UK) earthquake occurred 116.1 miles away from the city center On 4/18/1906 at 13:12:21, a magnitude 7.9 (7.9 UK) earthquake occurred 230.9 miles away from the city center, causing $524,000,000 total damage On 6/28/1992 at 11:57:34, a magnitude 7.6 (6.2 MB, 7.6 MS, 7.3 MW, Depth: 0.7 mi) earthquake occurred 216.6 miles away from the city center, causing 3 deaths ( 1 shaking deaths, 2 other deaths) and 400 injuries, causing $100,000,000 total damage and $40,000,000 insured lossesOn 10/16/1999 at 09:46:44, a magnitude 7.4 (6.3 MB, 7.4 MS, 7.2 MW, 7.3 ML) earthquake occurred 207.7 miles away from the city center On 5/2/1983 at 23:42:37, a magnitude 6.7 (6.2 MB, 6.5 MS, 6.5 MW, 6.7 ML, Class: Strong, Intensity: VII - IX) earthquake occurred 42.2 miles away from Corcoran center, causing $31,000,000 total damage Magnitude types: body-wave magnitude (MB), local magnitude (ML), surface-wave magnitude (MS), moment magnitude (MW) Natural disasters: The number of natural disasters in Kings County (14) is near the US average (15).Major Disasters (Presidential) Declared: 10Emergencies Declared: 2Floods: 9, Storms: 4, Winter Storms: 4, Landslides: 2, Mudslides: 2, Drought: 1, Earthquake: 1, Freeze: 1, Hurricane: 1, Tornado: 1, Other: 1 (Note: some incidents may be assigned to more than one category). Hospitals and medical centers in Corcoran: CORCORAN DISTRICT HOSPITAL (Government - Hospital District or Authority, provides emergency services, 1310 HANNA AVE) Other hospitals and medical centers near Corcoran: JAN AND GAIL'S CARE HOME #1 (Hospital, about 14 miles away; TULARE, CA)
LOYD'S LIBERTY HOMES, INC- 'A' STREET HOME (Hospital, about 14 miles away; TULARE, CA)
LOYD'S LIBERTY HOMES, INC - OWENS HOME (Hospital, about 14 miles away; TULARE, CA)
TULARE DIALYSIS (Dialysis Facility, about 15 miles away; TULARE, CA)
TWIN OAKS REHABILITATION AND NURSING CENTER (Nursing Home, about 16 miles away; TULARE, CA)
JAN AND GAIL'S CARE HOME #5 (Hospital, about 16 miles away; TULARE, CA)
MERRITT MANOR CONV HOSP (Nursing Home, about 16 miles away; TULARE, CA)
Amtrak station: CORCORAN (WHITLEY & OTIS AVES.)
.
Services: partially wheelchair accessible, public payphones, free short-term parking, free long-term parking.
Colleges/universities with over 2000 students nearest to Corcoran:
San Joaquin Valley College-Visalia (about 19 miles; Visalia, CA ; Full-time enrollment: 2,386)
West Hills College-Lemoore (about 20 miles; Lemoore, CA ; FT enrollment: 2,314)
College of the Sequoias (about 21 miles; Visalia, CA ; FT enrollment: 6,982)
Porterville College (about 31 miles; Porterville, CA ; FT enrollment: 2,560)
Reedley College (about 36 miles; Reedley, CA ; FT enrollment: 8,144)
Fresno Pacific University (about 45 miles; Fresno, CA ; FT enrollment: 3,083)
Fresno City College (about 49 miles; Fresno, CA ; FT enrollment: 12,994)
Public high schools in Corcoran: CORCORAN HIGH Students: 643, Location: 1100 LETTS AVE., Grades: 9-12)CORCORAN ACADEMY Students: 32, Location: 1128 DAIRY AVE., Grades: KG-12)KINGS LAKE EDUCATION CENTER Students: 20, Location: 1128 S. DAIRY AVE., Grades: 10-12)MISSION COMMUNITY DAY Location: 1128 S. DAIRY AVE., Grades: 6-12)
Public elementary/middle schools in Corcoran:
See full list of schools located in Corcoran
Notable locations in Corcoran: (A) , Crockett and Gambogy Labor Camp (B) , Corcoran High School Agricultural Farm (C) , Boswell Camp One (D) , Veterans Memorial Hall (E) , Kate H Boswell Seniors Center (F) , Corcoran Unified School District Office (G) , Corcoran State Prison (H) , Corcoran Family YMCA (I) , Corcoran City Hall (J) , Corcoran Branch Kings County Library (K) , American Ambulance (L) , Corcoran State Prison Fire Department (M) , Kings County Fire Department Station 11 Corcoran (N) . Display/hide their locations on the map
Churches in Corcoran include: (A) , Church of the Nazarene (B) , Episcopal Church of the Epiphany (C) , First Baptist Church (D) , First Missionary Baptist Church (E) , First Presbyterian Church (F) , First United Methodist Church (G) , First United Presbyterian Church (H) , Kingdom Hall of Jehovahs Witnesses (I) . Display/hide their locations on the map
Parks in Corcoran include: (1) , Corcoran City Swimming Pool (2) , Father Wyatt Park (3) , John Maroot Park (4) . Display/hide their locations on the map
Hotel:
Birthplace of: Mack Reynolds - Science fiction writer.
Kings County has a predicted average indoor radon screening level less than 2 pCi/L (pico curies per liter) - Low Potential Average household size: This city:
3.5 peopleCalifornia:
2.9 people
Percentage of family households: This city:
80.5%Whole state:
68.7%
Percentage of households with unmarried partners: This city:
11.2%Whole state:
7.2%
Likely homosexual households (counted as self-reported same-sex unmarried-partner households)
Lesbian couples: 0.3% of all households Gay men: 0.3% of all households
People in group quarters in Corcoran in 2010:
12,118 people in state prisons
115 people in military ships
6 people in hospitals with patients who have no usual home elsewhere
people in state prisons in 2000Banks with branches in Corcoran (2011 data):
Bank of the West: Corcoran Branch at 1045 Whitley Avenue, branch established on 1954/12/01. Info updated 2009/11/16: Bank assets: $62,408.3 mil, Deposits: $43,995.2 mil, headquarters in San Francisco, CA, positive income , 647 total offices , Holding Company: Bnp Paribas
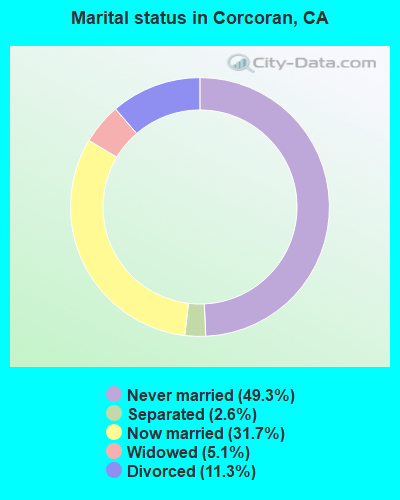
For population 15 years and over in Corcoran:
Never married: 49.3%Now married: 31.7%Separated: 2.6%Widowed: 5.1%Divorced: 11.3% For population 25 years and over in Corcoran:
High school or higher: 58.8%Bachelor's degree or higher: 3.9%Graduate or professional degree: 1.1%Unemployed: 13.6%Mean travel time to work (commute): 18.8 minutes
Education Gini index (Inequality in education) Here:
14.2California average:
15.5
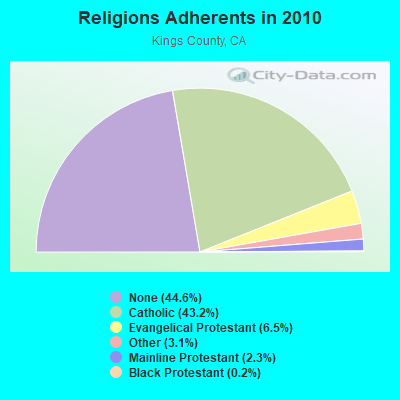
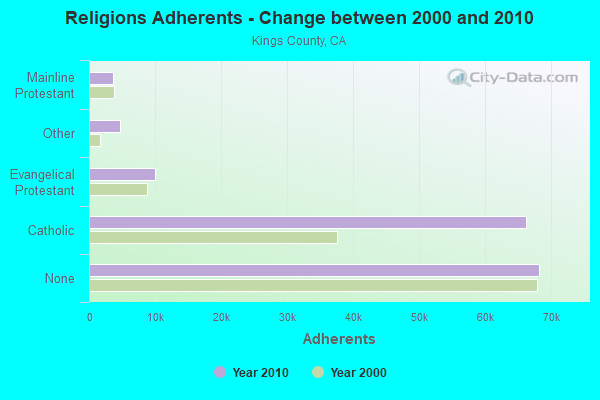
Religion statistics for Corcoran, CA (based on Kings County data)
Religion Adherents Congregations Catholic 66,133 8 Evangelical Protestant 10,014 78 Other 4,742 11 Mainline Protestant 3,586 13 Black Protestant 320 2 None 68,187 -
Source: Clifford Grammich, Kirk Hadaway, Richard Houseal, Dale E.Jones, Alexei Krindatch, Richie Stanley and Richard H.Taylor. 2012. 2010 U.S.Religion Census: Religious Congregations & Membership Study. Association of Statisticians of American Religious Bodies. Jones, Dale E., et al. 2002. Congregations and Membership in the United States 2000. Nashville, TN: Glenmary Research Center. Graphs represent county-level data
Food Environment Statistics: Number of grocery stores : 30This county :
2.02 / 10,000 pop.State :
2.14 / 10,000 pop.
Number of convenience stores (no gas) : 9This county :
0.61 / 10,000 pop.California :
0.62 / 10,000 pop.
Number of convenience stores (with gas) : 23This county :
1.55 / 10,000 pop.California :
1.49 / 10,000 pop.
Number of full-service restaurants : 48This county :
3.24 / 10,000 pop.California :
7.42 / 10,000 pop.
Adult diabetes rate : Kings County :
6.4%California :
7.3%
Adult obesity rate : Kings County :
26.2%California :
21.3%
Low-income preschool obesity rate : Kings County :
21.4%California :
17.9%
Health and Nutrition: Healthy diet rate : Corcoran:
45.3%California:
49.4%
Average overall health of teeth and gums : This city:
42.9%California:
48.0%
People feeling badly about themselves : Corcoran:
21.2%California:
20.2%
People not drinking alcohol at all : Corcoran:
8.9%California:
11.2%
Average hours sleeping at night : Corcoran:
6.7California:
6.8
Overweight people : This city:
27.4%California:
31.5%
General health condition : Corcoran:
54.7%State:
56.4%
Average condition of hearing : Corcoran:
82.0%California:
80.9%
More about Health and Nutrition of Corcoran, CA Residents
Local government employment and payroll (March 2022)
Function
Full-time employees
Monthly full-time payroll
Average yearly full-time wage
Part-time employees
Monthly part-time payroll
Police Protection - Officers
17 $156,636 $110,567 1 $2,992 Police - Other
16 $75,801 $56,851 5 $6,311 Financial Administration
6 $44,744 $89,488 0 $0 Water Supply
6 $36,251 $72,502 0 $0 Transit
5 $21,130 $50,712 0 $0 Sewerage
4 $23,564 $70,692 0 $0 Streets and Highways
4 $12,308 $36,924 0 $0 Housing and Community Development (Local)
3 $21,494 $85,976 0 $0 Other Government Administration
3 $27,796 $111,184 0 $0 Parks and Recreation
2 $10,380 $62,280 0 $0 Other and Unallocable
2 $20,689 $124,134 0 $0
Totals for Government
68 $450,794 $79,552 6 $9,303
Corcoran government finances - Expenditure in 2017 (per resident):
Construction - Housing and Community Development: $766,000 ($33.54)
Water Utilities: $661,000 ($28.94)Regular Highways: $635,000 ($27.81)Police Protection: $183,000 ($8.01)Sewerage: $173,000 ($7.58)Current Operations - Water Utilities: $7,917,000 ($346.67)
Police Protection: $3,723,000 ($163.02)Solid Waste Management: $1,823,000 ($79.83)Transit Utilities: $1,506,000 ($65.95)Sewerage: $1,180,000 ($51.67)Regular Highways: $506,000 ($22.16)Central Staff Services: $459,000 ($20.10)Local Fire Protection: $425,000 ($18.61)Housing and Community Development: $385,000 ($16.86)Parks and Recreation: $339,000 ($14.84)Protective Inspection and Regulation - Other: $169,000 ($7.40)Financial Administration: $145,000 ($6.35)General - Other: $80,000 ($3.50)Intergovernmental to Local - Other - Local Fire Protection: $513,000 ($22.46)
Other Capital Outlay - Water Utilities: $1,977,000 ($86.57)
Parks and Recreation: $34,000 ($1.49)General - Other: $22,000 ($0.96)Transit Utilities: $15,000 ($0.66)Total Salaries and Wages: $261,000 ($11.43)
Water Utilities - Interest on Debt: $753,000 ($32.97)
Corcoran government finances - Revenue in 2017 (per resident):
Charges - Solid Waste Management: $1,759,000 ($77.02)
Sewerage: $1,324,000 ($57.98)Other: $285,000 ($12.48)Regular Highways: $34,000 ($1.49)Federal Intergovernmental - Other: $131,000 ($5.74)
Transit Utilities: $117,000 ($5.12)Sewerage: $26,000 ($1.14)Housing and Community Development: $12,000 ($0.53)Water Utilities: $7,000 ($0.31)Local Intergovernmental - Transit Utilities: $826,000 ($36.17)
Sewerage: $8,000 ($0.35)Miscellaneous - General Revenue - Other: $785,000 ($34.37)
Sale of Property: $412,000 ($18.04)Rents: $333,000 ($14.58)Interest Earnings: $121,000 ($5.30)Fines and Forfeits: $100,000 ($4.38)Revenue - Water Utilities: $4,673,000 ($204.62)
Transit Utilities: $160,000 ($7.01)State Intergovernmental - Other: $504,000 ($22.07)
Highways: $450,000 ($19.70)General Local Government Support: $2,000 ($0.09)Tax - Property: $2,686,000 ($117.62)
General Sales and Gross Receipts: $1,783,000 ($78.08)Public Utilities Sales: $250,000 ($10.95)Other License: $102,000 ($4.47)Other Selective Sales: $48,000 ($2.10)Occupation and Business License - Other: $39,000 ($1.71)Documentary and Stock Transfer: $13,000 ($0.57)Other: $8,000 ($0.35)
Corcoran government finances - Debt in 2017 (per resident):
Long Term Debt - Outstanding Unspecified Public Purpose: $24,931,000 ($1091.69)
Issue, Unspecified Public Purpose: $20,726,000 ($907.56)Beginning Outstanding - Unspecified Public Purpose: $20,340,000 ($890.66)Retired Unspecified Public Purpose: $16,135,000 ($706.53)
Corcoran government finances - Cash and Securities in 2017 (per resident):
Bond Funds - Cash and Securities: $125,000 ($5.47)
Other Funds - Cash and Securities: $34,147,000 ($1495.25)
7.18% of this county's 2021 resident taxpayers lived in other counties in 2020 ($37,717 average adjusted gross income )
Here:
7.18%California average:
5.19%
0.18% of residents moved from foreign countries ($1,419 average AGI )Kings County:
0.18%California average:
0.03%
Top counties from which taxpayers relocated into this county between 2020 and 2021:
7.32% of this county's 2020 resident taxpayers moved to other counties in 2021 ($55,523 average adjusted gross income )
Here:
7.32%California average:
6.14%
0.15% of residents moved to foreign countries ($1,240 average AGI )Kings County:
0.15%California average:
0.02%
Top counties to which taxpayers relocated from this county between 2020 and 2021:
Businesses in Corcoran, CA
Name Count Name Count
AutoZone 1 RadioShack 1 Chevrolet 1 Rite Aid 1 Cricket Wireless 1 Subway 1 FedEx 1 Taco Bell 1 GNC 1 True Value 1 H&R Block 1 UPS 1 McDonald's 1 YMCA 1
Strongest AM radio stations in Corcoran:
KWRU (940 AM; 50 kW; FRESNO, CA)
KMJ (580 AM; 50 kW; FRESNO, CA; Owner: INFINITY RADIO OPERATIONS INC.)
KERI (1180 AM; 50 kW; WASCO-GREENACRES, CA; Owner: KWSO, INC.)
KJUG (1270 AM; 5 kW; TULARE, CA; Owner: WESTCOAST BROADCASTING, INC.)
KCHJ (1010 AM; 5 kW; DELANO, CA; Owner: ILLINOIS LOTUS CORP.)
KGDP (660 AM; 50 kW; ORCUTT, CA; Owner: RADIO REPRESENTATIVES, INC.)
KIGS (620 AM; 1 kW; HANFORD, CA; Owner: PERREIRA BROADCASTING)
KRDU (1130 AM; 6 kW; DINUBA, CA; Owner: CAPSTAR TX LIMITED PARTNERSHIP)
KOOR (790 AM; 10 kW; CLOVIS, CA; Owner: INFINITY RADIO OPERATIONS INC.)
KNZR (1560 AM; 25 kW; BAKERSFIELD, CA; Owner: BUCKLEY BROADCASTING CORP. OF CALIF.)
KGEN (1370 AM; 1 kW; TULARE, CA; Owner: AZTECA BROADCASTING CORPORATION)
KIRN (670 AM; 35 kW; SIMI VALLEY, CA; Owner: LOTUS OXNARD CORP.)
KIRV (1510 AM; daytime; 10 kW; FRESNO, CA; Owner: GORE-OVERGAARD BROADCASTING, INC)
Strongest FM radio stations in Corcoran:
KXQX (102.3 FM; CORCORAN, CA; Owner: RAK COMMUNICATIONS, INC.)
KGEN-FM (94.5 FM; HANFORD, CA; Owner: AZTECA BROADCASTING CORPORATION)
KZPO (103.3 FM; LINDSAY, CA; Owner: LINDSAY BROADCASTING)
KMQA (100.5 FM; EAST PORTERVILLE, CA; Owner: MOON BROADCASTING PORTERVILLE L.L.C.)
KDUV (88.9 FM; VISALIA, CA; Owner: COMMUNITY EDUCATIONAL B/CASTNG, INC.)
KJUG-FM (106.7 FM; TULARE, CA; Owner: WESTCOAST BROADCASTING, INC.)
K220EY (91.9 FM; PORTERVILLE, CA; Owner: FAMILY STATIONS, INC.)
KUFW (90.5 FM; WOODLAKE, CA; Owner: NATIONAL FARM WORKERS SERVICE CENTER)
KMAK (100.3 FM; ORANGE COVE, CA; Owner: RICHARD B. SMITH)
K217EQ (91.3 FM; COALINGA, CA; Owner: CALVARY CHAPEL OF TWIN FALLS, INC.)
K266AH (101.1 FM; BENA, CA; Owner: CALVARY CHAPEL OF TWIN FALLS, INC.)
KTQX (90.1 FM; BAKERSFIELD, CA; Owner: RADIO BILINGUE, INC.)
K203CM (88.5 FM; SANGER, CA; Owner: EDUCATIONAL MEDIA FOUNDATION)
K203AQ (88.5 FM; HELM, ETC., CA; Owner: FAMILY STATIONS, INC.)
KCRZ (104.9 FM; TIPTON, CA; Owner: WESTCOAST BROADCASTING, INC.)
KGZO (90.9 FM; SHAFTER, CA; Owner: THE ASSOCIATION FOR COMMUNITY EDUCATION, INC.)
KDKL (88.3 FM; COALINGA, CA; Owner: EDUCATIONAL MEDIA FOUNDATION)
KMGV (97.9 FM; FRESNO, CA; Owner: INFINITY RADIO OPERATIONS INC.)
KWYE (101.1 FM; FRESNO, CA; Owner: INFINITY RADIO OPERATIONS INC.)
KIOO (99.7 FM; PORTERVILLE, CA; Owner: BUCKLEY B/CSTNG CORP OF SAN JOA VAL)
National Bridge Inventory (NBI) Statistics 20 Number of bridges171ft / 52.5m Total length $480,000 Total costs30,606 Total average daily traffic4,502 Total average daily truck traffic41,925 Total future (year 2037) average daily traffic
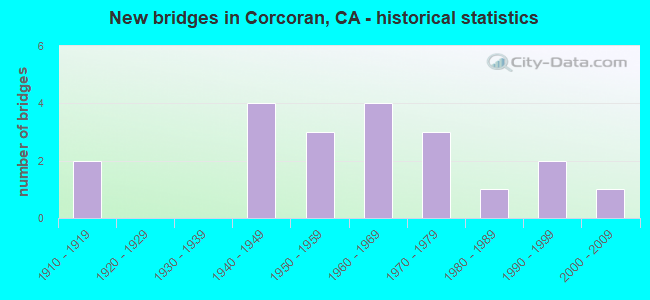
New bridges - historical statistics
2 1910-1919 4 1940-1949 3 1950-1959 4 1960-1969 3 1970-1979 1 1980-1989 2 1990-1999 1 2000-2009
See full National Bridge Inventory statistics for Corcoran, CA
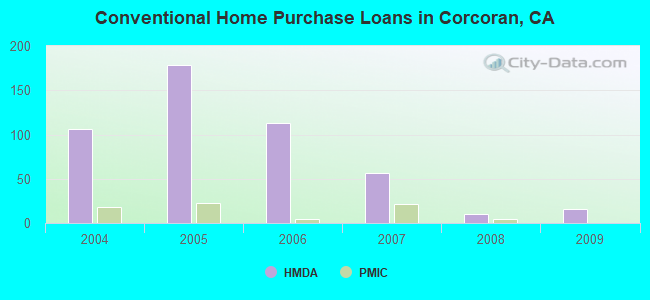
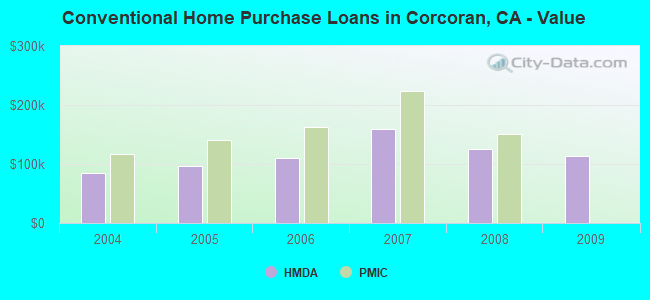
Home Mortgage Disclosure Act Aggregated Statistics For Year 2009(Based on 4 partial tracts) A) FHA, FSA/RHS & VA B) Conventional C) Refinancings D) Home Improvement Loans E) Loans on Dwellings For 5+ Families F) Non-occupant Loans on G) Loans On Manufactured Number Average Value Number Average Value Number Average Value Number Average Value Number Average Value Number Average Value Number Average Value
LOANS ORIGINATED 42 $142,830 16 $113,662 41 $134,776 6 $63,372 0 $0 6 $92,528 0 $0 APPLICATIONS APPROVED, NOT ACCEPTED 7 $139,307 1 $66,220 6 $113,783 1 $91,490 0 $0 2 $77,505 0 $0 APPLICATIONS DENIED 14 $111,348 5 $98,636 50 $125,968 10 $40,943 1 $168,080 4 $99,838 0 $0 APPLICATIONS WITHDRAWN 11 $147,677 8 $86,576 16 $130,838 0 $0 0 $0 0 $0 1 $40,150 FILES CLOSED FOR INCOMPLETENESS 0 $0 4 $90,952 6 $128,885 2 $86,340 0 $0 1 $106,000 0 $0
Aggregated Statistics For Year 2008(Based on 4 partial tracts) A) FHA, FSA/RHS & VA B) Conventional C) Refinancings D) Home Improvement Loans F) Non-occupant Loans on G) Loans On Manufactured Number Average Value Number Average Value Number Average Value Number Average Value Number Average Value Number Average Value
LOANS ORIGINATED 26 $153,651 10 $125,379 63 $122,282 16 $65,636 16 $111,824 1 $86,740 APPLICATIONS APPROVED, NOT ACCEPTED 2 $101,650 3 $131,730 24 $148,570 8 $65,618 4 $114,660 0 $0 APPLICATIONS DENIED 6 $154,398 8 $169,291 126 $121,688 22 $85,977 12 $110,196 0 $0 APPLICATIONS WITHDRAWN 6 $151,135 7 $151,544 30 $149,620 1 $127,070 3 $135,490 1 $201,700 FILES CLOSED FOR INCOMPLETENESS 1 $130,730 4 $122,375 13 $189,134 2 $90,215 2 $82,270 0 $0
Aggregated Statistics For Year 2007(Based on 4 partial tracts) A) FHA, FSA/RHS & VA B) Conventional C) Refinancings D) Home Improvement Loans F) Non-occupant Loans on G) Loans On Manufactured Number Average Value Number Average Value Number Average Value Number Average Value Number Average Value Number Average Value
LOANS ORIGINATED 15 $124,528 56 $159,886 181 $131,266 39 $80,844 46 $119,670 1 $121,980 APPLICATIONS APPROVED, NOT ACCEPTED 5 $144,550 9 $158,457 59 $129,479 11 $67,149 16 $131,731 0 $0 APPLICATIONS DENIED 2 $167,580 43 $174,801 186 $141,439 38 $92,219 37 $133,274 4 $130,732 APPLICATIONS WITHDRAWN 3 $220,320 29 $197,772 108 $139,369 10 $96,148 17 $112,278 0 $0 FILES CLOSED FOR INCOMPLETENESS 2 $106,065 4 $144,165 12 $126,295 1 $140,870 1 $113,510 0 $0
Aggregated Statistics For Year 2006(Based on 4 partial tracts) A) FHA, FSA/RHS & VA B) Conventional C) Refinancings D) Home Improvement Loans F) Non-occupant Loans on G) Loans On Manufactured Number Average Value Number Average Value Number Average Value Number Average Value Number Average Value Number Average Value
LOANS ORIGINATED 8 $125,154 113 $109,521 262 $123,311 41 $72,284 73 $106,952 3 $91,773 APPLICATIONS APPROVED, NOT ACCEPTED 3 $81,540 22 $101,108 62 $128,862 6 $76,495 20 $116,396 1 $150,470 APPLICATIONS DENIED 0 $0 57 $120,929 185 $148,983 58 $81,169 24 $173,291 3 $53,850 APPLICATIONS WITHDRAWN 4 $114,070 38 $102,929 168 $127,765 13 $108,607 15 $118,304 4 $121,888 FILES CLOSED FOR INCOMPLETENESS 0 $0 5 $88,836 36 $127,113 1 $173,360 6 $124,090 0 $0
Aggregated Statistics For Year 2005(Based on 4 partial tracts) A) FHA, FSA/RHS & VA B) Conventional C) Refinancings D) Home Improvement Loans F) Non-occupant Loans on G) Loans On Manufactured Number Average Value Number Average Value Number Average Value Number Average Value Number Average Value Number Average Value
LOANS ORIGINATED 9 $110,158 178 $96,836 287 $112,463 39 $70,532 93 $100,596 1 $95,550 APPLICATIONS APPROVED, NOT ACCEPTED 1 $46,690 34 $92,450 67 $100,222 7 $71,154 16 $85,061 1 $78,780 APPLICATIONS DENIED 1 $81,700 50 $87,048 218 $101,528 39 $50,660 37 $93,258 3 $50,147 APPLICATIONS WITHDRAWN 4 $108,555 42 $107,851 177 $107,264 30 $100,198 20 $112,258 3 $103,307 FILES CLOSED FOR INCOMPLETENESS 0 $0 8 $75,824 27 $109,540 3 $138,700 3 $90,693 0 $0
Aggregated Statistics For Year 2004(Based on 4 partial tracts) A) FHA, FSA/RHS & VA B) Conventional C) Refinancings D) Home Improvement Loans F) Non-occupant Loans on G) Loans On Manufactured Number Average Value Number Average Value Number Average Value Number Average Value Number Average Value Number Average Value
LOANS ORIGINATED 44 $91,584 106 $84,487 155 $80,362 24 $41,649 49 $80,395 1 $140,620 APPLICATIONS APPROVED, NOT ACCEPTED 1 $116,720 25 $92,296 52 $93,507 7 $94,234 8 $86,919 2 $144,740 APPLICATIONS DENIED 4 $115,875 48 $85,259 225 $87,320 36 $45,956 26 $94,835 0 $0 APPLICATIONS WITHDRAWN 4 $76,595 26 $90,161 125 $89,661 6 $52,268 20 $85,252 1 $67,230 FILES CLOSED FOR INCOMPLETENESS 0 $0 4 $92,988 24 $111,124 3 $36,417 6 $68,140 0 $0
Detailed HMDA statistics for the following Tracts:
0013.00
, 0014.00 , 0015.00 , 0016.02
Private Mortgage Insurance Companies Aggregated Statistics For Year 2009(Based on 3 partial tracts) A) Conventional B) Refinancings Number Average Value Number Average Value
LOANS ORIGINATED 0 $0 1 $353,240 APPLICATIONS APPROVED, NOT ACCEPTED 1 $73,770 1 $98,890 APPLICATIONS DENIED 0 $0 0 $0 APPLICATIONS WITHDRAWN 0 $0 0 $0 FILES CLOSED FOR INCOMPLETENESS 0 $0 0 $0
Aggregated Statistics For Year 2008(Based on 3 partial tracts) A) Conventional B) Refinancings C) Non-occupant Loans on Number Average Value Number Average Value Number Average Value
LOANS ORIGINATED 5 $150,924 7 $175,191 2 $81,260 APPLICATIONS APPROVED, NOT ACCEPTED 0 $0 7 $179,636 0 $0 APPLICATIONS DENIED 1 $102,720 0 $0 0 $0 APPLICATIONS WITHDRAWN 1 $98,980 1 $110,190 2 $104,585 FILES CLOSED FOR INCOMPLETENESS 1 $69,460 0 $0 1 $69,460
Aggregated Statistics For Year 2007(Based on 3 partial tracts) A) Conventional B) Refinancings C) Non-occupant Loans on Number Average Value Number Average Value Number Average Value
LOANS ORIGINATED 21 $222,972 17 $195,932 2 $95,830 APPLICATIONS APPROVED, NOT ACCEPTED 5 $199,970 4 $193,455 0 $0 APPLICATIONS DENIED 0 $0 0 $0 0 $0 APPLICATIONS WITHDRAWN 1 $172,750 2 $157,505 1 $170,270 FILES CLOSED FOR INCOMPLETENESS 0 $0 0 $0 0 $0
Aggregated Statistics For Year 2006(Based on 3 partial tracts) A) Conventional B) Refinancings Number Average Value Number Average Value
LOANS ORIGINATED 5 $162,560 5 $147,108 APPLICATIONS APPROVED, NOT ACCEPTED 3 $179,680 2 $134,465 APPLICATIONS DENIED 0 $0 0 $0 APPLICATIONS WITHDRAWN 1 $148,470 0 $0 FILES CLOSED FOR INCOMPLETENESS 0 $0 0 $0
Aggregated Statistics For Year 2005(Based on 3 partial tracts) A) Conventional B) Refinancings C) Non-occupant Loans on Number Average Value Number Average Value Number Average Value
LOANS ORIGINATED 23 $140,647 13 $142,010 6 $118,877 APPLICATIONS APPROVED, NOT ACCEPTED 4 $105,758 0 $0 4 $105,758 APPLICATIONS DENIED 0 $0 0 $0 0 $0 APPLICATIONS WITHDRAWN 1 $70,110 2 $140,170 1 $69,460 FILES CLOSED FOR INCOMPLETENESS 0 $0 0 $0 0 $0
Aggregated Statistics For Year 2004(Based on 4 partial tracts) A) Conventional B) Refinancings C) Non-occupant Loans on D) Loans On Manufactured Number Average Value Number Average Value Number Average Value Number Average Value
LOANS ORIGINATED 18 $116,417 10 $95,126 4 $65,030 1 $140,620 APPLICATIONS APPROVED, NOT ACCEPTED 3 $90,580 11 $140,818 1 $70,030 0 $0 APPLICATIONS DENIED 3 $103,550 0 $0 0 $0 0 $0 APPLICATIONS WITHDRAWN 2 $47,155 2 $74,300 2 $52,015 0 $0 FILES CLOSED FOR INCOMPLETENESS 0 $0 0 $0 0 $0 0 $0
Detailed PMIC statistics for the following Tracts:
0013.00
, 0014.00 , 0015.00 , 0016.02
Most common first names in Corcoran, CA among deceased individuals Name Count Lived (average)
John 47 76.4 years Mary 43 72.0 years Robert 35 66.3 years William 35 72.0 years James 31 66.4 years Frank 24 76.2 years Charles 22 66.8 years Jose 21 69.1 years Maria 21 75.8 years Henry 18 67.8 years
Most common last names in Corcoran, CA among deceased individuals Last name Count Lived (average)
Garcia 28 71.1 years Gomez 28 68.9 years Hernandez 27 73.1 years Martinez 27 67.9 years Williams 24 70.5 years Rodriguez 24 72.9 years Jones 22 75.0 years Chavez 18 74.4 years Johnson 18 68.4 years Thomas 17 72.2 years
Corcoran compared to California state average:
Median household income below state average. Median house value significantly below state average. Black race population percentage significantly above state average. Hispanic race population percentage significantly above state average. Length of stay since moving in significantly above state average. Institutionalized population percentage significantly above state average. Percentage of population with a bachelor's degree or higher significantly below state average.
#38 on the list of "Top 101 cities with largest percentage of males in occupations: farming, fishing, and forestry occupations (population 5,000+)"
#42 on the list of "Top 101 cities with the least people having Master's or Doctorate degrees (population 5,000+)"
#45 on the list of "Top 101 cities with largest percentage of males in industries: agriculture, forestry, fishing and hunting (population 5,000+)"
#53 on the list of "Top 101 cities with the lowest number of police officers per 1000 residents (population 5,000+)"
#53 on the list of "Top 101 cities with largest percentage of females in industries: utilities (population 5,000+)"
#60 on the list of "Top 101 cities with the largest percentage of people in state prisons (population 1,000+)"
#64 on the list of "Top 100 cities with the largest percentage of males"
#65 on the list of "Top 101 cities with largest percentage of females in industries: agriculture, forestry, fishing and hunting (population 5,000+)"
#66 on the list of "Top 101 cities with largest percentage of females in occupations: farming, fishing, and forestry occupations (population 5,000+)"
#68 on the list of "Top 101 cities with the largest positive percentage difference between never married males and females (15+ years) (with at least 1,000 males never married)"
#97 on the list of "Top 101 cities with the largest percentage of unmarried partner households (population 5,000+)"
#4 on the list of "Top 101 counties with the highest Particulate Matter (PM10 ) Annual air pollution readings in 2012 (µg/m3 )"
#4 on the list of "Top 101 counties with the highest Particulate Matter (PM2.5 ) Annual air pollution readings in 2012 (µg/m3 )"
#25 on the list of "Top 101 counties with the highest Nitrogen Dioxide air pollution readings in 2012 (ppm)"
#25 on the list of "Top 101 counties with the highest percentage of residents relocating from foreign countries between 2010 and 2011 (pop. 50,000+)"
#28 on the list of "Top 101 counties with the highest percentage of residents relocating to foreign countries in 2011 (pop. 50,000+)"
Top Patent Applicants
John William Pellow (2)
David L. Lark (1)
Olga Salazar (1)
Jose Salazar (1)
Harold W. Cole (1)
Total of 5 patent applications in 2008-2024.


 Recent articles from our blog. Our writers, many of them Ph.D. graduates or candidates, create easy-to-read articles on a wide variety of topics.

 (21.3 miles
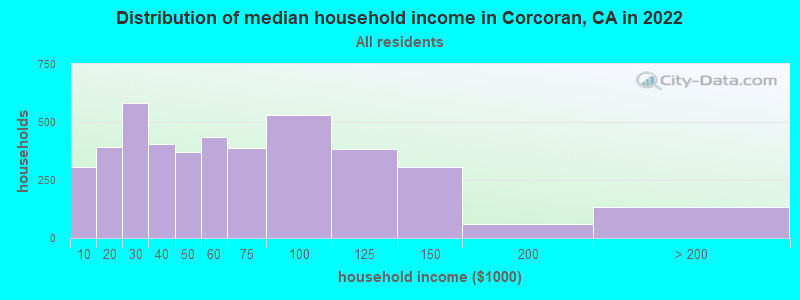

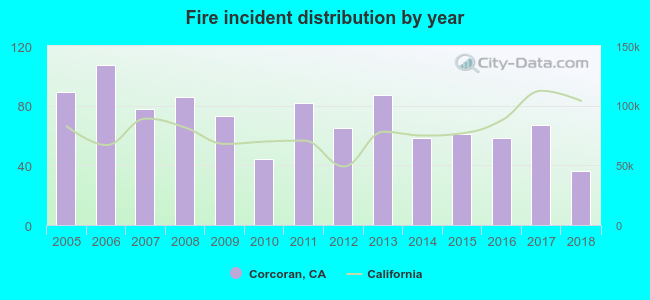 According to the data from the years 2005 - 2018 the average number of fires per year is 71. The highest number of reported fires - 107 took place in 2006, and the least - 36 in 2018. The data has a declining trend.
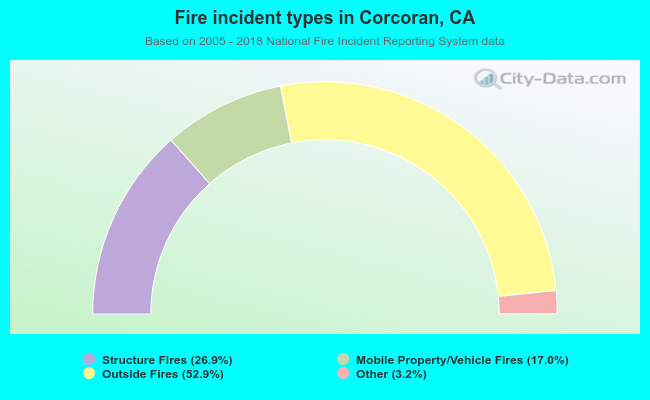 When looking into fire subcategories, the most reports belonged to: Outside Fires (52.9%), and Structure Fires (26.9%).