Estimated zip code population in 2022: 23,196 Zip code population in 2010: 26,079 Zip code population in 2000: 23,495
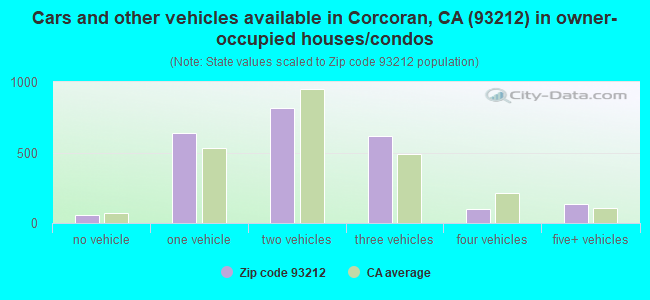
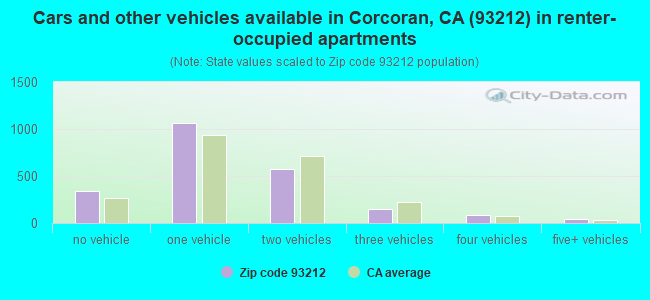
Houses and condos: 4,917 Renter-occupied apartments: 2,249
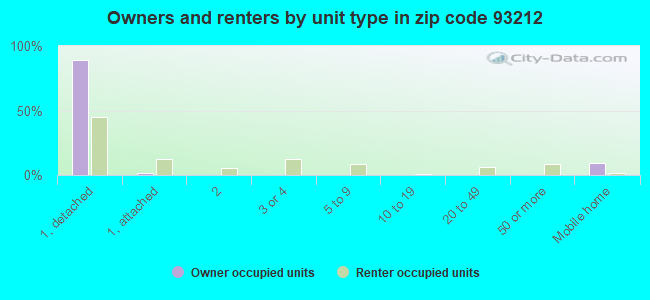
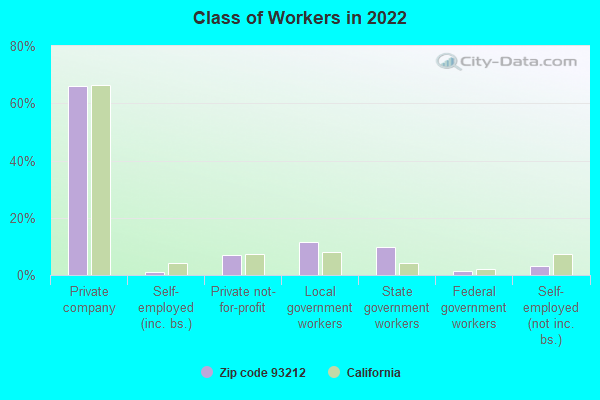
% of renters here:
49%
State:
44%
March 2022 cost of living index in zip code 93212: 87.6 (less than average, U.S. average is 100)
Land area: 106.1 sq. mi. Water area: 0.0 sq. mi.
Population density: 219 people per square mile
(very low).
OSM Map
General Map
Google Map
MSN Map
OSM Map
General Map
Google Map
MSN Map
OSM Map
General Map
Google Map
MSN Map
OSM Map
General Map
Google Map
MSN Map
Please wait while loading the map...
Real estate property taxes paid for housing units in 2022:
This zip code:
0.7% ($1,545)
California:
0.7% ($4,831)
Median real estate property taxes paid for housing units with mortgages in 2022: $1,777 (0.7%) Median real estate property taxes paid for housing units with no mortgage in 2022: $955 (0.5%)
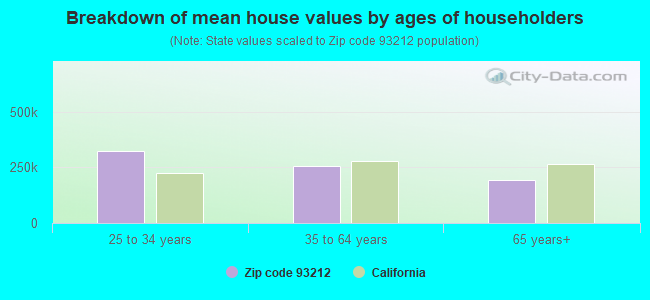
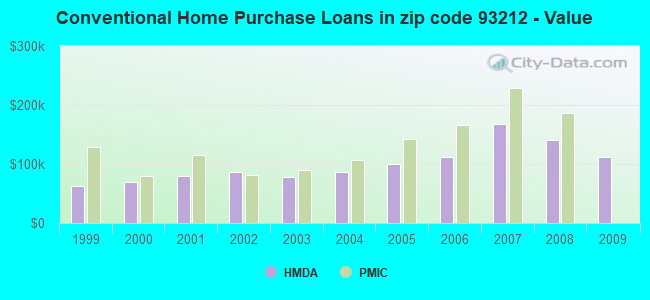
Estimated median house/condo value in 2022: $227,811
93212:
$227,811
California:
$715,900
According to our research of California and other state lists, there were 36 registered sex offenders living in 93212 zip code as of April 27, 2024. The ratio of all residents to sex offenders in zip code 93212 is 700 to 1. The ratio of registered sex offenders to all residents in this zip code is near the state average.
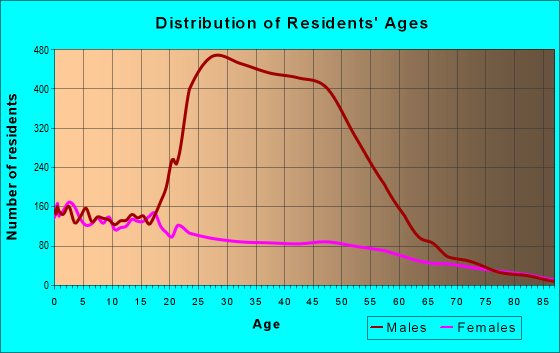
Median resident age:
This zip code:
34.3 years
California median age:
37.9 years
Average household size:
This zip code:
3.4 people
California:
2.8 people
Averages for the 2020 tax year for zip code 93212, filed in 2021:
Average Adjusted Gross Income (AGI) in 2020: $39,168 (Individual Income Tax Returns)
Here:
$39,168
State:
$95,910
Salary/wage: $36,372 (reported on 74.3% of returns)
Here:
$36,372
State:
$77,331
(% of AGI for various income ranges: 1324.6% for AGIs below $25k, 4564.7% for AGIs $25k-50k, 8010.0% for AGIs $50k-75k, 11492.1% for AGIs $75k-100k, 21424.6% for AGIs $100k-200k)
Taxable interest for individuals: $644 (reported on 28.0% of returns)
This zip code:
$644
California:
$2,294
(% of AGI for various income ranges: 3.0% for AGIs below $25k, 4.5% for AGIs $25k-50k, 5.3% for AGIs $50k-75k, 10.0% for AGIs $75k-100k, 107.7% for AGIs $100k-200k)
Ordinary dividends: $29,980 (reported on 2.2% of returns)
Here:
$29,980
State:
$10,949
(% of AGI for various income ranges: 0.3% for AGIs below $25k, 0.8% for AGIs $25k-50k, 6.0% for AGIs $50k-75k, 37.7% for AGIs $100k-200k)
Net capital gain/loss in AGI: +$19,247 (reported on 2.8% of returns)
Here:
+$19,247
State:
+$49,306
(% of AGI for various income ranges: 1.2% for AGIs $25k-50k, 27.1% for AGIs $50k-75k, 41.2% for AGIs $75k-100k, 945.4% for AGIs $100k-200k)
Profit/loss from business: +$8,308 (reported on 7.2% of returns)
Here:
+$8,308
State:
+$15,671
(% of AGI for various income ranges: 90.6% for AGIs below $25k, 89.8% for AGIs $25k-50k, 178.4% for AGIs $50k-75k, 87.1% for AGIs $75k-100k, 302.3% for AGIs $100k-200k)
Taxable individual retirement arrangement distribution: $17,638 (reported on 2.3% of returns)
93212:
$17,638
California:
$23,505
(% of AGI for various income ranges: 21.7% for AGIs below $25k, 41.0% for AGIs $25k-50k, 98.5% for AGIs $50k-75k, 196.7% for AGIs $75k-100k, 717.7% for AGIs $100k-200k)
Total itemized deductions: $31,059 (reported on 4.2% of returns)
Here:
$31,059
State:
$39,517
(% of AGI for various income ranges: 130.2% for AGIs $25k-50k, 414.5% for AGIs $50k-75k, 525.4% for AGIs $75k-100k, 1719.2% for AGIs $100k-200k)
Charity contributions: $8,706 (reported on 2.5% of returns)
Here:
$8,706
State:
$12,598
(% of AGI for various income ranges: 10.9% for AGIs $25k-50k, 38.0% for AGIs $50k-75k, 92.5% for AGIs $75k-100k, 496.2% for AGIs $100k-200k)
Taxes paid: $6,900 (reported on 4.2% of returns)
93212:
$6,900
State:
$8,807
(% of AGI for various income ranges: 21.4% for AGIs $25k-50k, 102.0% for AGIs $50k-75k, 146.7% for AGIs $75k-100k, 429.2% for AGIs $100k-200k)
Earned income credit: $2,563 (reported on 23.8% of returns)
Here:
$2,563
State:
$2,074
(% of AGI for various income ranges: 162.8% for AGIs below $25k, 128.4% for AGIs $25k-50k, 4.0% for AGIs $50k-75k)
Percentage of individuals using paid preparers for their 2020 taxes: 75.5%
Here:
76%
State:
92%
(% for various income ranges: 60.5% for AGIs below $25k, 88.4% for AGIs $25k-50k, 88.6% for AGIs $50k-75k, 92.5% for AGIs $75k-100k, 89.7% for AGIs $100k-200k, 100.0% for AGIs over 200k)
Averages for the 2012 tax year for zip code 93212, filed in 2013:
Average Adjusted Gross Income (AGI) in 2012: $40,256 (Individual Income Tax Returns)
Here:
$40,256
State:
$72,726
Salary/wage: $30,948 (reported on 91.8% of returns)
Here:
$30,948
State:
$59,079
(% of AGI for various income ranges: 78.8% for AGIs below $25k, 89.2% for AGIs $25k-50k, 86.7% for AGIs $50k-75k, 83.1% for AGIs $75k-100k, 81.1% for AGIs $100k-200k, 12.6% for AGIs over 200k)
Taxable interest for individuals: $1,705 (reported on 14.7% of returns)
This zip code:
$1,705
California:
$2,146
(% of AGI for various income ranges: 0.2% for AGIs below $25k, 0.1% for AGIs $25k-50k, 0.1% for AGIs $50k-75k, 2.6% for AGIs over 200k)
Ordinary dividends: $4,925 (reported on 3.2% of returns)
Here:
$4,925
State:
$9,308
(% of AGI for various income ranges: 0.3% for AGIs below $25k, 0.3% for AGIs $50k-75k, 0.3% for AGIs $100k-200k, 1.3% for AGIs over 200k)
Net capital gain/loss in AGI: +$9,506 (reported on 3.2% of returns)
Here:
+$9,506
State:
+$30,460
(% of AGI for various income ranges: 3.9% for AGIs over 200k)
Profit/loss from business: +$7,226 (reported on 7.6% of returns)
Here:
+$7,226
State:
+$17,064
(% of AGI for various income ranges: 5.6% for AGIs below $25k, 0.8% for AGIs $25k-50k, 1.4% for AGIs $50k-75k, 0.2% for AGIs $75k-100k)
Taxable individual retirement arrangement distribution: $14,265 (reported on 3.4% of returns)
93212:
$14,265
California:
$19,557
(% of AGI for various income ranges: 1.1% for AGIs below $25k, 0.7% for AGIs $25k-50k, 2.5% for AGIs $50k-75k, 4.0% for AGIs $100k-200k)
Total itemized deductions: $24,120 (23% of AGI, reported on 18.7% of returns)
Here:
$24,120
State:
$34,004
Here:
23.3% of AGI
State:
22.7% of AGI
(% of AGI for various income ranges: 3.4% for AGIs below $25k, 6.9% for AGIs $25k-50k, 14.1% for AGIs $50k-75k, 19.3% for AGIs $75k-100k, 18.7% for AGIs $100k-200k, 14.3% for AGIs over 200k)
Charity contributions: $2,905 (reported on 15.9% of returns)
Here:
$2,905
State:
$4,659
(% of AGI for various income ranges: 0.3% for AGIs below $25k, 0.7% for AGIs $25k-50k, 1.5% for AGIs $50k-75k, 2.5% for AGIs $75k-100k, 2.3% for AGIs $100k-200k, 1.0% for AGIs over 200k)
Taxes paid: $9,165 (reported on 18.5% of returns)
93212:
$9,165
State:
$14,448
(% of AGI for various income ranges: 0.5% for AGIs below $25k, 1.2% for AGIs $25k-50k, 3.0% for AGIs $50k-75k, 5.1% for AGIs $75k-100k, 6.3% for AGIs $100k-200k, 11.2% for AGIs over 200k)
Earned income credit: $2,633 (reported on 36.7% of returns)
Here:
$2,633
State:
$2,286
(% of AGI for various income ranges: 10.6% for AGIs below $25k, 2.3% for AGIs $25k-50k)
Percentage of individuals using paid preparers for their 2012 taxes: 65.9%
Here:
66%
State:
64%
(% for various income ranges: 62.0% for AGIs below $25k, 68.8% for AGIs $25k-50k, 67.3% for AGIs $50k-75k, 73.7% for AGIs $75k-100k, 68.8% for AGIs $100k-200k, 100.0% for AGIs over 200k)
Averages for the 2004 tax year for zip code 93212, filed in 2005:
Average Adjusted Gross Income (AGI) in 2004: $35,061 (Individual Income Tax Returns)
Here:
$35,061
State:
$58,600
Salary/wage: $27,101 (reported on 92.3% of returns)
Here:
$27,101
State:
$49,455
(% of AGI for various income ranges: 99.1% for AGIs below $10k, 85.0% for AGIs $10k-25k, 89.4% for AGIs $25k-50k, 84.8% for AGIs $50k-75k, 84.3% for AGIs $75k-100k, 28.4% for AGIs over 100k)
Taxable interest for individuals: $1,936 (reported on 19.6% of returns)
This zip code:
$1,936
California:
$2,365
(% of AGI for various income ranges: 0.7% for AGIs below $10k, 0.4% for AGIs $10k-25k, 0.3% for AGIs $25k-50k, 0.9% for AGIs $50k-75k, 0.4% for AGIs $75k-100k, 2.8% for AGIs over 100k)
Taxable dividends: $3,510 (reported on 4.8% of returns)
Here:
$3,510
State:
$4,746
(% of AGI for various income ranges: 0.1% for AGIs below $10k, 0.3% for AGIs $10k-25k, 0.1% for AGIs $25k-50k, 0.2% for AGIs $50k-75k, 0.3% for AGIs $75k-100k, 1.3% for AGIs over 100k)
Net capital gain/loss: +$83,116 (reported on 5.1% of returns)
Here:
+$83,116
State:
+$23,418
(% of AGI for various income ranges: 2.0% for AGIs below $10k, 0.1% for AGIs $10k-25k, 0.0% for AGIs $25k-50k, 1.4% for AGIs $50k-75k, 3.3% for AGIs $75k-100k, 42.9% for AGIs over 100k)
Profit/loss from business: +$5,484 (reported on 7.5% of returns)
Here:
+$5,484
State:
+$16,826
(% of AGI for various income ranges: 3.3% for AGIs below $10k, 2.7% for AGIs $10k-25k, 1.3% for AGIs $25k-50k, 0.8% for AGIs $50k-75k, 0.0% for AGIs $75k-100k, 0.5% for AGIs over 100k)
Profit/loss from farming: +$25,348 (reported on 0.5% of returns)
Here:
+$25,348
State:
-$7,562
IRA payment deduction: $2,667 (reported on 0.5% of returns)
93212:
$2,667
California:
$3,192
Self-employed pension: $12,909 (reported on 0.3% of returns)
Here:
$12,909
California:
$17,688
Total itemized deductions: $18,949 (20% of AGI, reported on 17.3% of returns)
Here:
$18,949
State:
$28,113
Here:
19.6% of AGI
State:
25.3% of AGI
(% of AGI for various income ranges: 2.2% for AGIs below $10k, 2.4% for AGIs $10k-25k, 7.7% for AGIs $25k-50k, 13.0% for AGIs $50k-75k, 15.8% for AGIs $75k-100k, 11.9% for AGIs over 100k)
Charity contributions deductions: $3,062 (3% of AGI, reported on 15.2% of returns)
Here:
$3,062
State:
$3,923
Here:
3.0% of AGI
State:
3.3% of AGI
(% of AGI for various income ranges: 0.3% for AGIs $10k-25k, 0.9% for AGIs $25k-50k, 2.3% for AGIs $50k-75k, 2.6% for AGIs $75k-100k, 1.6% for AGIs over 100k)
Total tax: $5,460 (reported on 53.3% of returns)
93212:
$5,460
State:
$10,761
(% of AGI for various income ranges: 1.6% for AGIs below $10k, 2.3% for AGIs $10k-25k, 3.9% for AGIs $25k-50k, 7.2% for AGIs $50k-75k, 9.5% for AGIs $75k-100k, 17.7% for AGIs over 100k)
Earned income credit: $1,956 (reported on 38.5% of returns)
Here:
$1,956
State:
$1,763
Percentage of individuals using paid preparers for their 2004 taxes: 71.6%
Here:
72%
State:
66%
(% for various income ranges: 62.4% for AGIs below $10k, 72.0% for AGIs $10k-25k, 74.6% for AGIs $25k-50k, 76.4% for AGIs $50k-75k, 77.7% for AGIs $75k-100k, 80.5% for AGIs over 100k)
Household received Food Stamps/SNAP in the past 12 months: 1,714 Household did not receive Food Stamps/SNAP in the past 12 months: 3,145
Women who had a birth in the past 12 months: 251 (73 now married, 180 unmarried) Women who did not have a birth in the past 12 months: 3,455 (1,279 now married, 2,180 unmarried)
Housing units in zip code 93212 with a mortgage: 1,556 (80 second mortgage, 54 both second mortgage and home equity loan) Median monthly owner costs for units with a mortgage: $1,302 Median monthly owner costs for units without a mortgage: $501
Residents with income below the poverty level in 2022:
This zip code:
27.7%
Whole state:
12.2%
Residents with income below 50% of the poverty level in 2022:
This zip code:
14.8%
Whole state:
6.2%
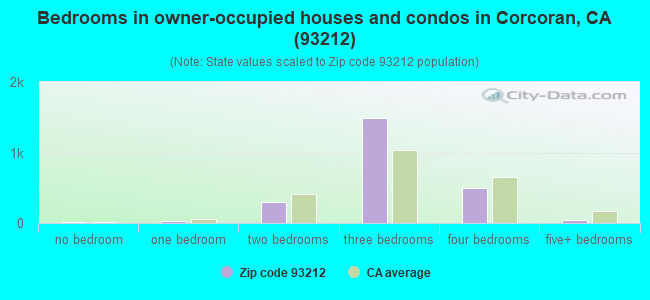
Median number of rooms in houses and condos:
Here:
5.4
State:
6.0
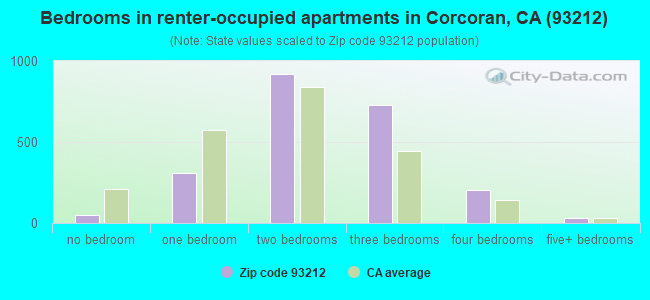
Median number of rooms in apartments:
Here:
4.4
State:
3.9
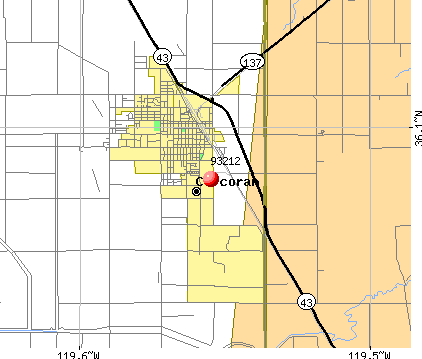
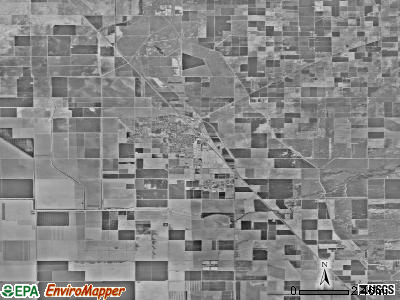
Notable locations in this zip code not listed on our city pages
Notable locations in zip code 93212: Riley Camp (A), Angiola Dairy (B), Artesia Dairy (C), Holstein Farms Dairy (D), Salyer Farms Camp One (E), Corcoran Prison Dairy (F), Crockett and Gambogy Labor Camp (G), Wheat Camp (H), Corcoran High School Agricultural Farm (I), Boswell Camp One (J), Corcoran Substation (K), Veterans Memorial Hall (L), Kate H Boswell Seniors Center (M), Corcoran Unified School District Office (N), Corcoran State Prison (O), Corcoran Family YMCA (P), Corcoran City Hall (Q), Corcoran Branch Kings County Library (R), American Ambulance (S), Corcoran State Prison Fire Department (T). Display/hide their locations on the map
Churches in zip code 93212 include: Church of Christ (A), Church of the Nazarene (B), Episcopal Church of the Epiphany (C), First Baptist Church (D), First Missionary Baptist Church (E), First Presbyterian Church (F), First United Methodist Church (G), First United Presbyterian Church (H), Kingdom Hall of Jehovahs Witnesses (I). Display/hide their locations on the map
Parks in zip code 93212 include: Burnham Smith Park (1), Corcoran City Swimming Pool (2), Father Wyatt Park (3), John Maroot Park (4). Display/hide their locations on the map
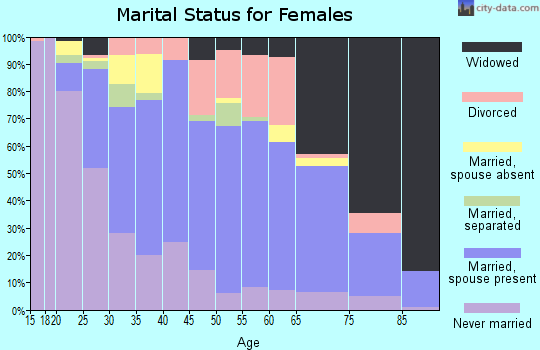
1,867 married couples with children.
2,198 single-parent households (174 men, 2,024 women).
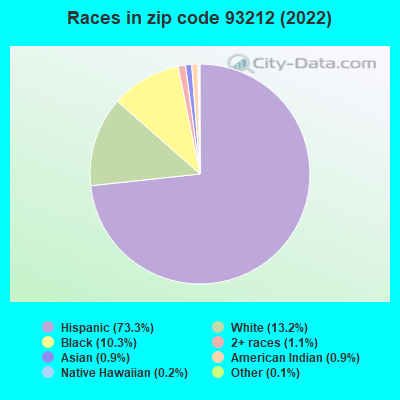
48.9% of residents of 93212 zip code speak English at home.
49.1% of residents speak Spanish at home (44% very well, 29% well, 15% not well, 12% not at all).
0.9% of residents speak other Indo-European language at home (72% very well, 7% well, 21% not well).
0.9% of residents speak Asian or Pacific Island language at home (79% very well, 15% well, 7% not well).
0.3% of residents speak other language at home (100% very well).
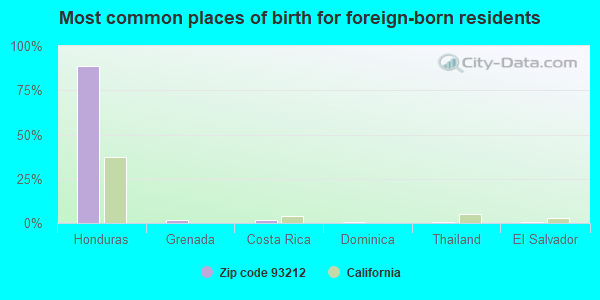
Foreign born population: 4,805 (20.7%) (30.2% of them are naturalized citizens)
This zip code:
20.7%
Whole state:
26.7%
89%Honduras
2%Grenada
2%Costa Rica
1%Dominica
1%Thailand
1%El Salvador
1%Ethiopia
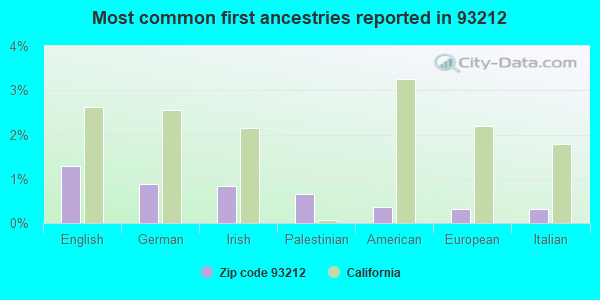
1%English
1%German
1%Irish
1%Palestinian
0%American
0%European
0%Italian
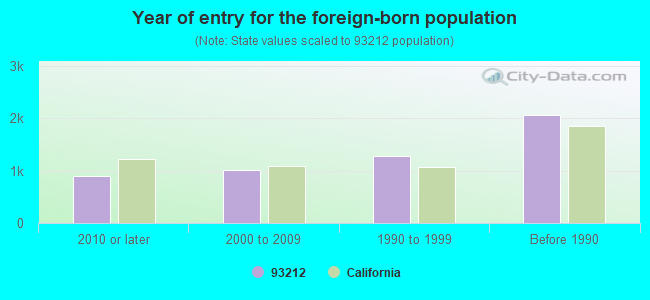
Year of entry for the foreign-born population
8882010 or later
1,0182000 to 2009
1,2711990 to 1999
2,059Before 1990
Major facilities with environmental interests located in this zip code:
J G BOSWELL COMPANY OIL MILL (710 BAINUM AVENUE in CORCORAN, CA)
AIR MAJOR (AIRS/AFS) AIR SYNTHETIC MINOR (AIRS/AFS) STATE MASTER (California - Hazardous Waste Tracking) - HAZARDOU WASTE PROGRAM CRITERIA AND HAZARDOUS AIR POLLUTANT INVENTORY (Inventory of air pollution sources) AIR MAJOR ("Best Available" air pollution technologies tracking) Small Quantity Generators, between 100 kg and 1000 kg of hazardous waste/month (Resource Conservation and Recovery Act (tracking hazardous waste)) - notification TRI REPORTER (Tracking of toxic chemicals releasing facilities) - ICIS-, ENFORCEMENT/COMPLIANCE ACTIVITY Business SIC classification: CRUDE PETROLEUM AND NATURAL GAS; FLOUR AND OTHER GRAIN MILL PRODUCTS; COTTONSEED OIL MILLS; FOOD PRODUCTS MACHINERY; NONCLASSIFIABLE ESTABLISHMENTS Business NAICS classification: COTTON GINNING. Alternative names: J.G. BOSWELL, J G BOSWELL CO TOWN SITE, J.G. BOSWELL OIL MILL, J.P. OIL COMPANY, INC., J.G. BOSWELL
CA DEPT CORRECTIONS STATE PRISON (4001 KING AVENUE in CORCORAN, CA)
AIR SYNTHETIC MINOR (AIRS/AFS) CRITERIA AND HAZARDOUS AIR POLLUTANT INVENTORY (Inventory of air pollution sources) AIR MAJOR ("Best Available" air pollution technologies tracking) Small Quantity Generators, between 100 kg and 1000 kg of hazardous waste/month (Resource Conservation and Recovery Act (tracking hazardous waste)) - notification Business SIC classification: WOOD OFFICE FURNITURE; GASOLINE SERVICE STATIONS; CORRECTIONAL INSTITUTIONS Business NAICS classification: CORRECTIONAL INSTITUTIONS. Organizations: CALIFORNIA STATE OF (CONTACT/OWNER)
Alternative names: CALIFORNIA DEPT. OF CORRECTIONS, CALIFORNIA DEPT. OF CORRECTIONS - COGENERATION, CA DEPT. OF CORRECTIONS, CORCORAN II FACILITY, CA DEPT. OF CORRECTIONS, CORCORAN II FACILITY, CALIFORNIA STATE PRISON, CORCORAN, CALIFORNIA DEPT. OF CORRECTIONS, CALIFORNIA STATE PRISON, CORCORAN, CSP-CORCORAN, DEPT OF CORRECTIONS CORCORAN
CALARCO INC (2550 5TH AVE in CORCORAN, CA)
STATE MASTER (California - Hazardous Waste Tracking) - HAZARDOU WASTE PROGRAM COMPLIANCE ACTIVITY (Tracking inspections of insecticide, fungicide, and rodenticide, and toxic substances) Small Quantity Generators, between 100 kg and 1000 kg of hazardous waste/month (Resource Conservation and Recovery Act (tracking hazardous waste)) - notification Organizations: L.F. ARCHER (CONTACT/OWNER)
GILKEY ENTERPRISES (2411 W WAITLEY in CORCORAN, CA)
STATE MASTER (California - Hazardous Waste Tracking) - HAZARDOU WASTE PROGRAM Small Quantity Generators, between 100 kg and 1000 kg of hazardous waste/month (Resource Conservation and Recovery Act (tracking hazardous waste)) Alternative names: GILKEY FIVE
LAKELAND DUSTERS AVIATION, INC (7124 WHITLEY in CORCORAN, CA)
STATE MASTER (California - Hazardous Waste Tracking) - HAZARDOU WASTE PROGRAM Small Quantity Generators, between 100 kg and 1000 kg of hazardous waste/month (Resource Conservation and Recovery Act (tracking hazardous waste)) Business NAICS classification: SOIL PREPARATION, PLANTING, AND CULTIVATING.
FREMONT (JOHN C.) ELEMENTARY (1520 PATTERSON AVE. in CORCORAN, CA)
(National Center for Education Statistics) - STATE ID-6010342 Organizations: CORCORAN JOINT UNIFIED (SCHOOL DISTRICT)
JOHN MUIR MIDDLE (707 LETTS ST. in CORCORAN, CA)
(National Center for Education Statistics) - STATE ID-6010359 Organizations: CORCORAN JOINT UNIFIED (SCHOOL DISTRICT)
KINGS LAKE HIGH (CONT.) (1520 PATTERSON AVE. in CORCORAN, CA)
(National Center for Education Statistics) - STATE ID-1632140 Organizations: CORCORAN JOINT UNIFIED (SCHOOL DISTRICT)
MARK TWAIN ELEMENTARY (1520 PATTERSON AVE. in CORCORAN, CA)
(National Center for Education Statistics) - STATE ID-6010367 Organizations: CORCORAN JOINT UNIFIED (SCHOOL DISTRICT)
J.G. BOSWELL COMPANY - DAIRY AVENUE SHOP (28001 SOUTH DAIRY AVENUE in CORCORAN, CA)
HAZARDOUS WASTE BIENNIAL REPORTER (Resource Conservation and Recovery Act (tracking hazardous waste)) Large Quantity Generators, more that 1000 kg of hazardous waste/month (Resource Conservation and Recovery Act (tracking hazardous waste))
JG BOSWELL (OLD CENTRAL VALLEY HIGHWAY in CORCORAN, CA)
AIR SYNTHETIC MINOR (AIRS/AFS) CRITERIA AND HAZARDOUS AIR POLLUTANT INVENTORY (Inventory of air pollution sources) Business SIC classification: COTTON GINNING; FLOUR AND OTHER GRAIN MILL PRODUCTS
JG BOSWELL COMPANY SECTION C (1123 PICKERELL AVE in CORCORAN, CA)
CRITERIA AND HAZARDOUS AIR POLLUTANT INVENTORY (Inventory of air pollution sources) Small Quantity Generators, between 100 kg and 1000 kg of hazardous waste/month (Resource Conservation and Recovery Act (tracking hazardous waste)) Alternative names: BOSWELL J G CO
CDR SYSTEMS CORPORATION (745 N. AVE. in CORCORAN, CA)
AIR MAJOR (AIRS/AFS) CRITERIA AND HAZARDOUS AIR POLLUTANT INVENTORY (Inventory of air pollution sources) TRI REPORTER (Tracking of toxic chemicals releasing facilities) Business SIC classification: PLASTICS PRODUCTS
Housing units lacking complete plumbing facilities: 0.4% Housing units lacking complete kitchen facilities: 3.3%
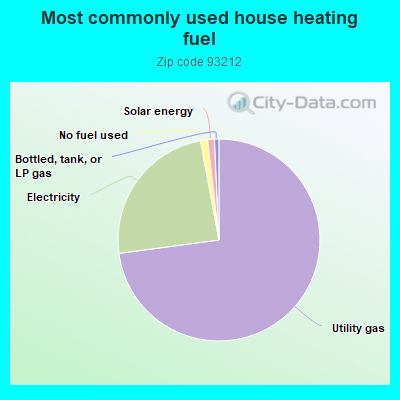
72.6%Utility gas
24.1%Electricity
1.1%No fuel used
1.1%Solar energy
0.7%Bottled, tank, or LP gas
Population in 1990: 16,228. Population change in the 1990s: +7,267 (+44.8%).
Place of birth for U.S.-born residents:
This state: 16,045
Northeast: 169
Midwest: 376
South: 847
West: 506
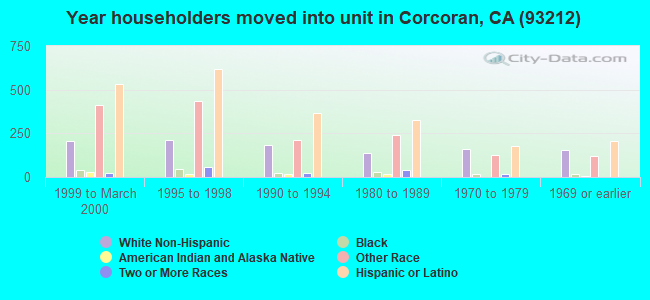
33% of the 93212 zip code residents lived in the same house 5 years ago. Out of people who lived in different houses, 25% lived in this county. Out of people who lived in different counties, 50% lived in California.
80% of the 93212 zip code residents lived in the same house 1 year ago. Out of people who lived in different houses, 22% moved from this county. Out of people who lived in different houses, 75% moved from different county within same state. Out of people who lived in different houses, 1% moved from different state. Out of people who lived in different houses, 0% moved from abroad.
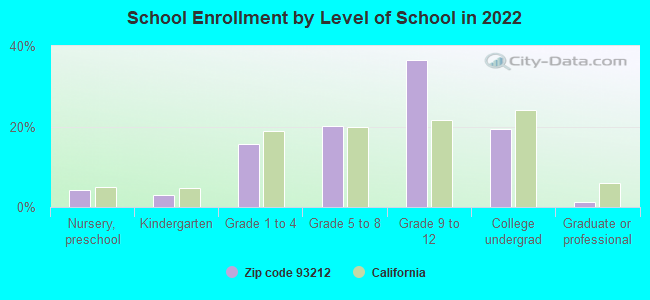
Private vs. public school enrollment:
Students in private schools in grades 1 to 8 (elementary and middle school): 16
Here:
0.7%
California:
10.5%
Students in private schools in grades 9 to 12 (high school): 1,007
Here:
42.3%
California:
8.5%
Students in private undergraduate colleges: 616
Here:
48.2%
California:
15.9%
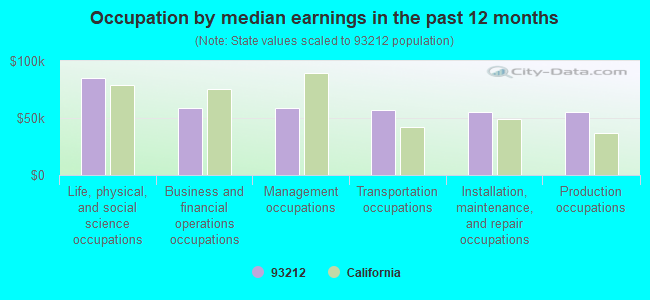
Occupation by median earnings in the past 12 months ($)
84,957Life, physical, and social science occupations
59,204Business and financial operations occupations
59,031Management occupations
57,115Transportation occupations
55,421Installation, maintenance, and repair occupations
55,351Production occupations
Top industries in this zip code by the number of employees in 2005:
Health Care and Social Assistance: General Medical and Surgical Hospitals (100-249 employees: 1 establishment)
2005 - 2018 National Fire Incident Reporting System (NFIRS) incidents
According to the data from the years 2005 - 2018 the average number of fire incidents per year is 71. The highest number of reported fire incidents - 108 took place in 2006, and the least - 40 in 2018. The data has a dropping trend.
When looking into fire subcategories, the most incidents belonged to: Outside Fires (53.1%), and Structure Fires (27.0%).
Fire incident types reported to NFIRS in Zip Code 93212


+$25,348
-$7,562
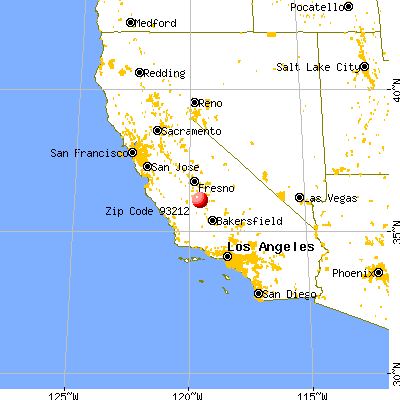
 Nearest zip codes: 93201, 93272, 93274, 93256, 93230, 93219.
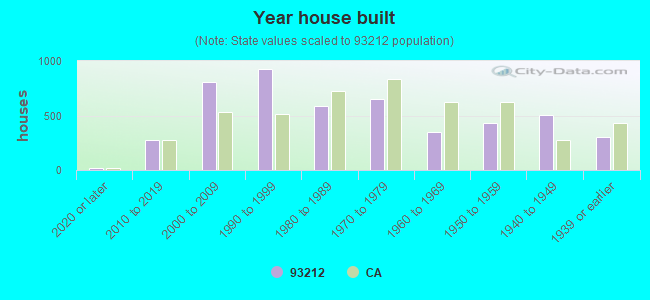


 According to the data from the years 2005 - 2018 the average number of fire incidents per year is 71. The highest number of reported fire incidents - 108 took place in 2006, and the least - 40 in 2018. The data has a dropping trend.
 When looking into fire subcategories, the most incidents belonged to: Outside Fires (53.1%), and Structure Fires (27.0%).