Estimated zip code population in 2022: 78,176 Zip code population in 2010: 69,721 Zip code population in 2000: 56,097
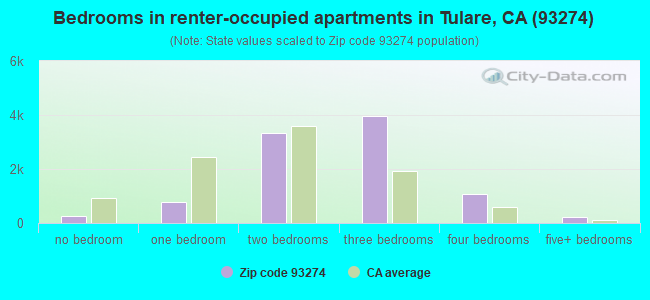
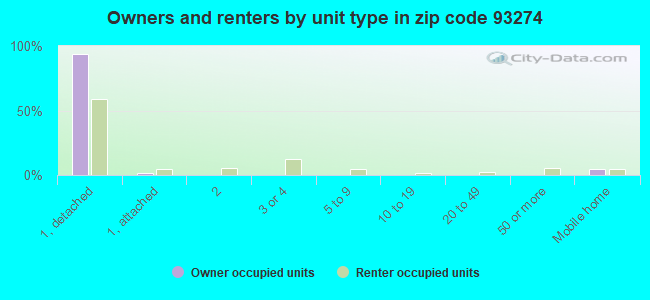
Houses and condos: 24,231 Renter-occupied apartments: 9,626
% of renters here:
42%
State:
44%
March 2022 cost of living index in zip code 93274: 88.6 (less than average, U.S. average is 100)
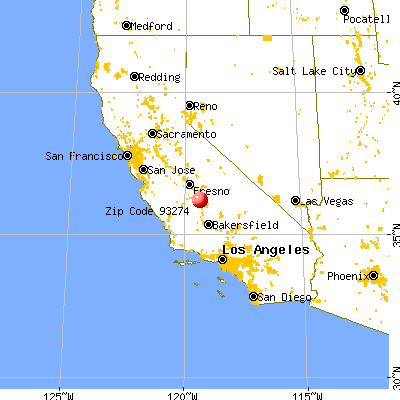
Land area: 214.1 sq. mi. Water area: 0.6 sq. mi.
Population density: 365 people per square mile
(very low).
OSM Map
General Map
Google Map
MSN Map
OSM Map
General Map
Google Map
MSN Map
OSM Map
General Map
Google Map
MSN Map
OSM Map
General Map
Google Map
MSN Map
Please wait while loading the map...
Real estate property taxes paid for housing units in 2022:
This zip code:
0.7% ($2,158)
California:
0.7% ($4,831)
Median real estate property taxes paid for housing units with mortgages in 2022: $2,487 (0.8%) Median real estate property taxes paid for housing units with no mortgage in 2022: $1,562 (0.5%)
Averages for the 2020 tax year for zip code 93274, filed in 2021:
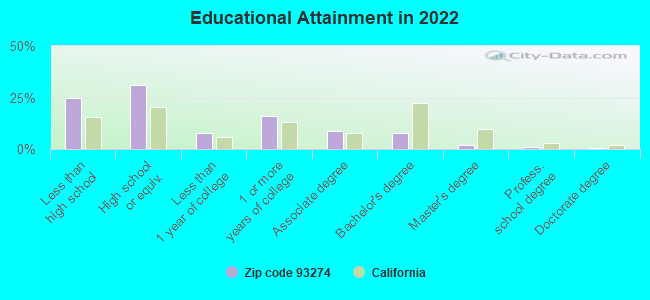
Average Adjusted Gross Income (AGI) in 2020: $59,509 (Individual Income Tax Returns)
Here:
$59,509
State:
$95,910
Salary/wage: $45,063 (reported on 86.4% of returns)
Here:
$45,063
State:
$77,331
(% of AGI for various income ranges: 1338.5% for AGIs below $25k, 4267.3% for AGIs $25k-50k, 7821.3% for AGIs $50k-75k, 11161.3% for AGIs $75k-100k, 21694.7% for AGIs $100k-200k, 77258.3% for AGIs over 200k)
Taxable interest for individuals: $2,083 (reported on 24.7% of returns)
This zip code:
$2,083
California:
$2,294
(% of AGI for various income ranges: 6.7% for AGIs below $25k, 8.9% for AGIs $25k-50k, 19.6% for AGIs $50k-75k, 45.0% for AGIs $75k-100k, 154.7% for AGIs $100k-200k, 9793.3% for AGIs over 200k)
Ordinary dividends: $16,762 (reported on 6.0% of returns)
Here:
$16,762
State:
$10,949
(% of AGI for various income ranges: 6.7% for AGIs below $25k, 8.1% for AGIs $25k-50k, 25.5% for AGIs $50k-75k, 73.0% for AGIs $75k-100k, 179.9% for AGIs $100k-200k, 22200.0% for AGIs over 200k)
Net capital gain/loss in AGI: +$51,175 (reported on 7.0% of returns)
Here:
+$51,175
State:
+$49,306
(% of AGI for various income ranges: 7.6% for AGIs below $25k, 14.2% for AGIs $25k-50k, 60.9% for AGIs $50k-75k, 166.7% for AGIs $75k-100k, 637.6% for AGIs $100k-200k, 82193.3% for AGIs over 200k)
Profit/loss from business: +$11,432 (reported on 12.6% of returns)
Here:
+$11,432
State:
+$15,671
(% of AGI for various income ranges: 95.6% for AGIs below $25k, 135.2% for AGIs $25k-50k, 187.8% for AGIs $50k-75k, 242.8% for AGIs $75k-100k, 527.2% for AGIs $100k-200k, 9576.7% for AGIs over 200k)
Taxable individual retirement arrangement distribution: $17,117 (reported on 3.2% of returns)
93274:
$17,117
California:
$23,505
(% of AGI for various income ranges: 20.3% for AGIs below $25k, 27.3% for AGIs $25k-50k, 80.8% for AGIs $50k-75k, 144.8% for AGIs $75k-100k, 398.1% for AGIs $100k-200k, 2540.8% for AGIs over 200k)
Self-employed (Keogh) retirement plans: $36,440 (reported on 0.2% of returns)
93274:
$36,440
California:
$30,163
(% of AGI for various income ranges: 6.8% for AGIs $50k-75k, 1338.3% for AGIs over 200k)
Total itemized deductions: $30,042 (reported on 7.4% of returns)
Here:
$30,042
State:
$39,517
(% of AGI for various income ranges: 26.6% for AGIs below $25k, 113.3% for AGIs $25k-50k, 393.7% for AGIs $50k-75k, 768.0% for AGIs $75k-100k, 1498.5% for AGIs $100k-200k, 11628.3% for AGIs over 200k)
Charity contributions: $7,884 (reported on 6.2% of returns)
Here:
$7,884
State:
$12,598
(% of AGI for various income ranges: 2.2% for AGIs below $25k, 11.1% for AGIs $25k-50k, 47.5% for AGIs $50k-75k, 132.3% for AGIs $75k-100k, 343.3% for AGIs $100k-200k, 4942.5% for AGIs over 200k)
Taxes paid: $7,677 (reported on 7.4% of returns)
93274:
$7,677
State:
$8,807
(% of AGI for various income ranges: 4.8% for AGIs below $25k, 22.0% for AGIs $25k-50k, 100.3% for AGIs $50k-75k, 230.5% for AGIs $75k-100k, 453.9% for AGIs $100k-200k, 2197.5% for AGIs over 200k)
Earned income credit: $2,416 (reported on 23.3% of returns)
Here:
$2,416
State:
$2,074
(% of AGI for various income ranges: 133.7% for AGIs below $25k, 105.2% for AGIs $25k-50k, 2.2% for AGIs $50k-75k)
Percentage of individuals using paid preparers for their 2020 taxes: 92.2%
Here:
92%
State:
92%
(% for various income ranges: 91.0% for AGIs below $25k, 92.2% for AGIs $25k-50k, 92.5% for AGIs $50k-75k, 93.5% for AGIs $75k-100k, 94.9% for AGIs $100k-200k, 92.9% for AGIs over 200k)
Averages for the 2012 tax year for zip code 93274, filed in 2013:
Average Adjusted Gross Income (AGI) in 2012: $45,310 (Individual Income Tax Returns)
Here:
$45,310
State:
$72,726
Salary/wage: $36,669 (reported on 88.3% of returns)
Here:
$36,669
State:
$59,079
(% of AGI for various income ranges: 79.7% for AGIs below $25k, 87.4% for AGIs $25k-50k, 83.6% for AGIs $50k-75k, 81.9% for AGIs $75k-100k, 77.3% for AGIs $100k-200k, 20.4% for AGIs over 200k)
Taxable interest for individuals: $2,285 (reported on 24.4% of returns)
This zip code:
$2,285
California:
$2,146
(% of AGI for various income ranges: 0.5% for AGIs below $25k, 0.4% for AGIs $25k-50k, 0.5% for AGIs $50k-75k, 0.8% for AGIs $75k-100k, 1.5% for AGIs $100k-200k, 3.5% for AGIs over 200k)
Ordinary dividends: $6,703 (reported on 6.9% of returns)
Here:
$6,703
State:
$9,308
(% of AGI for various income ranges: 0.4% for AGIs below $25k, 0.3% for AGIs $25k-50k, 0.3% for AGIs $50k-75k, 0.4% for AGIs $75k-100k, 0.7% for AGIs $100k-200k, 3.9% for AGIs over 200k)
Net capital gain/loss in AGI: +$31,198 (reported on 6.4% of returns)
Here:
+$31,198
State:
+$30,460
(% of AGI for various income ranges: 0.6% for AGIs below $25k, 0.1% for AGIs $25k-50k, 0.7% for AGIs $50k-75k, 1.6% for AGIs $75k-100k, 3.8% for AGIs $100k-200k, 18.8% for AGIs over 200k)
Profit/loss from business: +$13,710 (reported on 12.2% of returns)
Here:
+$13,710
State:
+$17,064
(% of AGI for various income ranges: 8.0% for AGIs below $25k, 2.5% for AGIs $25k-50k, 2.6% for AGIs $50k-75k, 2.3% for AGIs $75k-100k, 2.9% for AGIs $100k-200k, 4.9% for AGIs over 200k)
Taxable individual retirement arrangement distribution: $11,915 (reported on 4.2% of returns)
93274:
$11,915
California:
$19,557
(% of AGI for various income ranges: 1.0% for AGIs below $25k, 0.9% for AGIs $25k-50k, 1.2% for AGIs $50k-75k, 1.1% for AGIs $75k-100k, 1.6% for AGIs $100k-200k, 0.9% for AGIs over 200k)
Self-employment retirement plans: $19,100 (reported on 0.2% of returns)
93274:
$19,100
California:
$24,530
Total itemized deductions: $24,063 (24% of AGI, reported on 24.8% of returns)
Here:
$24,063
State:
$34,004
Here:
23.7% of AGI
State:
22.7% of AGI
(% of AGI for various income ranges: 5.3% for AGIs below $25k, 8.4% for AGIs $25k-50k, 15.7% for AGIs $50k-75k, 18.1% for AGIs $75k-100k, 18.5% for AGIs $100k-200k, 14.0% for AGIs over 200k)
Charity contributions: $3,792 (reported on 20.1% of returns)
Here:
$3,792
State:
$4,659
(% of AGI for various income ranges: 0.4% for AGIs below $25k, 0.9% for AGIs $25k-50k, 1.7% for AGIs $50k-75k, 2.3% for AGIs $75k-100k, 2.7% for AGIs $100k-200k, 2.2% for AGIs over 200k)
Taxes paid: $8,296 (reported on 24.7% of returns)
93274:
$8,296
State:
$14,448
(% of AGI for various income ranges: 1.0% for AGIs below $25k, 1.6% for AGIs $25k-50k, 3.6% for AGIs $50k-75k, 4.9% for AGIs $75k-100k, 6.4% for AGIs $100k-200k, 9.6% for AGIs over 200k)
Earned income credit: $2,656 (reported on 30.5% of returns)
Here:
$2,656
State:
$2,286
(% of AGI for various income ranges: 10.4% for AGIs below $25k, 1.9% for AGIs $25k-50k)
Percentage of individuals using paid preparers for their 2012 taxes: 65.9%
Here:
66%
State:
64%
(% for various income ranges: 61.3% for AGIs below $25k, 68.3% for AGIs $25k-50k, 69.4% for AGIs $50k-75k, 70.0% for AGIs $75k-100k, 72.7% for AGIs $100k-200k, 89.7% for AGIs over 200k)
Averages for the 2004 tax year for zip code 93274, filed in 2005:
Average Adjusted Gross Income (AGI) in 2004: $34,149 (Individual Income Tax Returns)
Here:
$34,149
State:
$58,600
Salary/wage: $32,165 (reported on 87.8% of returns)
Here:
$32,165
State:
$49,455
(% of AGI for various income ranges: 83.4% for AGIs $10k-25k, 87.3% for AGIs $25k-50k, 84.2% for AGIs $50k-75k, 83.3% for AGIs $75k-100k, 50.2% for AGIs over 100k)
Taxable interest for individuals: $2,352 (reported on 32.7% of returns)
This zip code:
$2,352
California:
$2,365
(% of AGI for various income ranges: 1.1% for AGIs $10k-25k, 0.7% for AGIs $25k-50k, 0.9% for AGIs $50k-75k, 1.4% for AGIs $75k-100k, 4.8% for AGIs over 100k)
Taxable dividends: $1,902 (reported on 10.1% of returns)
Here:
$1,902
State:
$4,746
(% of AGI for various income ranges: 0.4% for AGIs $10k-25k, 0.3% for AGIs $25k-50k, 0.3% for AGIs $50k-75k, 0.4% for AGIs $75k-100k, 1.0% for AGIs over 100k)
Net capital gain/loss: +$24,244 (reported on 10.0% of returns)
Here:
+$24,244
State:
+$23,418
(% of AGI for various income ranges: 1.5% for AGIs $10k-25k, 0.8% for AGIs $25k-50k, 2.2% for AGIs $50k-75k, 3.6% for AGIs $75k-100k, 16.5% for AGIs over 100k)
Profit/loss from business: +$11,558 (reported on 12.7% of returns)
Here:
+$11,558
State:
+$16,826
(% of AGI for various income ranges: 4.7% for AGIs $10k-25k, 3.0% for AGIs $25k-50k, 2.7% for AGIs $50k-75k, 2.6% for AGIs $75k-100k, 7.1% for AGIs over 100k)
IRA payment deduction: $3,355 (reported on 1.6% of returns)
93274:
$3,355
California:
$3,192
(% of AGI for various income ranges: 0.1% for AGIs $10k-25k, 0.1% for AGIs $25k-50k, 0.1% for AGIs $50k-75k, 0.2% for AGIs $75k-100k, 0.2% for AGIs over 100k)
Self-employed pension: $22,959 (reported on 0.4% of returns)
Here:
$22,959
California:
$17,688
(% of AGI for various income ranges: 0.0% for AGIs $10k-25k, 0.1% for AGIs $75k-100k, 0.9% for AGIs over 100k)
Total itemized deductions: $18,501 (26% of AGI, reported on 28.8% of returns)
Here:
$18,501
State:
$28,113
Here:
26.2% of AGI
State:
25.3% of AGI
(% of AGI for various income ranges: 6.7% for AGIs $10k-25k, 12.6% for AGIs $25k-50k, 17.9% for AGIs $50k-75k, 19.2% for AGIs $75k-100k, 16.9% for AGIs over 100k)
Charity contributions deductions: $3,339 (5% of AGI, reported on 25.4% of returns)
Here:
$3,339
State:
$3,923
Here:
4.5% of AGI
State:
3.3% of AGI
(% of AGI for various income ranges: 0.8% for AGIs $10k-25k, 1.5% for AGIs $25k-50k, 2.5% for AGIs $50k-75k, 3.1% for AGIs $75k-100k, 3.8% for AGIs over 100k)
Total tax: $5,038 (reported on 62.2% of returns)
93274:
$5,038
State:
$10,761
(% of AGI for various income ranges: 3.1% for AGIs $10k-25k, 5.0% for AGIs $25k-50k, 7.3% for AGIs $50k-75k, 9.2% for AGIs $75k-100k, 17.6% for AGIs over 100k)
Earned income credit: $1,997 (reported on 27.5% of returns)
Here:
$1,997
State:
$1,763
Percentage of individuals using paid preparers for their 2004 taxes: 69.3%
Here:
69%
State:
66%
(% for various income ranges: 62.6% for AGIs below $10k, 68.7% for AGIs $10k-25k, 70.2% for AGIs $25k-50k, 72.1% for AGIs $50k-75k, 73.7% for AGIs $75k-100k, 84.0% for AGIs over 100k)
Likely homosexual households (counted as self-reported same-sex unmarried-partner households)
Lesbian couples: 0.1% of all households
Gay men: 0.0% of all households
Household received Food Stamps/SNAP in the past 12 months: 6,298 Household did not receive Food Stamps/SNAP in the past 12 months: 17,340
Women who had a birth in the past 12 months: 1,330 (810 now married, 522 unmarried) Women who did not have a birth in the past 12 months: 18,378 (7,402 now married, 10,971 unmarried)
Housing units in zip code 93274 with a mortgage: 9,212 (235 second mortgage, 9 home equity loan, 157 both second mortgage and home equity loan) Houses without a mortgage: 26
Median monthly owner costs for units with a mortgage: $1,683 Median monthly owner costs for units without a mortgage: $574
Residents with income below the poverty level in 2022:
This zip code:
17.1%
Whole state:
12.2%
Residents with income below 50% of the poverty level in 2022:
This zip code:
10.2%
Whole state:
6.2%
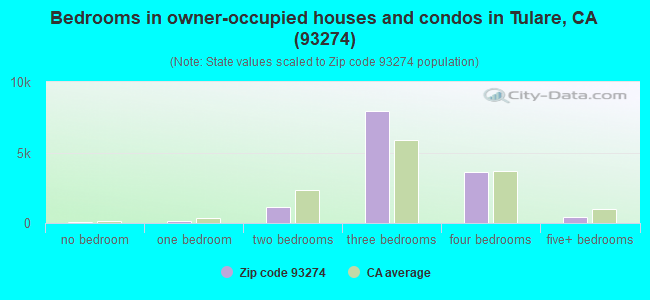
Median number of rooms in houses and condos:
Here:
5.9
State:
6.0
Median number of rooms in apartments:
Here:
4.8
State:
3.9
Notable locations in this zip code not listed on our city pages
Notable locations in zip code 93274: Adriano Nunes Dairy (A), Airoso Dairy (B), Azteca Dairy (C), Codorniz Dairy (D), Countryside Dairy (E), Creekside Dairy (F), Double Oak Dairy (G), Fernjo Dairy (H), J and E Dairy (I), Jake Koetsier Dairy (J), L and L Morais Dairy (K), Lemstra Bardsley Dairy (L), Lerda Dairy (M), Lourenco Dairy (N), M F Gomes Dairy (O), Mancebo Jerseys Dairy (P), Oakview Dairy (Q), Rancho Nuevo Dairy (R), Sierra Vista Dairy (S), Simoes Brothers Dairy (T). Display/hide their locations on the map
Shopping Centers: Tulare Town and Country Village Shopping Center (1), Monte Vista Shopping Center (2), Heritage Place Shopping Center (3), Anchor Plaza Shopping Center (4). Display/hide their locations on the map
Churches in zip code 93274 include: Assembly of God Church (A), Central Bible Baptist Church (B), Church of Christ (C), Church of God (D), Church of God in Christ (E), Church of the Nazarene (F), First Baptist Church (G), First Christian Church (H), First Church of Christ Scientist (I). Display/hide their locations on the map
Streams, rivers, and creeks: Elk Bayou (A), Deep Creek (B), Cameron Creek (C), Bates Slough (D), South Branch Tule River (E), Porter Slough (F), Packwood Creek (G), Outside Creek (H), North Branch Tule River (I). Display/hide their locations on the map
13,396 married couples with children.
8,907 single-parent households (2,365 men, 6,542 women).
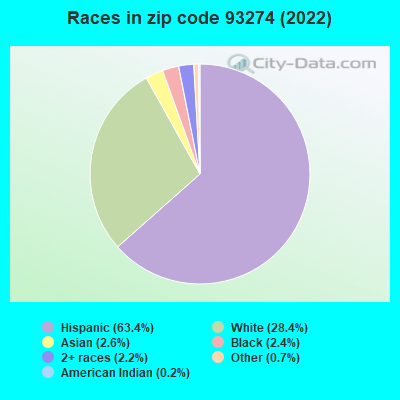
51.7% of residents of 93274 zip code speak English at home.
41.6% of residents speak Spanish at home (47% very well, 29% well, 13% not well, 11% not at all).
4.0% of residents speak other Indo-European language at home (60% very well, 29% well, 10% not well).
1.6% of residents speak Asian or Pacific Island language at home (50% very well, 29% well, 17% not well, 4% not at all).
1.0% of residents speak other language at home (68% very well, 21% well, 8% not well, 3% not at all).
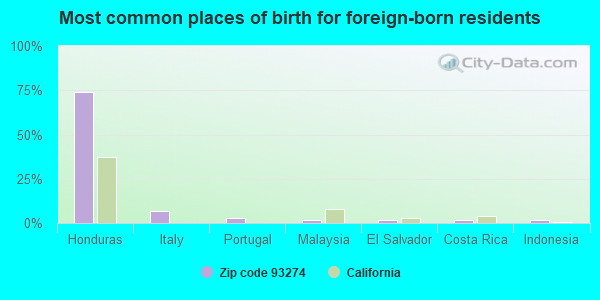
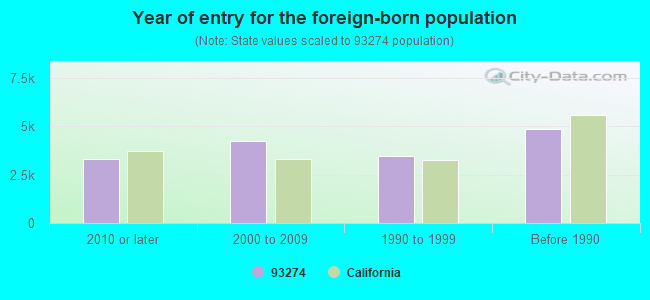
Foreign born population: 15,233 (19.5%) (38.7% of them are naturalized citizens)
Major facilities with environmental interests located in this zip code:
ICE CREAM PARTNERS USA LLC (970 CONTINENTAL AVENUE in TULARE, CA)
STATE MASTER (California - Hazardous Waste Tracking) - HAZARDOU WASTE PROGRAM CRITERIA AND HAZARDOUS AIR POLLUTANT INVENTORY (Inventory of air pollution sources) Small Quantity Generators, between 100 kg and 1000 kg of hazardous waste/month (Resource Conservation and Recovery Act (tracking hazardous waste)) - notification TRI REPORTER (Tracking of toxic chemicals releasing facilities) Business SIC classification: ICE CREAM AND FROZEN DESSERTS Alternative names: HAAGEN DAZS COMPANY INCORPORATED, NESTLE ICE CREAM COMPANY, NESTLE ICE CREAM COMPANY LLC
ELY AUTO PARTS INC (301 E INYO ST in TULARE, CA)
STATE MASTER (California - Hazardous Waste Tracking) - HAZARDOU WASTE PROGRAM Small Quantity Generators, between 100 kg and 1000 kg of hazardous waste/month (Resource Conservation and Recovery Act (tracking hazardous waste)) - notification Organizations: RICHARD WORLEY (CONTACT/OWNER)
F&H CHEMICALS,INC (3645 SOUTH "K" ST. in TULARE, CA)
COMPLIANCE ACTIVITY (Tracking inspections of insecticide, fungicide, and rodenticide, and toxic substances) Small Quantity Generators, between 100 kg and 1000 kg of hazardous waste/month (Resource Conservation and Recovery Act (tracking hazardous waste)) - notification TRANSPORTER (Resource Conservation and Recovery Act (tracking hazardous waste)) - notification Business NAICS classification: ALL OTHER MISCELLANEOUS STORE RETAILERS (EXCEPT TOBACCO STORES). Organizations: WENDELL E FRAZEN (CONTACT/OWNER)
FOOTE PHOTO CO (215 M L K JR AVE in TULARE, CA)
STATE MASTER (California - Hazardous Waste Tracking) - HAZARDOU WASTE PROGRAM Small Quantity Generators, between 100 kg and 1000 kg of hazardous waste/month (Resource Conservation and Recovery Act (tracking hazardous waste)) - notification Organizations: ROBIN GRAY (CONTACT/OWNER)
MOORE AVIATION INC (TULLARE AIRPORT in TULARE, CA)
STATE MASTER (California - Hazardous Waste Tracking) - HAZARDOU WASTE PROGRAM Small Quantity Generators, between 100 kg and 1000 kg of hazardous waste/month (Resource Conservation and Recovery Act (tracking hazardous waste))
LINCOLN ELEMENTARY (909 E. CEDAR in TULARE, CA)
(National Center for Education Statistics) - STATE ID-6054498 Organizations: TULARE CITY ELEMENTARY (SCHOOL DISTRICT)
KOHN (FRANK) ELEMENTARY (500 S. LASPINA in TULARE, CA)
(National Center for Education Statistics) - STATE ID-6054472 Organizations: TULARE CITY ELEMENTARY (SCHOOL DISTRICT)
GARDEN ELEMENTARY (640 E. PLEASANT in TULARE, CA)
(National Center for Education Statistics) - STATE ID-6054480 Organizations: TULARE CITY ELEMENTARY (SCHOOL DISTRICT)
HERITAGE ELEMENTARY (801 W. GAIL in TULARE, CA)
(National Center for Education Statistics) - STATE ID-6114656 Organizations: TULARE CITY ELEMENTARY (SCHOOL DISTRICT)
LIVE OAK MIDDLE (980 NORTH LASPINA in TULARE, CA)
(National Center for Education Statistics) - STATE ID-6108385 Organizations: TULARE CITY ELEMENTARY (SCHOOL DISTRICT)
MAPLE ELEMENTARY (640 W CROSS ST. in TULARE, CA)
(National Center for Education Statistics) - STATE ID-6054506 Organizations: TULARE CITY ELEMENTARY (SCHOOL DISTRICT)
MULCAHY MIDDLE (1001 W. SONORA ST. in TULARE, CA)
(National Center for Education Statistics) - STATE ID-6054456 Organizations: TULARE CITY ELEMENTARY (SCHOOL DISTRICT)
CHERRY MIDDLE (540 N. CHERRY AVE. in TULARE, CA)
(National Center for Education Statistics) - STATE ID-6054464 Organizations: TULARE CITY ELEMENTARY (SCHOOL DISTRICT)
Housing units lacking complete plumbing facilities: 1.5% Housing units lacking complete kitchen facilities: 2.9%
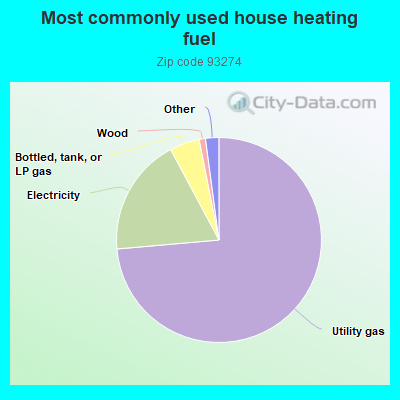
73.6%Utility gas
18.6%Electricity
4.7%Bottled, tank, or LP gas
1.0%Wood
0.7%No fuel used
0.6%Solar energy
Population in 1990: 45,567. Population change in the 1990s: +10,530 (+23.1%).
Place of birth for U.S.-born residents:
This state: 56,576
Northeast: 580
Midwest: 1,012
South: 2,607
West: 1,702
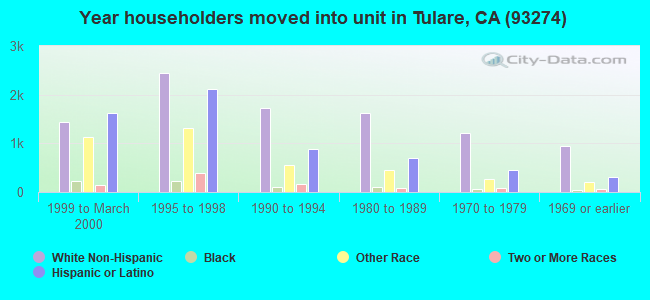
54% of the 93274 zip code residents lived in the same house 5 years ago. Out of people who lived in different houses, 81% lived in this county. Out of people who lived in different counties, 50% lived in California.
92% of the 93274 zip code residents lived in the same house 1 year ago. Out of people who lived in different houses, 59% moved from this county. Out of people who lived in different houses, 28% moved from different county within same state. Out of people who lived in different houses, 8% moved from different state. Out of people who lived in different houses, 5% moved from abroad.
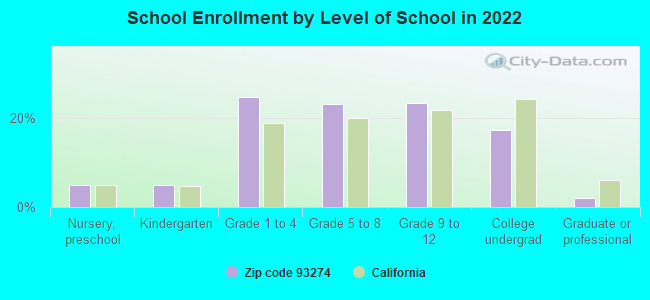
Private vs. public school enrollment:
Students in private schools in grades 1 to 8 (elementary and middle school): 756
Here:
6.5%
California:
10.5%
Students in private schools in grades 9 to 12 (high school): 258
Here:
4.5%
California:
8.5%
Students in private undergraduate colleges: 806
Here:
19.1%
California:
15.9%
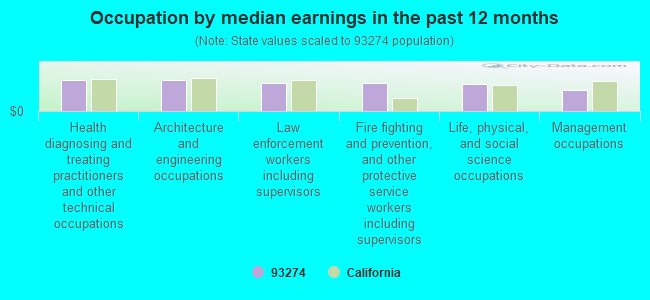
Occupation by median earnings in the past 12 months ($)
97,982Health diagnosing and treating practitioners and other technical occupations
95,628Architecture and engineering occupations
88,421Law enforcement workers including supervisors
87,698Fire fighting and prevention, and other protective service workers including supervisors
85,768Life, physical, and social science occupations
65,044Management occupations
Companies with federal contracts located in this zip code (TULARE, CA):
T B M, INC (MEFFORD FLD HNGR 1 ST HAN; small business) 37 employees, $9175566 revenue. : $30,056,026 in 24 contractsfrom 2000 to 2004
Contracts for Forest/Range Fire Suppression/Presuppression Services, Passenger Air Charter Service by Forest Service (disused code: now 12C2), Forest Service, Office of Policy, Management and Budget/Chief Financial Officer Signed by year:2000: $9,941,000; 2001: $6,932,429; 2002: $8,303,766; 2003: $4,483,907; 2004: $394,924; 2005: $0; 2006: $0.
Biggest contracts:
$8,551,000 with Forest Service (disused code: now 12C2) for Forest/Range Fire Suppression/Presuppression Services. Signed on 2000-09-15. Completion date: 2000-12-15.
$8,139,237 with Forest Service for Forest/Range Fire Suppression/Presuppression Services. Signed on 2002-09-15. Completion date: 2004-12-15.
$3,926,519, same as above.Signed on 2003-09-15. Completion date: 2004-12-15.
$1,302,000 with Forest Service (disused code: now 12C2) for Forest/Range Fire Suppression/Presuppression Services. Taking place in OR. Signed on 2001-09-15. Completion date: 2001-12-15.
TAYLOR BROTHERS, INC (333 E INYO AVENUE; small business) : $321,489 in 27 contractsfrom 2000 to 2006
Contracts for Insect and Rodent Control Services, Maintenance, Repair or Alteration of Real Property -- Other Non-Building Facilities by U.S. Army Corps of Engineers - civil program financing only, Army Signed by year:2000: $55,380; 2001: $27,690; 2002: $27,690; 2003: $0; 2004: $84,816; 2005: $85,316; 2006: $40,597.
Biggest contracts:
$32,708 with U.S. Army Corps of Engineers - civil program financing only for Insect and Rodent Control Services. Signed on 2005-02-25. Completion date: 2005-09-30.
$32,708 with Army for Insect and Rodent Control Services. Signed on 2005-02-25. Completion date: 2005-09-30.
$32,708, same as above.Signed on 2004-01-09. Completion date: 2004-09-30.
$32,708 with U.S. Army Corps of Engineers - civil program financing only for Insect and Rodent Control Services. Signed on 2004-01-09. Completion date: 2004-09-30.
FRANZEN-HILL CORPORATION (1100 N J ST; small business) : $86,183 in 5 contractsfrom 2003 to 2004
Contracts for Maintenance, Repair or Alteration of Real Property -- Other Non-Building Facilities, Maintenance, Repair and Rebuilding of Equipment -- Miscellaneous, Maintenance, Repair and Rebuilding of Equipment -- Service and Trade Equipment, Other Environmental Services, Studies, and Analytical Support by Forest Service, National Park Service, Navy Signed by year:2000: $0; 2001: $0; 2002: $0; 2003: $63,859; 2004: $22,324; 2005: $0; 2006: $0.
Biggest contracts:
$36,464 with Forest Service for Maintenance, Repair or Alteration of Real Property -- Other Non-Building Facilities. Signed on 2003-11-13. Completion date: 2004-05-15.
$27,395 with National Park Service for Maintenance, Repair and Rebuilding of Equipment -- Miscellaneous. Taking place in ID. Signed on 2003-05-15. Completion date: 2003-12-15.
$12,600 with National Park Service for Maintenance, Repair and Rebuilding of Equipment -- Service and Trade Equipment. Signed on 2004-05-19. Completion date: 2004-07-16.
$6,286 with National Park Service for Maintenance, Repair and Rebuilding of Equipment -- Miscellaneous. Signed on 2004-07-20. Effective on 2004-07-02. Completion date: 2004-09-30.
DENNEY & SONS PAINTING (1556 E LEVIN AVE; small business)
$62,042 with Air Force for Maintenance, Repair or Alteration of Real Property -- Family Housing Facilities. Taking place in NM. Signed on 1999-10-27. Completion date: 2000-04-15.
TISSUE CULTURE BIOLOGICALS (1515 E TULARE AVE) : $56,647 in 4 contractsfrom 2002 to 2005
$26,000 with Department of Veterans Affairs for In Vitro Diagnostic Substances, Reagents, Test Kits, and Sets. Signed on 2002-09-15. Completion date: 2002-12-15.
$18,117 with Navy for In Vitro Diagnostic Substances, Reagents, Test Kits, and Sets. Signed on 2004-05-11. Completion date: 2004-05-29.
$6,380 with Navy for In Vitro Diagnostic Substances, Reagents, Test Kits, and Sets. Taking place in MD. Signed on 2005-09-20. Completion date: 2005-10-20.
$6,150, same as above.Signed on 2005-05-31. Completion date: 2005-06-02.
WELKER INTERIORS, INC. (2129 E. TULARE AVE. STE.; small business)
$13,871 with Navy for Maintenance, Repair or Alteration of Real Property -- Hospitals and Infirmaries. Signed on 2000-09-08. Completion date: 2000-10-30.
TY'S DIESEL AIR & ELECTRIC (1395 SOUTH K STREET; small business)
$5,932 with Navy for Generators and Generators Sets, Electrical. Signed on 2004-05-04. Completion date: 2004-05-05.
Top industries in this zip code by the number of employees in 2005:
2005 - 2018 National Fire Incident Reporting System (NFIRS) incidents
According to the data from the years 2005 - 2018 the average number of fires per year is 237. The highest number of reported fires - 456 took place in 2007, and the least - 3 in 2010. The data has an increasing trend.
When looking into fire subcategories, the most reports belonged to: Outside Fires (49.7%), and Structure Fires (27.0%).
Fire incident types reported to NFIRS in Zip Code 93274


 Nearest zip codes: 93277, 93272, 93212, 93223, 93291, 93256.


 According to the data from the years 2005 - 2018 the average number of fires per year is 237. The highest number of reported fires - 456 took place in 2007, and the least - 3 in 2010. The data has an increasing trend.
 When looking into fire subcategories, the most reports belonged to: Outside Fires (49.7%), and Structure Fires (27.0%).