Destrehan, Louisiana Submit your own pictures of this place and show them to the world
OSM Map
General Map
Google Map
MSN Map
OSM Map
General Map
Google Map
MSN Map
OSM Map
General Map
Google Map
MSN Map
OSM Map
General Map
Google Map
MSN Map
Please wait while loading the map...
Population in 2010: 11,535. Population change since 2000: +2.4%Males: 5,930 Females: 5,605
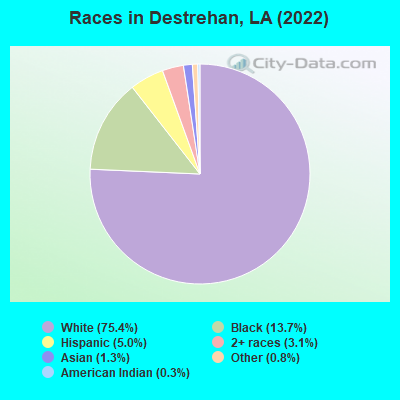
March 2022 cost of living index in Destrehan: 95.1 (less than average, U.S. average is 100) Percentage of residents living in poverty in 2022: 10.2%for White Non-Hispanic residents , 42.4% for Black residents , 12.8% for Hispanic or Latino residents , 19.3% for two or more races residents )Business Search - 14 Million verified businesses
Data:
Median household income ($)
Median household income (% change since 2000)
Household income diversity
Ratio of average income to average house value (%)
Ratio of average income to average rent
Median household income ($) - White
Median household income ($) - Black or African American
Median household income ($) - Asian
Median household income ($) - Hispanic or Latino
Median household income ($) - American Indian and Alaska Native
Median household income ($) - Multirace
Median household income ($) - Other Race
Median household income for houses/condos with a mortgage ($)
Median household income for apartments without a mortgage ($)
Races - White alone (%)
Races - White alone (% change since 2000)
Races - Black alone (%)
Races - Black alone (% change since 2000)
Races - American Indian alone (%)
Races - American Indian alone (% change since 2000)
Races - Asian alone (%)
Races - Asian alone (% change since 2000)
Races - Hispanic (%)
Races - Hispanic (% change since 2000)
Races - Native Hawaiian and Other Pacific Islander alone (%)
Races - Native Hawaiian and Other Pacific Islander alone (% change since 2000)
Races - Two or more races (%)
Races - Two or more races (% change since 2000)
Races - Other race alone (%)
Races - Other race alone (% change since 2000)
Racial diversity
Unemployment (%)
Unemployment (% change since 2000)
Unemployment (%) - White
Unemployment (%) - Black or African American
Unemployment (%) - Asian
Unemployment (%) - Hispanic or Latino
Unemployment (%) - American Indian and Alaska Native
Unemployment (%) - Multirace
Unemployment (%) - Other Race
Population density (people per square mile)
Population - Males (%)
Population - Females (%)
Population - Males (%) - White
Population - Males (%) - Black or African American
Population - Males (%) - Asian
Population - Males (%) - Hispanic or Latino
Population - Males (%) - American Indian and Alaska Native
Population - Males (%) - Multirace
Population - Males (%) - Other Race
Population - Females (%) - White
Population - Females (%) - Black or African American
Population - Females (%) - Asian
Population - Females (%) - Hispanic or Latino
Population - Females (%) - American Indian and Alaska Native
Population - Females (%) - Multirace
Population - Females (%) - Other Race
Coronavirus confirmed cases (Apr 27, 2024)
Deaths caused by coronavirus (Apr 27, 2024)
Coronavirus confirmed cases (per 100k population) (Apr 27, 2024)
Deaths caused by coronavirus (per 100k population) (Apr 27, 2024)
Daily increase in number of cases (Apr 27, 2024)
Weekly increase in number of cases (Apr 27, 2024)
Cases doubled (in days) (Apr 27, 2024)
Hospitalized patients (Apr 18, 2022)
Negative test results (Apr 18, 2022)
Total test results (Apr 18, 2022)
COVID Vaccine doses distributed (per 100k population) (Sep 19, 2023)
COVID Vaccine doses administered (per 100k population) (Sep 19, 2023)
COVID Vaccine doses distributed (Sep 19, 2023)
COVID Vaccine doses administered (Sep 19, 2023)
Likely homosexual households (%)
Likely homosexual households (% change since 2000)
Likely homosexual households - Lesbian couples (%)
Likely homosexual households - Lesbian couples (% change since 2000)
Likely homosexual households - Gay men (%)
Likely homosexual households - Gay men (% change since 2000)
Cost of living index
Median gross rent ($)
Median contract rent ($)
Median monthly housing costs ($)
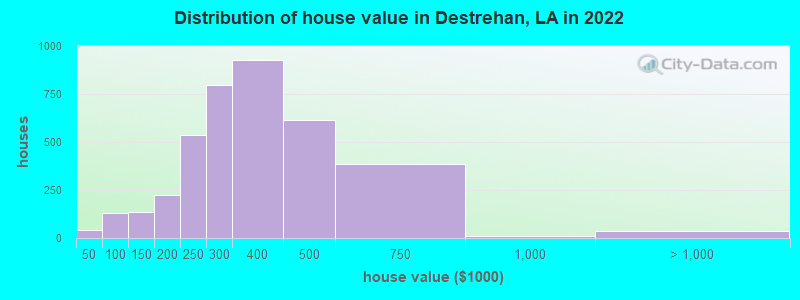
Median house or condo value ($)
Median house or condo value ($ change since 2000)
Mean house or condo value by units in structure - 1, detached ($)
Mean house or condo value by units in structure - 1, attached ($)
Mean house or condo value by units in structure - 2 ($)
Mean house or condo value by units in structure by units in structure - 3 or 4 ($)
Mean house or condo value by units in structure - 5 or more ($)
Mean house or condo value by units in structure - Boat, RV, van, etc. ($)
Mean house or condo value by units in structure - Mobile home ($)
Median house or condo value ($) - White
Median house or condo value ($) - Black or African American
Median house or condo value ($) - Asian
Median house or condo value ($) - Hispanic or Latino
Median house or condo value ($) - American Indian and Alaska Native
Median house or condo value ($) - Multirace
Median house or condo value ($) - Other Race
Median resident age
Resident age diversity
Median resident age - Males
Median resident age - Females
Median resident age - White
Median resident age - Black or African American
Median resident age - Asian
Median resident age - Hispanic or Latino
Median resident age - American Indian and Alaska Native
Median resident age - Multirace
Median resident age - Other Race
Median resident age - Males - White
Median resident age - Males - Black or African American
Median resident age - Males - Asian
Median resident age - Males - Hispanic or Latino
Median resident age - Males - American Indian and Alaska Native
Median resident age - Males - Multirace
Median resident age - Males - Other Race
Median resident age - Females - White
Median resident age - Females - Black or African American
Median resident age - Females - Asian
Median resident age - Females - Hispanic or Latino
Median resident age - Females - American Indian and Alaska Native
Median resident age - Females - Multirace
Median resident age - Females - Other Race
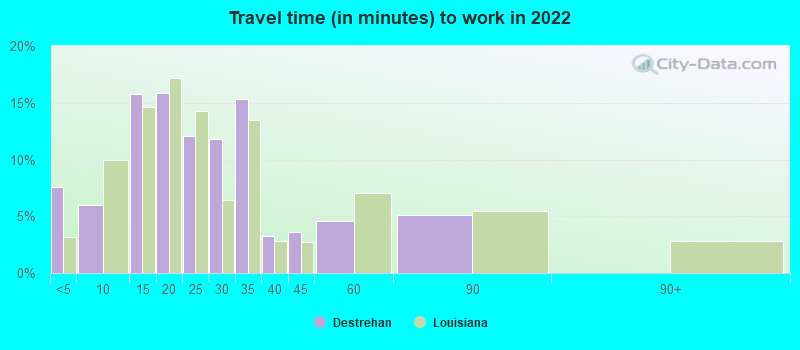
Commute - mean travel time to work (minutes)
Travel time to work - Less than 5 minutes (%)
Travel time to work - Less than 5 minutes (% change since 2000)
Travel time to work - 5 to 9 minutes (%)
Travel time to work - 5 to 9 minutes (% change since 2000)
Travel time to work - 10 to 19 minutes (%)
Travel time to work - 10 to 19 minutes (% change since 2000)
Travel time to work - 20 to 29 minutes (%)
Travel time to work - 20 to 29 minutes (% change since 2000)
Travel time to work - 30 to 39 minutes (%)
Travel time to work - 30 to 39 minutes (% change since 2000)
Travel time to work - 40 to 59 minutes (%)
Travel time to work - 40 to 59 minutes (% change since 2000)
Travel time to work - 60 to 89 minutes (%)
Travel time to work - 60 to 89 minutes (% change since 2000)
Travel time to work - 90 or more minutes (%)
Travel time to work - 90 or more minutes (% change since 2000)
Marital status - Never married (%)
Marital status - Now married (%)
Marital status - Separated (%)
Marital status - Widowed (%)
Marital status - Divorced (%)
Median family income ($)
Median family income (% change since 2000)
Median non-family income ($)
Median non-family income (% change since 2000)
Median per capita income ($)
Median per capita income (% change since 2000)
Median family income ($) - White
Median family income ($) - Black or African American
Median family income ($) - Asian
Median family income ($) - Hispanic or Latino
Median family income ($) - American Indian and Alaska Native
Median family income ($) - Multirace
Median family income ($) - Other Race
Median year house/condo built
Median year apartment built
Year house built - Built 2005 or later (%)
Year house built - Built 2000 to 2004 (%)
Year house built - Built 1990 to 1999 (%)
Year house built - Built 1980 to 1989 (%)
Year house built - Built 1970 to 1979 (%)
Year house built - Built 1960 to 1969 (%)
Year house built - Built 1950 to 1959 (%)
Year house built - Built 1940 to 1949 (%)
Year house built - Built 1939 or earlier (%)
Average household size
Household density (households per square mile)
Average household size - White
Average household size - Black or African American
Average household size - Asian
Average household size - Hispanic or Latino
Average household size - American Indian and Alaska Native
Average household size - Multirace
Average household size - Other Race
Occupied housing units (%)
Vacant housing units (%)
Owner occupied housing units (%)
Renter occupied housing units (%)
Vacancy status - For rent (%)
Vacancy status - For sale only (%)
Vacancy status - Rented or sold, not occupied (%)
Vacancy status - For seasonal, recreational, or occasional use (%)
Vacancy status - For migrant workers (%)
Vacancy status - Other vacant (%)
Residents with income below the poverty level (%)
Residents with income below 50% of the poverty level (%)
Children below poverty level (%)
Poor families by family type - Married-couple family (%)
Poor families by family type - Male, no wife present (%)
Poor families by family type - Female, no husband present (%)
Poverty status for native-born residents (%)
Poverty status for foreign-born residents (%)
Poverty among high school graduates not in families (%)
Poverty among people who did not graduate high school not in families (%)
Residents with income below the poverty level (%) - White
Residents with income below the poverty level (%) - Black or African American
Residents with income below the poverty level (%) - Asian
Residents with income below the poverty level (%) - Hispanic or Latino
Residents with income below the poverty level (%) - American Indian and Alaska Native
Residents with income below the poverty level (%) - Multirace
Residents with income below the poverty level (%) - Other Race
Air pollution - Air Quality Index (AQI)
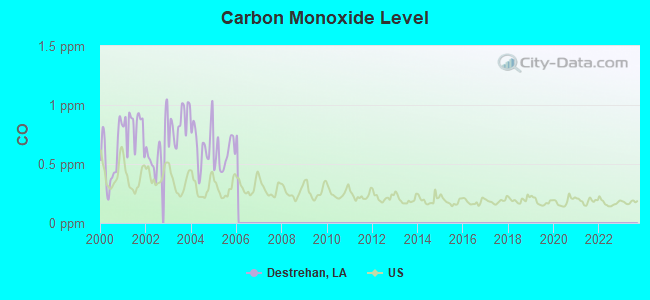
Air pollution - CO
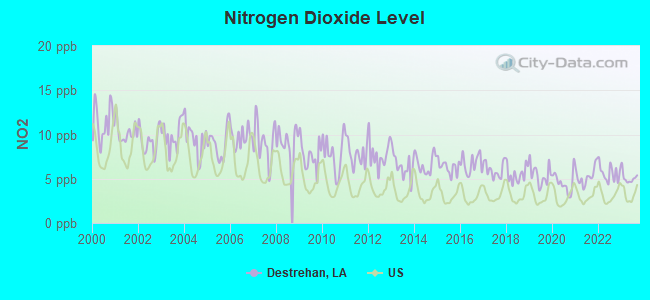
Air pollution - NO2
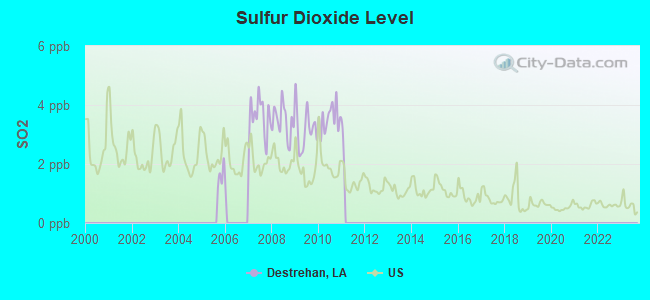
Air pollution - SO2
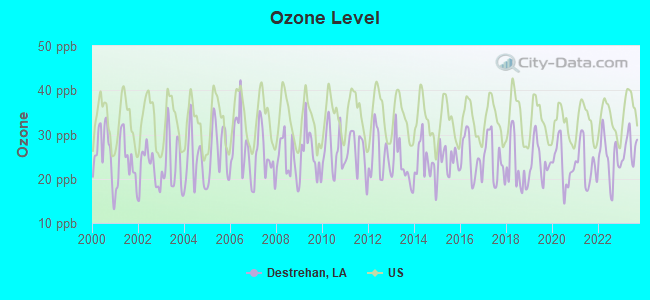
Air pollution - Ozone
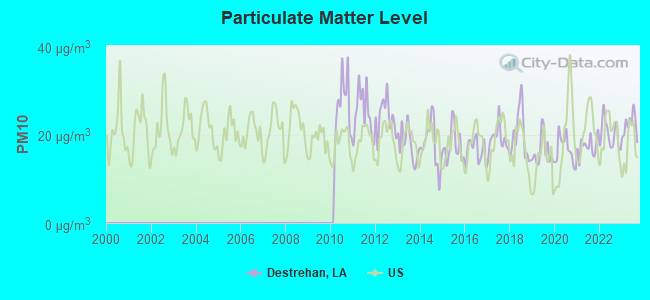
Air pollution - PM10
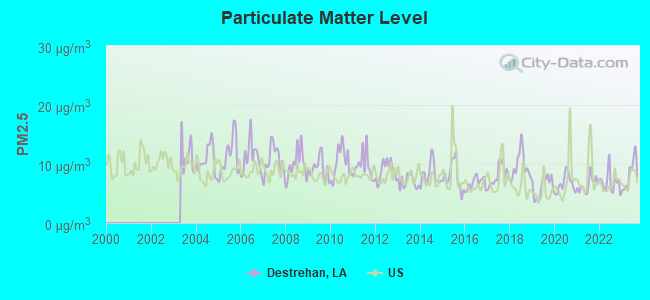
Air pollution - PM25
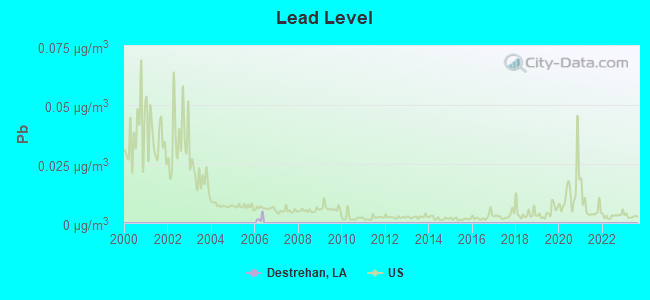
Air pollution - Pb
Crime - Murders per 100,000 population
Crime - Rapes per 100,000 population
Crime - Robberies per 100,000 population
Crime - Assaults per 100,000 population
Crime - Burglaries per 100,000 population
Crime - Thefts per 100,000 population
Crime - Auto thefts per 100,000 population
Crime - Arson per 100,000 population
Crime - City-data.com crime index
Crime - Violent crime index
Crime - Property crime index
Crime - Murders per 100,000 population (5 year average)
Crime - Rapes per 100,000 population (5 year average)
Crime - Robberies per 100,000 population (5 year average)
Crime - Assaults per 100,000 population (5 year average)
Crime - Burglaries per 100,000 population (5 year average)
Crime - Thefts per 100,000 population (5 year average)
Crime - Auto thefts per 100,000 population (5 year average)
Crime - Arson per 100,000 population (5 year average)
Crime - City-data.com crime index (5 year average)
Crime - Violent crime index (5 year average)
Crime - Property crime index (5 year average)
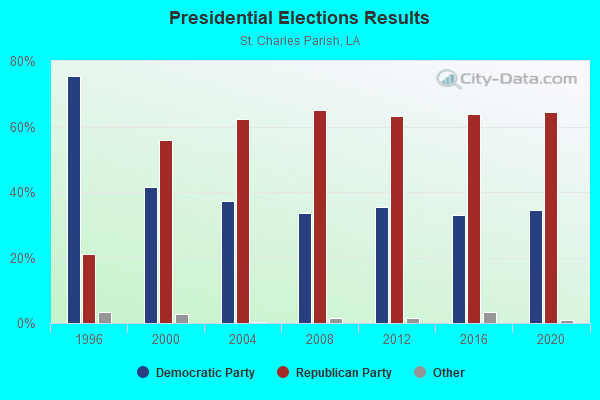
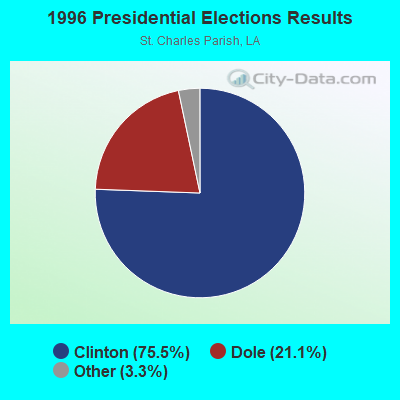
1996 Presidential Elections Results (%) - Democratic Party (Clinton)
1996 Presidential Elections Results (%) - Republican Party (Dole)
1996 Presidential Elections Results (%) - Other
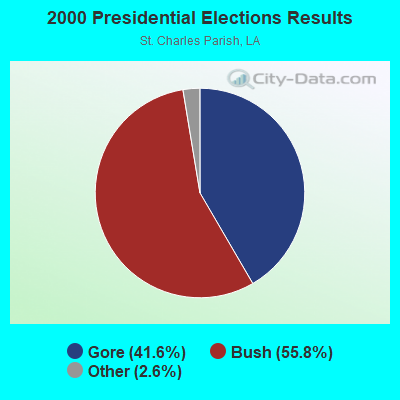
2000 Presidential Elections Results (%) - Democratic Party (Gore)
2000 Presidential Elections Results (%) - Republican Party (Bush)
2000 Presidential Elections Results (%) - Other
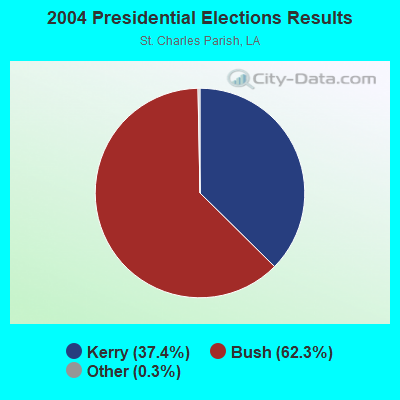
2004 Presidential Elections Results (%) - Democratic Party (Kerry)
2004 Presidential Elections Results (%) - Republican Party (Bush)
2004 Presidential Elections Results (%) - Other
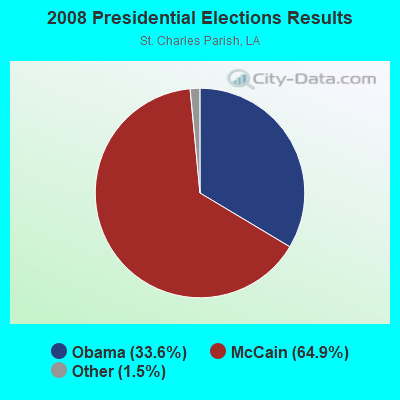
2008 Presidential Elections Results (%) - Democratic Party (Obama)
2008 Presidential Elections Results (%) - Republican Party (McCain)
2008 Presidential Elections Results (%) - Other
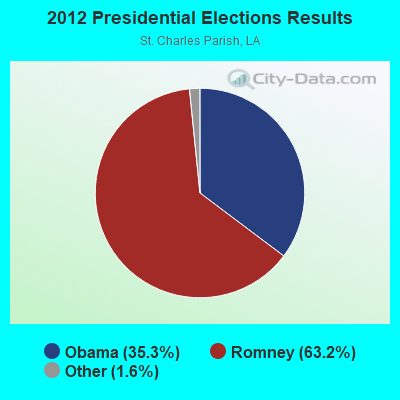
2012 Presidential Elections Results (%) - Democratic Party (Obama)
2012 Presidential Elections Results (%) - Republican Party (Romney)
2012 Presidential Elections Results (%) - Other
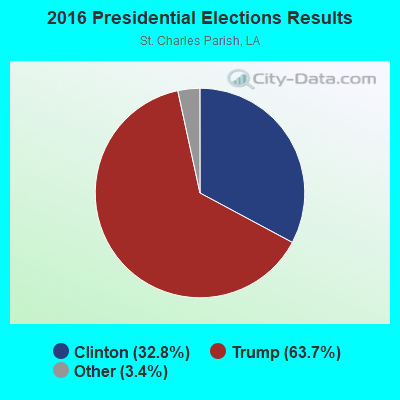
2016 Presidential Elections Results (%) - Democratic Party (Clinton)
2016 Presidential Elections Results (%) - Republican Party (Trump)
2016 Presidential Elections Results (%) - Other
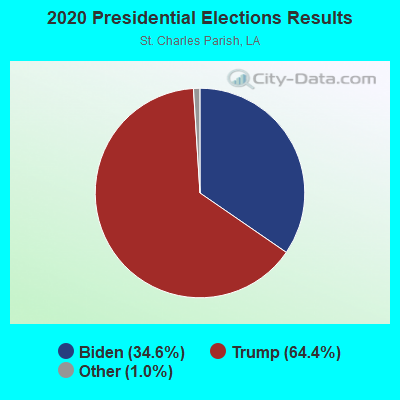
2020 Presidential Elections Results (%) - Democratic Party (Biden)
2020 Presidential Elections Results (%) - Republican Party (Trump)
2020 Presidential Elections Results (%) - Other
Ancestries Reported - Arab (%)
Ancestries Reported - Czech (%)
Ancestries Reported - Danish (%)
Ancestries Reported - Dutch (%)
Ancestries Reported - English (%)
Ancestries Reported - French (%)
Ancestries Reported - French Canadian (%)
Ancestries Reported - German (%)
Ancestries Reported - Greek (%)
Ancestries Reported - Hungarian (%)
Ancestries Reported - Irish (%)
Ancestries Reported - Italian (%)
Ancestries Reported - Lithuanian (%)
Ancestries Reported - Norwegian (%)
Ancestries Reported - Polish (%)
Ancestries Reported - Portuguese (%)
Ancestries Reported - Russian (%)
Ancestries Reported - Scotch-Irish (%)
Ancestries Reported - Scottish (%)
Ancestries Reported - Slovak (%)
Ancestries Reported - Subsaharan African (%)
Ancestries Reported - Swedish (%)
Ancestries Reported - Swiss (%)
Ancestries Reported - Ukrainian (%)
Ancestries Reported - United States (%)
Ancestries Reported - Welsh (%)
Ancestries Reported - West Indian (%)
Ancestries Reported - Other (%)
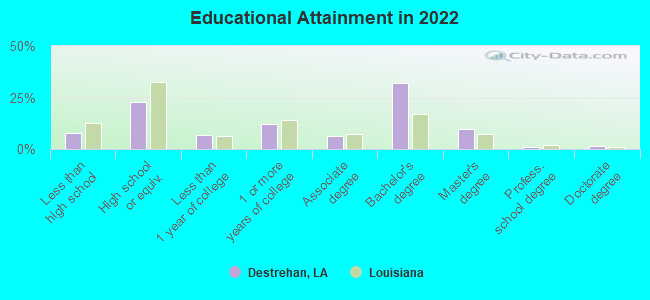
Educational Attainment - No schooling completed (%)
Educational Attainment - Less than high school (%)
Educational Attainment - High school or equivalent (%)
Educational Attainment - Less than 1 year of college (%)
Educational Attainment - 1 or more years of college (%)
Educational Attainment - Associate degree (%)
Educational Attainment - Bachelor's degree (%)
Educational Attainment - Master's degree (%)
Educational Attainment - Professional school degree (%)
Educational Attainment - Doctorate degree (%)
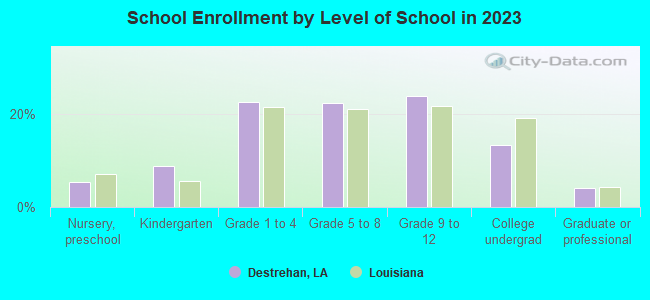
School Enrollment - Nursery, preschool (%)
School Enrollment - Kindergarten (%)
School Enrollment - Grade 1 to 4 (%)
School Enrollment - Grade 5 to 8 (%)
School Enrollment - Grade 9 to 12 (%)
School Enrollment - College undergrad (%)
School Enrollment - Graduate or professional (%)
School Enrollment - Not enrolled in school (%)
School enrollment - Public schools (%)
School enrollment - Private schools (%)
School enrollment - Not enrolled (%)
Median number of rooms in houses and condos
Median number of rooms in apartments
Housing units lacking complete plumbing facilities (%)
Housing units lacking complete kitchen facilities (%)
Density of houses
Urban houses (%)
Rural houses (%)
Households with people 60 years and over (%)
Households with people 65 years and over (%)
Households with people 75 years and over (%)
Households with one or more nonrelatives (%)
Households with no nonrelatives (%)
Population in households (%)
Family households (%)
Nonfamily households (%)
Population in families (%)
Family households with own children (%)
Median number of bedrooms in owner occupied houses
Mean number of bedrooms in owner occupied houses
Median number of bedrooms in renter occupied houses
Mean number of bedrooms in renter occupied houses
Median number of vehichles in owner occupied houses
Mean number of vehichles in owner occupied houses
Median number of vehichles in renter occupied houses
Mean number of vehichles in renter occupied houses
Mortgage status - with mortgage (%)
Mortgage status - with second mortgage (%)
Mortgage status - with home equity loan (%)
Mortgage status - with both second mortgage and home equity loan (%)
Mortgage status - without a mortgage (%)
Average family size
Average family size - White
Average family size - Black or African American
Average family size - Asian
Average family size - Hispanic or Latino
Average family size - American Indian and Alaska Native
Average family size - Multirace
Average family size - Other Race
Geographical mobility - Same house 1 year ago (%)
Geographical mobility - Moved within same county (%)
Geographical mobility - Moved from different county within same state (%)
Geographical mobility - Moved from different state (%)
Geographical mobility - Moved from abroad (%)
Place of birth - Born in state of residence (%)
Place of birth - Born in other state (%)
Place of birth - Native, outside of US (%)
Place of birth - Foreign born (%)
Housing units in structures - 1, detached (%)
Housing units in structures - 1, attached (%)
Housing units in structures - 2 (%)
Housing units in structures - 3 or 4 (%)
Housing units in structures - 5 to 9 (%)
Housing units in structures - 10 to 19 (%)
Housing units in structures - 20 to 49 (%)
Housing units in structures - 50 or more (%)
Housing units in structures - Mobile home (%)
Housing units in structures - Boat, RV, van, etc. (%)
House/condo owner moved in on average (years ago)
Renter moved in on average (years ago)
Year householder moved into unit - Moved in 1999 to March 2000 (%)
Year householder moved into unit - Moved in 1995 to 1998 (%)
Year householder moved into unit - Moved in 1990 to 1994 (%)
Year householder moved into unit - Moved in 1980 to 1989 (%)
Year householder moved into unit - Moved in 1970 to 1979 (%)
Year householder moved into unit - Moved in 1969 or earlier (%)
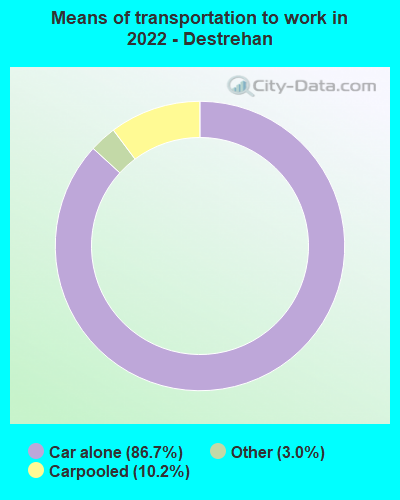
Means of transportation to work - Drove car alone (%)
Means of transportation to work - Carpooled (%)
Means of transportation to work - Public transportation (%)
Means of transportation to work - Bus or trolley bus (%)
Means of transportation to work - Streetcar or trolley car (%)
Means of transportation to work - Subway or elevated (%)
Means of transportation to work - Railroad (%)
Means of transportation to work - Ferryboat (%)
Means of transportation to work - Taxicab (%)
Means of transportation to work - Motorcycle (%)
Means of transportation to work - Bicycle (%)
Means of transportation to work - Walked (%)
Means of transportation to work - Other means (%)
Working at home (%)
Industry diversity
Most Common Industries - Agriculture, forestry, fishing and hunting, and mining (%)
Most Common Industries - Agriculture, forestry, fishing and hunting (%)
Most Common Industries - Mining, quarrying, and oil and gas extraction (%)
Most Common Industries - Construction (%)
Most Common Industries - Manufacturing (%)
Most Common Industries - Wholesale trade (%)
Most Common Industries - Retail trade (%)
Most Common Industries - Transportation and warehousing, and utilities (%)
Most Common Industries - Transportation and warehousing (%)
Most Common Industries - Utilities (%)
Most Common Industries - Information (%)
Most Common Industries - Finance and insurance, and real estate and rental and leasing (%)
Most Common Industries - Finance and insurance (%)
Most Common Industries - Real estate and rental and leasing (%)
Most Common Industries - Professional, scientific, and management, and administrative and waste management services (%)
Most Common Industries - Professional, scientific, and technical services (%)
Most Common Industries - Management of companies and enterprises (%)
Most Common Industries - Administrative and support and waste management services (%)
Most Common Industries - Educational services, and health care and social assistance (%)
Most Common Industries - Educational services (%)
Most Common Industries - Health care and social assistance (%)
Most Common Industries - Arts, entertainment, and recreation, and accommodation and food services (%)
Most Common Industries - Arts, entertainment, and recreation (%)
Most Common Industries - Accommodation and food services (%)
Most Common Industries - Other services, except public administration (%)
Most Common Industries - Public administration (%)
Occupation diversity
Most Common Occupations - Management, business, science, and arts occupations (%)
Most Common Occupations - Management, business, and financial occupations (%)
Most Common Occupations - Management occupations (%)
Most Common Occupations - Business and financial operations occupations (%)
Most Common Occupations - Computer, engineering, and science occupations (%)
Most Common Occupations - Computer and mathematical occupations (%)
Most Common Occupations - Architecture and engineering occupations (%)
Most Common Occupations - Life, physical, and social science occupations (%)
Most Common Occupations - Education, legal, community service, arts, and media occupations (%)
Most Common Occupations - Community and social service occupations (%)
Most Common Occupations - Legal occupations (%)
Most Common Occupations - Education, training, and library occupations (%)
Most Common Occupations - Arts, design, entertainment, sports, and media occupations (%)
Most Common Occupations - Healthcare practitioners and technical occupations (%)
Most Common Occupations - Health diagnosing and treating practitioners and other technical occupations (%)
Most Common Occupations - Health technologists and technicians (%)
Most Common Occupations - Service occupations (%)
Most Common Occupations - Healthcare support occupations (%)
Most Common Occupations - Protective service occupations (%)
Most Common Occupations - Fire fighting and prevention, and other protective service workers including supervisors (%)
Most Common Occupations - Law enforcement workers including supervisors (%)
Most Common Occupations - Food preparation and serving related occupations (%)
Most Common Occupations - Building and grounds cleaning and maintenance occupations (%)
Most Common Occupations - Personal care and service occupations (%)
Most Common Occupations - Sales and office occupations (%)
Most Common Occupations - Sales and related occupations (%)
Most Common Occupations - Office and administrative support occupations (%)
Most Common Occupations - Natural resources, construction, and maintenance occupations (%)
Most Common Occupations - Farming, fishing, and forestry occupations (%)
Most Common Occupations - Construction and extraction occupations (%)
Most Common Occupations - Installation, maintenance, and repair occupations (%)
Most Common Occupations - Production, transportation, and material moving occupations (%)
Most Common Occupations - Production occupations (%)
Most Common Occupations - Transportation occupations (%)
Most Common Occupations - Material moving occupations (%)
People in Group quarters - Institutionalized population (%)
People in Group quarters - Correctional institutions (%)
People in Group quarters - Federal prisons and detention centers (%)
People in Group quarters - Halfway houses (%)
People in Group quarters - Local jails and other confinement facilities (including police lockups) (%)
People in Group quarters - Military disciplinary barracks (%)
People in Group quarters - State prisons (%)
People in Group quarters - Other types of correctional institutions (%)
People in Group quarters - Nursing homes (%)
People in Group quarters - Hospitals/wards, hospices, and schools for the handicapped (%)
People in Group quarters - Hospitals/wards and hospices for chronically ill (%)
People in Group quarters - Hospices or homes for chronically ill (%)
People in Group quarters - Military hospitals or wards for chronically ill (%)
People in Group quarters - Other hospitals or wards for chronically ill (%)
People in Group quarters - Hospitals or wards for drug/alcohol abuse (%)
People in Group quarters - Mental (Psychiatric) hospitals or wards (%)
People in Group quarters - Schools, hospitals, or wards for the mentally retarded (%)
People in Group quarters - Schools, hospitals, or wards for the physically handicapped (%)
People in Group quarters - Institutions for the deaf (%)
People in Group quarters - Institutions for the blind (%)
People in Group quarters - Orthopedic wards and institutions for the physically handicapped (%)
People in Group quarters - Wards in general hospitals for patients who have no usual home elsewhere (%)
People in Group quarters - Wards in military hospitals for patients who have no usual home elsewhere (%)
People in Group quarters - Juvenile institutions (%)
People in Group quarters - Long-term care (%)
People in Group quarters - Homes for abused, dependent, and neglected children (%)
People in Group quarters - Residential treatment centers for emotionally disturbed children (%)
People in Group quarters - Training schools for juvenile delinquents (%)
People in Group quarters - Short-term care, detention or diagnostic centers for delinquent children (%)
People in Group quarters - Type of juvenile institution unknown (%)
People in Group quarters - Noninstitutionalized population (%)
People in Group quarters - College dormitories (includes college quarters off campus) (%)
People in Group quarters - Military quarters (%)
People in Group quarters - On base (%)
People in Group quarters - Barracks, unaccompanied personnel housing (UPH), (Enlisted/Officer), ;and similar group living quarters for military personnel (%)
People in Group quarters - Transient quarters for temporary residents (%)
People in Group quarters - Military ships (%)
People in Group quarters - Group homes (%)
People in Group quarters - Homes or halfway houses for drug/alcohol abuse (%)
People in Group quarters - Homes for the mentally ill (%)
People in Group quarters - Homes for the mentally retarded (%)
People in Group quarters - Homes for the physically handicapped (%)
People in Group quarters - Other group homes (%)
People in Group quarters - Religious group quarters (%)
People in Group quarters - Dormitories (%)
People in Group quarters - Agriculture workers' dormitories on farms (%)
People in Group quarters - Job Corps and vocational training facilities (%)
People in Group quarters - Other workers' dormitories (%)
People in Group quarters - Crews of maritime vessels (%)
People in Group quarters - Other nonhousehold living situations (%)
People in Group quarters - Other noninstitutional group quarters (%)
Residents speaking English at home (%)
Residents speaking English at home - Born in the United States (%)
Residents speaking English at home - Native, born elsewhere (%)
Residents speaking English at home - Foreign born (%)
Residents speaking Spanish at home (%)
Residents speaking Spanish at home - Born in the United States (%)
Residents speaking Spanish at home - Native, born elsewhere (%)
Residents speaking Spanish at home - Foreign born (%)
Residents speaking other language at home (%)
Residents speaking other language at home - Born in the United States (%)
Residents speaking other language at home - Native, born elsewhere (%)
Residents speaking other language at home - Foreign born (%)
Class of Workers - Employee of private company (%)
Class of Workers - Self-employed in own incorporated business (%)
Class of Workers - Private not-for-profit wage and salary workers (%)
Class of Workers - Local government workers (%)
Class of Workers - State government workers (%)
Class of Workers - Federal government workers (%)
Class of Workers - Self-employed workers in own not incorporated business and Unpaid family workers (%)
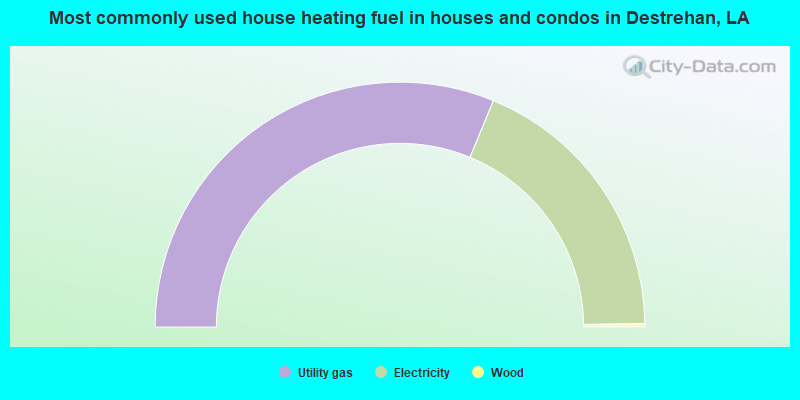
House heating fuel used in houses and condos - Utility gas (%)
House heating fuel used in houses and condos - Bottled, tank, or LP gas (%)
House heating fuel used in houses and condos - Electricity (%)
House heating fuel used in houses and condos - Fuel oil, kerosene, etc. (%)
House heating fuel used in houses and condos - Coal or coke (%)
House heating fuel used in houses and condos - Wood (%)
House heating fuel used in houses and condos - Solar energy (%)
House heating fuel used in houses and condos - Other fuel (%)
House heating fuel used in houses and condos - No fuel used (%)
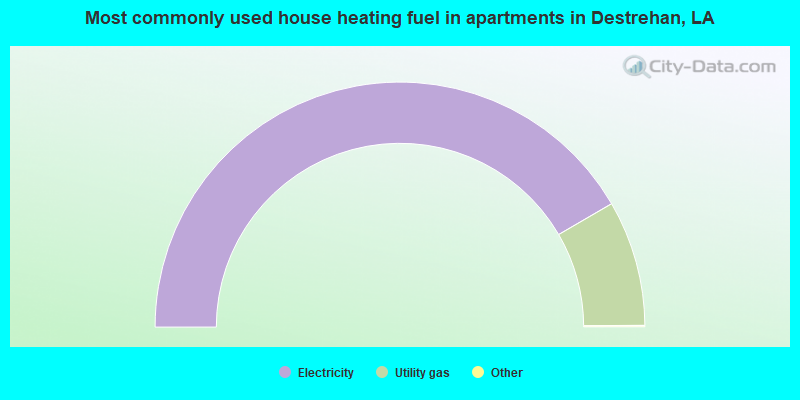
House heating fuel used in apartments - Utility gas (%)
House heating fuel used in apartments - Bottled, tank, or LP gas (%)
House heating fuel used in apartments - Electricity (%)
House heating fuel used in apartments - Fuel oil, kerosene, etc. (%)
House heating fuel used in apartments - Coal or coke (%)
House heating fuel used in apartments - Wood (%)
House heating fuel used in apartments - Solar energy (%)
House heating fuel used in apartments - Other fuel (%)
House heating fuel used in apartments - No fuel used (%)
Armed forces status - In Armed Forces (%)
Armed forces status - Civilian (%)
Armed forces status - Civilian - Veteran (%)
Armed forces status - Civilian - Nonveteran (%)
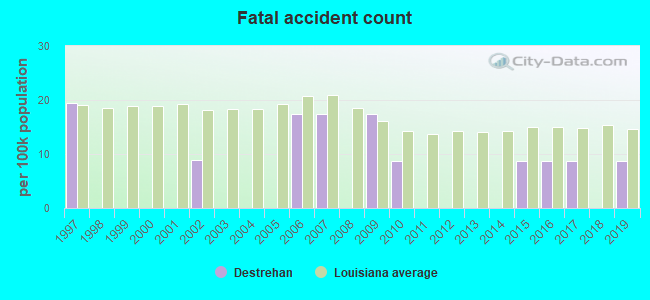
Fatal accidents locations in years 2005-2021
Fatal accidents locations in 2005
Fatal accidents locations in 2006
Fatal accidents locations in 2007
Fatal accidents locations in 2008
Fatal accidents locations in 2009
Fatal accidents locations in 2010
Fatal accidents locations in 2011
Fatal accidents locations in 2012
Fatal accidents locations in 2013
Fatal accidents locations in 2014
Fatal accidents locations in 2015
Fatal accidents locations in 2016
Fatal accidents locations in 2017
Fatal accidents locations in 2018
Fatal accidents locations in 2019
Fatal accidents locations in 2020
Fatal accidents locations in 2021
Alcohol use - People drinking some alcohol every month (%)
Alcohol use - People not drinking at all (%)
Alcohol use - Average days/month drinking alcohol
Alcohol use - Average drinks/week
Alcohol use - Average days/year people drink much
Audiometry - Average condition of hearing (%)
Audiometry - People that can hear a whisper from across a quiet room (%)
Audiometry - People that can hear normal voice from across a quiet room (%)
Audiometry - Ears ringing, roaring, buzzing (%)
Audiometry - Had a job exposure to loud noise (%)
Audiometry - Had off-work exposure to loud noise (%)
Blood Pressure & Cholesterol - Has high blood pressure (%)
Blood Pressure & Cholesterol - Checking blood pressure at home (%)
Blood Pressure & Cholesterol - Frequently checking blood cholesterol (%)
Blood Pressure & Cholesterol - Has high cholesterol level (%)
Consumer Behavior - Money monthly spent on food at supermarket/grocery store
Consumer Behavior - Money monthly spent on food at other stores
Consumer Behavior - Money monthly spent on eating out
Consumer Behavior - Money monthly spent on carryout/delivered foods
Consumer Behavior - Income spent on food at supermarket/grocery store (%)
Consumer Behavior - Income spent on food at other stores (%)
Consumer Behavior - Income spent on eating out (%)
Consumer Behavior - Income spent on carryout/delivered foods (%)
Current Health Status - General health condition (%)
Current Health Status - Blood donors (%)
Current Health Status - Has blood ever tested for HIV virus (%)
Current Health Status - Left-handed people (%)
Dermatology - People using sunscreen (%)
Diabetes - Diabetics (%)
Diabetes - Had a blood test for high blood sugar (%)
Diabetes - People taking insulin (%)
Diet Behavior & Nutrition - Diet health (%)
Diet Behavior & Nutrition - Milk product consumption (# of products/month)
Diet Behavior & Nutrition - Meals not home prepared (#/week)
Diet Behavior & Nutrition - Meals from fast food or pizza place (#/week)
Diet Behavior & Nutrition - Ready-to-eat foods (#/month)
Diet Behavior & Nutrition - Frozen meals/pizza (#/month)
Drug Use - People that ever used marijuana or hashish (%)
Drug Use - Ever used hard drugs (%)
Drug Use - Ever used any form of cocaine (%)
Drug Use - Ever used heroin (%)
Drug Use - Ever used methamphetamine (%)
Health Insurance - People covered by health insurance (%)
Kidney Conditions-Urology - Avg. # of times urinating at night
Medical Conditions - People with asthma (%)
Medical Conditions - People with anemia (%)
Medical Conditions - People with psoriasis (%)
Medical Conditions - People with overweight (%)
Medical Conditions - Elderly people having difficulties in thinking or remembering (%)
Medical Conditions - People who ever received blood transfusion (%)
Medical Conditions - People having trouble seeing even with glass/contacts (%)
Medical Conditions - People with arthritis (%)
Medical Conditions - People with gout (%)
Medical Conditions - People with congestive heart failure (%)
Medical Conditions - People with coronary heart disease (%)
Medical Conditions - People with angina pectoris (%)
Medical Conditions - People who ever had heart attack (%)
Medical Conditions - People who ever had stroke (%)
Medical Conditions - People with emphysema (%)
Medical Conditions - People with thyroid problem (%)
Medical Conditions - People with chronic bronchitis (%)
Medical Conditions - People with any liver condition (%)
Medical Conditions - People who ever had cancer or malignancy (%)
Mental Health - People who have little interest in doing things (%)
Mental Health - People feeling down, depressed, or hopeless (%)
Mental Health - People who have trouble sleeping or sleeping too much (%)
Mental Health - People feeling tired or having little energy (%)
Mental Health - People with poor appetite or overeating (%)
Mental Health - People feeling bad about themself (%)
Mental Health - People who have trouble concentrating on things (%)
Mental Health - People moving or speaking slowly or too fast (%)
Mental Health - People having thoughts they would be better off dead (%)
Oral Health - Average years since last visit a dentist
Oral Health - People embarrassed because of mouth (%)
Oral Health - People with gum disease (%)
Oral Health - General health of teeth and gums (%)
Oral Health - Average days a week using dental floss/device
Oral Health - Average days a week using mouthwash for dental problem
Oral Health - Average number of teeth
Pesticide Use - Households using pesticides to control insects (%)
Pesticide Use - Households using pesticides to kill weeds (%)
Physical Activity - People doing vigorous-intensity work activities (%)
Physical Activity - People doing moderate-intensity work activities (%)
Physical Activity - People walking or bicycling (%)
Physical Activity - People doing vigorous-intensity recreational activities (%)
Physical Activity - People doing moderate-intensity recreational activities (%)
Physical Activity - Average hours a day doing sedentary activities
Physical Activity - Average hours a day watching TV or videos
Physical Activity - Average hours a day using computer
Physical Functioning - People having limitations keeping them from working (%)
Physical Functioning - People limited in amount of work they can do (%)
Physical Functioning - People that need special equipment to walk (%)
Physical Functioning - People experiencing confusion/memory problems (%)
Physical Functioning - People requiring special healthcare equipment (%)
Prescription Medications - Average number of prescription medicines taking
Preventive Aspirin Use - Adults 40+ taking low-dose aspirin (%)
Reproductive Health - Vaginal deliveries (%)
Reproductive Health - Cesarean deliveries (%)
Reproductive Health - Deliveries resulted in a live birth (%)
Reproductive Health - Pregnancies resulted in a delivery (%)
Reproductive Health - Women breastfeeding newborns (%)
Reproductive Health - Women that had a hysterectomy (%)
Reproductive Health - Women that had both ovaries removed (%)
Reproductive Health - Women that have ever taken birth control pills (%)
Reproductive Health - Women taking birth control pills (%)
Reproductive Health - Women that have ever used Depo-Provera or injectables (%)
Reproductive Health - Women that have ever used female hormones (%)
Sexual Behavior - People 18+ that ever had sex (vaginal, anal, or oral) (%)
Sexual Behavior - Males 18+ that ever had vaginal sex with a woman (%)
Sexual Behavior - Males 18+ that ever performed oral sex on a woman (%)
Sexual Behavior - Males 18+ that ever had anal sex with a woman (%)
Sexual Behavior - Males 18+ that ever had any sex with a man (%)
Sexual Behavior - Females 18+ that ever had vaginal sex with a man (%)
Sexual Behavior - Females 18+ that ever performed oral sex on a man (%)
Sexual Behavior - Females 18+ that ever had anal sex with a man (%)
Sexual Behavior - Females 18+ that ever had any kind of sex with a woman (%)
Sexual Behavior - Average age people first had sex
Sexual Behavior - Average number of female sex partners in lifetime (males 18+)
Sexual Behavior - Average number of female vaginal sex partners in lifetime (males 18+)
Sexual Behavior - Average age people first performed oral sex on a woman (18+)
Sexual Behavior - Average number of woman performed oral sex on in lifetime (18+)
Sexual Behavior - Average number of male sex partners in lifetime (males 18+)
Sexual Behavior - Average number of male anal sex partners in lifetime (males 18+)
Sexual Behavior - Average age people first performed oral sex on a man (18+)
Sexual Behavior - Average number of male oral sex partners in lifetime (18+)
Sexual Behavior - People using protection when performing oral sex (%)
Sexual Behavior - Average number of times people have vaginal or anal sex a year
Sexual Behavior - People having sex without condom (%)
Sexual Behavior - Average number of male sex partners in lifetime (females 18+)
Sexual Behavior - Average number of male vaginal sex partners in lifetime (females 18+)
Sexual Behavior - Average number of female sex partners in lifetime (females 18+)
Sexual Behavior - Circumcised males 18+ (%)
Sleep Disorders - Average hours sleeping at night
Sleep Disorders - People that has trouble sleeping (%)
Smoking-Cigarette Use - People smoking cigarettes (%)
Taste & Smell - People 40+ having problems with smell (%)
Taste & Smell - People 40+ having problems with taste (%)
Taste & Smell - People 40+ that ever had wisdom teeth removed (%)
Taste & Smell - People 40+ that ever had tonsils teeth removed (%)
Taste & Smell - People 40+ that ever had a loss of consciousness because of a head injury (%)
Taste & Smell - People 40+ that ever had a broken nose or other serious injury to face or skull (%)
Taste & Smell - People 40+ that ever had two or more sinus infections (%)
Weight - Average height (inches)
Weight - Average weight (pounds)
Weight - Average BMI
Weight - People that are obese (%)
Weight - People that ever were obese (%)
Weight - People trying to lose weight (%)
According to our research of Louisiana and other state lists, there were 8 registered sex offenders living in Destrehan, Louisiana as of April 27, 2024 . The ratio of all residents to sex offenders in Destrehan is 1,412 to 1.The ratio of registered sex offenders to all residents in this city is much lower than the state average.
Latest news from Destrehan, LA collected exclusively by city-data.com from local newspapers, TV, and radio stations
Destrehan, LA City Guides: Ancestries: American (36.2%), French (13.9%), German (6.9%), Italian (4.3%), English (2.6%), Irish (2.5%).
Current Local Time:
Land area: 6.91 square miles.
Population density: 1,668 people per square mile (low).
494 residents are foreign born (2.0% Latin America , 1.3% Asia ).
This place:
4.1%Louisiana:
4.2%
Median real estate property taxes paid for housing units with mortgages in 2022: $2,098 (0.6%)Median real estate property taxes paid for housing units with no mortgage in 2022: $1,858 (0.6%)
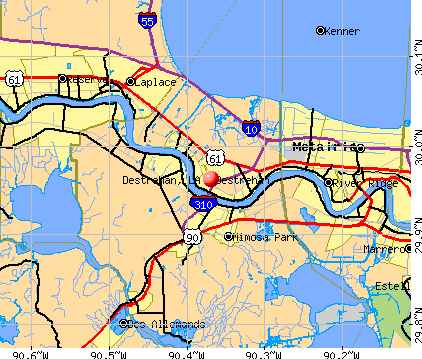
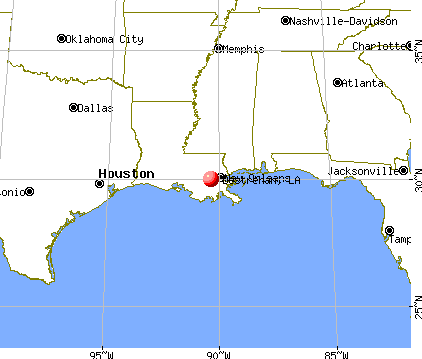
Nearest city with pop. 50,000+: Kenner, LA
Nearest city with pop. 200,000+: New Orleans, LA
Nearest city with pop. 1,000,000+: Houston, TX
Nearest cities:
Taft, LA (2.2 miles)
Latitude: 29.96 N, Longitude: 90.37 W
Daytime population change due to commuting: -2,812 (-23.6%)Workers who live and work in this place: 1,343 (23.1%)
Area code commonly used in this area: 985
Unemployment in December 2023:
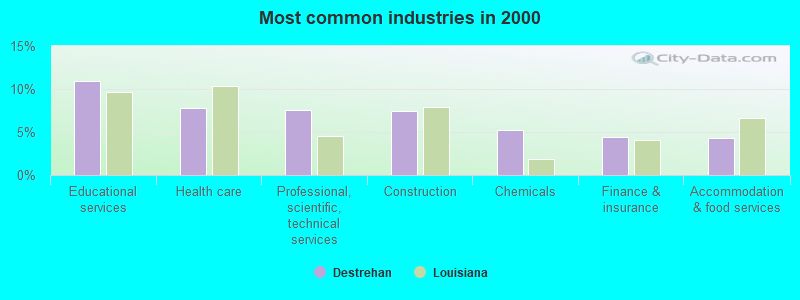
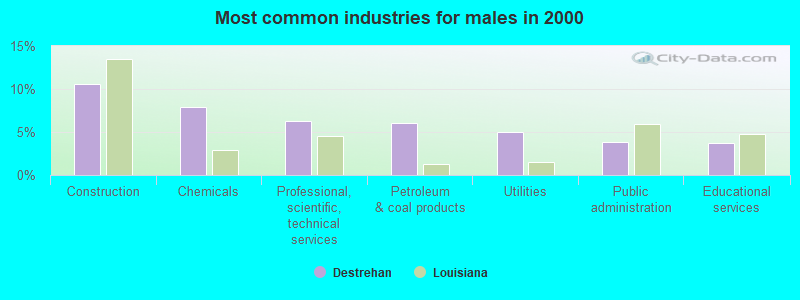
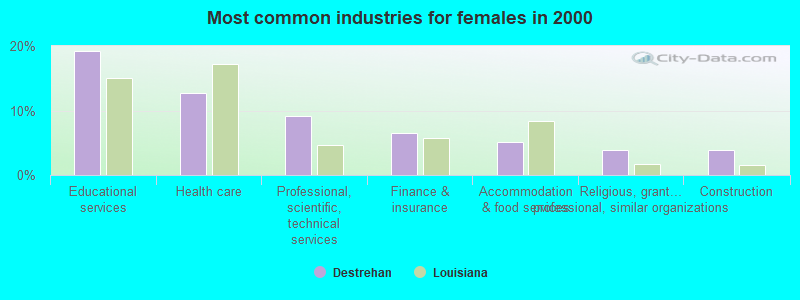
Most common industries in Destrehan, LA (%)
Both Males Females
Educational services (11.0%)
Health care (7.8%)
Professional, scientific, technical services (7.6%)
Construction (7.4%)
Chemicals (5.2%)
Finance & insurance (4.5%)
Accommodation & food services (4.4%)
Construction (10.5%)
Chemicals (7.9%)
Professional, scientific, technical services (6.3%)
Petroleum & coal products (6.1%)
Utilities (5.0%)
Public administration (3.8%)
Educational services (3.7%)
Educational services (19.3%)
Health care (12.7%)
Professional, scientific, technical services (9.1%)
Finance & insurance (6.4%)
Accommodation & food services (5.2%)
Religious, grantmaking, civic, professional, similar organizations (3.9%)
Construction (3.8%)
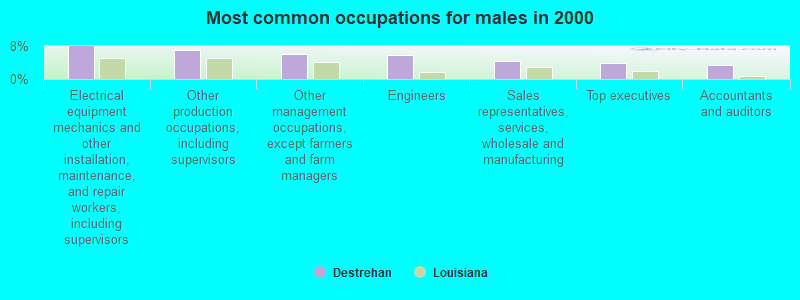
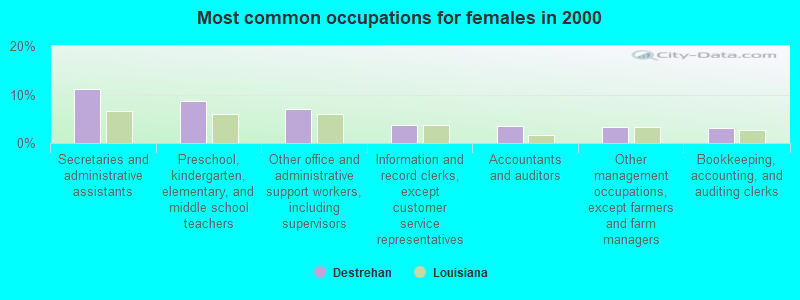
Most common occupations in Destrehan, LA (%)
Both Males Females
Secretaries and administrative assistants (5.3%)
Other office and administrative support workers, including supervisors (4.8%)
Other management occupations, except farmers and farm managers (4.7%)
Electrical equipment mechanics and other installation, maintenance, and repair workers, including supervisors (4.4%)
Preschool, kindergarten, elementary, and middle school teachers (4.3%)
Other production occupations, including supervisors (4.1%)
Accountants and auditors (3.4%)
Electrical equipment mechanics and other installation, maintenance, and repair workers, including supervisors (7.9%)
Other production occupations, including supervisors (7.1%)
Other management occupations, except farmers and farm managers (6.0%)
Engineers (5.8%)
Sales representatives, services, wholesale and manufacturing (4.4%)
Top executives (3.8%)
Accountants and auditors (3.3%)
Secretaries and administrative assistants (11.1%)
Preschool, kindergarten, elementary, and middle school teachers (8.6%)
Other office and administrative support workers, including supervisors (7.0%)
Information and record clerks, except customer service representatives (3.7%)
Accountants and auditors (3.5%)
Other management occupations, except farmers and farm managers (3.2%)
Bookkeeping, accounting, and auditing clerks (3.2%)
Tornado activity:
Destrehan-area historical tornado activity is slightly below Louisiana state average. It is 28% greater than the overall U.S. average.
On 12/6/1983, a category F4 (max. wind speeds 207-260 mph) tornado 8.7 miles away from the Destrehan place center injured 25 people and caused between $5,000,000 and $50,000,000 in damages.
On 10/3/1964, a category F4 tornado 25.1 miles away from the place center killed 22 people and injured 165 people and caused between $500,000 and $5,000,000 in damages.
Earthquake activity:
Destrehan-area historical earthquake activity is significantly above Louisiana state average. It is 54% smaller than the overall U.S. average. On 9/10/2006 at 14:56:08, a magnitude 5.9 (5.9 MB, 5.5 MS, 5.8 MW, Class: Moderate, Intensity: VI - VII) earthquake occurred 343.4 miles away from Destrehan center On 10/24/1997 at 08:35:17, a magnitude 4.9 (4.8 MB, 4.2 MS, 4.9 LG, Depth: 6.2 mi, Class: Light, Intensity: IV - V) earthquake occurred 201.2 miles away from Destrehan center On 5/6/2018 at 16:47:09, a magnitude 4.6 (4.6 MB, Depth: 6.2 mi) earthquake occurred 177.2 miles away from the city center On 6/30/1994 at 01:08:24, a magnitude 4.2 (4.2 MB, Depth: 6.2 mi) earthquake occurred 142.4 miles away from Destrehan center On 5/17/2012 at 08:12:00, a magnitude 4.8 (4.8 MW, Depth: 3.1 mi) earthquake occurred 273.4 miles away from Destrehan center On 1/18/1999 at 07:00:53, a magnitude 4.8 (4.8 MB, 4.0 LG, Depth: 0.6 mi) earthquake occurred 300.5 miles away from Destrehan center Magnitude types: regional Lg-wave magnitude (LG), body-wave magnitude (MB), surface-wave magnitude (MS), moment magnitude (MW) Natural disasters: The number of natural disasters in St. Charles Parish (6) is a lot smaller than the US average (15).Major Disasters (Presidential) Declared: 2Hurricanes: 3, Flood: 1, Storm: 1, Tropical Storm: 1, Other: 1 (Note: some incidents may be assigned to more than one category). Hospitals and medical centers in Destrehan: ST CHARLES COMMUNITY HOME (336 RIVER OAKS) HOLISTIC HOME HEALTH CARE INC (12598 RIVER ROAD)
ORMOND NURSING AND CARE CENTER (22 PLANTATION ROAD)
Amtrak station near Destrehan: 18 miles: NEW ORLEANS (1001 LOYOLA AVE.) Services: ticket office, fully wheelchair accessible, enclosed waiting area, public restrooms, public payphones, snack bar, paid short-term parking, paid long-term parking, call for car rental service, taxi stand, intercity bus service, public transit connection.
Operable nuclear power plant near Destrehan:
5 miles: Waterford 3 in Taft, LA.
Colleges/universities with over 2000 students nearest to Destrehan:
Tulane University of Louisiana (about 15 miles; New Orleans, LA ; Full-time enrollment: 11,089)
Loyola University New Orleans (about 16 miles; New Orleans, LA ; FT enrollment: 3,912)
Xavier University of Louisiana (about 16 miles; New Orleans, LA ; FT enrollment: 2,492)
Delgado Community College (about 16 miles; New Orleans, LA ; FT enrollment: 12,843)
University of New Orleans (about 19 miles; New Orleans, LA ; FT enrollment: 8,201)
Nicholls State University (about 29 miles; Thibodaux, LA ; FT enrollment: 5,997)
Southeastern Louisiana University (about 39 miles; Hammond, LA ; FT enrollment: 12,713)
Public high school in Destrehan:
Public elementary/middle schools in Destrehan:
Private elementary/middle school in Destrehan: ST CHARLES BORROMEO SCHOOL Students: 377, Location: 13396 RIVER RD, Grades: KG-8)
See full list of schools located in Destrehan
Notable locations in Destrehan: (A) , Ormand Landing (B) , Ormond Country Club (C) , Ormond Landing (D) , Saint Charles Parish Sheriff's Office - Training (E) , Destrehan Plantation (F) , Saint Charles Parish Library East Regional Branch (G) , East Saint Charles Volunteer Fire Department (H) , Ormond Nursing and Care Center (I) , East Saint Charles Volunteer Fire Department (J) . Display/hide their locations on the map
Shopping Center: (1) . Display/hide its location on the map
Churches in Destrehan include: (A) , Saint Charles Church (B) . Display/hide their locations on the map
Cemetery: (1) . Display/hide its location on the map
Park in Destrehan: (1) . Display/hide its location on the map
Birthplace of: Shelley Hennig - Beauty pageant winner, Darryl Richard - Football player, Chris Brown (fullback) - Football player, Chris Bullock - College football player (Bowling Green Falcons), Trey Montgomery - College basketball player (Samford Bulldogs).
St. Charles Parish has a predicted average indoor radon screening level less than 2 pCi/L (pico curies per liter) - Low Potential Average household size: This place:
2.9 peopleLouisiana:
2.5 people
Percentage of family households: This place:
81.7%Whole state:
67.1%
Percentage of households with unmarried partners: This place:
5.9%Whole state:
6.8%
Likely homosexual households (counted as self-reported same-sex unmarried-partner households)
Lesbian couples: 0.5% of all households Gay men: 0.3% of all households
2 people in other noninstitutional facilities in 2010People in group quarters in Destrehan in 2000:
164 people in nursing homes
19 people in crews of maritime vessels
3 people in homes for the mentally retarded
Banks with branches in Destrehan (2011 data):
JPMorgan Chase Bank, National Association: Ormond Branch at 12515 Airline Highway, branch established on 1988/07/25. Info updated 2011/11/10: Bank assets: $1,811,678.0 mil, Deposits: $1,190,738.0 mil, headquarters in Columbus, OH, positive income , International Specialization, 5577 total offices , Holding Company: Jpmorgan Chase & Co.
Capital One, National Association: Destrehan Branch at 13524 River Road, branch established on 1969/10/15. Info updated 2011/07/01: Bank assets: $133,477.8 mil, Deposits: $97,063.7 mil, headquarters in Mclean, VA, positive income , 984 total offices , Holding Company: Capital One Financial Corporation
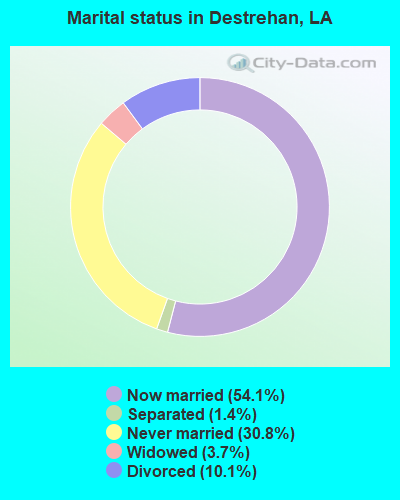
For population 15 years and over in Destrehan:
Never married: 30.8%Now married: 54.1%Separated: 1.4%Widowed: 3.7%Divorced: 10.1% For population 25 years and over in Destrehan:
High school or higher: 92.4%Bachelor's degree or higher: 43.7%Graduate or professional degree: 11.6%Unemployed: 2.4%Mean travel time to work (commute): 23.5 minutes
Education Gini index (Inequality in education) Here:
10.6Louisiana average:
11.9
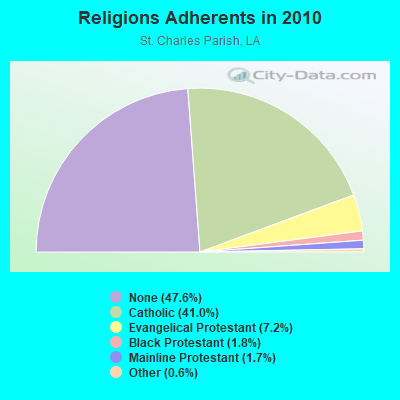
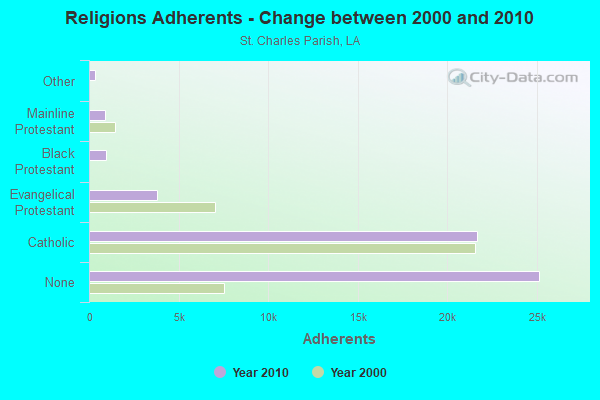
Religion statistics for Destrehan, LA (based on St. Charles Parish data)
Religion Adherents Congregations Catholic 21,657 8 Evangelical Protestant 3,812 19 Black Protestant 943 6 Mainline Protestant 910 4 Other 328 2 None 25,130 -
Source: Clifford Grammich, Kirk Hadaway, Richard Houseal, Dale E.Jones, Alexei Krindatch, Richie Stanley and Richard H.Taylor. 2012. 2010 U.S.Religion Census: Religious Congregations & Membership Study. Association of Statisticians of American Religious Bodies. Jones, Dale E., et al. 2002. Congregations and Membership in the United States 2000. Nashville, TN: Glenmary Research Center. Graphs represent county-level data
Food Environment Statistics: Number of grocery stores : 9This county :
1.73 / 10,000 pop.State :
2.56 / 10,000 pop.
Number of supercenters and club stores : 1St. Charles Parish :
0.19 / 10,000 pop.State :
0.18 / 10,000 pop.
Number of convenience stores (no gas) : 6This county :
1.15 / 10,000 pop.Louisiana :
1.29 / 10,000 pop.
Number of convenience stores (with gas) : 24Here :
4.62 / 10,000 pop.Louisiana :
4.49 / 10,000 pop.
Number of full-service restaurants : 26This county :
5.00 / 10,000 pop.Louisiana :
5.92 / 10,000 pop.
Adult obesity rate : St. Charles Parish :
32.2%State :
29.2%
Low-income preschool obesity rate : Here :
14.6%Louisiana :
13.7%
Health and Nutrition: Healthy diet rate : Destrehan:
53.1%State:
49.4%
Average overall health of teeth and gums : This city:
53.5%Louisiana:
46.5%
People feeling badly about themselves : Destrehan:
20.9%Louisiana:
20.3%
People not drinking alcohol at all : Average hours sleeping at night : Overweight people : Destrehan:
35.8%Louisiana:
34.5%
General health condition : Destrehan:
60.6%Louisiana:
55.8%
Average condition of hearing : This city:
82.1%Louisiana:
80.2%
More about Health and Nutrition of Destrehan, LA Residents
Businesses in Destrehan, LA
Name Count Name Count
Ace Hardware 1 FedEx 3 Burger King 1 KFC 1 CVS 1 MasterBrand Cabinets 1 Circle K 1 McDonald's 1 Curves 1 Papa John's Pizza 1 DHL 1 Popeyes 1 Decora Cabinetry 1 Taco Bell 1 Domino's Pizza 1 UPS 1
Strongest AM radio stations in Destrehan:
WWL (870 AM; 50 kW; NEW ORLEANS, LA; Owner: ENTERCOM NEW ORLEANS LICENSE, LLC)
WFNO (830 AM; 5 kW; NORCO, LA; Owner: WFNO, L.L.C.)
WLNO (1060 AM; 50 kW; NEW ORLEANS, LA; Owner: COMMUNICOM CO. OF LOUISIANA, L.P.)
WTIX (690 AM; 10 kW; NEW ORLEANS, LA; Owner: WTIX, INC.)
WYLD (940 AM; 10 kW; NEW ORLEANS, LA; Owner: CLEAR CHANNEL BROADCASTING LICENSES, INC.)
WVOG (600 AM; 1 kW; NEW ORLEANS, LA; Owner: F.W. ROBERT BROADCASTING CO., INC.)
WSMB (1350 AM; 5 kW; NEW ORLEANS, LA; Owner: ENTERCOM NEW ORLEANS LICENSE, LLC)
WODT (1280 AM; 5 kW; NEW ORLEANS, LA; Owner: CLEAR CHANNEL BROADCASTING LICENSES, INC.)
WOMN (1110 AM; daytime; 30 kW; FRANKLINTON, LA; Owner: PITTMAN BROADCASTING SERVICES, LLC.)
KTIB (640 AM; 5 kW; THIBODAUX, LA; Owner: LA TERR BROADCASTING CORPORATION)
WBYU (1450 AM; 1 kW; NEW ORLEANS, LA; Owner: ABC, INC.)
WSHO (800 AM; 1 kW; NEW ORLEANS, LA; Owner: SHADOWLANDS COMMUNICATIONS, L.L.C.)
WGSO (990 AM; 1 kW; NEW ORLEANS, LA; Owner: WGSO, L.L.C.)
Strongest FM radio stations in Destrehan:
KSTE-FM (104.1 FM; HOUMA, LA; Owner: CLEAR CHANNEL BROADCASTING LICENSES, INC.)
WCKW-FM (92.3 FM; LAPLACE, LA; Owner: 222 CORPORATION)
WPRF (94.9 FM; RESERVE, LA; Owner: CITADEL BROADCASTING COMPANY)
WQUE-FM (93.3 FM; NEW ORLEANS, LA; Owner: CLEAR CHANNEL BROADCASTING LICENSES, INC.)
WYLD-FM (98.5 FM; NEW ORLEANS, LA; Owner: CLEAR CHANNEL BROADCASTING LICENSES, INC.)
WLMG (101.9 FM; NEW ORLEANS, LA; Owner: ENTERCOM NEW ORLEANS LICENSE, LLC)
WEZB (97.1 FM; NEW ORLEANS, LA; Owner: ENTERCOM NEW ORLEANS LICENSE, LLC)
WTKL (95.7 FM; NEW ORLEANS, LA; Owner: ENTERCOM NEW ORLEANS LICENSE, LLC)
WNOE-FM (101.1 FM; NEW ORLEANS, LA; Owner: CLEAR CHANNEL BROADCASTING LICENSES, INC.)
WRNO-FM (99.5 FM; NEW ORLEANS, LA; Owner: CLEAR CHANNEL BROADCASTING LICENSES, INC.)
WWNO (89.9 FM; NEW ORLEANS, LA; Owner: LOUISIANA STATE UNIV & A & M COLLEGE)
KCIL (107.5 FM; HOUMA, LA; Owner: GUARANTY BROADCASTING COMPANY OF HOUMA, LLC)
WKZN (105.3 FM; KENNER, LA; Owner: ENTERCOM NEW ORLEANS LICENSE, LLC)
KLRZ (100.3 FM; LAROSE, LA; Owner: COASTAL BROADCASTING OF LAROSE, INC.)
WTIX-FM (94.3 FM; GALLIANO, LA; Owner: FLEUR DE LIS BROADCASTING, INC.)
WWOZ (90.7 FM; NEW ORLEANS, LA; Owner: FRIENDS OF WWOZ, INC.)
WBSN-FM (89.1 FM; NEW ORLEANS, LA; Owner: PROVIDENCE EDUCATIONAL FOUNDATION)
WRBH (88.3 FM; NEW ORLEANS, LA; Owner: RADIO FOR THE BLIND & HANDICAPPED, INC.)
KMEZ (102.9 FM; BELLE CHASSE, LA; Owner: CITADEL BROADCASTING COMPANY)
KKND (106.7 FM; PORT SULPHUR, LA; Owner: CITADEL BROADCASTING COMPANY)
TV broadcast stations around Destrehan:
WLPN-LP (Channel 61; NEW ORLEANS, LA; Owner: GLENN R. & KARIN A. PLUMMER)
WWL-TV (Channel 4; NEW ORLEANS, LA; Owner: WWL-TV, INC.)
WHNO (Channel 20; NEW ORLEANS, LA; Owner: LESEA BROADCASTING CORPORATION)
KNOV-LP (Channel 57; NEW ORLEANS, LA; Owner: BEACH TV PROPERTIES, INC.)
K66FW (Channel 14; NEW ORLEANS, LA; Owner: VENTANA TELEVISION, INC.)
WLAE-TV (Channel 32; NEW ORLEANS, LA; Owner: EDUCATIONAL BROADCASTING FOUNDATION, INC.)
WGNO (Channel 26; NEW ORLEANS, LA; Owner: TRIBUNE TELEVISION NEW ORLEANS, INC.)
WNOL-TV (Channel 38; NEW ORLEANS, LA; Owner: TRIBUNE TELEVISION NEW ORLEANS, INC.)
WYES-TV (Channel 12; NEW ORLEANS, LA; Owner: GREATER NEW ORLEANS ED TV FOUNDATION)
WBXN-CA (Channel 10; NEW ORLEANS, LA; Owner: THE BOX WORLDWIDE LLC)
WVUE (Channel 8; NEW ORLEANS, LA; Owner: EMMIS TELEIVISION LICENSE CORPORATION)
WPXL (Channel 49; NEW ORLEANS, LA; Owner: FLINN BROADCASTING CORPORATION)
WDSU (Channel 6; NEW ORLEANS, LA; Owner: NEW ORLEANS HEARST-ARGYLE TELEVISION, INC.)
WBRZ-TV (Channel 2; BATON ROUGE, LA; Owner: LOUISIANA TELEVISION BROADCASTING, LLC)
K59DG (Channel 59; NEW ORLEANS, LA; Owner: TRINITY BROADCCASTING NETWORK)
WUPL (Channel 54; SLIDELL, LA; Owner: UPN TELEVISION STATIONS INC.)
WGMB (Channel 44; BATON ROUGE, LA; Owner: COMCORP OF BATON ROUGE LICENSE CORP.)
FCC Registered Antenna Towers: 10 (
See the full list of FCC Registered Antenna Towers in Destrehan )
FCC Registered Broadcast Land Mobile Towers: 2
Lat: 29.970083 Lon: -90.373167, Call Sign: WPZV549, Assigned Frequencies: 451.287 MHz, 451.337 MHz, 451.762 MHz, 467.387 MHz, Grant Date: 03/23/2004, Expiration Date: 03/23/2014, Cancellation Date: 05/24/2014, Certifier: Paul Alley, Registrant: Cara Enterprises Inc, Salt Lake City, UT 84117-0503, Phone: (801) 278-9728, Fax: (801) 278-7239Lat: 29.971000 Lon: -90.375722, Call Sign: WRKY217, Assigned Frequencies: 464.075 MHz, 466.700 MHz, 468.212 MHz, 469.312 MHz, 469.937 MHz, Grant Date: 03/03/2021, Expiration Date: 03/03/2031, Certifier: Catherine C Duplantis, Registrant: Shreveport Communications, 933 Stoner Avenue, Shreveport, LA 71101, Phone: (318) 425-5977, Fax: (318) 227-8955, Email:
FCC Registered Microwave Towers: 1
DESTREHAN, 398 Jonathan St (Lat: 29.946694 Lon: -90.346472), Type: Mtower, Structure height: 30.5 m, Call Sign: WQXH977, Assigned Frequencies: 6286.19 MHz, 6286.19 MHz, 6286.19 MHz, 6286.19 MHz, Grant Date: 03/10/2016, Expiration Date: 03/10/2026, Certifier: Steve Paquette, Registrant: Entergy Services, LLC, 425 West Capitol Ave., Little Rock, AR 72203-0551, Phone: (501) 377-5609, Email:
FCC Registered Maritime Coast & Aviation Ground Towers: 2
Office Bldg Of Plant 65 Ft From Hwy 48 (Lat: 29.937694 Lon: -90.336194), Type: Building, Overall height: 26 m, Call Sign: KUF727, Licensee ID: L00004197, Assigned Frequencies: 156.325 MHz, 156.800 MHz, 157.025 MHz, 156.375 MHz, 156.450 MHz, Grant Date: 02/25/2003, Expiration Date: 02/01/2013, Cancellation Date: 04/08/2013, Registrant: Bunge North America, Inc., 11720 Borman Dr, Saint Louis, MO 63146 12701 River Rd (Lat: 29.941861 Lon: -90.372306), Type: Building, Overall height: 18 m, Call Sign: WHD859, Assigned Frequencies: 156.375 MHz, 156.450 MHz, 156.500 MHz, 156.800 MHz, Grant Date: 01/17/2015, Expiration Date: 04/13/2025, Registrant: Archer Daniels Midland Company, 4666 Faries Parkway, Decatur, IL 62526, Phone: (217) 424-5200, Email:
FCC Registered Amateur Radio Licenses: 33 (
See the full list of FCC Registered Amateur Radio Licenses in Destrehan )
FAA Registered Aircraft: 11 (
See the full list of FAA Registered Aircraft in Destrehan )
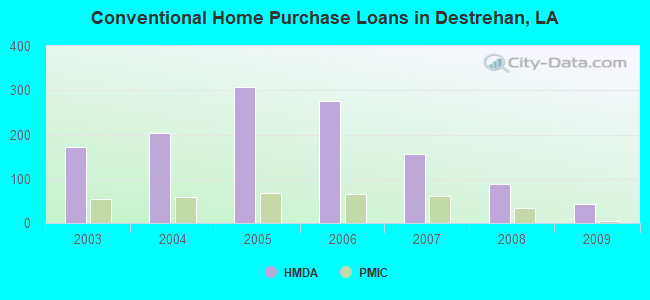
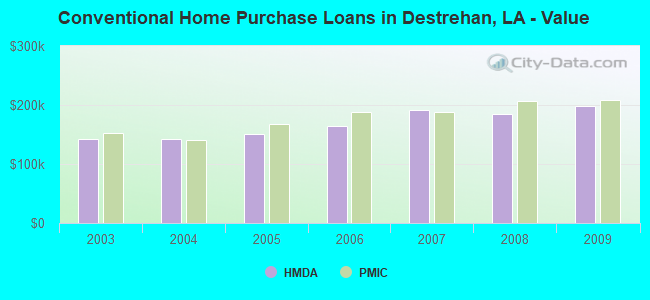
Home Mortgage Disclosure Act Aggregated Statistics For Year 2009(Based on 1 full and 2 partial tracts) A) FHA, FSA/RHS & VA B) Conventional C) Refinancings D) Home Improvement Loans F) Non-occupant Loans on G) Loans On Manufactured Number Average Value Number Average Value Number Average Value Number Average Value Number Average Value Number Average Value
LOANS ORIGINATED 56 $180,192 44 $198,115 261 $192,827 18 $84,502 11 $134,033 0 $0 APPLICATIONS APPROVED, NOT ACCEPTED 4 $127,240 3 $183,227 29 $168,176 2 $47,310 1 $121,960 0 $0 APPLICATIONS DENIED 10 $209,122 11 $160,945 102 $172,257 13 $56,489 9 $168,931 1 $82,140 APPLICATIONS WITHDRAWN 16 $189,168 5 $220,374 47 $174,544 2 $122,085 1 $75,840 0 $0 FILES CLOSED FOR INCOMPLETENESS 4 $162,822 2 $351,495 20 $162,177 4 $74,790 2 $124,425 0 $0
Aggregated Statistics For Year 2008(Based on 1 full and 2 partial tracts) A) FHA, FSA/RHS & VA B) Conventional C) Refinancings D) Home Improvement Loans F) Non-occupant Loans on G) Loans On Manufactured Number Average Value Number Average Value Number Average Value Number Average Value Number Average Value Number Average Value
LOANS ORIGINATED 31 $182,163 88 $184,698 168 $165,239 30 $67,329 15 $93,794 1 $34,310 APPLICATIONS APPROVED, NOT ACCEPTED 1 $196,080 12 $188,485 25 $137,614 6 $52,290 2 $126,905 0 $0 APPLICATIONS DENIED 8 $194,815 29 $214,675 101 $183,345 36 $89,046 10 $123,757 4 $71,755 APPLICATIONS WITHDRAWN 4 $156,820 6 $203,820 46 $199,298 7 $107,844 3 $107,043 0 $0 FILES CLOSED FOR INCOMPLETENESS 1 $160,000 3 $216,380 12 $184,914 2 $29,060 0 $0 0 $0
Aggregated Statistics For Year 2007(Based on 1 full and 2 partial tracts) A) FHA, FSA/RHS & VA B) Conventional C) Refinancings D) Home Improvement Loans F) Non-occupant Loans on G) Loans On Manufactured Number Average Value Number Average Value Number Average Value Number Average Value Number Average Value Number Average Value
LOANS ORIGINATED 12 $196,329 155 $190,780 182 $165,742 61 $63,209 24 $153,047 1 $14,000 APPLICATIONS APPROVED, NOT ACCEPTED 1 $123,000 15 $169,069 41 $149,193 14 $52,618 2 $61,970 0 $0 APPLICATIONS DENIED 1 $172,110 20 $154,624 105 $189,146 40 $93,807 2 $94,210 5 $49,672 APPLICATIONS WITHDRAWN 0 $0 13 $126,354 46 $157,598 12 $118,093 2 $171,325 0 $0 FILES CLOSED FOR INCOMPLETENESS 0 $0 4 $184,945 26 $174,501 0 $0 2 $316,315 0 $0
Aggregated Statistics For Year 2006(Based on 1 full and 2 partial tracts) A) FHA, FSA/RHS & VA B) Conventional C) Refinancings D) Home Improvement Loans F) Non-occupant Loans on G) Loans On Manufactured Number Average Value Number Average Value Number Average Value Number Average Value Number Average Value Number Average Value
LOANS ORIGINATED 13 $153,722 275 $164,208 224 $146,634 50 $48,458 34 $135,446 1 $23,550 APPLICATIONS APPROVED, NOT ACCEPTED 0 $0 43 $151,932 41 $122,001 12 $58,827 10 $129,639 5 $48,304 APPLICATIONS DENIED 0 $0 60 $136,588 116 $133,862 42 $62,011 6 $90,135 6 $50,825 APPLICATIONS WITHDRAWN 0 $0 21 $167,320 91 $153,097 5 $145,058 1 $116,000 0 $0 FILES CLOSED FOR INCOMPLETENESS 1 $184,980 8 $146,798 31 $160,823 0 $0 1 $90,000 0 $0
Aggregated Statistics For Year 2005(Based on 1 full and 2 partial tracts) A) FHA, FSA/RHS & VA B) Conventional C) Refinancings D) Home Improvement Loans E) Loans on Dwellings For 5+ Families F) Non-occupant Loans on G) Loans On Manufactured Number Average Value Number Average Value Number Average Value Number Average Value Number Average Value Number Average Value Number Average Value
LOANS ORIGINATED 30 $143,713 307 $151,478 219 $154,207 41 $87,534 4 $354,930 30 $125,372 1 $88,600 APPLICATIONS APPROVED, NOT ACCEPTED 0 $0 34 $126,003 56 $127,304 12 $50,982 0 $0 7 $73,579 3 $28,020 APPLICATIONS DENIED 4 $125,072 40 $107,856 148 $126,437 26 $79,122 0 $0 15 $94,209 11 $48,323 APPLICATIONS WITHDRAWN 2 $115,610 34 $147,676 102 $158,405 19 $165,053 0 $0 5 $124,580 0 $0 FILES CLOSED FOR INCOMPLETENESS 1 $149,000 11 $160,074 39 $165,566 2 $154,220 0 $0 1 $83,240 0 $0
Aggregated Statistics For Year 2004(Based on 1 full and 2 partial tracts) A) FHA, FSA/RHS & VA B) Conventional C) Refinancings D) Home Improvement Loans E) Loans on Dwellings For 5+ Families F) Non-occupant Loans on G) Loans On Manufactured Number Average Value Number Average Value Number Average Value Number Average Value Number Average Value Number Average Value Number Average Value
LOANS ORIGINATED 45 $137,194 204 $141,649 330 $123,620 54 $47,707 1 $36,070 31 $84,989 1 $68,790 APPLICATIONS APPROVED, NOT ACCEPTED 0 $0 12 $124,212 74 $134,198 12 $35,686 0 $0 1 $168,320 2 $41,600 APPLICATIONS DENIED 3 $123,937 28 $148,658 215 $115,239 38 $43,681 0 $0 7 $117,787 8 $45,976 APPLICATIONS WITHDRAWN 1 $153,000 25 $155,167 99 $136,115 6 $144,547 0 $0 3 $97,160 0 $0 FILES CLOSED FOR INCOMPLETENESS 2 $142,435 7 $124,460 51 $142,633 3 $88,707 0 $0 4 $162,382 1 $60,000
Aggregated Statistics For Year 2003(Based on 1 full and 2 partial tracts) A) FHA, FSA/RHS & VA B) Conventional C) Refinancings D) Home Improvement Loans F) Non-occupant Loans on Number Average Value Number Average Value Number Average Value Number Average Value Number Average Value
LOANS ORIGINATED 39 $127,108 172 $142,969 778 $129,314 59 $31,720 42 $106,445 APPLICATIONS APPROVED, NOT ACCEPTED 0 $0 14 $174,447 93 $116,710 11 $23,113 3 $83,160 APPLICATIONS DENIED 5 $98,526 20 $118,132 256 $114,448 32 $24,173 14 $102,111 APPLICATIONS WITHDRAWN 4 $112,688 16 $132,872 105 $123,671 2 $62,430 0 $0 FILES CLOSED FOR INCOMPLETENESS 2 $73,555 2 $183,350 33 $128,125 1 $27,750 1 $170,340
Detailed HMDA statistics for the following Tracts:
0622.00
, 0623.01 , 0623.02
Private Mortgage Insurance Companies Aggregated Statistics For Year 2009(Based on 1 full and 2 partial tracts) A) Conventional B) Refinancings Number Average Value Number Average Value
LOANS ORIGINATED 5 $208,118 12 $190,049 APPLICATIONS APPROVED, NOT ACCEPTED 8 $224,438 8 $245,040 APPLICATIONS DENIED 4 $214,822 1 $225,680 APPLICATIONS WITHDRAWN 0 $0 2 $202,840 FILES CLOSED FOR INCOMPLETENESS 0 $0 0 $0
Aggregated Statistics For Year 2008(Based on 1 full and 2 partial tracts) A) Conventional B) Refinancings C) Non-occupant Loans on Number Average Value Number Average Value Number Average Value
LOANS ORIGINATED 35 $207,118 17 $210,738 2 $132,055 APPLICATIONS APPROVED, NOT ACCEPTED 9 $224,539 14 $214,289 1 $167,000 APPLICATIONS DENIED 4 $206,508 0 $0 2 $174,000 APPLICATIONS WITHDRAWN 1 $268,220 1 $342,210 0 $0 FILES CLOSED FOR INCOMPLETENESS 0 $0 0 $0 0 $0
Aggregated Statistics For Year 2007(Based on 1 full and 2 partial tracts) A) Conventional B) Refinancings C) Non-occupant Loans on Number Average Value Number Average Value Number Average Value
LOANS ORIGINATED 62 $188,384 19 $213,875 1 $121,160 APPLICATIONS APPROVED, NOT ACCEPTED 15 $178,985 9 $174,447 0 $0 APPLICATIONS DENIED 1 $266,370 2 $204,865 0 $0 APPLICATIONS WITHDRAWN 1 $268,220 0 $0 0 $0 FILES CLOSED FOR INCOMPLETENESS 0 $0 0 $0 0 $0
Aggregated Statistics For Year 2006(Based on 1 full and 2 partial tracts) A) Conventional B) Refinancings C) Non-occupant Loans on Number Average Value Number Average Value Number Average Value
LOANS ORIGINATED 65 $187,834 17 $187,745 2 $160,925 APPLICATIONS APPROVED, NOT ACCEPTED 6 $171,900 7 $175,969 0 $0 APPLICATIONS DENIED 1 $189,600 0 $0 0 $0 APPLICATIONS WITHDRAWN 2 $160,555 0 $0 0 $0 FILES CLOSED FOR INCOMPLETENESS 0 $0 0 $0 0 $0
Aggregated Statistics For Year 2005(Based on 1 full and 2 partial tracts) A) Conventional B) Refinancings C) Non-occupant Loans on Number Average Value Number Average Value Number Average Value
LOANS ORIGINATED 67 $168,126 12 $154,061 5 $146,496 APPLICATIONS APPROVED, NOT ACCEPTED 10 $156,721 7 $229,219 1 $161,860 APPLICATIONS DENIED 1 $166,550 0 $0 0 $0 APPLICATIONS WITHDRAWN 3 $253,480 2 $236,295 0 $0 FILES CLOSED FOR INCOMPLETENESS 0 $0 0 $0 0 $0
Aggregated Statistics For Year 2004(Based on 1 full and 2 partial tracts) A) Conventional B) Refinancings C) Non-occupant Loans on Number Average Value Number Average Value Number Average Value
LOANS ORIGINATED 58 $141,369 25 $165,525 4 $91,102 APPLICATIONS APPROVED, NOT ACCEPTED 7 $194,097 10 $135,484 1 $139,660 APPLICATIONS DENIED 0 $0 1 $148,900 0 $0 APPLICATIONS WITHDRAWN 7 $172,296 2 $182,865 2 $93,875 FILES CLOSED FOR INCOMPLETENESS 0 $0 0 $0 0 $0
Aggregated Statistics For Year 2003(Based on 1 full and 2 partial tracts) A) Conventional B) Refinancings C) Non-occupant Loans on Number Average Value Number Average Value Number Average Value
LOANS ORIGINATED 54 $152,403 75 $148,931 7 $114,054 APPLICATIONS APPROVED, NOT ACCEPTED 9 $112,694 20 $157,813 1 $46,240 APPLICATIONS DENIED 0 $0 0 $0 0 $0 APPLICATIONS WITHDRAWN 2 $202,590 3 $129,200 1 $46,240 FILES CLOSED FOR INCOMPLETENESS 0 $0 0 $0 0 $0
Detailed PMIC statistics for the following Tracts:
0622.00
, 0623.01 , 0623.02
Most common first names in Destrehan, LA among deceased individuals Name Count Lived (average)
Joseph 24 73.2 years John 20 68.7 years Mary 18 78.0 years William 16 70.6 years Charles 16 74.5 years Robert 15 70.2 years James 14 74.5 years George 13 69.3 years Edward 11 74.7 years Marie 11 81.7 years
Most common last names in Destrehan, LA among deceased individuals Last name Count Lived (average)
Schexnaydre 20 82.8 years Smith 16 76.2 years Haydel 9 78.9 years Zeringue 9 80.6 years Mire 9 79.9 years Miller 8 67.2 years Vitrano 8 78.9 years Faucheux 7 82.1 years Johnson 7 72.3 years Williams 7 65.6 years
Destrehan compared to Louisiana state average:
Median household income above state average. Median house value above state average. Unemployed percentage significantly below state average. Black race population percentage below state average. Renting percentage below state average. Length of stay since moving in significantly above state average. Percentage of population with a bachelor's degree or higher significantly above state average.
#11 on the list of "Top 101 cities with the largest percentage of people in crews of maritime vessels (population 1,000+)"
#21 on the list of "Top 101 cities with largest percentage of females in occupations: fire fighting and prevention workers including supervisors (population 5,000+)"
#71 on the list of "Top 101 cities with the most residents born in Sierra Leone (population 500+)"
#55 (70047) on the list of "Top 101 zip codes with the largest percentage of French first ancestries (pop 5,000+)"
#69 on the list of "Top 101 counties with the lowest Ozone (1-hour) air pollution readings in 2012 (ppm)"
Top Patent Applicants
Vijay T. John (6)
Vijay John (3)
R. Scott Dailey (2)
Ben Gary (2)
Frank House (2)
Bruce Burkenstock, Sr. (2)
Jacqueline Awasthi (2)
David Bogle (1)
Michael J. Brady (1)
David W. Butler (1)
Total of 27 patent applications in 2008-2024.


 Recent articles from our blog. Our writers, many of them Ph.D. graduates or candidates, create easy-to-read articles on a wide variety of topics.

 (7.8 miles
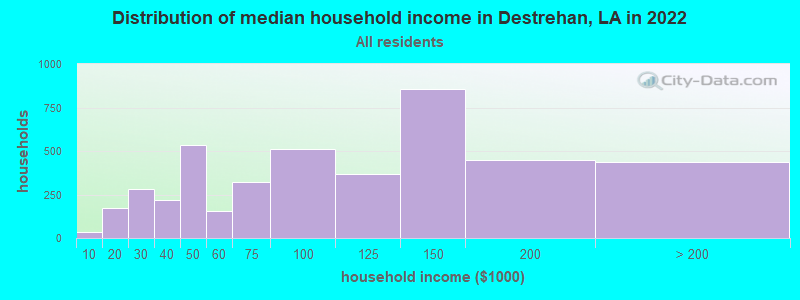


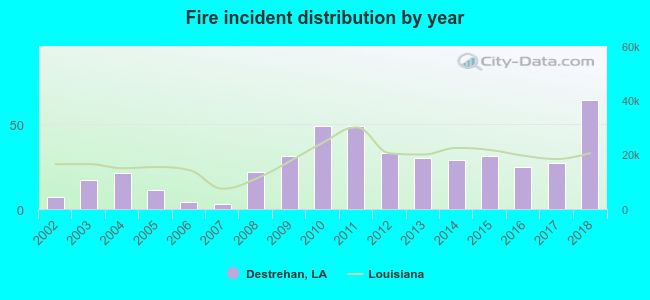 According to the data from the years 2002 - 2018 the average number of fire incidents per year is 27. The highest number of fire incidents - 64 took place in 2018, and the least - 3 in 2007. The data has a growing trend.
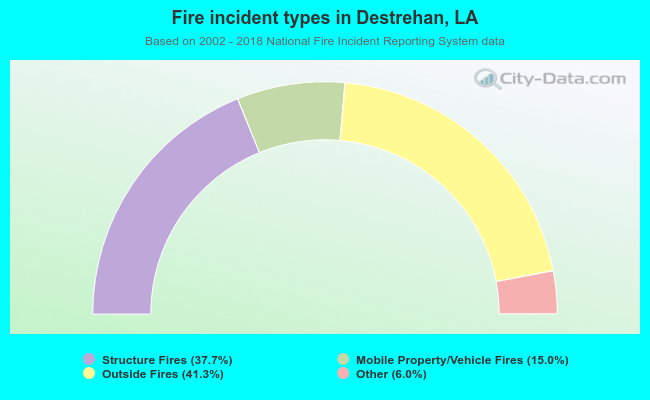 When looking into fire subcategories, the most incidents belonged to: Outside Fires (41.3%), and Structure Fires (37.7%).