East Cameron, Texas
Submit your own pictures of this place and show them to the world
- OSM Map
- General Map
- Google Map
- MSN Map

| Males: 10,462 | |
| Females: 10,417 |
| Median resident age: | 32.3 years |
| Texas median age: | 32.3 years |
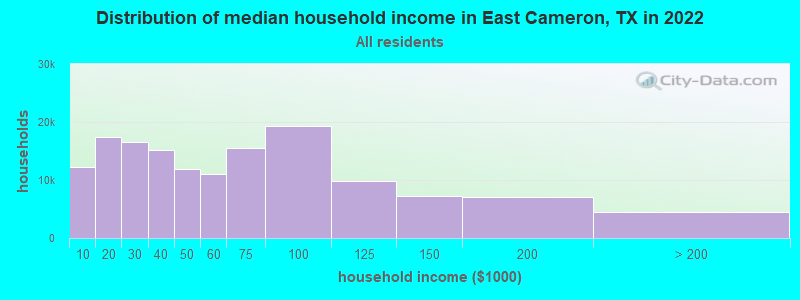
| East Cameron: | $54,191 |
| TX: | $72,284 |
Estimated per capita income in 2022: $27,814 (it was $13,992 in 2000)
East Cameron CCD income, earnings, and wages data
Estimated median house or condo value in 2022: $182,869 (it was $65,800 in 2000)
| East Cameron: | $182,869 |
| TX: | $275,400 |
Mean prices in 2022: all housing units: $173,938; detached houses: $176,561; townhouses or other attached units: $147,279; in 2-unit structures: $158,565; in 3-to-4-unit structures: $146,532; in 5-or-more-unit structures: $742,574; mobile homes: $53,814; occupied boats, rvs, vans, etc.: $31,861
Detailed information about poverty and poor residents in East Cameron, TX


- 12,34967.3%Hispanic
- 5,77031.4%White alone
- 820.4%Two or more races
- 580.3%Black alone
- 450.2%American Indian alone
- 380.2%Asian alone
- 70.04%Native Hawaiian and Other
Pacific Islander alone - 70.04%Other race alone
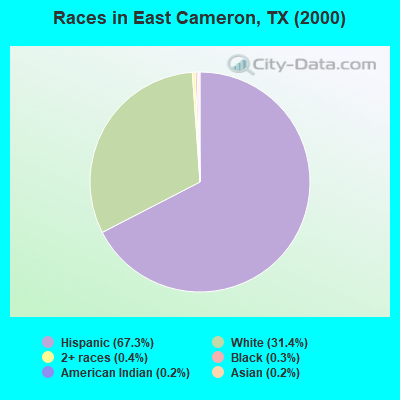
Races in East Cameron detailed stats: ancestries, foreign born residents, place of birth
 Recent articles from our blog. Our writers, many of them Ph.D. graduates or candidates, create easy-to-read articles on a wide variety of topics.
Current Local Time: CST time zone
Land area: 179.6 square miles.
Population density: 116 people per square mile (very low).

| East Cameron CCD: | 1.8% ($1,206) |
| Texas: | 1.8% ($1,393) |
Nearest city with pop. 50,000+: Brownsville, TX  (15.9 miles , pop. 139,722).
Nearest city with pop. 200,000+: Corpus Christi, TX (115.8 miles , pop. 277,454).
Nearest city with pop. 1,000,000+: San Antonio, TX (245.6 miles , pop. 1,144,646).
Nearest cities:
), ), ), )Latitude: 26.07 N, Longitude: 97.28 W
Area code commonly used in this area: 956

| Here: | 4.8% |
| Texas: | 3.5% |
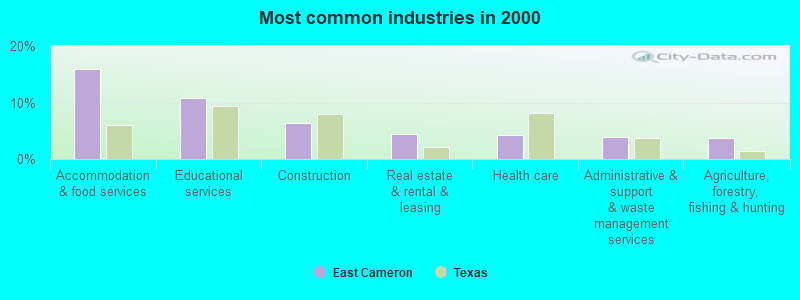
- Accommodation & food services (15.9%)
- Educational services (10.8%)
- Construction (6.4%)
- Real estate & rental & leasing (4.3%)
- Health care (4.2%)
- Administrative & support & waste management services (3.9%)
- Agriculture, forestry, fishing & hunting (3.8%)
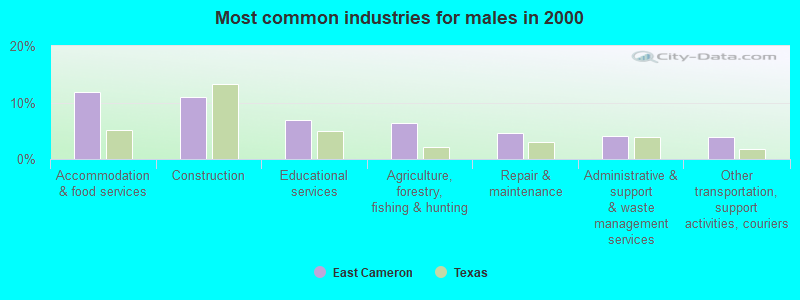
- Accommodation & food services (11.8%)
- Construction (10.9%)
- Educational services (7.0%)
- Agriculture, forestry, fishing & hunting (6.4%)
- Repair & maintenance (4.6%)
- Administrative & support & waste management services (4.1%)
- Other transportation, support activities, couriers (4.0%)
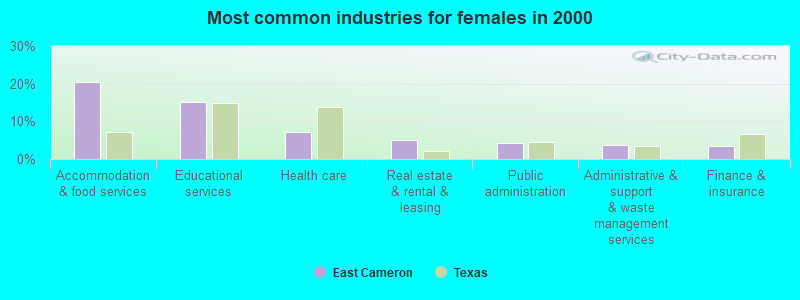
- Accommodation & food services (20.3%)
- Educational services (15.0%)
- Health care (7.3%)
- Real estate & rental & leasing (5.0%)
- Public administration (4.2%)
- Administrative & support & waste management services (3.8%)
- Finance & insurance (3.6%)
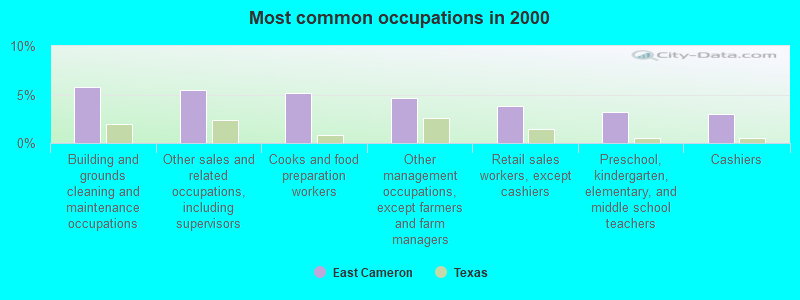
- Building and grounds cleaning and maintenance occupations (5.8%)
- Other sales and related occupations, including supervisors (5.5%)
- Cooks and food preparation workers (5.2%)
- Other management occupations, except farmers and farm managers (4.7%)
- Retail sales workers, except cashiers (3.8%)
- Preschool, kindergarten, elementary, and middle school teachers (3.2%)
- Cashiers (3.0%)
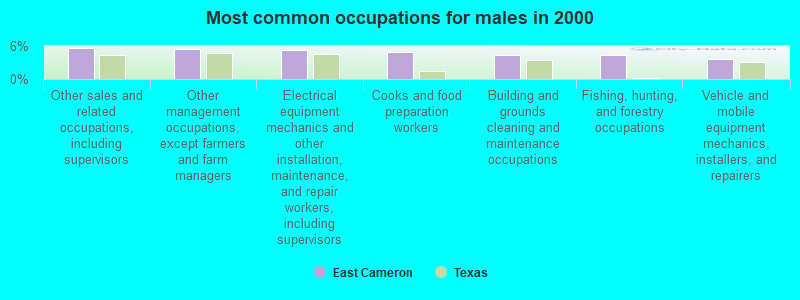
- Other sales and related occupations, including supervisors (5.6%)
- Other management occupations, except farmers and farm managers (5.5%)
- Electrical equipment mechanics and other installation, maintenance, and repair workers, including supervisors (5.3%)
- Cooks and food preparation workers (4.9%)
- Building and grounds cleaning and maintenance occupations (4.4%)
- Fishing, hunting, and forestry occupations (4.3%)
- Vehicle and mobile equipment mechanics, installers, and repairers (3.7%)
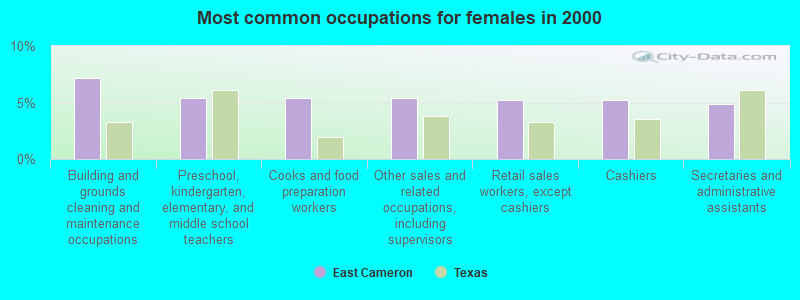
- Building and grounds cleaning and maintenance occupations (7.2%)
- Preschool, kindergarten, elementary, and middle school teachers (5.4%)
- Cooks and food preparation workers (5.4%)
- Other sales and related occupations, including supervisors (5.4%)
- Retail sales workers, except cashiers (5.3%)
- Cashiers (5.3%)
- Secretaries and administrative assistants (4.9%)
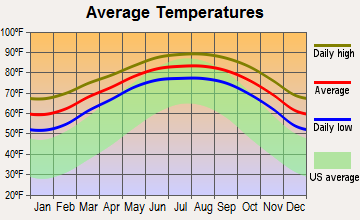
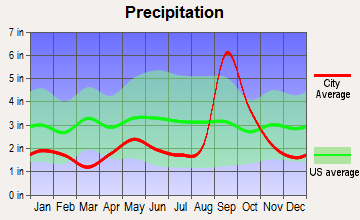
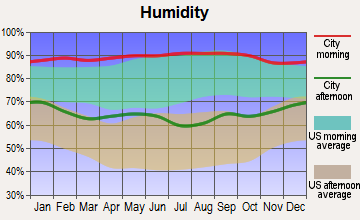
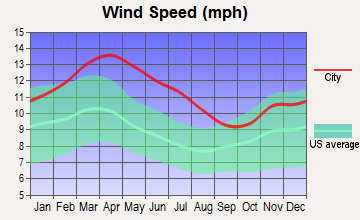
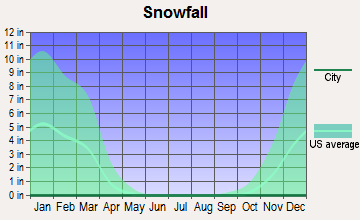
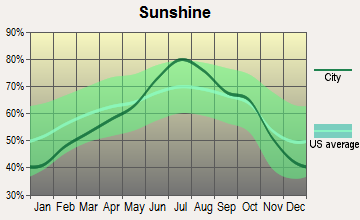
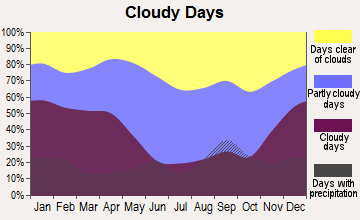
Average climate in East Cameron, Texas
Based on data reported by over 4,000 weather stations
(lower is better)
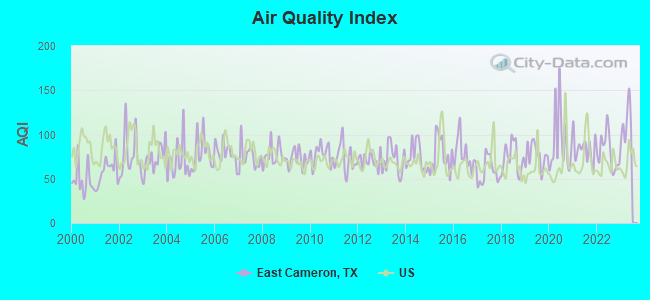
Air Quality Index (AQI) level in 2022 was 80.1. This is about average.
| City: | 80.1 |
| U.S.: | 72.6 |
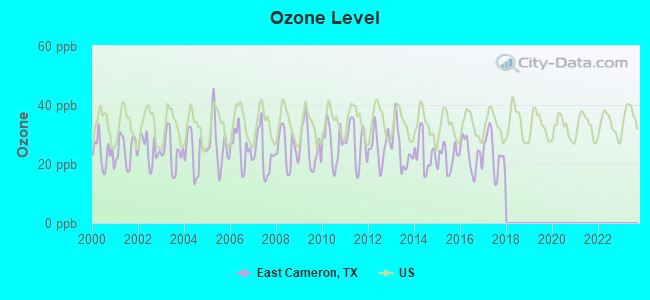
Ozone [ppb] level in 2017 was 23.7. This is significantly better than average. Closest monitor was 12.4 miles away from the city center.
| City: | 23.7 |
| U.S.: | 33.3 |
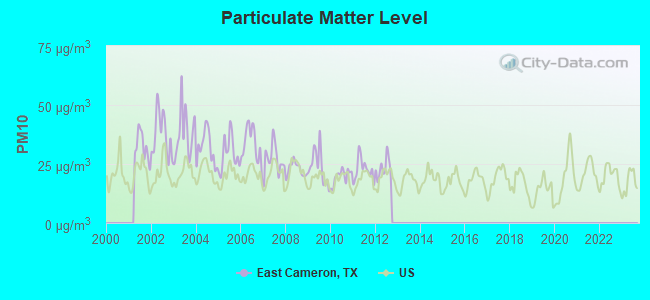
Particulate Matter (PM10) [µg/m3] level in 2012 was 23.1. This is worse than average. Closest monitor was 17.2 miles away from the city center.
| City: | 23.1 |
| U.S.: | 19.2 |
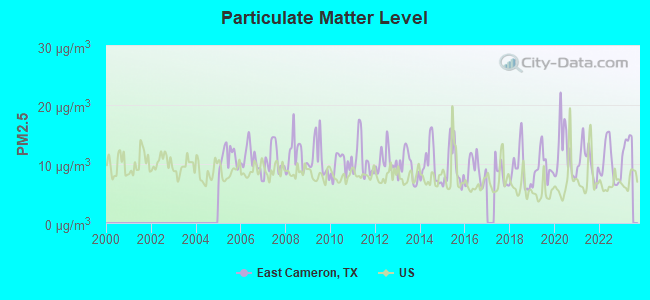
Particulate Matter (PM2.5) [µg/m3] level in 2022 was 9.92. This is worse than average. Closest monitor was 7.7 miles away from the city center.
| City: | 9.92 |
| U.S.: | 8.11 |
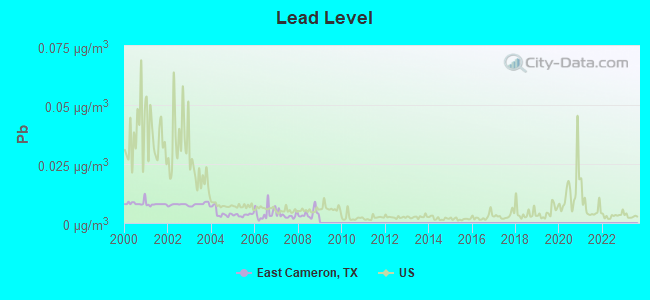
Lead (Pb) [µg/m3] level in 2008 was 0.00388. This is significantly better than average. Closest monitor was 4.6 miles away from the city center.
| City: | 0.00388 |
| U.S.: | 0.00931 |
Earthquake activity:
East Cameron-area historical earthquake activity is below Texas state average. It is 83% smaller than the overall U.S. average.On 10/20/2011 at 12:24:41, a magnitude 4.8 (4.8 MW, Depth: 3.1 mi, Class: Light, Intensity: IV - V) earthquake occurred 199.3 miles away from the city center
On 11/13/2017 at 11:23:01, a magnitude 3.9 (3.9 MD, Depth: 3.1 mi, Class: Light, Intensity: II - III) earthquake occurred 54.3 miles away from East Cameron center
On 4/25/2010 at 02:10:42, a magnitude 3.9 (3.9 MB, Depth: 3.1 mi) earthquake occurred 118.4 miles away from the city center
On 4/9/1993 at 12:29:19, a magnitude 4.3 (4.1 MB, 4.3 LG, Depth: 3.1 mi) earthquake occurred 196.4 miles away from the city center
On 3/24/1997 at 22:31:34, a magnitude 3.8 (3.8 LG, Depth: 3.1 mi) earthquake occurred 123.4 miles away from the city center
On 4/14/1995 at 00:32:56, a magnitude 5.7 (5.6 MB, 5.7 MS, 5.7 MW, Depth: 11.1 mi, Class: Moderate, Intensity: VI - VII) earthquake occurred 471.4 miles away from East Cameron center
Magnitude types: regional Lg-wave magnitude (LG), body-wave magnitude (MB), duration magnitude (MD), surface-wave magnitude (MS), moment magnitude (MW)
Natural disasters:
The number of natural disasters in Cameron County (23) is greater than the US average (15).Major Disasters (Presidential) Declared: 12
Emergencies Declared: 8
Causes of natural disasters: Hurricanes: 12, Floods: 7, Storms: 6, Tornadoes: 3, Winds: 2, Fire: 1, Heavy Rain: 1, Tropical Storm: 1, Other: 2 (Note: some incidents may be assigned to more than one category).
Hospitals and medical centers near East Cameron:
- VALLEY CARE HOME HEALTH SERVICES LLC (Home Health Center, about 13 miles away; BROWNSVILLE, TX)
- ODYSSEY HEALTHCARE OF SOUTH TEXAS (Hospital, about 14 miles away; BROWNSVILLE, TX)
- VALLEY REGIONAL MEDICAL CENTER (Nursing Home, about 14 miles away; BROWNSVILLE, TX)
- CASA LINDA GROUP HOME (Hospital, about 15 miles away; BROWNSVILLE, TX)
- INTERIM HEALTHCARE HOSPICE (Home Health Center, about 16 miles away; BROWNSVILLE, TX)
- SOUTH TEXAS REHABILTATION HOSPITAL (Hospital, about 16 miles away; BROWNSVILLE, TX)
- PTL HEALTH CARE INC (Home Health Center, about 16 miles away; BROWNSVILLE, TX)
Colleges/universities with over 2000 students nearest to East Cameron:
- The University of Texas at Brownsville (about 18 miles; Brownsville, TX; Full-time enrollment: 9,165)
- Texas State Technical College-Harlingen (about 26 miles; Harlingen, TX; FT enrollment: 3,700)
- The University of Texas-Pan American (about 58 miles; Edinburg, TX; FT enrollment: 16,766)
- South Texas College (about 62 miles; McAllen, TX; FT enrollment: 19,701)
- Texas A & M University-Kingsville (about 108 miles; Kingsville, TX; FT enrollment: 9,295)
- Texas A & M University-Corpus Christi (about 114 miles; Corpus Christi, TX; FT enrollment: 9,092)
- Del Mar College (about 118 miles; Corpus Christi, TX; FT enrollment: 5,213)
Points of interest:
Notable locations in East Cameron: Isla Blanca Cabana (A), Old Palmito Ranch (B), Old Tulosa Ranch Site (C), Palmito Hill Battlefield (D), Palmito Ranch (E), White Sands Marina (F), Sea Ranch Marina (G), Southpoint Marina (H), Mighty Minnow Marina (I), Anchor Marina (J), Cameron County Marina (K), Fisherman's Wharf Marina (L), Palmito Ranch Battlefield (M), Point Isabel Lighthouse (N), Holly Beach (O), La Coma Ranch (P), South Padre Island Fire Department (Q), Laguna Vista Volunteer Fire Department (R), Port Isabel Fire Department (S), Brownsville Fire Department Station 8 (T). Display/hide their locations on the map
Churches in East Cameron include: Island Baptist Church (A), Fisher of Men Lutheran Church (B), Portway Baptist Church (C). Display/hide their locations on the map
Lakes and reservoirs: Verdolaga Lake (A), Resaca de la Gringa (B), Laguna Larga (C), El Tular (D), San Martin Lake (E), Laguna de los Patos (F), Vadia Ancha (G), Loma Alta Lake (H). Display/hide their locations on the map
Parks in East Cameron include: Andy Bowie County Park (1), Lighthouse Park (2), Las Palomas Wildlife Management Area - Boca Chica Unit (3), Battle of Palmito Hill Historical Monument (4), Isla Blanca Park (5), Texas State Park (6), Andy Bowie Park (7). Display/hide their locations on the map
Beaches: Boca Chica Beach (A), Del Mar Beach (B). Display/hide their locations on the map
| This place: | 3.0 people |
| Texas: | 2.8 people |
| This place: | 75.0% |
| Whole state: | 69.9% |
| This place: | 5.7% |
| Whole state: | 6.0% |
Likely homosexual households (counted as self-reported same-sex unmarried-partner households)
- Lesbian couples: 0.4% of all households
- Gay men: 0.4% of all households
| This place: | 28.9% |
| Whole state: | 15.4% |
| This place: | 10.8% |
| Whole state: | 6.7% |
9 people in maritime/merchant vessels in 2010
People in group quarters in East Cameron in 2000:
- 550 people in federal prisons and detention centers
- 33 people in job corps and vocational training facilities
- 3 people in religious group quarters
For population 15 years and over in East Cameron:
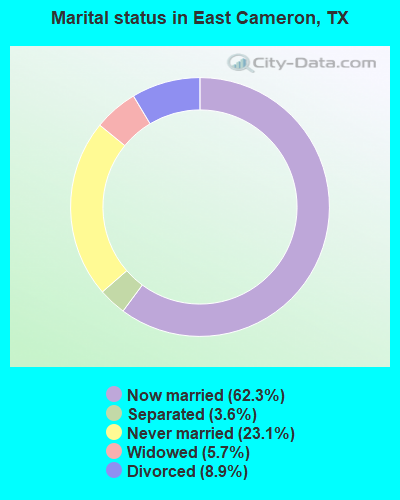
- Never married: 23.1%
- Now married: 62.3%
- Separated: 3.6%
- Widowed: 5.7%
- Divorced: 8.9%
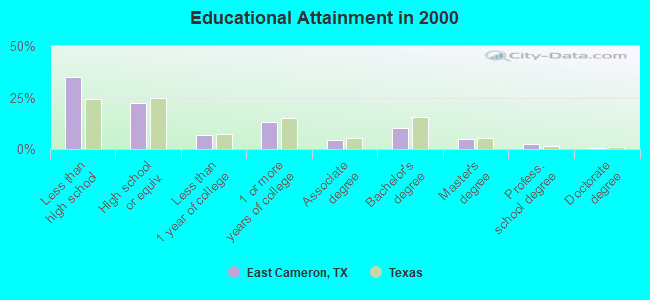
For population 25 years and over in East Cameron:
- High school or higher: 64.9%
- Bachelor's degree or higher: 18.3%
- Graduate or professional degree: 8.0%
- Unemployed: 7.9%
- Mean travel time to work (commute): 19.8 minutes
| Here: | 20.7 |
| Texas average: | 15.6 |
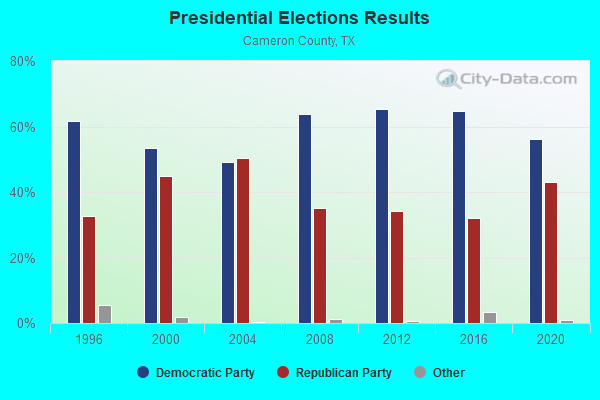
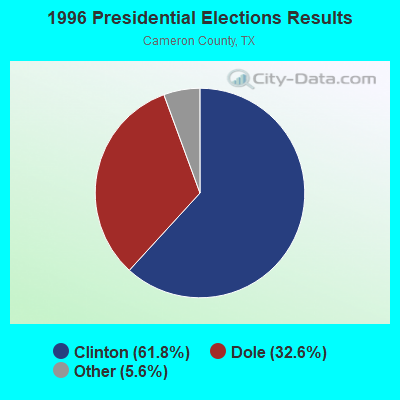
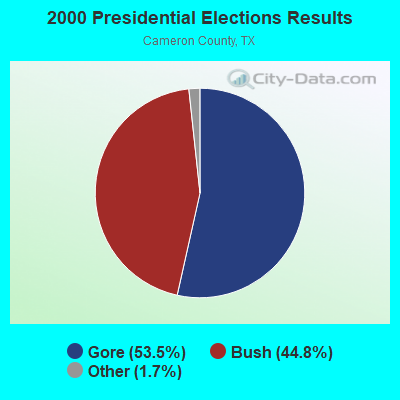
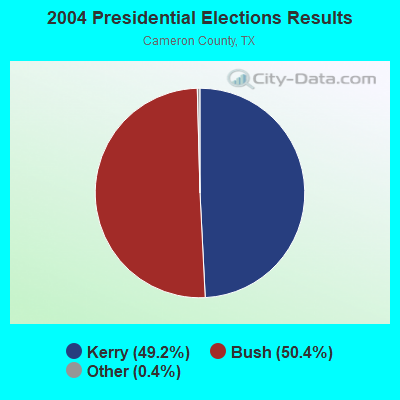
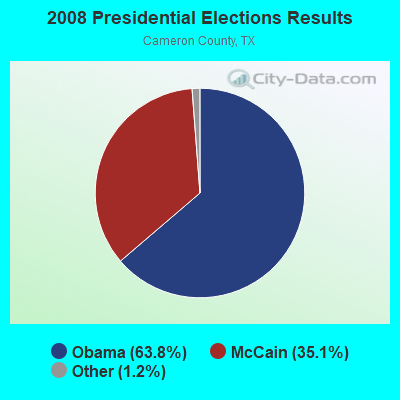
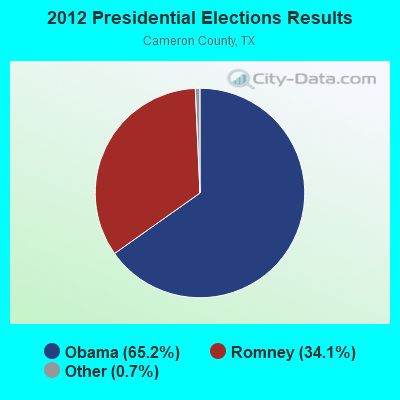
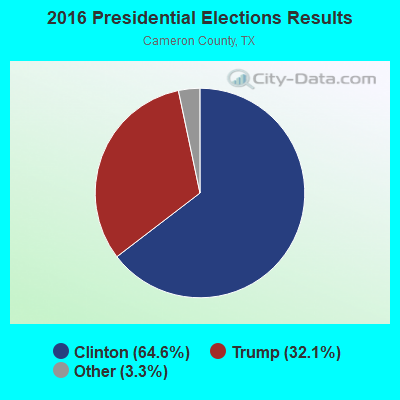
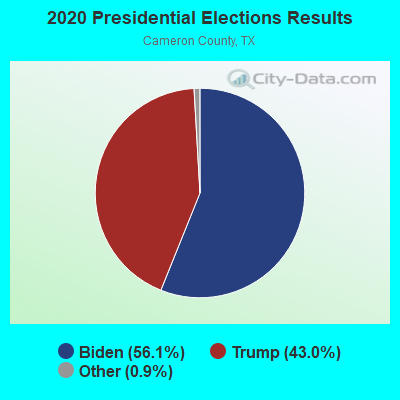
Graphs represent county-level data. Detailed 2008 Election Results
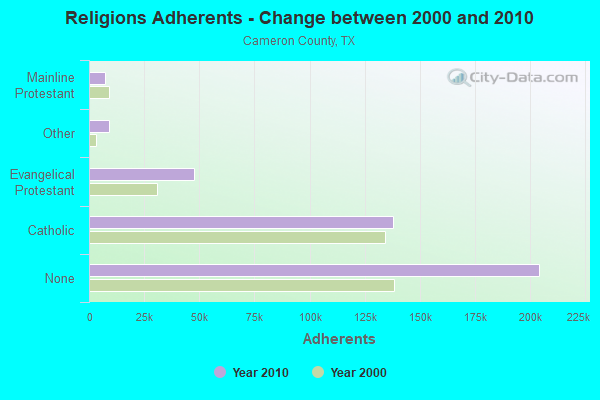
Religion statistics for East Cameron, TX (based on Cameron County data)
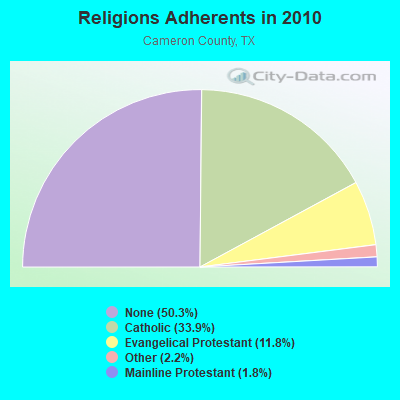
| Religion | Adherents | Congregations |
|---|---|---|
| Catholic | 137,889 | 38 |
| Evangelical Protestant | 47,744 | 225 |
| Other | 9,115 | 33 |
| Mainline Protestant | 7,258 | 32 |
| None | 204,214 | - |
Food Environment Statistics:
| Cameron County: | 1.22 / 10,000 pop. |
| Texas: | 1.47 / 10,000 pop. |
| Cameron County: | 0.13 / 10,000 pop. |
| Texas: | 0.14 / 10,000 pop. |
| Here: | 0.81 / 10,000 pop. |
| Texas: | 1.11 / 10,000 pop. |
| This county: | 3.46 / 10,000 pop. |
| Texas: | 3.95 / 10,000 pop. |
| Here: | 5.79 / 10,000 pop. |
| State: | 6.13 / 10,000 pop. |
| Cameron County: | 8.9% |
| Texas: | 8.9% |
| Here: | 25.4% |
| State: | 26.6% |
| Here: | 18.6% |
| State: | 15.7% |
3.64% of this county's 2021 resident taxpayers lived in other counties in 2020 ($49,868 average adjusted gross income)
| Here: | 3.64% |
| Texas average: | 8.12% |
0.03% of residents moved from foreign countries ($558 average AGI)
Cameron County: 0.03% Texas average: 0.04%
Top counties from which taxpayers relocated into this county between 2020 and 2021:
| from Hidalgo County, TX | |
| from Harris County, TX | |
| from Bexar County, TX |
3.56% of this county's 2020 resident taxpayers moved to other counties in 2021 ($47,696 average adjusted gross income)
| Here: | 3.56% |
| Texas average: | 7.40% |
0.01% of residents moved to foreign countries ($366 average AGI)
Cameron County: 0.01% Texas average: 0.03%
Top counties to which taxpayers relocated from this county between 2020 and 2021:
| to Hidalgo County, TX | |
| to Bexar County, TX | |
| to Harris County, TX |
Strongest AM radio stations in East Cameron:
- KBOR (1600 AM; 10 kW; BROWNSVILLE, TX; Owner: LA NUEVA KBOR, INC.)
- KGBT (1530 AM; 50 kW; HARLINGEN, TX; Owner: TICHENOR LICENSE CORPORATION)
- KQXX (1700 AM; 10 kW; BROWNSVILLE, TX; Owner: LA NUEVA KBOR, INC.)
- KURV (710 AM; 10 kW; EDINBURG, TX; Owner: VOICE OF VALLEY AGRICULTURE, INC.)
- KUBR (1210 AM; 10 kW; SAN JUAN, TX; Owner: PAULINO BERNAL)
- KCTA (1030 AM; 50 kW; CORPUS CHRISTI, TX; Owner: BROADCASTING CORPORATION OF THE SOUTHWEST)
- KRGE (1290 AM; 5 kW; WESLACO, TX; Owner: CHRISTIAN MINISTRIES OF THE VALLEY)
- KVJY (840 AM; 5 kW; PHARR, TX; Owner: RADIO UNICA OF MCALLEN LICENSE CORP.)
- KRIO (910 AM; 5 kW; MCALLEN, TX; Owner: RIO GRANDE BIBLE INSTITUTE, INC.)
- KTKR (760 AM; 50 kW; SAN ANTONIO, TX; Owner: CCB TEXAS LICENSES, L.P.)
- KKYX (680 AM; 50 kW; SAN ANTONIO, TX; Owner: CXR HOLDINGS, INC.)
- WOAI (1200 AM; 50 kW; SAN ANTONIO, TX; Owner: CCB TEXAS LICENSES, L.P.)
- KTRH (740 AM; 50 kW; HOUSTON, TX; Owner: AMFM TEXAS LICENSES LIMITED PARTNERSHIP)
Strongest FM radio stations in East Cameron:
- KNVO-FM (101.1 FM; PORT ISABEL, TX; Owner: ENTRAVISION HOLDINGS, L.L.C.)
- KESO (92.7 FM; SOUTH PADRE ISLAND, TX; Owner: ALTERNATIVE BROADCASTING CORPORATION)
- KZSP (95.3 FM; SOUTH PADRE ISLAND, TX; Owner: ALTERNATIVE BROADCASTING CORPORATION)
- KTEX (100.3 FM; BROWNSVILLE, TX; Owner: CAPSTAR TX LIMITED PARTNERSHIP)
- KVMV (96.9 FM; MCALLEN, TX; Owner: WORLD RADIO NETWORK, INC.)
- KGBT-FM (98.5 FM; MCALLEN, TX; Owner: TICHENOR LICENSE CORPORATION ("TLC"))
- KBFM (104.1 FM; EDINBURG, TX; Owner: CAPSTAR TX LIMITED PARTNERSHIP)
- KFRQ (94.5 FM; HARLINGEN, TX; Owner: ENTRAVISION HOLDINGS, L.L.C.)
- KKPS (99.5 FM; BROWNSVILLE, TX; Owner: ENTRAVISION HOLDINGS, L.L.C.)
- KBTQ (96.1 FM; HARLINGEN, TX; Owner: TICHENOR LICENSE CORPORATION ("TLC"))
- KMBH-FM (88.9 FM; HARLINGEN, TX; Owner: RGV EDUCATIONAL BROADCASTING, INC.)
- KVLY (107.9 FM; EDINBURG, TX; Owner: ENTRAVISION HOLDINGS, L.L.C.)
- KBNR (88.3 FM; BROWNSVILLE, TX; Owner: WORLD RADIO NETWORK, INC.)
- KMAZ (106.3 FM; MERCEDES, TX; Owner: LA NUEVA KBOR, INC.)
TV broadcast stations around East Cameron:
- KRGV-TV (Channel 5; WESLACO, TX; Owner: MOBILE VIDEO TAPES, INC.)
- KVEO (Channel 23; BROWNSVILLE, TX; Owner: COMCORP OF TEXAS LICENSE CORP.)
- K64FM (Channel 64; BROWNSVILLE, TX; Owner: BROWNSVILLE BROADCASTING, LLC)
- KGBT-TV (Channel 4; HARLINGEN, TX; Owner: LIBCO, INC.)
- KMBH (Channel 60; HARLINGEN, TX; Owner: RGV EDUCATIONAL BROADCASTING, INC.)
- KZAV-LP (Channel 20; BROWNSVILLE, TX; Owner: ZAVALETTA BROADCASTING OF THE RIO GRANDE VALLEY, LLC)
- KLUJ (Channel 44; HARLINGEN, TX; Owner: COMMUNITY EDUCATIONAL TELEVISION)
- KTIZ-LP (Channel 52; HARLINGEN, TX; Owner: ORTIZ BROADCASTING CORPORATION)
- KXIV-LP (Channel 17; BROWNSVILLE, TX; Owner: FAITH PLEASES GOD CHURCH CORP.)
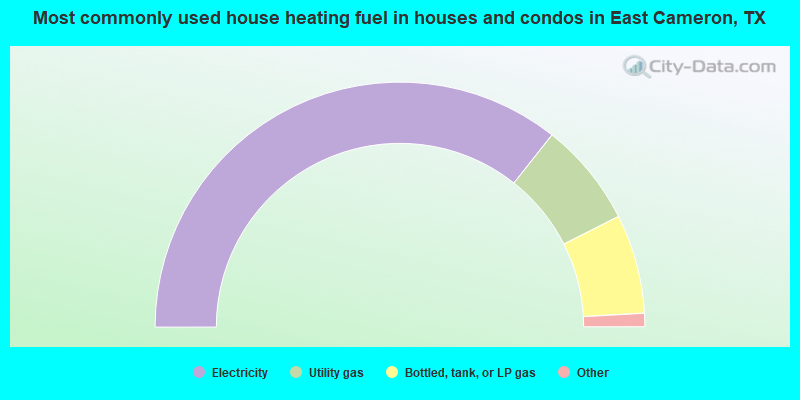
- 71.4%Electricity
- 13.8%Utility gas
- 13.1%Bottled, tank, or LP gas
- 1.5%No fuel used
- 0.2%Fuel oil, kerosene, etc.
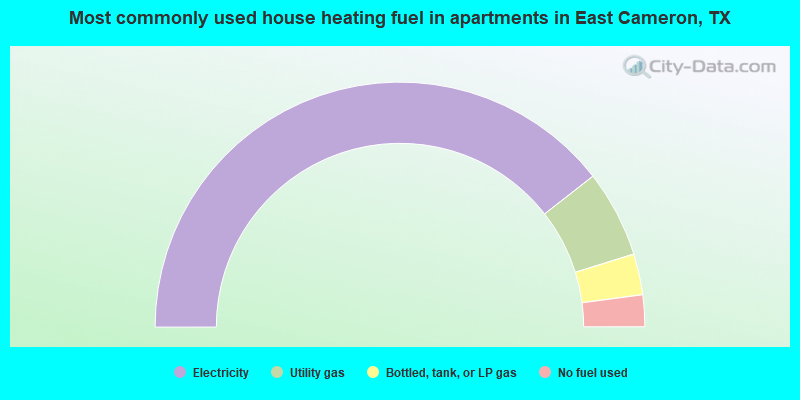
- 78.9%Electricity
- 11.5%Utility gas
- 5.4%Bottled, tank, or LP gas
- 4.2%No fuel used
East Cameron compared to Texas state average:
- Median house value below state average.
- Unemployed percentage below state average.
- Black race population percentage significantly below state average.
- Foreign-born population percentage significantly below state average.
- Length of stay since moving in significantly above state average.
- Number of rooms per house significantly below state average.
- House age significantly below state average.
- Institutionalized population percentage above state average.
East Cameron on our top lists:
- #3 on the list of "Top 101 cities with largest percentage of males in industries: private households (population 5,000+)"
- #9 on the list of "Top 101 cities with largest percentage of females in industries: warehousing and storage (population 5,000+)"
- #12 on the list of "Top 101 cities with largest percentage of males in occupations: cooks and food preparation workers (population 5,000+)"
- #12 on the list of "Top 101 cities with largest percentage of males in occupations: fishing and hunting, and forest and logging workers (population 5,000+)"
- #30 on the list of "Top 101 cities with largest percentage of males in occupations: secondary school teachers (population 5,000+)"
- #30 on the list of "Top 101 cities with largest percentage of females in industries: recyclable material merchant wholesalers (population 5,000+)"
- #34 on the list of "Top 101 cities with largest percentage of females in occupations: cooks and food preparation workers (population 5,000+)"
- #36 on the list of "Top 101 cities with largest percentage of females in industries: used merchandise, gift, novelty, and souvenir, and other miscellaneous stores (population 5,000+)"
- #37 on the list of "Top 101 cities with largest percentage of females in industries: farm product raw materials merchant wholesalers (population 5,000+)"
- #45 on the list of "Top 101 cities with the largest percentage of people in federal prisons and detention centers (population 1,000+)"
- #46 on the list of "Top 101 cities with largest percentage of females in occupations: rail and water transportation workers (population 5,000+)"
- #48 on the list of "Top 101 cities with largest percentage of females in occupations: laborers and material movers, hand (population 5,000+)"
- #49 on the list of "Top 101 cities with largest percentage of females in industries: metals and minerals, except petroleum, merchant wholesalers (population 5,000+)"
- #65 on the list of "Top 101 cities with largest percentage of females in industries: apparel (population 5,000+)"
- #67 on the list of "Top 101 cities with largest percentage of males in industries: other transportation, and support activities, and couriers (population 5,000+)"
- #71 on the list of "Top 101 cities with largest percentage of females in industries: groceries and related products merchant wholesalers (population 5,000+)"
- #75 on the list of "Top 101 cities with the largest percentage of people in job corps and vocational training facilities (population 1,000+)"
- #88 on the list of "Top 101 cities with the largest house values disparities (population 5,000+)"
- #89 on the list of "Top 101 cities with largest percentage of males in industries: sporting goods, camera, and hobby and toy stores (population 5,000+)"
- #91 on the list of "Top 101 cities with largest percentage of females in industries: private households (population 5,000+)"
- #8 on the list of "Top 101 counties with the highest number of births per 1000 residents 2007-2013"
- #13 on the list of "Top 101 counties with the largest increase in the number of infant deaths per 1000 residents 2000-2006 to 2007-2013 (pop. 50,000+)"
- #24 on the list of "Top 101 counties with the largest decrease in the number of births per 1000 residents 2000-2006 to 2007-2013 (pop 50,000+)"
- #49 on the list of "Top 101 counties with the lowest percentage of residents relocating to other counties in 2011"
- #59 on the list of "Top 101 counties with the lowest percentage of residents relocating from other counties between 2010 and 2011 (pop. 50,000+)"