Eloy, Arizona Submit your own pictures of this city and show them to the world
OSM Map
General Map
Google Map
MSN Map
OSM Map
General Map
Google Map
MSN Map
OSM Map
General Map
Google Map
MSN Map
OSM Map
General Map
Google Map
MSN Map
Please wait while loading the map...
Population in 2022: 17,042 (68% urban, 32% rural). Population change since 2000: +64.3%Males: 12,151 Females: 4,891
March 2022 cost of living index in Eloy: 97.9 (near average, U.S. average is 100) Percentage of residents living in poverty in 2022: 18.9%for White Non-Hispanic residents , 49.6% for Black residents , 23.0% for Hispanic or Latino residents , 53.9% for American Indian residents , 32.8% for other race residents , 8.5% for two or more races residents )
Profiles of local businesses
Business Search - 14 Million verified businesses
Data:
Median household income ($)
Median household income (% change since 2000)
Household income diversity
Ratio of average income to average house value (%)
Ratio of average income to average rent
Median household income ($) - White
Median household income ($) - Black or African American
Median household income ($) - Asian
Median household income ($) - Hispanic or Latino
Median household income ($) - American Indian and Alaska Native
Median household income ($) - Multirace
Median household income ($) - Other Race
Median household income for houses/condos with a mortgage ($)
Median household income for apartments without a mortgage ($)
Races - White alone (%)
Races - White alone (% change since 2000)
Races - Black alone (%)
Races - Black alone (% change since 2000)
Races - American Indian alone (%)
Races - American Indian alone (% change since 2000)
Races - Asian alone (%)
Races - Asian alone (% change since 2000)
Races - Hispanic (%)
Races - Hispanic (% change since 2000)
Races - Native Hawaiian and Other Pacific Islander alone (%)
Races - Native Hawaiian and Other Pacific Islander alone (% change since 2000)
Races - Two or more races (%)
Races - Two or more races (% change since 2000)
Races - Other race alone (%)
Races - Other race alone (% change since 2000)
Racial diversity
Unemployment (%)
Unemployment (% change since 2000)
Unemployment (%) - White
Unemployment (%) - Black or African American
Unemployment (%) - Asian
Unemployment (%) - Hispanic or Latino
Unemployment (%) - American Indian and Alaska Native
Unemployment (%) - Multirace
Unemployment (%) - Other Race
Population density (people per square mile)
Population - Males (%)
Population - Females (%)
Population - Males (%) - White
Population - Males (%) - Black or African American
Population - Males (%) - Asian
Population - Males (%) - Hispanic or Latino
Population - Males (%) - American Indian and Alaska Native
Population - Males (%) - Multirace
Population - Males (%) - Other Race
Population - Females (%) - White
Population - Females (%) - Black or African American
Population - Females (%) - Asian
Population - Females (%) - Hispanic or Latino
Population - Females (%) - American Indian and Alaska Native
Population - Females (%) - Multirace
Population - Females (%) - Other Race
Coronavirus confirmed cases (Apr 27, 2024)
Deaths caused by coronavirus (Apr 27, 2024)
Coronavirus confirmed cases (per 100k population) (Apr 27, 2024)
Deaths caused by coronavirus (per 100k population) (Apr 27, 2024)
Daily increase in number of cases (Apr 27, 2024)
Weekly increase in number of cases (Apr 27, 2024)
Cases doubled (in days) (Apr 27, 2024)
Hospitalized patients (Apr 18, 2022)
Negative test results (Apr 18, 2022)
Total test results (Apr 18, 2022)
COVID Vaccine doses distributed (per 100k population) (Sep 19, 2023)
COVID Vaccine doses administered (per 100k population) (Sep 19, 2023)
COVID Vaccine doses distributed (Sep 19, 2023)
COVID Vaccine doses administered (Sep 19, 2023)
Likely homosexual households (%)
Likely homosexual households (% change since 2000)
Likely homosexual households - Lesbian couples (%)
Likely homosexual households - Lesbian couples (% change since 2000)
Likely homosexual households - Gay men (%)
Likely homosexual households - Gay men (% change since 2000)
Cost of living index
Median gross rent ($)
Median contract rent ($)
Median monthly housing costs ($)
Median house or condo value ($)
Median house or condo value ($ change since 2000)
Mean house or condo value by units in structure - 1, detached ($)
Mean house or condo value by units in structure - 1, attached ($)
Mean house or condo value by units in structure - 2 ($)
Mean house or condo value by units in structure by units in structure - 3 or 4 ($)
Mean house or condo value by units in structure - 5 or more ($)
Mean house or condo value by units in structure - Boat, RV, van, etc. ($)
Mean house or condo value by units in structure - Mobile home ($)
Median house or condo value ($) - White
Median house or condo value ($) - Black or African American
Median house or condo value ($) - Asian
Median house or condo value ($) - Hispanic or Latino
Median house or condo value ($) - American Indian and Alaska Native
Median house or condo value ($) - Multirace
Median house or condo value ($) - Other Race
Median resident age
Resident age diversity
Median resident age - Males
Median resident age - Females
Median resident age - White
Median resident age - Black or African American
Median resident age - Asian
Median resident age - Hispanic or Latino
Median resident age - American Indian and Alaska Native
Median resident age - Multirace
Median resident age - Other Race
Median resident age - Males - White
Median resident age - Males - Black or African American
Median resident age - Males - Asian
Median resident age - Males - Hispanic or Latino
Median resident age - Males - American Indian and Alaska Native
Median resident age - Males - Multirace
Median resident age - Males - Other Race
Median resident age - Females - White
Median resident age - Females - Black or African American
Median resident age - Females - Asian
Median resident age - Females - Hispanic or Latino
Median resident age - Females - American Indian and Alaska Native
Median resident age - Females - Multirace
Median resident age - Females - Other Race
Commute - mean travel time to work (minutes)
Travel time to work - Less than 5 minutes (%)
Travel time to work - Less than 5 minutes (% change since 2000)
Travel time to work - 5 to 9 minutes (%)
Travel time to work - 5 to 9 minutes (% change since 2000)
Travel time to work - 10 to 19 minutes (%)
Travel time to work - 10 to 19 minutes (% change since 2000)
Travel time to work - 20 to 29 minutes (%)
Travel time to work - 20 to 29 minutes (% change since 2000)
Travel time to work - 30 to 39 minutes (%)
Travel time to work - 30 to 39 minutes (% change since 2000)
Travel time to work - 40 to 59 minutes (%)
Travel time to work - 40 to 59 minutes (% change since 2000)
Travel time to work - 60 to 89 minutes (%)
Travel time to work - 60 to 89 minutes (% change since 2000)
Travel time to work - 90 or more minutes (%)
Travel time to work - 90 or more minutes (% change since 2000)
Marital status - Never married (%)
Marital status - Now married (%)
Marital status - Separated (%)
Marital status - Widowed (%)
Marital status - Divorced (%)
Median family income ($)
Median family income (% change since 2000)
Median non-family income ($)
Median non-family income (% change since 2000)
Median per capita income ($)
Median per capita income (% change since 2000)
Median family income ($) - White
Median family income ($) - Black or African American
Median family income ($) - Asian
Median family income ($) - Hispanic or Latino
Median family income ($) - American Indian and Alaska Native
Median family income ($) - Multirace
Median family income ($) - Other Race
Median year house/condo built
Median year apartment built
Year house built - Built 2005 or later (%)
Year house built - Built 2000 to 2004 (%)
Year house built - Built 1990 to 1999 (%)
Year house built - Built 1980 to 1989 (%)
Year house built - Built 1970 to 1979 (%)
Year house built - Built 1960 to 1969 (%)
Year house built - Built 1950 to 1959 (%)
Year house built - Built 1940 to 1949 (%)
Year house built - Built 1939 or earlier (%)
Average household size
Household density (households per square mile)
Average household size - White
Average household size - Black or African American
Average household size - Asian
Average household size - Hispanic or Latino
Average household size - American Indian and Alaska Native
Average household size - Multirace
Average household size - Other Race
Occupied housing units (%)
Vacant housing units (%)
Owner occupied housing units (%)
Renter occupied housing units (%)
Vacancy status - For rent (%)
Vacancy status - For sale only (%)
Vacancy status - Rented or sold, not occupied (%)
Vacancy status - For seasonal, recreational, or occasional use (%)
Vacancy status - For migrant workers (%)
Vacancy status - Other vacant (%)
Residents with income below the poverty level (%)
Residents with income below 50% of the poverty level (%)
Children below poverty level (%)
Poor families by family type - Married-couple family (%)
Poor families by family type - Male, no wife present (%)
Poor families by family type - Female, no husband present (%)
Poverty status for native-born residents (%)
Poverty status for foreign-born residents (%)
Poverty among high school graduates not in families (%)
Poverty among people who did not graduate high school not in families (%)
Residents with income below the poverty level (%) - White
Residents with income below the poverty level (%) - Black or African American
Residents with income below the poverty level (%) - Asian
Residents with income below the poverty level (%) - Hispanic or Latino
Residents with income below the poverty level (%) - American Indian and Alaska Native
Residents with income below the poverty level (%) - Multirace
Residents with income below the poverty level (%) - Other Race
Air pollution - Air Quality Index (AQI)
Air pollution - CO
Air pollution - NO2
Air pollution - SO2
Air pollution - Ozone
Air pollution - PM10
Air pollution - PM25
Air pollution - Pb
Crime - Murders per 100,000 population
Crime - Rapes per 100,000 population
Crime - Robberies per 100,000 population
Crime - Assaults per 100,000 population
Crime - Burglaries per 100,000 population
Crime - Thefts per 100,000 population
Crime - Auto thefts per 100,000 population
Crime - Arson per 100,000 population
Crime - City-data.com crime index
Crime - Violent crime index
Crime - Property crime index
Crime - Murders per 100,000 population (5 year average)
Crime - Rapes per 100,000 population (5 year average)
Crime - Robberies per 100,000 population (5 year average)
Crime - Assaults per 100,000 population (5 year average)
Crime - Burglaries per 100,000 population (5 year average)
Crime - Thefts per 100,000 population (5 year average)
Crime - Auto thefts per 100,000 population (5 year average)
Crime - Arson per 100,000 population (5 year average)
Crime - City-data.com crime index (5 year average)
Crime - Violent crime index (5 year average)
Crime - Property crime index (5 year average)
1996 Presidential Elections Results (%) - Democratic Party (Clinton)
1996 Presidential Elections Results (%) - Republican Party (Dole)
1996 Presidential Elections Results (%) - Other
2000 Presidential Elections Results (%) - Democratic Party (Gore)
2000 Presidential Elections Results (%) - Republican Party (Bush)
2000 Presidential Elections Results (%) - Other
2004 Presidential Elections Results (%) - Democratic Party (Kerry)
2004 Presidential Elections Results (%) - Republican Party (Bush)
2004 Presidential Elections Results (%) - Other
2008 Presidential Elections Results (%) - Democratic Party (Obama)
2008 Presidential Elections Results (%) - Republican Party (McCain)
2008 Presidential Elections Results (%) - Other
2012 Presidential Elections Results (%) - Democratic Party (Obama)
2012 Presidential Elections Results (%) - Republican Party (Romney)
2012 Presidential Elections Results (%) - Other
2016 Presidential Elections Results (%) - Democratic Party (Clinton)
2016 Presidential Elections Results (%) - Republican Party (Trump)
2016 Presidential Elections Results (%) - Other
2020 Presidential Elections Results (%) - Democratic Party (Biden)
2020 Presidential Elections Results (%) - Republican Party (Trump)
2020 Presidential Elections Results (%) - Other
Ancestries Reported - Arab (%)
Ancestries Reported - Czech (%)
Ancestries Reported - Danish (%)
Ancestries Reported - Dutch (%)
Ancestries Reported - English (%)
Ancestries Reported - French (%)
Ancestries Reported - French Canadian (%)
Ancestries Reported - German (%)
Ancestries Reported - Greek (%)
Ancestries Reported - Hungarian (%)
Ancestries Reported - Irish (%)
Ancestries Reported - Italian (%)
Ancestries Reported - Lithuanian (%)
Ancestries Reported - Norwegian (%)
Ancestries Reported - Polish (%)
Ancestries Reported - Portuguese (%)
Ancestries Reported - Russian (%)
Ancestries Reported - Scotch-Irish (%)
Ancestries Reported - Scottish (%)
Ancestries Reported - Slovak (%)
Ancestries Reported - Subsaharan African (%)
Ancestries Reported - Swedish (%)
Ancestries Reported - Swiss (%)
Ancestries Reported - Ukrainian (%)
Ancestries Reported - United States (%)
Ancestries Reported - Welsh (%)
Ancestries Reported - West Indian (%)
Ancestries Reported - Other (%)
Educational Attainment - No schooling completed (%)
Educational Attainment - Less than high school (%)
Educational Attainment - High school or equivalent (%)
Educational Attainment - Less than 1 year of college (%)
Educational Attainment - 1 or more years of college (%)
Educational Attainment - Associate degree (%)
Educational Attainment - Bachelor's degree (%)
Educational Attainment - Master's degree (%)
Educational Attainment - Professional school degree (%)
Educational Attainment - Doctorate degree (%)
School Enrollment - Nursery, preschool (%)
School Enrollment - Kindergarten (%)
School Enrollment - Grade 1 to 4 (%)
School Enrollment - Grade 5 to 8 (%)
School Enrollment - Grade 9 to 12 (%)
School Enrollment - College undergrad (%)
School Enrollment - Graduate or professional (%)
School Enrollment - Not enrolled in school (%)
School enrollment - Public schools (%)
School enrollment - Private schools (%)
School enrollment - Not enrolled (%)
Median number of rooms in houses and condos
Median number of rooms in apartments
Housing units lacking complete plumbing facilities (%)
Housing units lacking complete kitchen facilities (%)
Density of houses
Urban houses (%)
Rural houses (%)
Households with people 60 years and over (%)
Households with people 65 years and over (%)
Households with people 75 years and over (%)
Households with one or more nonrelatives (%)
Households with no nonrelatives (%)
Population in households (%)
Family households (%)
Nonfamily households (%)
Population in families (%)
Family households with own children (%)
Median number of bedrooms in owner occupied houses
Mean number of bedrooms in owner occupied houses
Median number of bedrooms in renter occupied houses
Mean number of bedrooms in renter occupied houses
Median number of vehichles in owner occupied houses
Mean number of vehichles in owner occupied houses
Median number of vehichles in renter occupied houses
Mean number of vehichles in renter occupied houses
Mortgage status - with mortgage (%)
Mortgage status - with second mortgage (%)
Mortgage status - with home equity loan (%)
Mortgage status - with both second mortgage and home equity loan (%)
Mortgage status - without a mortgage (%)
Average family size
Average family size - White
Average family size - Black or African American
Average family size - Asian
Average family size - Hispanic or Latino
Average family size - American Indian and Alaska Native
Average family size - Multirace
Average family size - Other Race
Geographical mobility - Same house 1 year ago (%)
Geographical mobility - Moved within same county (%)
Geographical mobility - Moved from different county within same state (%)
Geographical mobility - Moved from different state (%)
Geographical mobility - Moved from abroad (%)
Place of birth - Born in state of residence (%)
Place of birth - Born in other state (%)
Place of birth - Native, outside of US (%)
Place of birth - Foreign born (%)
Housing units in structures - 1, detached (%)
Housing units in structures - 1, attached (%)
Housing units in structures - 2 (%)
Housing units in structures - 3 or 4 (%)
Housing units in structures - 5 to 9 (%)
Housing units in structures - 10 to 19 (%)
Housing units in structures - 20 to 49 (%)
Housing units in structures - 50 or more (%)
Housing units in structures - Mobile home (%)
Housing units in structures - Boat, RV, van, etc. (%)
House/condo owner moved in on average (years ago)
Renter moved in on average (years ago)
Year householder moved into unit - Moved in 1999 to March 2000 (%)
Year householder moved into unit - Moved in 1995 to 1998 (%)
Year householder moved into unit - Moved in 1990 to 1994 (%)
Year householder moved into unit - Moved in 1980 to 1989 (%)
Year householder moved into unit - Moved in 1970 to 1979 (%)
Year householder moved into unit - Moved in 1969 or earlier (%)
Means of transportation to work - Drove car alone (%)
Means of transportation to work - Carpooled (%)
Means of transportation to work - Public transportation (%)
Means of transportation to work - Bus or trolley bus (%)
Means of transportation to work - Streetcar or trolley car (%)
Means of transportation to work - Subway or elevated (%)
Means of transportation to work - Railroad (%)
Means of transportation to work - Ferryboat (%)
Means of transportation to work - Taxicab (%)
Means of transportation to work - Motorcycle (%)
Means of transportation to work - Bicycle (%)
Means of transportation to work - Walked (%)
Means of transportation to work - Other means (%)
Working at home (%)
Industry diversity
Most Common Industries - Agriculture, forestry, fishing and hunting, and mining (%)
Most Common Industries - Agriculture, forestry, fishing and hunting (%)
Most Common Industries - Mining, quarrying, and oil and gas extraction (%)
Most Common Industries - Construction (%)
Most Common Industries - Manufacturing (%)
Most Common Industries - Wholesale trade (%)
Most Common Industries - Retail trade (%)
Most Common Industries - Transportation and warehousing, and utilities (%)
Most Common Industries - Transportation and warehousing (%)
Most Common Industries - Utilities (%)
Most Common Industries - Information (%)
Most Common Industries - Finance and insurance, and real estate and rental and leasing (%)
Most Common Industries - Finance and insurance (%)
Most Common Industries - Real estate and rental and leasing (%)
Most Common Industries - Professional, scientific, and management, and administrative and waste management services (%)
Most Common Industries - Professional, scientific, and technical services (%)
Most Common Industries - Management of companies and enterprises (%)
Most Common Industries - Administrative and support and waste management services (%)
Most Common Industries - Educational services, and health care and social assistance (%)
Most Common Industries - Educational services (%)
Most Common Industries - Health care and social assistance (%)
Most Common Industries - Arts, entertainment, and recreation, and accommodation and food services (%)
Most Common Industries - Arts, entertainment, and recreation (%)
Most Common Industries - Accommodation and food services (%)
Most Common Industries - Other services, except public administration (%)
Most Common Industries - Public administration (%)
Occupation diversity
Most Common Occupations - Management, business, science, and arts occupations (%)
Most Common Occupations - Management, business, and financial occupations (%)
Most Common Occupations - Management occupations (%)
Most Common Occupations - Business and financial operations occupations (%)
Most Common Occupations - Computer, engineering, and science occupations (%)
Most Common Occupations - Computer and mathematical occupations (%)
Most Common Occupations - Architecture and engineering occupations (%)
Most Common Occupations - Life, physical, and social science occupations (%)
Most Common Occupations - Education, legal, community service, arts, and media occupations (%)
Most Common Occupations - Community and social service occupations (%)
Most Common Occupations - Legal occupations (%)
Most Common Occupations - Education, training, and library occupations (%)
Most Common Occupations - Arts, design, entertainment, sports, and media occupations (%)
Most Common Occupations - Healthcare practitioners and technical occupations (%)
Most Common Occupations - Health diagnosing and treating practitioners and other technical occupations (%)
Most Common Occupations - Health technologists and technicians (%)
Most Common Occupations - Service occupations (%)
Most Common Occupations - Healthcare support occupations (%)
Most Common Occupations - Protective service occupations (%)
Most Common Occupations - Fire fighting and prevention, and other protective service workers including supervisors (%)
Most Common Occupations - Law enforcement workers including supervisors (%)
Most Common Occupations - Food preparation and serving related occupations (%)
Most Common Occupations - Building and grounds cleaning and maintenance occupations (%)
Most Common Occupations - Personal care and service occupations (%)
Most Common Occupations - Sales and office occupations (%)
Most Common Occupations - Sales and related occupations (%)
Most Common Occupations - Office and administrative support occupations (%)
Most Common Occupations - Natural resources, construction, and maintenance occupations (%)
Most Common Occupations - Farming, fishing, and forestry occupations (%)
Most Common Occupations - Construction and extraction occupations (%)
Most Common Occupations - Installation, maintenance, and repair occupations (%)
Most Common Occupations - Production, transportation, and material moving occupations (%)
Most Common Occupations - Production occupations (%)
Most Common Occupations - Transportation occupations (%)
Most Common Occupations - Material moving occupations (%)
People in Group quarters - Institutionalized population (%)
People in Group quarters - Correctional institutions (%)
People in Group quarters - Federal prisons and detention centers (%)
People in Group quarters - Halfway houses (%)
People in Group quarters - Local jails and other confinement facilities (including police lockups) (%)
People in Group quarters - Military disciplinary barracks (%)
People in Group quarters - State prisons (%)
People in Group quarters - Other types of correctional institutions (%)
People in Group quarters - Nursing homes (%)
People in Group quarters - Hospitals/wards, hospices, and schools for the handicapped (%)
People in Group quarters - Hospitals/wards and hospices for chronically ill (%)
People in Group quarters - Hospices or homes for chronically ill (%)
People in Group quarters - Military hospitals or wards for chronically ill (%)
People in Group quarters - Other hospitals or wards for chronically ill (%)
People in Group quarters - Hospitals or wards for drug/alcohol abuse (%)
People in Group quarters - Mental (Psychiatric) hospitals or wards (%)
People in Group quarters - Schools, hospitals, or wards for the mentally retarded (%)
People in Group quarters - Schools, hospitals, or wards for the physically handicapped (%)
People in Group quarters - Institutions for the deaf (%)
People in Group quarters - Institutions for the blind (%)
People in Group quarters - Orthopedic wards and institutions for the physically handicapped (%)
People in Group quarters - Wards in general hospitals for patients who have no usual home elsewhere (%)
People in Group quarters - Wards in military hospitals for patients who have no usual home elsewhere (%)
People in Group quarters - Juvenile institutions (%)
People in Group quarters - Long-term care (%)
People in Group quarters - Homes for abused, dependent, and neglected children (%)
People in Group quarters - Residential treatment centers for emotionally disturbed children (%)
People in Group quarters - Training schools for juvenile delinquents (%)
People in Group quarters - Short-term care, detention or diagnostic centers for delinquent children (%)
People in Group quarters - Type of juvenile institution unknown (%)
People in Group quarters - Noninstitutionalized population (%)
People in Group quarters - College dormitories (includes college quarters off campus) (%)
People in Group quarters - Military quarters (%)
People in Group quarters - On base (%)
People in Group quarters - Barracks, unaccompanied personnel housing (UPH), (Enlisted/Officer), ;and similar group living quarters for military personnel (%)
People in Group quarters - Transient quarters for temporary residents (%)
People in Group quarters - Military ships (%)
People in Group quarters - Group homes (%)
People in Group quarters - Homes or halfway houses for drug/alcohol abuse (%)
People in Group quarters - Homes for the mentally ill (%)
People in Group quarters - Homes for the mentally retarded (%)
People in Group quarters - Homes for the physically handicapped (%)
People in Group quarters - Other group homes (%)
People in Group quarters - Religious group quarters (%)
People in Group quarters - Dormitories (%)
People in Group quarters - Agriculture workers' dormitories on farms (%)
People in Group quarters - Job Corps and vocational training facilities (%)
People in Group quarters - Other workers' dormitories (%)
People in Group quarters - Crews of maritime vessels (%)
People in Group quarters - Other nonhousehold living situations (%)
People in Group quarters - Other noninstitutional group quarters (%)
Residents speaking English at home (%)
Residents speaking English at home - Born in the United States (%)
Residents speaking English at home - Native, born elsewhere (%)
Residents speaking English at home - Foreign born (%)
Residents speaking Spanish at home (%)
Residents speaking Spanish at home - Born in the United States (%)
Residents speaking Spanish at home - Native, born elsewhere (%)
Residents speaking Spanish at home - Foreign born (%)
Residents speaking other language at home (%)
Residents speaking other language at home - Born in the United States (%)
Residents speaking other language at home - Native, born elsewhere (%)
Residents speaking other language at home - Foreign born (%)
Class of Workers - Employee of private company (%)
Class of Workers - Self-employed in own incorporated business (%)
Class of Workers - Private not-for-profit wage and salary workers (%)
Class of Workers - Local government workers (%)
Class of Workers - State government workers (%)
Class of Workers - Federal government workers (%)
Class of Workers - Self-employed workers in own not incorporated business and Unpaid family workers (%)
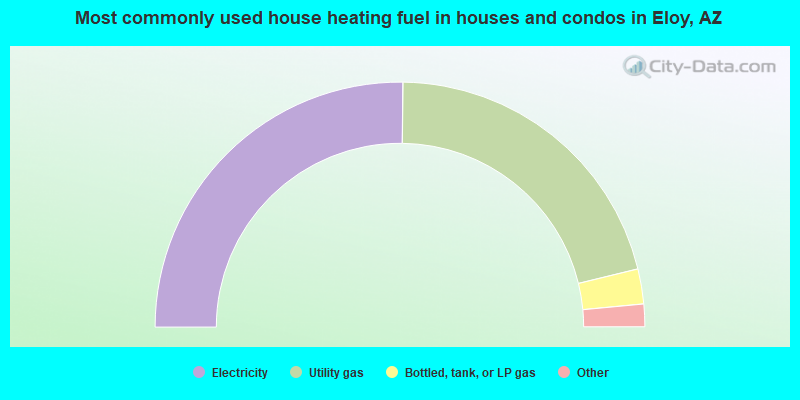
House heating fuel used in houses and condos - Utility gas (%)
House heating fuel used in houses and condos - Bottled, tank, or LP gas (%)
House heating fuel used in houses and condos - Electricity (%)
House heating fuel used in houses and condos - Fuel oil, kerosene, etc. (%)
House heating fuel used in houses and condos - Coal or coke (%)
House heating fuel used in houses and condos - Wood (%)
House heating fuel used in houses and condos - Solar energy (%)
House heating fuel used in houses and condos - Other fuel (%)
House heating fuel used in houses and condos - No fuel used (%)
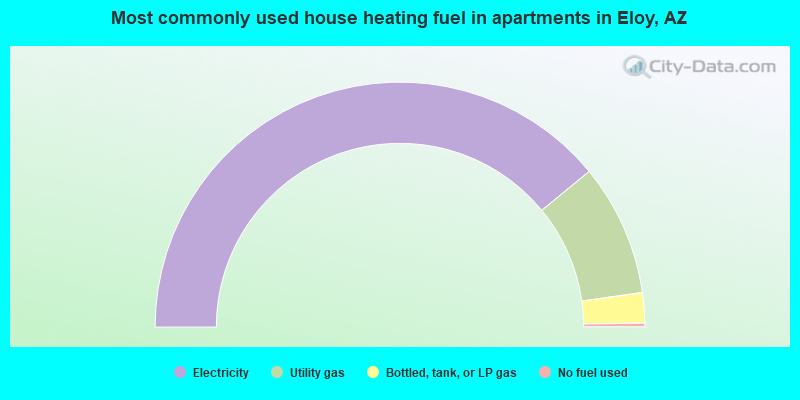
House heating fuel used in apartments - Utility gas (%)
House heating fuel used in apartments - Bottled, tank, or LP gas (%)
House heating fuel used in apartments - Electricity (%)
House heating fuel used in apartments - Fuel oil, kerosene, etc. (%)
House heating fuel used in apartments - Coal or coke (%)
House heating fuel used in apartments - Wood (%)
House heating fuel used in apartments - Solar energy (%)
House heating fuel used in apartments - Other fuel (%)
House heating fuel used in apartments - No fuel used (%)
Armed forces status - In Armed Forces (%)
Armed forces status - Civilian (%)
Armed forces status - Civilian - Veteran (%)
Armed forces status - Civilian - Nonveteran (%)
Fatal accidents locations in years 2005-2021
Fatal accidents locations in 2005
Fatal accidents locations in 2006
Fatal accidents locations in 2007
Fatal accidents locations in 2008
Fatal accidents locations in 2009
Fatal accidents locations in 2010
Fatal accidents locations in 2011
Fatal accidents locations in 2012
Fatal accidents locations in 2013
Fatal accidents locations in 2014
Fatal accidents locations in 2015
Fatal accidents locations in 2016
Fatal accidents locations in 2017
Fatal accidents locations in 2018
Fatal accidents locations in 2019
Fatal accidents locations in 2020
Fatal accidents locations in 2021
Alcohol use - People drinking some alcohol every month (%)
Alcohol use - People not drinking at all (%)
Alcohol use - Average days/month drinking alcohol
Alcohol use - Average drinks/week
Alcohol use - Average days/year people drink much
Audiometry - Average condition of hearing (%)
Audiometry - People that can hear a whisper from across a quiet room (%)
Audiometry - People that can hear normal voice from across a quiet room (%)
Audiometry - Ears ringing, roaring, buzzing (%)
Audiometry - Had a job exposure to loud noise (%)
Audiometry - Had off-work exposure to loud noise (%)
Blood Pressure & Cholesterol - Has high blood pressure (%)
Blood Pressure & Cholesterol - Checking blood pressure at home (%)
Blood Pressure & Cholesterol - Frequently checking blood cholesterol (%)
Blood Pressure & Cholesterol - Has high cholesterol level (%)
Consumer Behavior - Money monthly spent on food at supermarket/grocery store
Consumer Behavior - Money monthly spent on food at other stores
Consumer Behavior - Money monthly spent on eating out
Consumer Behavior - Money monthly spent on carryout/delivered foods
Consumer Behavior - Income spent on food at supermarket/grocery store (%)
Consumer Behavior - Income spent on food at other stores (%)
Consumer Behavior - Income spent on eating out (%)
Consumer Behavior - Income spent on carryout/delivered foods (%)
Current Health Status - General health condition (%)
Current Health Status - Blood donors (%)
Current Health Status - Has blood ever tested for HIV virus (%)
Current Health Status - Left-handed people (%)
Dermatology - People using sunscreen (%)
Diabetes - Diabetics (%)
Diabetes - Had a blood test for high blood sugar (%)
Diabetes - People taking insulin (%)
Diet Behavior & Nutrition - Diet health (%)
Diet Behavior & Nutrition - Milk product consumption (# of products/month)
Diet Behavior & Nutrition - Meals not home prepared (#/week)
Diet Behavior & Nutrition - Meals from fast food or pizza place (#/week)
Diet Behavior & Nutrition - Ready-to-eat foods (#/month)
Diet Behavior & Nutrition - Frozen meals/pizza (#/month)
Drug Use - People that ever used marijuana or hashish (%)
Drug Use - Ever used hard drugs (%)
Drug Use - Ever used any form of cocaine (%)
Drug Use - Ever used heroin (%)
Drug Use - Ever used methamphetamine (%)
Health Insurance - People covered by health insurance (%)
Kidney Conditions-Urology - Avg. # of times urinating at night
Medical Conditions - People with asthma (%)
Medical Conditions - People with anemia (%)
Medical Conditions - People with psoriasis (%)
Medical Conditions - People with overweight (%)
Medical Conditions - Elderly people having difficulties in thinking or remembering (%)
Medical Conditions - People who ever received blood transfusion (%)
Medical Conditions - People having trouble seeing even with glass/contacts (%)
Medical Conditions - People with arthritis (%)
Medical Conditions - People with gout (%)
Medical Conditions - People with congestive heart failure (%)
Medical Conditions - People with coronary heart disease (%)
Medical Conditions - People with angina pectoris (%)
Medical Conditions - People who ever had heart attack (%)
Medical Conditions - People who ever had stroke (%)
Medical Conditions - People with emphysema (%)
Medical Conditions - People with thyroid problem (%)
Medical Conditions - People with chronic bronchitis (%)
Medical Conditions - People with any liver condition (%)
Medical Conditions - People who ever had cancer or malignancy (%)
Mental Health - People who have little interest in doing things (%)
Mental Health - People feeling down, depressed, or hopeless (%)
Mental Health - People who have trouble sleeping or sleeping too much (%)
Mental Health - People feeling tired or having little energy (%)
Mental Health - People with poor appetite or overeating (%)
Mental Health - People feeling bad about themself (%)
Mental Health - People who have trouble concentrating on things (%)
Mental Health - People moving or speaking slowly or too fast (%)
Mental Health - People having thoughts they would be better off dead (%)
Oral Health - Average years since last visit a dentist
Oral Health - People embarrassed because of mouth (%)
Oral Health - People with gum disease (%)
Oral Health - General health of teeth and gums (%)
Oral Health - Average days a week using dental floss/device
Oral Health - Average days a week using mouthwash for dental problem
Oral Health - Average number of teeth
Pesticide Use - Households using pesticides to control insects (%)
Pesticide Use - Households using pesticides to kill weeds (%)
Physical Activity - People doing vigorous-intensity work activities (%)
Physical Activity - People doing moderate-intensity work activities (%)
Physical Activity - People walking or bicycling (%)
Physical Activity - People doing vigorous-intensity recreational activities (%)
Physical Activity - People doing moderate-intensity recreational activities (%)
Physical Activity - Average hours a day doing sedentary activities
Physical Activity - Average hours a day watching TV or videos
Physical Activity - Average hours a day using computer
Physical Functioning - People having limitations keeping them from working (%)
Physical Functioning - People limited in amount of work they can do (%)
Physical Functioning - People that need special equipment to walk (%)
Physical Functioning - People experiencing confusion/memory problems (%)
Physical Functioning - People requiring special healthcare equipment (%)
Prescription Medications - Average number of prescription medicines taking
Preventive Aspirin Use - Adults 40+ taking low-dose aspirin (%)
Reproductive Health - Vaginal deliveries (%)
Reproductive Health - Cesarean deliveries (%)
Reproductive Health - Deliveries resulted in a live birth (%)
Reproductive Health - Pregnancies resulted in a delivery (%)
Reproductive Health - Women breastfeeding newborns (%)
Reproductive Health - Women that had a hysterectomy (%)
Reproductive Health - Women that had both ovaries removed (%)
Reproductive Health - Women that have ever taken birth control pills (%)
Reproductive Health - Women taking birth control pills (%)
Reproductive Health - Women that have ever used Depo-Provera or injectables (%)
Reproductive Health - Women that have ever used female hormones (%)
Sexual Behavior - People 18+ that ever had sex (vaginal, anal, or oral) (%)
Sexual Behavior - Males 18+ that ever had vaginal sex with a woman (%)
Sexual Behavior - Males 18+ that ever performed oral sex on a woman (%)
Sexual Behavior - Males 18+ that ever had anal sex with a woman (%)
Sexual Behavior - Males 18+ that ever had any sex with a man (%)
Sexual Behavior - Females 18+ that ever had vaginal sex with a man (%)
Sexual Behavior - Females 18+ that ever performed oral sex on a man (%)
Sexual Behavior - Females 18+ that ever had anal sex with a man (%)
Sexual Behavior - Females 18+ that ever had any kind of sex with a woman (%)
Sexual Behavior - Average age people first had sex
Sexual Behavior - Average number of female sex partners in lifetime (males 18+)
Sexual Behavior - Average number of female vaginal sex partners in lifetime (males 18+)
Sexual Behavior - Average age people first performed oral sex on a woman (18+)
Sexual Behavior - Average number of woman performed oral sex on in lifetime (18+)
Sexual Behavior - Average number of male sex partners in lifetime (males 18+)
Sexual Behavior - Average number of male anal sex partners in lifetime (males 18+)
Sexual Behavior - Average age people first performed oral sex on a man (18+)
Sexual Behavior - Average number of male oral sex partners in lifetime (18+)
Sexual Behavior - People using protection when performing oral sex (%)
Sexual Behavior - Average number of times people have vaginal or anal sex a year
Sexual Behavior - People having sex without condom (%)
Sexual Behavior - Average number of male sex partners in lifetime (females 18+)
Sexual Behavior - Average number of male vaginal sex partners in lifetime (females 18+)
Sexual Behavior - Average number of female sex partners in lifetime (females 18+)
Sexual Behavior - Circumcised males 18+ (%)
Sleep Disorders - Average hours sleeping at night
Sleep Disorders - People that has trouble sleeping (%)
Smoking-Cigarette Use - People smoking cigarettes (%)
Taste & Smell - People 40+ having problems with smell (%)
Taste & Smell - People 40+ having problems with taste (%)
Taste & Smell - People 40+ that ever had wisdom teeth removed (%)
Taste & Smell - People 40+ that ever had tonsils teeth removed (%)
Taste & Smell - People 40+ that ever had a loss of consciousness because of a head injury (%)
Taste & Smell - People 40+ that ever had a broken nose or other serious injury to face or skull (%)
Taste & Smell - People 40+ that ever had two or more sinus infections (%)
Weight - Average height (inches)
Weight - Average weight (pounds)
Weight - Average BMI
Weight - People that are obese (%)
Weight - People that ever were obese (%)
Weight - People trying to lose weight (%)
8,685 50.4% Hispanic 5,400 31.4% White alone 1,599 9.3% Black alone 609 3.5% Two or more races 454 2.6% American Indian alone 276 1.6% Asian alone 253 1.5% Native Hawaiian and Other 34 0.2% Other race alone
Officers per 1,000 residents here:
1.79Arizona average:
1.75
Latest news from Eloy, AZ collected exclusively by city-data.com from local newspapers, TV, and radio stations
Ancestries: German (3.6%), European (3.4%), English (2.9%), Irish (2.5%), American (2.0%), African (1.6%).
Current Local Time:
Land area: 71.7 square miles.
Population density: 238 people per square mile (very low).
2,764 residents are foreign born (13.9% Latin America ).
This city:
16.1%Arizona:
13.0%
Median real estate property taxes paid for housing units with mortgages in 2022: $1,096 (0.4%)Median real estate property taxes paid for housing units with no mortgage in 2022: $1,080 (0.4%)
Nearest city with pop. 50,000+: San Tan Valley, AZ (29.6 miles
Nearest city with pop. 200,000+: Mesa, AZ
Nearest city with pop. 1,000,000+: Phoenix, AZ
Nearest cities:
Vaiva Vo, AZ (4.4 miles),
Tat Momoli, AZ (4.4 miles)
Latitude: 32.76 N, Longitude: 111.60 W
Daytime population change due to commuting: +181 (+1.1%)Workers who live and work in this city: 1,356 (36.7%)
Area code commonly used in this area: 520
Single-family new house construction building permits:
2022: 221 buildings , average cost: $273,5002021: 301 buildings , average cost: $215,9002020: 116 buildings , average cost: $222,5002019: 127 buildings , average cost: $191,9002018: 135 buildings , average cost: $197,3002017: 117 buildings , average cost: $183,0002016: 87 buildings , average cost: $185,3002015: 79 buildings , average cost: $229,7002014: 83 buildings , average cost: $166,9002013: 104 buildings , average cost: $142,9002012: 45 buildings , average cost: $162,8002011: 50 buildings , average cost: $156,0002010: 77 buildings , average cost: $157,4002009: 38 buildings , average cost: $148,7002008: 37 buildings , average cost: $146,2002007: 156 buildings , average cost: $113,2002006: 305 buildings , average cost: $116,4002005: 84 buildings , average cost: $74,3002004: 51 buildings , average cost: $71,6002003: 35 buildings , average cost: $72,0002002: 45 buildings , average cost: $62,7002001: 33 buildings , average cost: $69,8002000: 18 buildings , average cost: $76,5001999: 26 buildings , average cost: $65,6001998: 13 buildings , average cost: $63,7001997: 27 buildings , average cost: $50,300Unemployment in December 2023:
Population change in the 1990s: +3,192 (+44.4%).
Most common occupations in Eloy, AZ (%)
Both Males Females
Agricultural workers, including supervisors (8.9%)
Building and grounds cleaning and maintenance occupations (5.7%)
Cooks and food preparation workers (4.8%)
Cashiers (4.2%)
Other production occupations, including supervisors (4.1%)
Metal workers and plastic workers (3.8%)
Laborers and material movers, hand (3.8%)
Agricultural workers, including supervisors (14.6%)
Building and grounds cleaning and maintenance occupations (6.9%)
Metal workers and plastic workers (6.0%)
Laborers and material movers, hand (5.7%)
Other production occupations, including supervisors (4.6%)
Other material moving workers, except laborers (4.4%)
Construction traders workers except carpenters, electricians, painters, plumbers, and construction laborers (3.9%)
Cashiers (10.0%)
Cooks and food preparation workers (7.2%)
Secretaries and administrative assistants (6.0%)
Information and record clerks, except customer service representatives (5.4%)
Waiters and waitresses (4.2%)
Building and grounds cleaning and maintenance occupations (4.1%)
Other teachers, instructors, education, training, and library occupations (3.5%)
Earthquake activity:
Eloy-area historical earthquake activity is significantly above Arizona state average. It is 1974% greater than the overall U.S. average. On 6/28/1992 at 11:57:34, a magnitude 7.6 (6.2 MB, 7.6 MS, 7.3 MW, Depth: 0.7 mi, Class: Major, Intensity: VIII - XII) earthquake occurred 301.0 miles away from the city center, causing 3 deaths ( 1 shaking deaths, 2 other deaths) and 400 injuries, causing $100,000,000 total damage and $40,000,000 insured lossesOn 5/19/1940 at 04:36:40, a magnitude 7.2 (7.2 UK) earthquake occurred 239.8 miles away from Eloy center, causing $33,000,000 total damage On 10/16/1999 at 09:46:44, a magnitude 7.4 (6.3 MB, 7.4 MS, 7.2 MW, 7.3 ML) earthquake occurred 303.6 miles away from Eloy center On 12/31/1934 at 18:45:56, a magnitude 7.1 (7.1 UK) earthquake occurred 242.2 miles away from Eloy center On 10/15/1979 at 23:16:54, a magnitude 7.0 (5.7 MB, 6.9 MS, 7.0 ML, 6.4 MW) earthquake occurred 234.9 miles away from the city center On 11/24/1987 at 13:15:56, a magnitude 6.7 (6.0 MB, 6.6 MS, 6.7 ML, 6.1 ML, Class: Strong, Intensity: VII - IX) earthquake occurred 253.6 miles away from Eloy center Magnitude types: body-wave magnitude (MB), local magnitude (ML), surface-wave magnitude (MS), moment magnitude (MW) Natural disasters: The number of natural disasters in Pinal County (15) is near the US average (15).Major Disasters (Presidential) Declared: 9Emergencies Declared: 2Floods: 9, Storms: 8, Fires: 3, Drought: 1, Hurricane: 1, Tornado: 1, Other: 1 (Note: some incidents may be assigned to more than one category). Hospitals and medical centers near Eloy: CASA GRANDE REGIONAL MEDICAL CENTER (about 11 miles away; CASA GRANDE, AZ)
WESTERN SKIES DIALYSIS INC. (Dialysis Facility, about 11 miles away; CASA GRANDE, AZ)
EL SOL HOME HEALTH INC (Home Health Center, about 12 miles away; CASA GRANDE, AZ)
OASIS HOME HEALTH CARE (Home Health Center, about 13 miles away; CASA GRANDE, AZ)
CASA GRANDE DIALYSIS (FMC) (Dialysis Facility, about 13 miles away; CASA GRANDE, AZ)
OASIS PAVILION NURSING AND REHABILITATION CENTER (Nursing Home, about 15 miles away; CASA GRANDE, AZ)
Airports located in Eloy: Colleges/universities with over 2000 students nearest to Eloy:
Central Arizona College (about 14 miles; Coolidge, AZ ; Full-time enrollment: 4,893)
Arizona State University-Polytechnic (about 38 miles; Mesa, AZ ; FT enrollment: 3,311)
Chandler-Gilbert Community College (about 39 miles; Chandler, AZ ; FT enrollment: 8,047)
Mesa Community College (about 47 miles; Mesa, AZ ; FT enrollment: 14,726)
University of Phoenix-Phoenix Campus (about 50 miles; Tempe, AZ ; FT enrollment: 3,862)
Arizona State University-Tempe (about 50 miles; Tempe, AZ ; FT enrollment: 45,951)
University of Phoenix-Online Campus (about 50 miles; Phoenix, AZ ; FT enrollment: 155,655)
See full list of schools located in Eloy Library in Eloy: ELOY PUBLIC LIBRARY Operating income: $257,334; Location: 100 EAST 7TH STREET; 26,597 books ; 504 audio materials ; 639 video materials ; 33 state licensed databases ; 8 other licensed databases ; 69 print serial subscriptions )
Notable locations in Eloy: (A) , Eloy Business Park (B) , Eloy Railroad Station (C) , Toltec Community Center (D) , Toltec Railroad Station (E) , Eloy Public Library (F) , Eloy Fire District Station 522 (G) , Eloy Fire District Station 521 (H) , Eloy Police Department (I) . Display/hide their locations on the map
Churches in Eloy include: (A) , First United Methodist Church (B) , First Assembly of God (C) , Estrella Community Church (D) , Church of Christ (E) , Toltec Evangelical Methodist Church (F) , Westside Church of God in Christ (G) , Saint Helen of the Cross Roman Catholic Church (H) , Iglesia Del Valle (I) . Display/hide their locations on the map
Parks in Eloy include: (1) , Jones Park (2) , Washington Mini Park Site (3) , Tumble Weed Park (4) , Toltec Mini Park (5) , Southwest Gas Site Mini Park (6) , North Park (7) , Curiel School Mini Park Site (8) , City Park (9) . Display/hide their locations on the map
Tourist attractions: (1) , High But Dry Balloons (1005 North Tumbleweed Road) (2) . Display/hide their approximate locations on the map
Courts: (1) , Eloy City - City Court (628 North Main Street) (2) . Display/hide their approximate locations on the map
Birthplace of: Levi Jones - 2005 NFL player (Cincinnati Bengals, born : Aug 24, 1979), Mossy Cade - Football player, Ricky Nelson (baseball) - Baseball player.
Pinal County has a predicted average indoor radon screening level between 2 and 4 pCi/L (pico curies per liter) - Moderate Potential Drinking water stations with addresses in Eloy and their reported violations in the past:
ELOY CITY OF (Address: 1137 W HOUSER RD Population served: 9,700, Groundwater):
Past health violations:
MCL, Average - Between JAN-2012 and MAR-2012, Contaminant: Nitrate. Follow-up actions: St Compliance achieved (MAR-14-2013)
Past monitoring violations:
Follow-up Or Routine LCR Tap M/R - In OCT-01-2013, Contaminant: Lead and Copper Rule. Follow-up actions: St Violation/Reminder Notice (DEC-23-2013)
Monitoring and Reporting (DBP) - Between JAN-2012 and DEC-2012, Contaminant: TTHM. Follow-up actions: St Violation/Reminder Notice (APR-23-2013), St Compliance achieved (SEP-13-2013)
Monitoring and Reporting (DBP) - Between JAN-2012 and DEC-2012, Contaminant: Total Haloacetic Acids (HAA5). Follow-up actions: St Violation/Reminder Notice (APR-23-2013), St Compliance achieved (SEP-13-2013)
Monitoring and Reporting (DBP) - Between JAN-2011 and DEC-2011, Contaminant: TTHM. Follow-up actions: St Formal NOV issued (MAR-22-2013), St Compliance achieved (MAY-15-2013)
Monitoring and Reporting (DBP) - Between JAN-2011 and DEC-2011, Contaminant: Total Haloacetic Acids (HAA5). Follow-up actions: St Formal NOV issued (MAR-22-2013), St Compliance achieved (MAY-15-2013)
9 routine major monitoring violations
12 regular monitoring violations
19 other older monitoring violations
Average household size: This city:
3.1 peopleArizona:
2.6 people
Percentage of family households: This city:
76.7%Whole state:
66.2%
Percentage of households with unmarried partners: This city:
10.7%Whole state:
7.8%
Likely homosexual households (counted as self-reported same-sex unmarried-partner households)
Lesbian couples: 0.2% of all households Gay men: 0.2% of all households
7,293 people in federal detention centers in 2010people in group homes intended for adults in 2010People in group quarters in Eloy in 2000:
957 people in other types of correctional institutions
525 people in federal prisons and detention centers
6 people in other noninstitutional group quarters
Banks with branches in Eloy (2011 data):
Great Western Bank: Eloy Branch at 500 Main Street, branch established on 1949/09/19. Info updated 2010/06/08: Bank assets: $8,458.0 mil, Deposits: $6,362.5 mil, headquarters in Watertown, SD, positive income , Commercial Lending Specialization, 187 total offices , Holding Company: National Australia Bank Limited
For population 15 years and over in Eloy:
Never married: 45.8%Now married: 34.5%Separated: 3.4%Widowed: 2.4%Divorced: 13.8% For population 25 years and over in Eloy:
High school or higher: 74.9%Bachelor's degree or higher: 10.0%Graduate or professional degree: 2.4%Unemployed: 10.8%Mean travel time to work (commute): 23.8 minutes
Education Gini index (Inequality in education) Here:
12.9Arizona average:
12.2
Religion statistics for Eloy, AZ (based on Pinal County data)
Religion Adherents Congregations Catholic 39,268 20 Evangelical Protestant 20,514 155 Other 15,394 45 Mainline Protestant 5,869 21 Black Protestant 369 3 Orthodox 200 1 None 294,156 -
Source: Clifford Grammich, Kirk Hadaway, Richard Houseal, Dale E.Jones, Alexei Krindatch, Richie Stanley and Richard H.Taylor. 2012. 2010 U.S.Religion Census: Religious Congregations & Membership Study. Association of Statisticians of American Religious Bodies. Jones, Dale E., et al. 2002. Congregations and Membership in the United States 2000. Nashville, TN: Glenmary Research Center. Graphs represent county-level data
Food Environment Statistics: Number of grocery stores : 34Here :
1.13 / 10,000 pop.Arizona :
1.36 / 10,000 pop.
Number of supercenters and club stores : 3This county :
0.10 / 10,000 pop.Arizona :
0.14 / 10,000 pop.
Number of convenience stores (no gas) : 11Pinal County :
0.37 / 10,000 pop.Arizona :
0.55 / 10,000 pop.
Number of convenience stores (with gas) : 60This county :
1.99 / 10,000 pop.State :
2.47 / 10,000 pop.
Number of full-service restaurants : 107Here :
3.56 / 10,000 pop.State :
6.21 / 10,000 pop.
Adult diabetes rate : This county :
8.0%State :
8.0%
Adult obesity rate : Pinal County :
28.1%Arizona :
22.8%
Low-income preschool obesity rate : Health and Nutrition:
Average overall health of teeth and gums : People feeling badly about themselves : This city:
22.1%Arizona:
20.8%
People not drinking alcohol at all : Average hours sleeping at night : Overweight people : This city:
31.3%Arizona:
33.5%
General health condition : This city:
54.7%Arizona:
56.1%
Average condition of hearing : More about Health and Nutrition of Eloy, AZ Residents
Local government employment and payroll (March 2022)
Function
Full-time employees
Monthly full-time payroll
Average yearly full-time wage
Part-time employees
Monthly part-time payroll
Police Protection - Officers
27 $173,294 $77,020 0 $0 Other Government Administration
20 $116,146 $69,688 0 $0 Parks and Recreation
11 $42,559 $46,428 8 $11,384 Police - Other
11 $62,159 $67,810 1 $1,716 Water Supply
10 $44,855 $53,826 0 $0 Streets and Highways
9 $33,245 $44,327 0 $0 Other and Unallocable
7 $30,522 $52,323 0 $0 Financial Administration
5 $26,328 $63,187 0 $0 Judicial and Legal
4 $17,991 $53,973 0 $0 Local Libraries
4 $17,692 $53,076 1 $1,087 Solid Waste Management
3 $9,411 $37,644 0 $0
Totals for Government
111 $574,202 $62,076 10 $14,187
Eloy government finances - Expenditure in 2021 (per resident):
Construction - Air Transportation: $5,924,000 ($347.61)
Police Protection: $5,839,000 ($342.62)Regular Highways: $2,265,000 ($132.91)Housing and Community Development: $496,000 ($29.10)Current Operations - Police Protection: $4,878,000 ($286.23)
Financial Administration: $3,003,000 ($176.21)Water Utilities: $2,664,000 ($156.32)Solid Waste Management: $1,748,000 ($102.57)Regular Highways: $1,577,000 ($92.54)Sewerage: $1,403,000 ($82.33)Parks and Recreation: $1,365,000 ($80.10)Judicial and Legal Services: $570,000 ($33.45)General Public Buildings: $562,000 ($32.98)Libraries: $195,000 ($11.44)General - Other: $85,000 ($4.99)Air Transportation: $52,000 ($3.05)General - Interest on Debt: $246,000 ($14.43)
Other Capital Outlay - Parks and Recreation: $419,000 ($24.59)
Financial Administration: $352,000 ($20.65)Police Protection: $320,000 ($18.78)Water Utilities: $249,000 ($14.61)Judicial and Legal Services: $40,000 ($2.35)Regular Highways: $40,000 ($2.35)Air Transportation: $22,000 ($1.29)Total Salaries and Wages: $15,676,000 ($919.85)
Water Utilities - Interest on Debt: $67,000 ($3.93)
Eloy government finances - Revenue in 2021 (per resident):
Charges - Solid Waste Management: $1,884,000 ($110.55)
Sewerage: $1,547,000 ($90.78)Other: $688,000 ($40.37)Air Transportation: $188,000 ($11.03)Parks and Recreation: $28,000 ($1.64)Federal Intergovernmental - Other: $8,749,000 ($513.38)
Air Transportation: $4,513,000 ($264.82)Housing and Community Development: $414,000 ($24.29)Local Intergovernmental - Highways: $1,107,000 ($64.96)
Other: $611,000 ($35.85)Miscellaneous - Fines and Forfeits: $309,000 ($18.13)
Interest Earnings: $68,000 ($3.99)Rents: $27,000 ($1.58)Sale of Property: $9,000 ($0.53)Revenue - Water Utilities: $2,818,000 ($165.36)
State Intergovernmental - General Local Government Support: $6,553,000 ($384.52)
Highways: $1,683,000 ($98.76)Other: $326,000 ($19.13)Tax - General Sales and Gross Receipts: $7,495,000 ($439.80)
Property: $1,168,000 ($68.54)Other License: $631,000 ($37.03)Public Utilities Sales: $179,000 ($10.50)Occupation and Business License - Other: $36,000 ($2.11)
Eloy government finances - Debt in 2021 (per resident):
Long Term Debt - Beginning Outstanding - Unspecified Public Purpose: $9,168,000 ($537.97)
Outstanding Unspecified Public Purpose: $8,415,000 ($493.78)Retired Unspecified Public Purpose: $752,000 ($44.13)Beginning Outstanding - Public Debt for Private Purpose: $305,000 ($17.90)Outstanding Nonguaranteed - Industrial Revenue: $259,000 ($15.20)Retired Nonguaranteed - Public Debt for Private Purpose: $46,000 ($2.70)
Eloy government finances - Cash and Securities in 2021 (per resident):
Other Funds - Cash and Securities: $29,222,000 ($1714.70)
Sinking Funds - Cash and Securities: $259,000 ($15.20)
14.18% of this county's 2021 resident taxpayers lived in other counties in 2020 ($62,767 average adjusted gross income )
Here:
14.18%Arizona average:
6.85%
0.02% of residents moved from foreign countries ($82 average AGI )Pinal County:
0.02%Arizona average:
0.03%
Top counties from which taxpayers relocated into this county between 2020 and 2021:
9.81% of this county's 2020 resident taxpayers moved to other counties in 2021 ($54,187 average adjusted gross income )
Here:
9.81%Arizona average:
5.72%
0.02% of residents moved to foreign countries ($91 average AGI )Pinal County:
0.02%Arizona average:
0.03%
Top counties to which taxpayers relocated from this county between 2020 and 2021:
Businesses in Eloy, AZ
Name Count Name Count
Burger King 1 H&R Block 1 Carl\s Jr. 1 McDonald's 1 Circle K 3 Motel 6 1 Dairy Queen 1 Pizza Hut 1 Days Inn 1 Subway 2 Dennys 1 Travelodge 1 FedEx 2 UPS 4
Strongest AM radio stations in Eloy:
KFLT (830 AM; 50 kW; TUCSON, AZ; Owner: FAMILY LIFE B/CING SYSTEM, INC.)
KUAZ (1550 AM; daytime; 50 kW; TUCSON, AZ; Owner: ARIZONA BOARD OF REGENTS)
KCKY (1150 AM; 5 kW; COOLIDGE, AZ; Owner: CORTARO BROADCASTING CORPORATION)
KMIK (1580 AM; 50 kW; TEMPE, AZ; Owner: ABC, INC.)
KSAZ (580 AM; 5 kW; MARANA, AZ; Owner: OWL BROADCASTING & DEVELOPMENT, INC.)
KPXQ (1360 AM; 50 kW; GLENDALE, AZ; Owner: COMMON GROUND BROADCASTING, INC.)
KFNX (1100 AM; 50 kW; CAVE CREEK, AZ; Owner: NORTH AMERICAN BROADCASTING CO., INC.)
KMIA (710 AM; 50 kW; BLACK CANYON CITY, AZ; Owner: ENTRAVISION HOLDINGS, LLC)
KEVT (1030 AM; 10 kW; CORTARO, AZ; Owner: ONE MART CORP.)
KXEM (1010 AM; 15 kW; TOLLESON, AZ; Owner: JAMES CRYSTAL ENTERPRISES OF PHOENIX, INC.)
KTKT (990 AM; 10 kW; TUCSON, AZ; Owner: ARIZONA LOTUS CORP.)
KFYI (550 AM; 5 kW; PHOENIX, AZ; Owner: AMFM RADIO LICENSES, L.L.C.)
KFNN (1510 AM; 22 kW; MESA, AZ; Owner: CRC BROADCASTING COMPANY, INC.)
Strongest FM radio stations in Eloy:
KCDX (103.1 FM; FLORENCE, AZ; Owner: DESERT WEST AIR RANCHERS CORPORATION)
KKMR (106.5 FM; ARIZONA CITY, AZ; Owner: HBC LICENSE CORPORATION)
KZLZ-FM2 (105.3 FM; TUCSON, AZ; Owner: ENTRAVISION HOLDINGS, LLC)
K263AA (100.5 FM; TUCSON, AZ; Owner: EDUCATIONAL MEDIA FOUNDATION)
K255AC (98.9 FM; TUCSON, AZ; Owner: MARICOPA COUNTY COMMUN. COLLEGE DIST)
KUAT-FM (90.5 FM; TUCSON, AZ; Owner: ARIZONA BOARD OF REGENTS)
KXCI (91.3 FM; TUCSON, AZ; Owner: FOUNDATION FOR CREATIVE BROADCASTING, INC.)
K292CM (106.3 FM; SUMMERHAVEN, AZ; Owner: ARIZONA LOTUS CORPORATION)
KZLZ-FM1 (105.3 FM; TUCSON, AZ; Owner: ENTRAVISION HOLDINGS, LLC)
KMRR (100.3 FM; GLOBE, AZ; Owner: HBC LICENSE CORPORATION)
KVJC (91.9 FM; GLOBE, AZ; Owner: CSN INTERNATIONAL)
KGMG (106.3 FM; ORACLE, AZ; Owner: JOURNAL BROADCAST CORPORATION)
KRXS-FM (97.3 FM; GLOBE, AZ; Owner: LINDA C. POTYKA)
KIIM-FM (99.5 FM; TUCSON, AZ; Owner: CITADEL BROADCASTING COMPANY)
KOYT (92.9 FM; TUCSON, AZ; Owner: CAPSTAR TX LIMITED PARTNERSHIP)
KHYT (107.5 FM; TUCSON, AZ; Owner: CITADEL BROADCASTING COMPANY)
KRQQ (93.7 FM; TUCSON, AZ; Owner: CAPSTAR TX LIMITED PARTNERSHIP)
KEDJ (103.9 FM; GILBERT, AZ; Owner: NPR PHOENIX, LLC)
KMXZ-FM (94.9 FM; TUCSON, AZ; Owner: JOURNAL BROADCAST CORPORATION)
KLPX (96.1 FM; TUCSON, AZ; Owner: ARIZONA LOTUS CORPORATION)
TV broadcast stations around Eloy:
KAET (Channel 8; PHOENIX, AZ; Owner: ARIZONA BOARD OF REGENTS)
National Bridge Inventory (NBI) Statistics 38 Number of bridges285ft / 87.3m Total length $8,000 Total costs491,063 Total average daily traffic94,050 Total average daily truck traffic
New bridges - historical statistics
1 1940-1949 5 1950-1959 7 1960-1969 1 1970-1979 19 1980-1989 3 2000-2009 2 2010-2019
See full National Bridge Inventory statistics for Eloy, AZ
Home Mortgage Disclosure Act Aggregated Statistics For Year 2009(Based on 2 partial tracts) A) FHA, FSA/RHS & VA B) Conventional C) Refinancings D) Home Improvement Loans F) Non-occupant Loans on G) Loans On Manufactured Number Average Value Number Average Value Number Average Value Number Average Value Number Average Value Number Average Value
LOANS ORIGINATED 12 $107,733 27 $164,100 28 $160,432 0 $0 20 $166,493 3 $93,207 APPLICATIONS APPROVED, NOT ACCEPTED 1 $75,510 2 $130,915 6 $172,460 1 $27,130 2 $156,345 1 $95,830 APPLICATIONS DENIED 2 $55,880 6 $95,803 31 $160,734 5 $31,458 7 $186,240 6 $67,443 APPLICATIONS WITHDRAWN 1 $70,340 5 $179,804 14 $148,543 2 $65,025 3 $220,823 2 $120,245 FILES CLOSED FOR INCOMPLETENESS 0 $0 1 $153,280 3 $85,347 0 $0 1 $37,980 1 $52,420
Aggregated Statistics For Year 2008(Based on 2 partial tracts) A) FHA, FSA/RHS & VA B) Conventional C) Refinancings D) Home Improvement Loans F) Non-occupant Loans on G) Loans On Manufactured Number Average Value Number Average Value Number Average Value Number Average Value Number Average Value Number Average Value
LOANS ORIGINATED 11 $121,991 29 $181,246 25 $135,558 2 $116,040 19 $178,388 6 $102,473 APPLICATIONS APPROVED, NOT ACCEPTED 2 $134,720 3 $206,473 8 $118,671 0 $0 3 $128,537 3 $81,023 APPLICATIONS DENIED 3 $106,040 13 $201,789 65 $124,926 14 $64,434 12 $161,197 16 $108,501 APPLICATIONS WITHDRAWN 2 $96,300 5 $265,050 20 $137,598 3 $73,267 4 $170,285 5 $153,254 FILES CLOSED FOR INCOMPLETENESS 1 $113,660 0 $0 5 $185,512 0 $0 0 $0 1 $102,530
Aggregated Statistics For Year 2007(Based on 2 partial tracts) A) FHA, FSA/RHS & VA B) Conventional C) Refinancings D) Home Improvement Loans F) Non-occupant Loans on G) Loans On Manufactured Number Average Value Number Average Value Number Average Value Number Average Value Number Average Value Number Average Value
LOANS ORIGINATED 8 $113,606 130 $195,190 71 $125,883 9 $83,152 71 $183,569 15 $95,551 APPLICATIONS APPROVED, NOT ACCEPTED 0 $0 23 $184,676 19 $104,596 6 $33,280 13 $196,358 3 $91,190 APPLICATIONS DENIED 1 $95,770 22 $189,500 112 $117,044 40 $52,038 20 $139,508 29 $66,325 APPLICATIONS WITHDRAWN 1 $96,170 21 $203,830 34 $120,294 4 $93,245 13 $163,800 4 $81,025 FILES CLOSED FOR INCOMPLETENESS 1 $97,360 3 $110,703 8 $160,834 0 $0 2 $117,010 0 $0
Aggregated Statistics For Year 2006(Based on 2 partial tracts) A) FHA, FSA/RHS & VA B) Conventional C) Refinancings D) Home Improvement Loans F) Non-occupant Loans on G) Loans On Manufactured Number Average Value Number Average Value Number Average Value Number Average Value Number Average Value Number Average Value
LOANS ORIGINATED 6 $149,217 194 $138,638 93 $115,747 16 $64,425 93 $141,350 20 $99,544 APPLICATIONS APPROVED, NOT ACCEPTED 0 $0 25 $125,159 19 $98,629 5 $33,698 12 $110,399 7 $85,379 APPLICATIONS DENIED 1 $199,730 47 $110,968 95 $106,673 39 $55,435 28 $103,256 28 $91,280 APPLICATIONS WITHDRAWN 2 $133,735 23 $130,973 45 $103,555 9 $58,694 11 $116,003 5 $46,142 FILES CLOSED FOR INCOMPLETENESS 0 $0 6 $149,933 9 $124,688 0 $0 3 $161,530 1 $162,540
Aggregated Statistics For Year 2005(Based on 2 partial tracts) A) FHA, FSA/RHS & VA B) Conventional C) Refinancings D) Home Improvement Loans E) Loans on Dwellings For 5+ Families F) Non-occupant Loans on G) Loans On Manufactured Number Average Value Number Average Value Number Average Value Number Average Value Number Average Value Number Average Value Number Average Value
LOANS ORIGINATED 5 $127,148 105 $98,087 54 $93,957 11 $37,508 1 $472,910 55 $99,319 19 $102,008 APPLICATIONS APPROVED, NOT ACCEPTED 1 $137,500 13 $95,156 15 $79,743 3 $27,157 0 $0 3 $182,907 8 $84,598 APPLICATIONS DENIED 2 $73,675 31 $106,826 98 $85,653 21 $42,376 0 $0 16 $86,936 23 $84,860 APPLICATIONS WITHDRAWN 0 $0 13 $95,852 39 $91,288 8 $109,676 0 $0 5 $104,074 3 $46,263 FILES CLOSED FOR INCOMPLETENESS 0 $0 4 $78,625 12 $91,138 1 $14,110 0 $0 2 $103,670 1 $95,880
Aggregated Statistics For Year 2004(Based on 2 partial tracts) A) FHA, FSA/RHS & VA B) Conventional C) Refinancings D) Home Improvement Loans E) Loans on Dwellings For 5+ Families F) Non-occupant Loans on G) Loans On Manufactured Number Average Value Number Average Value Number Average Value Number Average Value Number Average Value Number Average Value Number Average Value
LOANS ORIGINATED 7 $92,941 54 $78,881 58 $76,084 16 $19,646 1 $480,460 23 $81,351 15 $74,019 APPLICATIONS APPROVED, NOT ACCEPTED 0 $0 6 $89,503 19 $72,254 3 $20,030 0 $0 3 $40,320 6 $54,703 APPLICATIONS DENIED 0 $0 13 $80,068 84 $69,449 27 $23,487 0 $0 9 $51,616 18 $58,112 APPLICATIONS WITHDRAWN 1 $76,300 6 $117,302 43 $76,682 4 $28,945 0 $0 5 $103,146 6 $61,607 FILES CLOSED FOR INCOMPLETENESS 0 $0 1 $155,550 5 $74,418 1 $17,490 0 $0 1 $32,590 1 $94,940
Aggregated Statistics For Year 2003(Based on 2 partial tracts) A) FHA, FSA/RHS & VA B) Conventional C) Refinancings D) Home Improvement Loans F) Non-occupant Loans on Number Average Value Number Average Value Number Average Value Number Average Value Number Average Value
LOANS ORIGINATED 8 $81,222 30 $83,570 59 $71,952 6 $14,965 17 $66,387 APPLICATIONS APPROVED, NOT ACCEPTED 3 $105,310 4 $57,832 21 $74,238 2 $29,200 1 $73,120 APPLICATIONS DENIED 1 $83,850 12 $80,193 100 $73,159 14 $22,174 10 $67,847 APPLICATIONS WITHDRAWN 0 $0 4 $95,242 47 $74,718 3 $24,160 3 $60,297 FILES CLOSED FOR INCOMPLETENESS 0 $0 0 $0 5 $61,084 0 $0 0 $0
Aggregated Statistics For Year 2002(Based on 2 partial tracts) A) FHA, FSA/RHS & VA B) Conventional C) Refinancings D) Home Improvement Loans F) Non-occupant Loans on Number Average Value Number Average Value Number Average Value Number Average Value Number Average Value
LOANS ORIGINATED 11 $75,739 23 $75,195 63 $71,109 6 $21,808 12 $56,150 APPLICATIONS APPROVED, NOT ACCEPTED 1 $85,440 1 $98,000 22 $61,323 2 $41,820 1 $31,790 APPLICATIONS DENIED 2 $51,885 9 $67,692 100 $72,977 12 $15,192 6 $39,105 APPLICATIONS WITHDRAWN 1 $59,210 4 $45,602 34 $77,523 3 $22,260 3 $59,213 FILES CLOSED FOR INCOMPLETENESS 0 $0 1 $84,650 5 $64,030 0 $0 1 $81,860
Aggregated Statistics For Year 2001(Based on 2 partial tracts) A) FHA, FSA/RHS & VA B) Conventional C) Refinancings D) Home Improvement Loans F) Non-occupant Loans on Number Average Value Number Average Value Number Average Value Number Average Value Number Average Value
LOANS ORIGINATED 9 $109,246 20 $75,138 51 $75,322 8 $12,182 9 $83,230 APPLICATIONS APPROVED, NOT ACCEPTED 0 $0 6 $43,865 16 $49,171 2 $17,190 2 $32,765 APPLICATIONS DENIED 2 $47,885 17 $55,146 78 $51,544 18 $16,161 6 $53,820 APPLICATIONS WITHDRAWN 1 $76,700 5 $41,194 32 $67,450 5 $20,996 4 $30,998 FILES CLOSED FOR INCOMPLETENESS 0 $0 0 $0 4 $53,550 0 $0 0 $0
Aggregated Statistics For Year 2000(Based on 2 partial tracts) A) FHA, FSA/RHS & VA B) Conventional C) Refinancings D) Home Improvement Loans F) Non-occupant Loans on Number Average Value Number Average Value Number Average Value Number Average Value Number Average Value
LOANS ORIGINATED 16 $70,286 28 $59,584 30 $51,888 7 $15,613 2 $38,825 APPLICATIONS APPROVED, NOT ACCEPTED 2 $73,810 11 $53,042 15 $41,950 3 $14,547 2 $29,830 APPLICATIONS DENIED 3 $53,780 41 $53,536 53 $42,145 11 $8,977 7 $51,796 APPLICATIONS WITHDRAWN 0 $0 5 $73,072 21 $51,970 2 $54,840 2 $78,185 FILES CLOSED FOR INCOMPLETENESS 0 $0 0 $0 3 $67,003 0 $0 0 $0
Aggregated Statistics For Year 1999(Based on 2 partial tracts) A) FHA, FSA/RHS & VA B) Conventional C) Refinancings D) Home Improvement Loans F) Non-occupant Loans on Number Average Value Number Average Value Number Average Value Number Average Value Number Average Value
LOANS ORIGINATED 9 $71,418 29 $49,412 42 $48,977 6 $16,550 4 $34,248 APPLICATIONS APPROVED, NOT ACCEPTED 0 $0 18 $44,368 16 $44,728 4 $16,960 2 $31,500 APPLICATIONS DENIED 3 $78,603 74 $46,893 39 $45,751 15 $11,894 6 $26,895 APPLICATIONS WITHDRAWN 1 $36,310 5 $58,550 22 $60,761 3 $26,350 3 $32,760 FILES CLOSED FOR INCOMPLETENESS 1 $56,080 1 $57,260 8 $42,352 0 $0 0 $0
Detailed HMDA statistics for the following Tracts:
0019.00
, 0020.00
Private Mortgage Insurance Companies Aggregated Statistics For Year 2009(Based on 2 partial tracts) A) Conventional Number Average Value
LOANS ORIGINATED 0 $0 APPLICATIONS APPROVED, NOT ACCEPTED 1 $369,410 APPLICATIONS DENIED 0 $0 APPLICATIONS WITHDRAWN 0 $0 FILES CLOSED FOR INCOMPLETENESS 0 $0
Aggregated Statistics For Year 2008(Based on 2 partial tracts) A) Conventional B) Refinancings C) Non-occupant Loans on Number Average Value Number Average Value Number Average Value
LOANS ORIGINATED 5 $198,988 2 $143,385 2 $180,815 APPLICATIONS APPROVED, NOT ACCEPTED 6 $221,875 3 $227,550 1 $167,110 APPLICATIONS DENIED 2 $255,100 0 $0 2 $255,100 APPLICATIONS WITHDRAWN 0 $0 0 $0 0 $0 FILES CLOSED FOR INCOMPLETENESS 0 $0 0 $0 0 $0
Aggregated Statistics For Year 2007(Based on 2 partial tracts) A) Conventional B) Refinancings C) Non-occupant Loans on D) Loans On Manufactured Number Average Value Number Average Value Number Average Value Number Average Value
LOANS ORIGINATED 17 $224,292 6 $110,243 6 $257,555 1 $87,220 APPLICATIONS APPROVED, NOT ACCEPTED 4 $226,682 2 $77,890 2 $257,875 1 $42,860 APPLICATIONS DENIED 0 $0 2 $57,225 0 $0 0 $0 APPLICATIONS WITHDRAWN 1 $252,350 0 $0 0 $0 0 $0 FILES CLOSED FOR INCOMPLETENESS 0 $0 0 $0 0 $0 0 $0
Aggregated Statistics For Year 2006(Based on 2 partial tracts) A) Conventional B) Refinancings C) Non-occupant Loans on D) Loans On Manufactured Number Average Value Number Average Value Number Average Value Number Average Value
LOANS ORIGINATED 10 $136,164 5 $138,798 4 $121,158 3 $97,417 APPLICATIONS APPROVED, NOT ACCEPTED 2 $123,990 1 $84,250 1 $140,680 0 $0 APPLICATIONS DENIED 0 $0 0 $0 0 $0 0 $0 APPLICATIONS WITHDRAWN 1 $101,170 0 $0 0 $0 0 $0 FILES CLOSED FOR INCOMPLETENESS 0 $0 0 $0 0 $0 0 $0
Aggregated Statistics For Year 2005(Based on 2 partial tracts) A) Conventional B) Refinancings C) Non-occupant Loans on D) Loans On Manufactured Number Average Value Number Average Value Number Average Value Number Average Value
LOANS ORIGINATED 13 $113,982 2 $103,640 3 $137,237 1 $125,010 APPLICATIONS APPROVED, NOT ACCEPTED 5 $117,848 2 $112,065 2 $132,135 0 $0 APPLICATIONS DENIED 0 $0 0 $0 0 $0 0 $0 APPLICATIONS WITHDRAWN 0 $0 0 $0 0 $0 0 $0 FILES CLOSED FOR INCOMPLETENESS 0 $0 0 $0 0 $0 0 $0
Aggregated Statistics For Year 2004(Based on 2 partial tracts) A) Conventional B) Refinancings C) Non-occupant Loans on D) Loans On Manufactured Number Average Value Number Average Value Number Average Value Number Average Value
LOANS ORIGINATED 12 $113,936 4 $82,392 4 $100,145 1 $44,510 APPLICATIONS APPROVED, NOT ACCEPTED 4 $147,830 2 $84,035 1 $22,240 1 $22,240 APPLICATIONS DENIED 0 $0 0 $0 0 $0 0 $0 APPLICATIONS WITHDRAWN 1 $109,900 1 $79,070 0 $0 0 $0 FILES CLOSED FOR INCOMPLETENESS 1 $130,520 0 $0 0 $0 1 $58,590
Aggregated Statistics For Year 2003(Based on 2 partial tracts) A) Conventional B) Refinancings C) Non-occupant Loans on Number Average Value Number Average Value Number Average Value
LOANS ORIGINATED 8 $82,315 7 $85,880 3 $82,847 APPLICATIONS APPROVED, NOT ACCEPTED 0 $0 4 $94,905 0 $0 APPLICATIONS DENIED 1 $37,980 0 $0 0 $0 APPLICATIONS WITHDRAWN 0 $0 0 $0 0 $0 FILES CLOSED FOR INCOMPLETENESS 0 $0 0 $0 0 $0
Aggregated Statistics For Year 2002(Based on 2 partial tracts) A) Conventional B) Refinancings C) Non-occupant Loans on Number Average Value Number Average Value Number Average Value
LOANS ORIGINATED 7 $94,807 6 $86,862 2 $65,970 APPLICATIONS APPROVED, NOT ACCEPTED 1 $93,440 3 $108,713 0 $0 APPLICATIONS DENIED 0 $0 1 $122,600 0 $0 APPLICATIONS WITHDRAWN 1 $208,740 1 $123,150 0 $0 FILES CLOSED FOR INCOMPLETENESS 0 $0 0 $0 0 $0
Aggregated Statistics For Year 2001(Based on 2 partial tracts) A) Conventional B) Refinancings C) Non-occupant Loans on Number Average Value Number Average Value Number Average Value
LOANS ORIGINATED 4 $75,135 6 $78,590 1 $59,730 APPLICATIONS APPROVED, NOT ACCEPTED 1 $44,510 2 $76,500 0 $0 APPLICATIONS DENIED 0 $0 1 $93,040 0 $0 APPLICATIONS WITHDRAWN 0 $0 0 $0 0 $0 FILES CLOSED FOR INCOMPLETENESS 0 $0 0 $0 0 $0
Aggregated Statistics For Year 2000(Based on 2 partial tracts) A) Conventional B) Refinancings Number Average Value Number Average Value
LOANS ORIGINATED 5 $71,006 3 $52,297 APPLICATIONS APPROVED, NOT ACCEPTED 0 $0 1 $209,430 APPLICATIONS DENIED 0 $0 1 $52,850 APPLICATIONS WITHDRAWN 0 $0 0 $0 FILES CLOSED FOR INCOMPLETENESS 0 $0 0 $0
Aggregated Statistics For Year 1999(Based on 2 partial tracts) A) Conventional B) Refinancings Number Average Value Number Average Value
LOANS ORIGINATED 2 $67,530 2 $86,965 APPLICATIONS APPROVED, NOT ACCEPTED 0 $0 0 $0 APPLICATIONS DENIED 0 $0 0 $0 APPLICATIONS WITHDRAWN 0 $0 0 $0 FILES CLOSED FOR INCOMPLETENESS 0 $0 0 $0
Detailed PMIC statistics for the following Tracts:
0019.00
, 0020.00 Fire-safe hotels and motels in Eloy, Arizona:
Americas Best Value Inn, 3945 W Houser Rd, Eloy, Arizona 85231 Phone: (520) 466-7804, Fax: (520) 466-3431
Travelodge Eloy/Casa Grande, 7190 S Sunland Gin Rd, Eloy, Arizona 85231 Phone: (520) 836-5000, Fax: (520) 836-3549
Red Roof Inn, 4015 W Outer Dr, Eloy, Arizona 85131 Phone: (520) 466-2522, Fax: (520) 466-2622
Days Inn, 5300 S Sunland Gin Rd, Eloy, Arizona 85131 Phone: (520) 426-9240
All 4 fire-safe hotels and motels in Eloy, Arizona
Most common first names in Eloy, AZ among deceased individuals Name Count Lived (average)
Jose 30 70.7 years John 28 73.9 years Maria 28 75.6 years William 27 75.8 years Mary 26 75.0 years James 25 68.1 years Robert 19 67.6 years Manuel 16 65.6 years Juan 15 67.3 years George 15 74.0 years
Most common last names in Eloy, AZ among deceased individuals Last name Count Lived (average)
Rodriguez 25 70.0 years Martinez 18 69.3 years Jones 18 68.1 years Williams 17 74.6 years Garcia 16 72.6 years Lopez 15 62.8 years Salazar 14 72.8 years Montijo 14 68.1 years Ramirez 14 76.1 years Hernandez 12 75.3 years
Eloy compared to Arizona state average:
Median house value below state average. Black race population percentage significantly above state average. Hispanic race population percentage above state average. Foreign-born population percentage above state average. Length of stay since moving in significantly above state average. Institutionalized population percentage significantly above state average. Percentage of population with a bachelor's degree or higher significantly below state average.
#16 on the list of "Top 101 cities with the largest percentage of people in other types of correctional institutions (population 1,000+)"
#26 on the list of "Top 101 cities with the most people below 50% of the poverty level, excluding cities with 15% or more of residents in college and with the median age below 28 (population 5,000+)"
#30 on the list of "Top 100 cities with the largest percentage of males (pop. 5,000+)"
#39 on the list of "Top 101 cities with the most people below the poverty level, excluding cities with 15% or more of residents in college and with the median age below 28 (population 5,000+)"
#39 on the list of "Top 101 cities with the largest percentage of people in federal prisons and detention centers (population 1,000+)"
#46 on the list of "Top 101 cities with largest percentage of females in occupations: law enforcement workers including supervisors (population 5,000+)"
#63 on the list of "Top 101 cities with the highest number of murders per 100,000 residents, excludes tourist destinations and others with a lot of outsiders visiting based on city industries data (population 5,000+)"
#70 on the list of "Top 101 cities with largest percentage of females in occupations: fire fighting and prevention workers including supervisors (population 5,000+)"
#85 on the list of "Top 101 cities with the largest positive percentage difference between never married males and females (15+ years) (with at least 1,000 males never married)"
#2 on the list of "Top 101 counties with the largest decrease in the number of deaths per 1000 residents 2000-2006 to 2007-2013 (pop. 50,000+)"
#3 on the list of "Top 101 counties with the highest Particulate Matter (PM10 ) Annual air pollution readings in 2012 (µg/m3 )"
#15 on the list of "Top 101 counties with the lowest percentage of residents that visited a dentist within the past year"
#28 on the list of "Top 101 counties with the highest percentage of residents relocating to other counties in 2011 (pop. 50,000+)"
#31 on the list of "Top 101 counties with the highest Ozone (1-hour) air pollution readings in 2012 (ppm)"
Top Patent Applicants
Bob Ferguson (2)
Penny Lindberg (1)
Teresa Cronin (1)
Nicholas Heintz (1)
Total of 4 patent applications in 2008-2024.
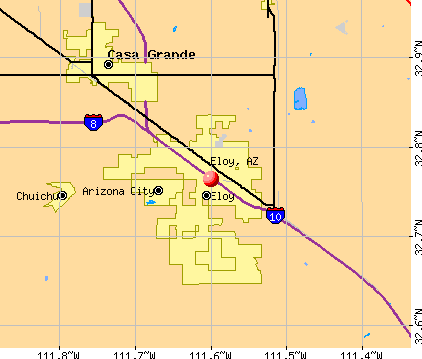


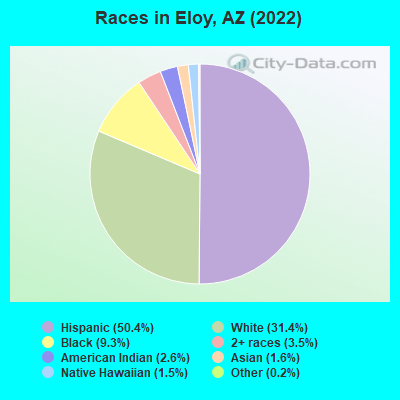
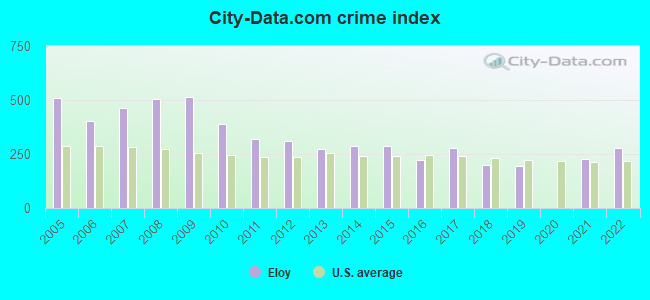
 Recent articles from our blog. Our writers, many of them Ph.D. graduates or candidates, create easy-to-read articles on a wide variety of topics.

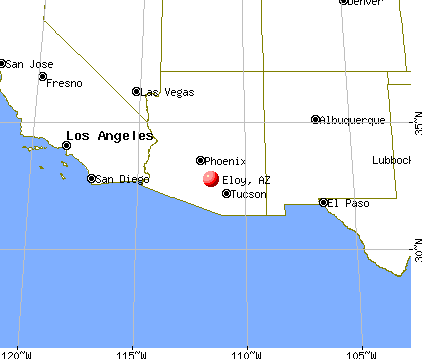
 , pop. 81,321).
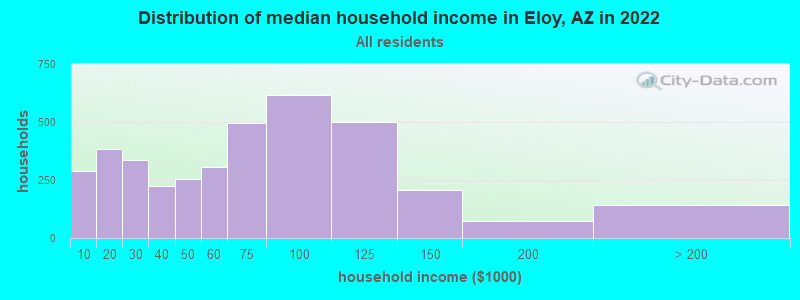
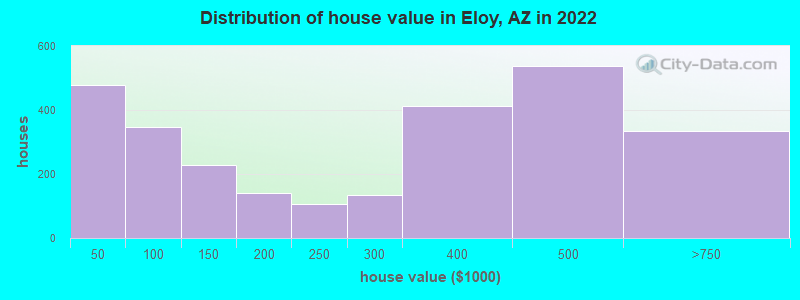

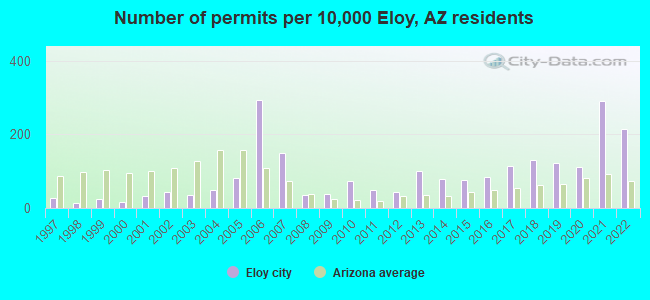
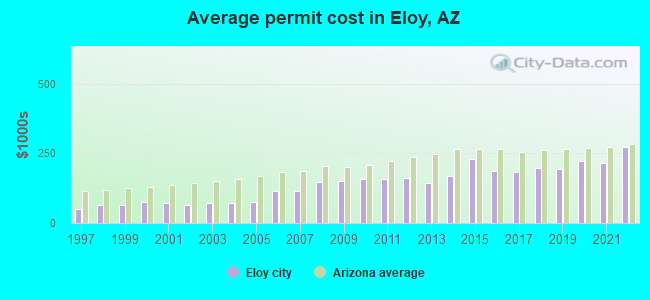
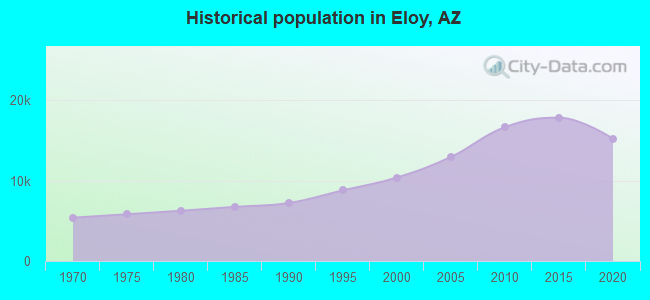

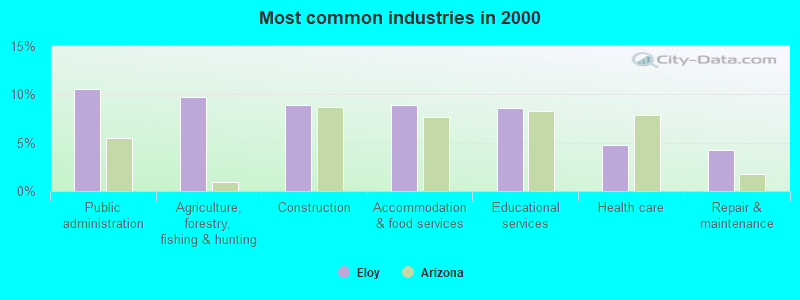
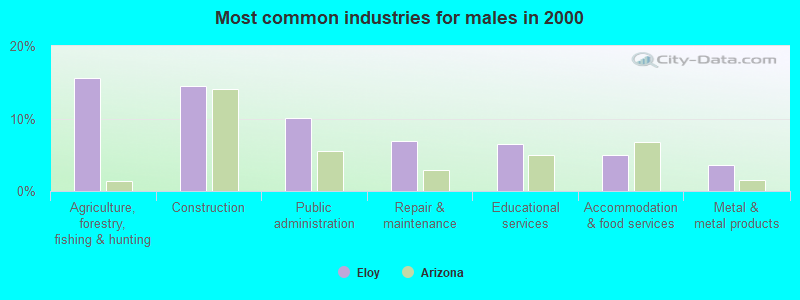
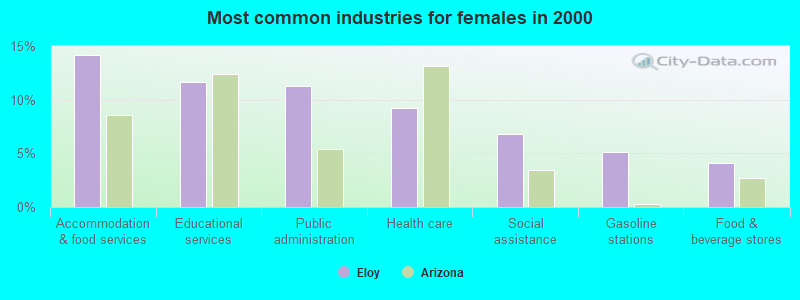
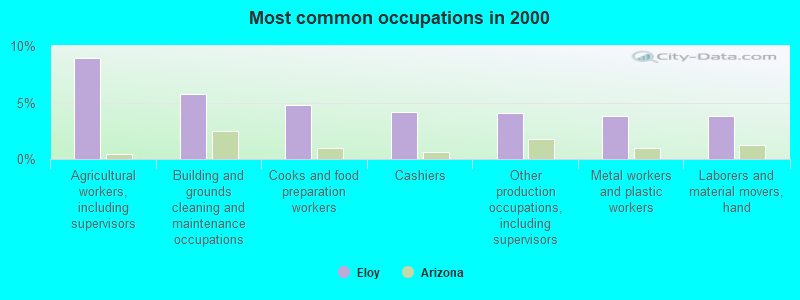
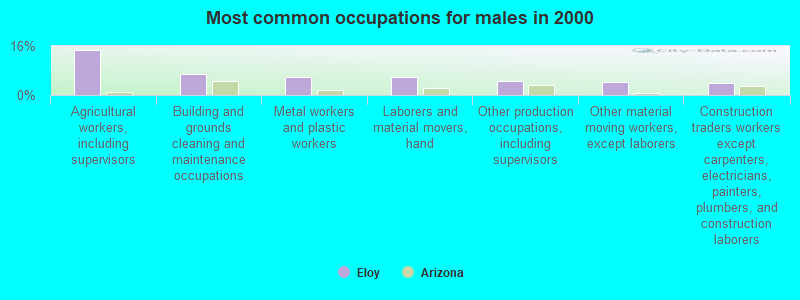
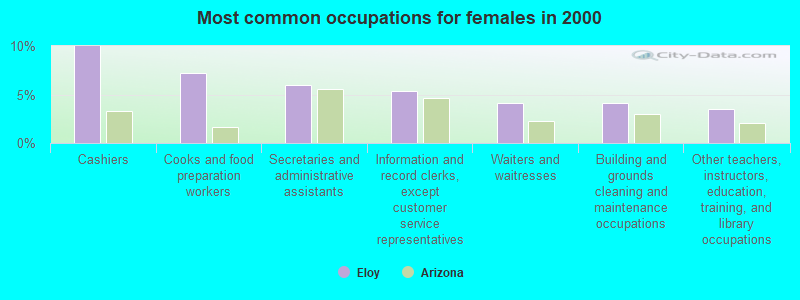
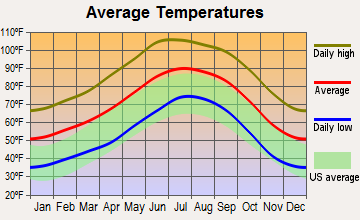
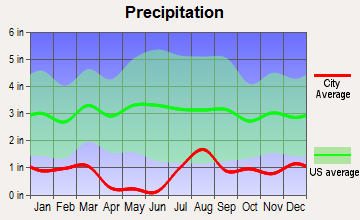
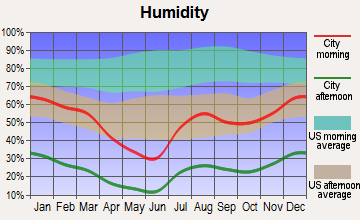
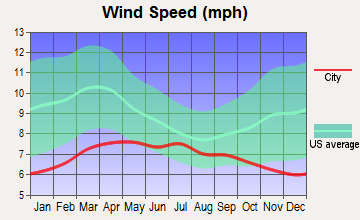
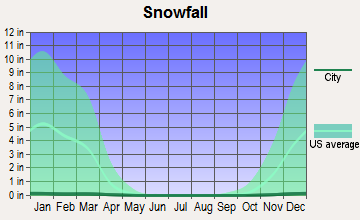
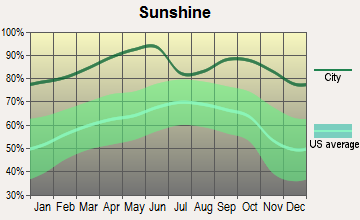
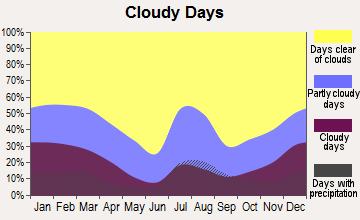
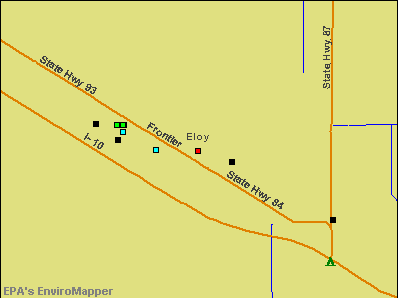

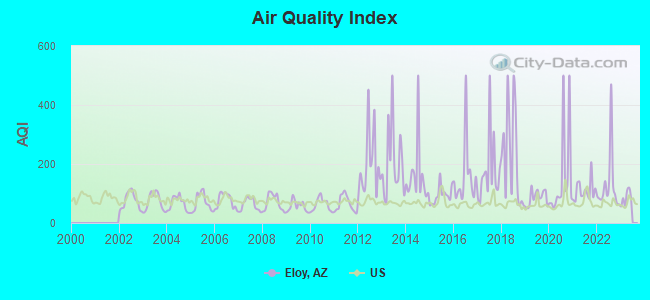
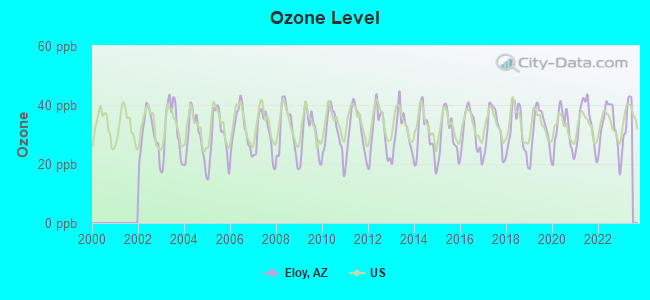
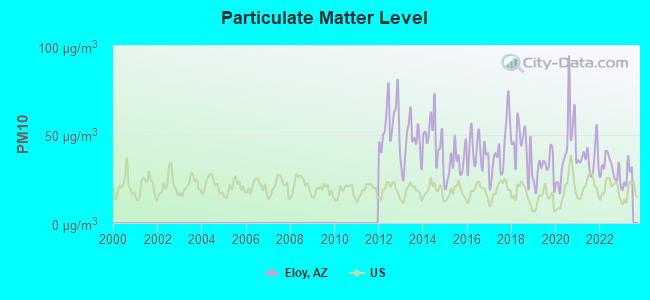
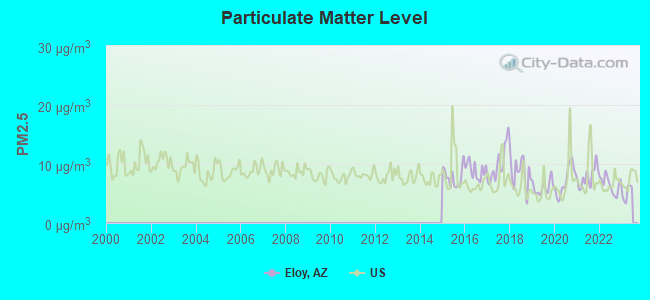

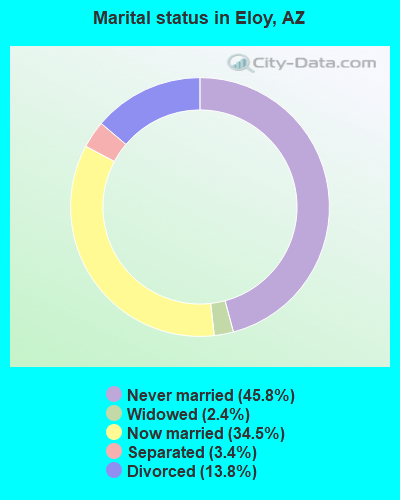
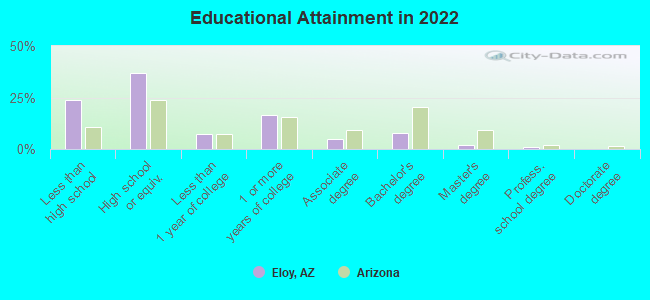
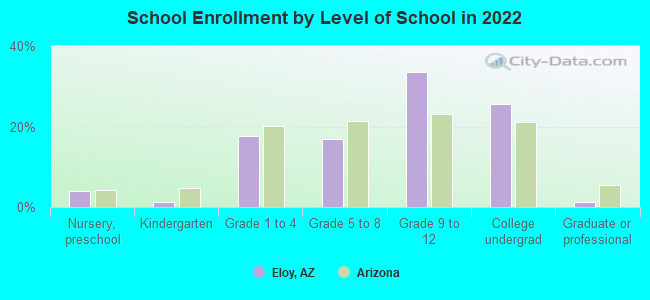
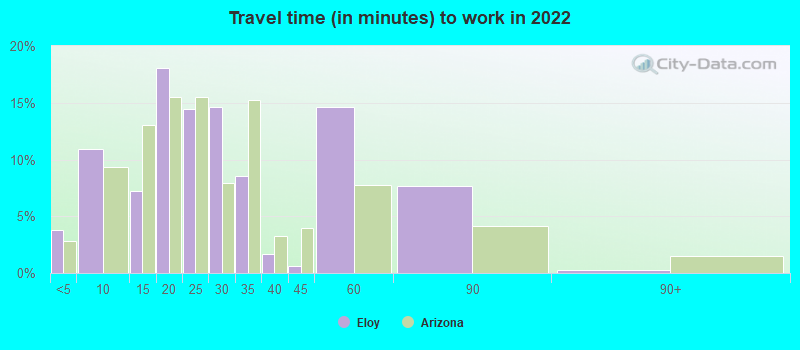
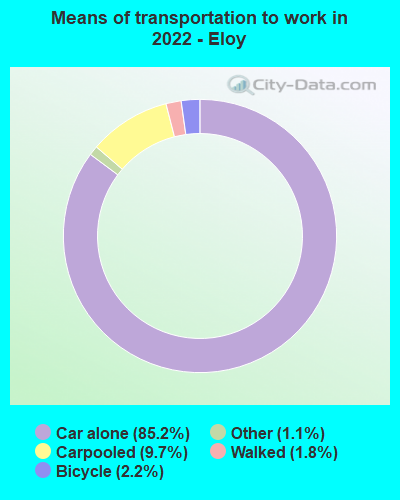
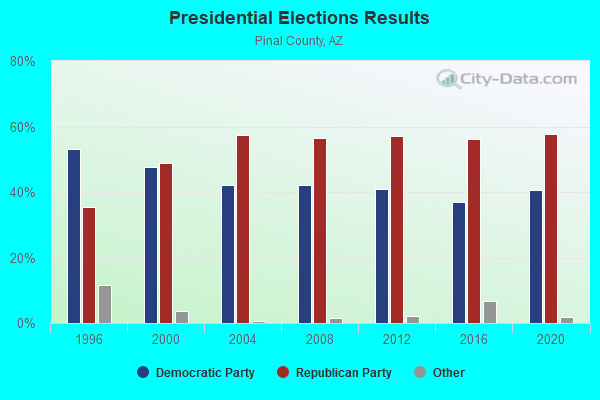
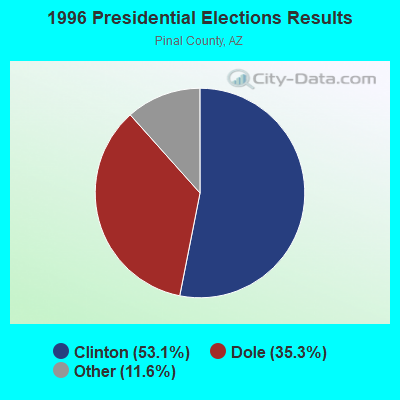
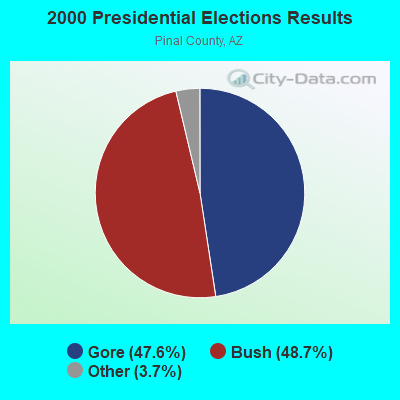
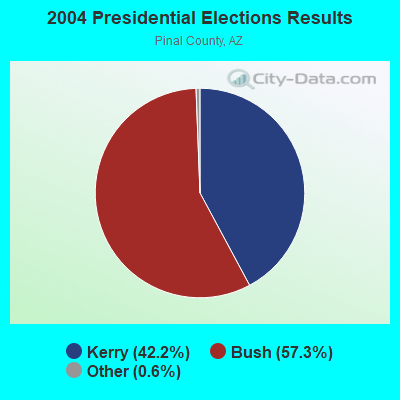
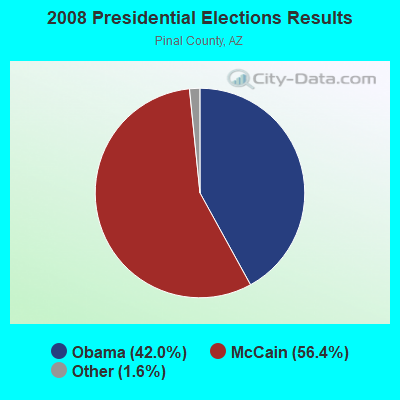
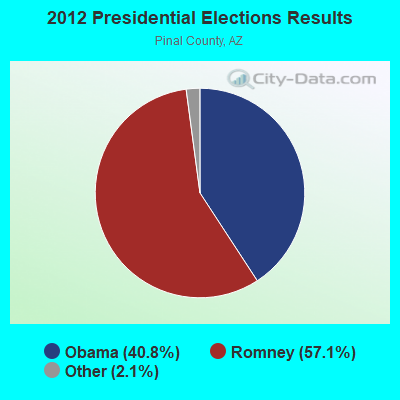
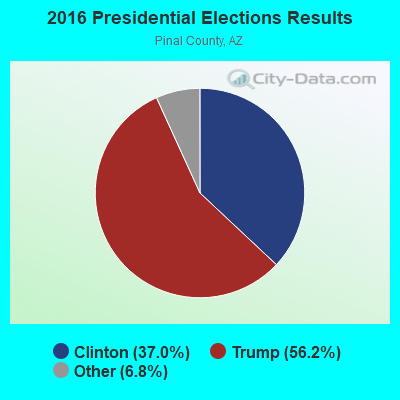
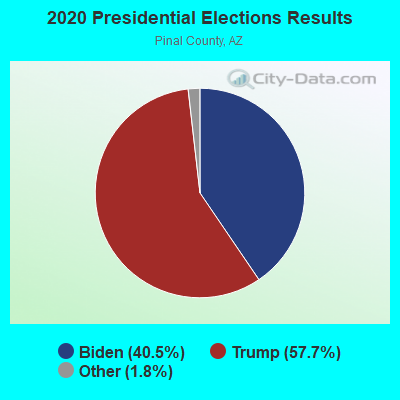
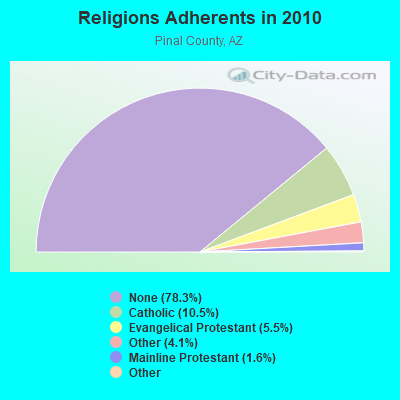
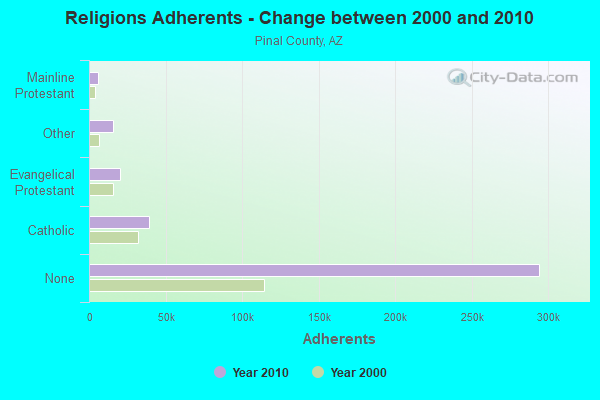
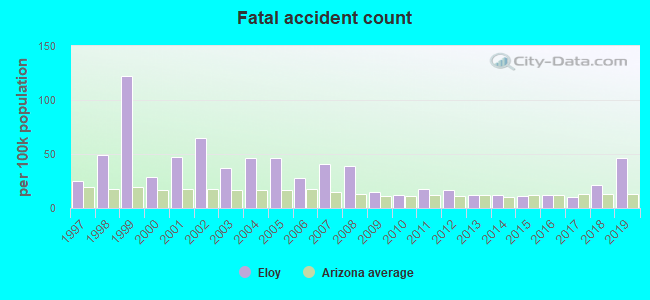
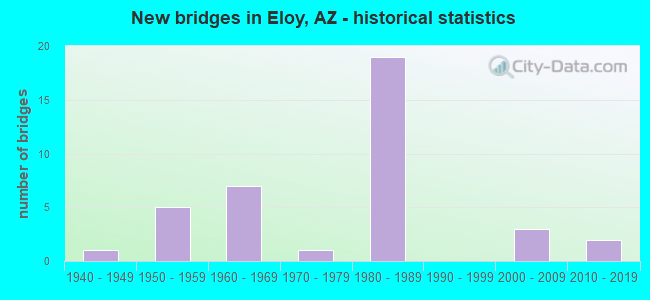
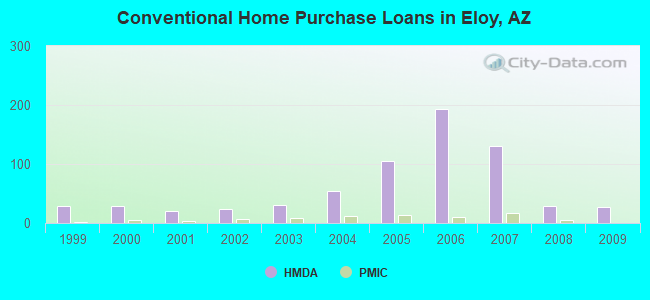
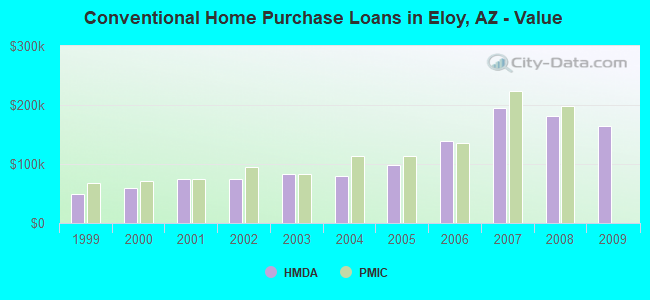
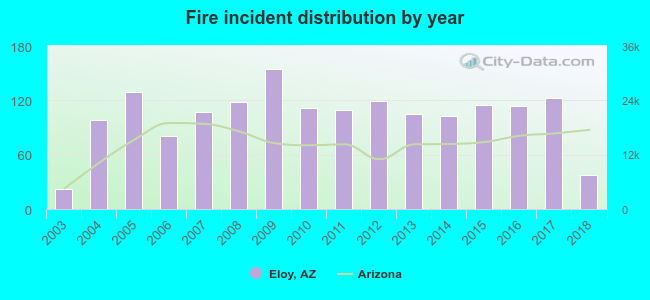 Based on the data from the years 2003 - 2018 the average number of fire incidents per year is 103. The highest number of fire incidents - 155 took place in 2009, and the least - 22 in 2003. The data has a rising trend.
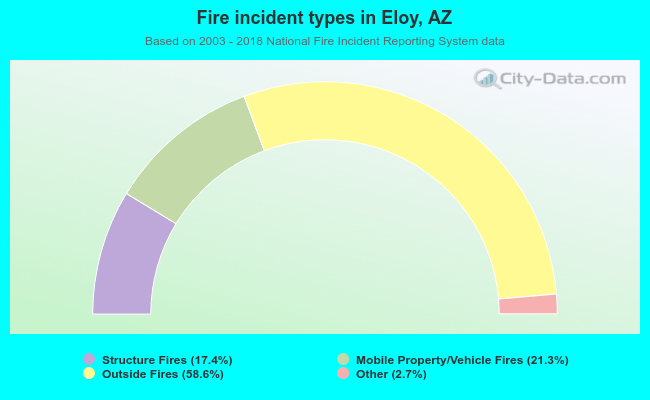 When looking into fire subcategories, the most reports belonged to: Outside Fires (58.6%), and Mobile Property/Vehicle Fires (21.3%).