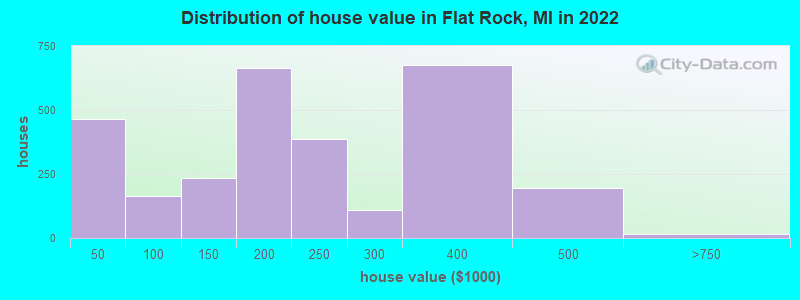
Estimated median house or condo value in 2022: $195,051 (it was $106,500 in 2000)
Flat Rock:
$195,051
MI:
$224,400
Mean prices in 2022:all housing units: $218,544; detached houses: $224,524; townhouses or other attached units: $219,041; in 2-unit structures: $149,371; in 3-to-4-unit structures: $201,136; in 5-or-more-unit structures: $186,505; mobile homes: $50,472; occupied boats, rvs, vans, etc.: $95,764
Median gross rent in 2022: $880.
March 2022 cost of living index in Flat Rock: 94.8 (less than average, U.S. average is 100)
Percentage of residents living in poverty in 2022: 16.3%
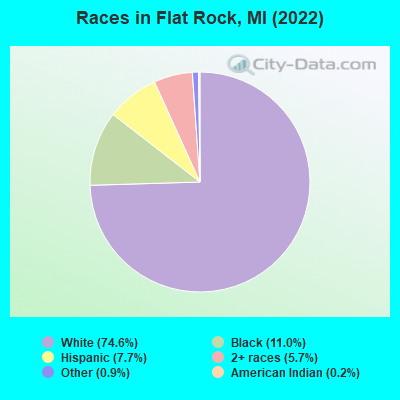
(14.8% for White Non-Hispanic residents, 16.5% for Black residents, 27.4% for Hispanic or Latino residents, 35.3% for two or more races residents)
According to our research of Michigan and other state lists, there were 17 registered sex offenders living in Flat Rock, Michigan as of April 27, 2024. The ratio of all residents to sex offenders in Flat Rock is 573 to 1. The ratio of registered sex offenders to all residents in this city is lower than the state average.
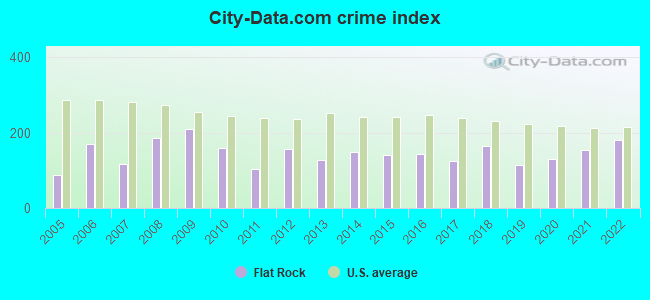
Crime rates in Flat Rock by year
Type
2009
2010
2011
2012
2013
2014
2015
2016
2017
2018
2019
2020
2021
2022
Murders (per 100,000)
1 (11.4)
0 (0.0)
0 (0.0)
0 (0.0)
0 (0.0)
0 (0.0)
0 (0.0)
0 (0.0)
0 (0.0)
2 (20.1)
0 (0.0)
0 (0.0)
1 (10.0)
0 (0.0)
Rapes (per 100,000)
1 (11.4)
8 (81.0)
1 (10.1)
2 (20.4)
3 (30.7)
3 (30.6)
4 (40.6)
5 (50.4)
0 (0.0)
1 (10.0)
1 (10.0)
3 (29.9)
4 (40.1)
6 (57.9)
Robberies (per 100,000)
4 (45.5)
2 (20.2)
1 (10.1)
4 (40.9)
3 (30.7)
3 (30.6)
5 (50.8)
4 (40.3)
6 (61.1)
3 (30.1)
4 (39.9)
4 (39.9)
2 (20.1)
1 (9.6)
Assaults (per 100,000)
18 (204.6)
4 (40.5)
14 (141.8)
14 (143.1)
11 (112.6)
16 (162.9)
13 (132.0)
11 (110.9)
17 (173.1)
20 (200.7)
12 (119.7)
20 (199.6)
20 (200.6)
34 (327.9)
Burglaries (per 100,000)
37 (420.6)
34 (344.2)
19 (192.5)
41 (419.0)
24 (245.6)
23 (234.2)
12 (121.8)
16 (161.3)
9 (91.6)
14 (140.5)
4 (39.9)
8 (79.8)
9 (90.3)
9 (86.8)
Thefts (per 100,000)
152 (1,728)
117 (1,184)
97 (982.7)
148 (1,513)
100 (1,023)
121 (1,232)
100 (1,015)
108 (1,089)
128 (1,303)
119 (1,194)
117 (1,167)
77 (768.5)
81 (812.6)
95 (916.2)
Auto thefts (per 100,000)
27 (306.9)
12 (121.5)
14 (141.8)
13 (132.9)
17 (174.0)
21 (213.9)
21 (213.2)
18 (181.5)
15 (152.7)
11 (110.4)
25 (249.4)
22 (219.6)
20 (200.6)
32 (308.6)
Arson (per 100,000)
0 (0.0)
0 (0.0)
1 (10.1)
0 (0.0)
1 (10.2)
0 (0.0)
0 (0.0)
0 (0.0)
0 (0.0)
1 (10.0)
1 (10.0)
2 (20.0)
0 (0.0)
3 (28.9)
City-Data.com crime index
209.5
160.2
103.6
157.7
128.3
149.0
140.3
144.0
123.7
163.7
113.3
129.8
153.2
182.2
The City-Data.com crime index weighs serious crimes and violent crimes more heavily. Higher means more crime, U.S. average is 246.1. It adjusts for the number of visitors and daily workers commuting into cities.
Latest news from Flat Rock, MI collected exclusively by city-data.com from local newspapers, TV, and radio stations
Ancestries: American (25.9%), German (10.0%), Polish (8.1%), Italian (6.0%), English (4.4%), Irish (2.3%).
Current Local Time: EST time zone
Land area: 6.70 square miles.
Population density: 1,556 people per square mile (low).
234 residents are foreign born (1.1% Europe, 0.8% Latin America, 0.3% North America).
This city:
2.3%
Michigan:
6.9%
Median real estate property taxes paid for housing units with mortgages in 2022: $5,073 (2.5%) Median real estate property taxes paid for housing units with no mortgage in 2022: $3,887 (2.0%)
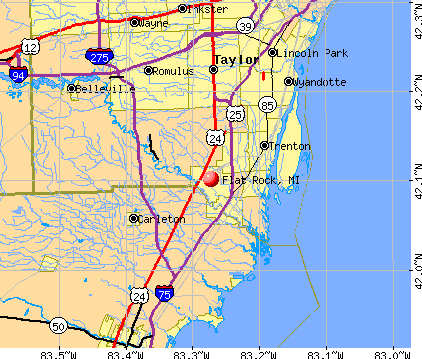
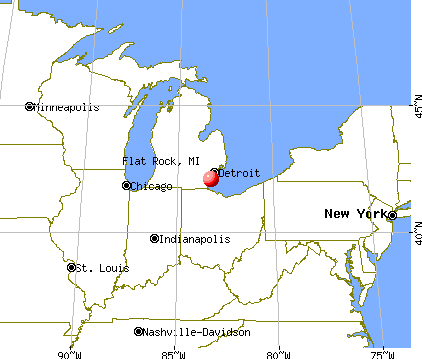
Nearest city with pop. 50,000+: Taylor, MI (9.0 miles , pop. 65,868).
Nearest city with pop. 200,000+: Detroit, MI (21.6 miles , pop. 951,270).
Nearest city with pop. 1,000,000+: Chicago, IL (227.3 miles , pop. 2,896,016).
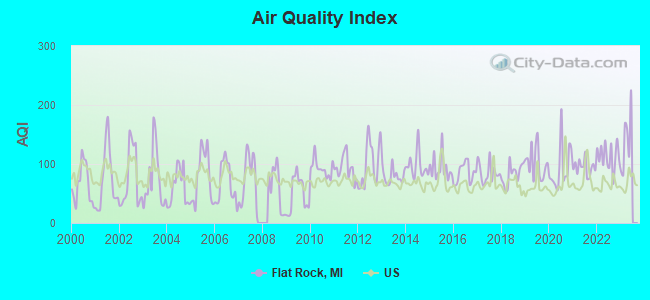
Air Quality Index (AQI) level in 2022 was 112. This is significantly worse than average.
City:
112
U.S.:
73
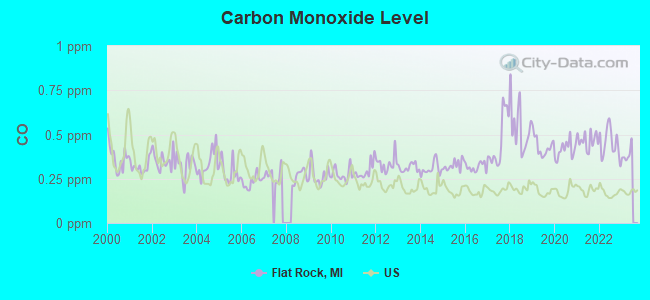
Carbon Monoxide (CO) [ppm] level in 2022 was 0.451. This is significantly worse than average.Closest monitor was 9.4 miles away from the city center.
City:
0.451
U.S.:
0.251
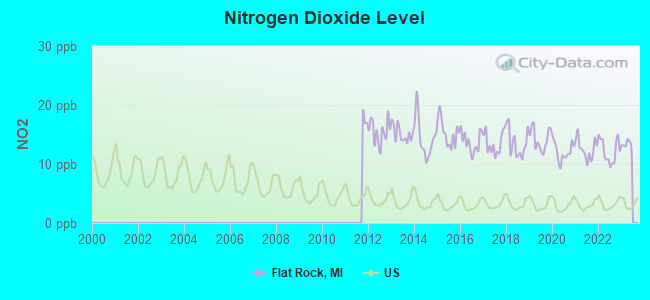
Nitrogen Dioxide (NO2) [ppb] level in 2022 was 12.2. This is significantly worse than average.Closest monitor was 9.4 miles away from the city center.
City:
12.2
U.S.:
5.1
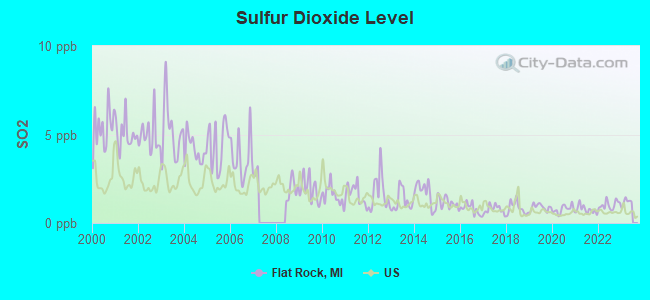
Sulfur Dioxide (SO2) [ppb] level in 2022 was 1.02. This is significantly better than average.Closest monitor was 2.9 miles away from the city center.
City:
1.02
U.S.:
1.51
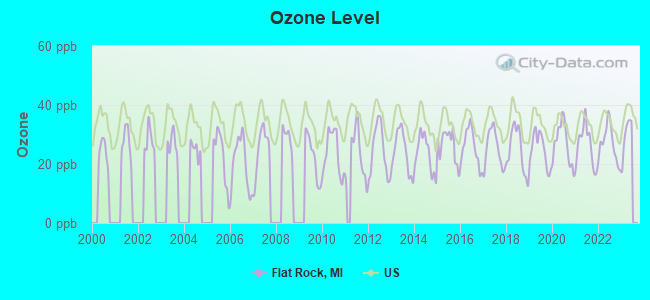
Ozone [ppb] level in 2022 was 26.9. This is better than average.Closest monitor was 5.2 miles away from the city center.
City:
26.9
U.S.:
33.3
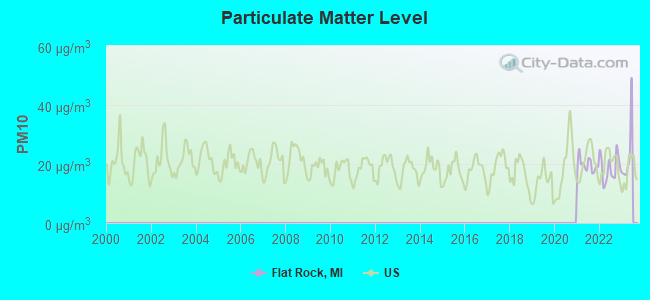
Particulate Matter (PM10) [µg/m3] level in 2022 was 18.6. This is about average.Closest monitor was 2.9 miles away from the city center.
City:
18.6
U.S.:
19.2
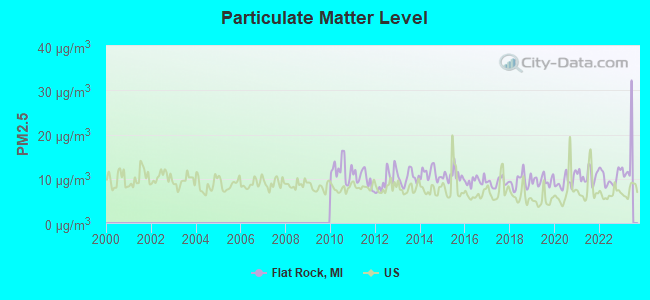
Particulate Matter (PM2.5) [µg/m3] level in 2022 was 10.2. This is worse than average.Closest monitor was 8.5 miles away from the city center.
City:
10.2
U.S.:
8.1
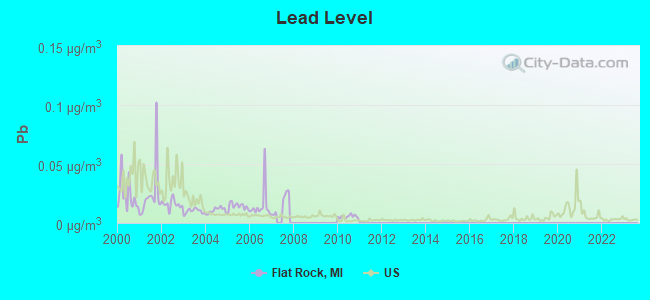
Lead (Pb) [µg/m3] level in 2010 was 0.00543. This is significantly better than average.Closest monitor was 5.5 miles away from the city center.
City:
0.00543
U.S.:
0.00931
Tornado activity:
Flat Rock-area historical tornado activity is slightly above Michigan state average. It is 40% greater than the overall U.S. average.
On 4/11/1965, a category F4 (max. wind speeds 207-260 mph) tornado 10.2 miles away from the Flat Rock city center killed 23 peopleand injured 294 peopleand causedbetween $50,000,000 and $500,000,000 in damages.
On 4/11/1965, a category F4 tornado 10.2 miles away from the city center killed 21 peopleand injured 293 people.
Earthquake activity:
Flat Rock-area historical earthquake activity is significantly above Michigan state average. It is 42% smaller than the overall U.S. average.
On 9/25/1998 at 19:52:52, a magnitude 5.2 (4.8 MB, 4.3 MS, 5.2 LG, 4.5 MW, Depth: 3.1 mi, Class: Moderate, Intensity: VI - VII) earthquake occurred 154.2 miles away from the city center On 1/31/1986 at 16:46:43, a magnitude 5.0 (5.0 MB) earthquake occurred 114.2 miles away from the city center On 7/12/1986 at 08:19:37, a magnitude 4.5 (4.5 MB, Class: Light, Intensity: IV - V) earthquake occurred 122.3 miles away from Flat Rock center On 7/27/1980 at 18:52:21, a magnitude 5.2 (5.1 MB, 4.7 MS, 5.0 UK, 5.2 UK) earthquake occurred 271.8 miles away from Flat Rock center On 8/23/2011 at 17:51:04, a magnitude 5.8 (5.8 MW, Depth: 3.7 mi) earthquake occurred 404.8 miles away from the city center On 5/2/2015 at 16:23:07, a magnitude 4.2 (4.2 MW, Depth: 2.8 mi) earthquake occurred 110.9 miles away from Flat Rock center Magnitude types: regional Lg-wave magnitude (LG), body-wave magnitude (MB), surface-wave magnitude (MS), moment magnitude (MW)
Natural disasters:
The number of natural disasters in Wayne County (14) is near the US average (15). Major Disasters (Presidential) Declared: 9 Emergencies Declared: 4
Causes of natural disasters: Storms: 9, Floods: 7, Tornadoes: 3, Blizzard: 1, Hurricane: 1, Power Outage: 1, Snowstorm: 1, Winter Storm: 1, Other: 1 (Note: some incidents may be assigned to more than one category).
Hospitals and medical centers in Flat Rock:
HUMAN TOUCH HOME HEALTH CARE, P L L C (14916 TELEGRAPH STE 3)
LIVEWELL HOME HEALTH CARE, L L C (26263 GIBRALTER RD SUITE 600 / 700)
Other hospitals and medical centers near Flat Rock:
COMPREHENSIVE HOME CARE (Home Health Center, about 3 miles away; WOODHAVEN, MI)
BIG APPLE HOME HEALTH CARE, INC (Home Health Center, about 3 miles away; WOODHAVEN, MI)
ABERDEEN REHABILITATION AND SKILLED NURSING CENTER (Nursing Home, about 4 miles away; TRENTON, MI)
BALMORAL SKILLED NURSING CTR (Nursing Home, about 4 miles away; TRENTON, MI)
OAKWOOD SOUTHSHORE MEDICAL CENTER Acute Care Hospitals (about 4 miles away; TRENTON, MI)
APPLEWOOD NURSING CENTER INC (Nursing Home, about 4 miles away; WOODHAVEN, MI)
IDEAL HOME HEALTH, L L C (Home Health Center, about 4 miles away; BROWNSTOWN, MI)
Amtrak stations near Flat Rock:
15 miles: GREENFIELD VILLAGE (DEARBORN, 20900 OAKWOOD BLVD.)
16 miles: DEARBORN (16121 MICHIGAN AVE.) . Services: ticket office, partially wheelchair accessible, enclosed waiting area, public restrooms, public payphones, vending machines, free short-term parking, free long-term parking, call for car rental service, taxi stand.
Notable locations in Flat Rock: Flat Rock Yard (A), Flat Rock Station (B), Flat Rock Courthouse (C), Flat Rock Library (D), Flat Rock Fire Department (E). Display/hide their locations on the map
Parks in Flat Rock include: Cornelius G Munger General Store Historical Marker (1), The Ford Lamp Factory Complex Historical Marker (2). Display/hide their locations on the map
Birthplace of: Dann Florek - Television actor, Fred Gladding - Baseball player.
Wayne County has a predicted average indoor radon screening level less than 2 pCi/L (pico curies per liter) - Low Potential
Drinking water stations with addresses in Flat Rock that have no violations reported:
FLAT ROCK (Population served: 9,878,Primary Water Source Type: Purch surface water)
Average household size:
This city:
2.6 people
Michigan:
2.5 people
Percentage of family households:
This city:
71.5%
Whole state:
66.0%
Percentage of households with unmarried partners:
This city:
6.7%
Whole state:
6.4%
Likely homosexual households (counted as self-reported same-sex unmarried-partner households)
Lesbian couples: 0.5% of all households
Gay men: 0.2% of all households
37 people in other noninstitutional facilities in 2010
21 people in group homes intended for adults in 2010
People in group quarters in Flat Rock in 2000:
11 people in other workers' dormitories
10 people in local jails and other confinement facilities (including police lockups)
6 people in homes for the mentally retarded
5 people in other group homes
2 people in unknown juvenile institutions
2 people in other noninstitutional group quarters
Banks with branches in Flat Rock (2011 data):
Bank of America, National Association: Flat Rock Branch at 27511 Telegraph Road, branch established on 1923/01/01. Info updated 2009/11/18: Bank assets: $1,451,969.3 mil, Deposits: $1,077,176.8 mil, headquarters in Charlotte, NC, positive income, 5782 total offices, Holding Company: Bank Of America Corporation
Fifth Third Bank: Flat Rock Branch at 28725 Telegraph Rd., branch established on 1960/10/17. Info updated 2009/10/05: Bank assets: $114,540.4 mil, Deposits: $89,689.1 mil, headquarters in Cincinnati, OH, positive income, Commercial Lending Specialization, 1378 total offices, Holding Company: Fifth Third Bancorp
Monroe Bank & Trust: Flat Rock Branch at 28417 N. Telegraph Road, branch established on 1999/02/23. Info updated 2008/10/10: Bank assets: $1,237.6 mil, Deposits: $1,022.4 mil, headquarters in Monroe, MI, negative income in the last year, Commercial Lending Specialization, 25 total offices, Holding Company: Mbt Financial Corp.
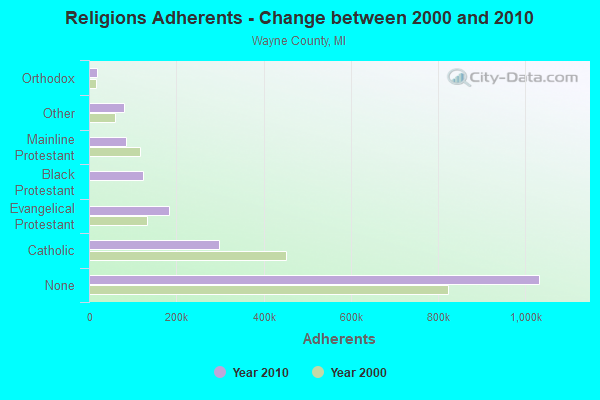
Religion statistics for Flat Rock, MI (based on Wayne County data)
Religion
Adherents
Congregations
Catholic
297,283
151
Evangelical Protestant
183,985
527
Black Protestant
124,432
282
Mainline Protestant
85,387
231
Other
79,840
116
Orthodox
17,580
23
None
1,032,077
-
Source: Clifford Grammich, Kirk Hadaway, Richard Houseal, Dale E.Jones, Alexei Krindatch, Richie Stanley and Richard H.Taylor. 2012. 2010 U.S.Religion Census: Religious Congregations & Membership Study. Association of Statisticians of American Religious Bodies. Jones, Dale E., et al. 2002. Congregations and Membership in the United States 2000. Nashville, TN: Glenmary Research Center. Graphs represent county-level data
Aircraft: ROBINSON HELICOPTER R44 (Category: Land, Seats: 4, Weight: Up to 12,499 Pounds), Engine: LYCOMING 0-540 SERIES (250 HP) (Reciprocating) N-Number: 244GH, N244GH, N-244GH, Serial Number: 0833, Airworthiness Date: 08/02/2000, Certificate Issue Date: 01/06/2016 Registrant (Individual): Robert Duke, 25962 West Rd, Flat Rock, MI 48134
Aircraft: PIPER PA-22-135 (Category: Land, Seats: 4, Weight: Up to 12,499 Pounds, Speed: 94 mph), Engine: LYCOMING 0-290 SERIES (140 HP) (Reciprocating) N-Number: 3664A, N3664A, N-3664A, Serial Number: 22-1924, Year manufactured: 1954, Airworthiness Date: 03/03/1958, Certificate Issue Date: 07/13/2015 Registrant (Individual): William J Rice, 24767 Summer Ln, Flat Rock, MI 48134
Aircraft: MITCHELL JACK C HIPERBIPE (Category: Land, Seats: 2, Weight: Up to 12,499 Pounds), Engine: Reciprocating N-Number: 62TT, N62TT, N-62TT, Serial Number: 243, Year manufactured: 1991, Airworthiness Date: 05/23/1991, Certificate Issue Date: 07/23/2016 Registrant (Individual): David M Dixon, 27231 W Mockingbird Dr, Flat Rock, MI 48134
Aircraft: ROBINSON HELICOPTER R22 BETA (Category: Land, Seats: 2, Weight: Up to 12,499 Pounds), Engine: LYCOMING O-320-B2C (160 HP) (Reciprocating) N-Number: 114AZ, N114AZ, N-114AZ, Serial Number: 1609, Year manufactured: 1990, Airworthiness Date: 04/28/2011, Certificate Issue Date: 03/21/2011 Registrant (Corporation): Duke & Duke Aviation LLC, 25962 West Rd, Flat Rock, MI 48134 Deregistered:Cancel Date: 12/13/2016
Aircraft: PIPER PA-12 (Category: Land, Seats: 3, Weight: Up to 12,499 Pounds, Speed: 82 mph), Engine: LYCOMING 0-235 SERIES (115 HP) (Reciprocating) N-Number: 4050M, N4050M, N-4050M, Serial Number: 12-2931, Year manufactured: 1947 Registrant (Corporation): Brazer Power Line Patrol Inc, 29158 Magnolia Dr, Flat Rock, MI 48134 Deregistered:Cancel Date: 10/28/2017
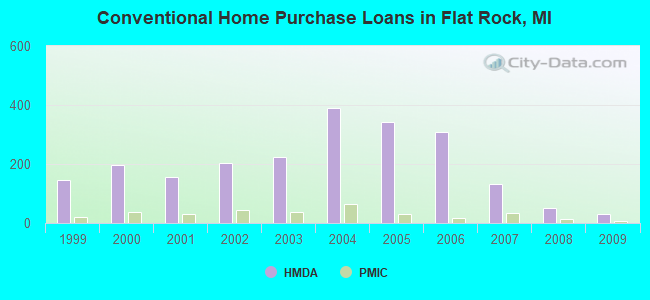
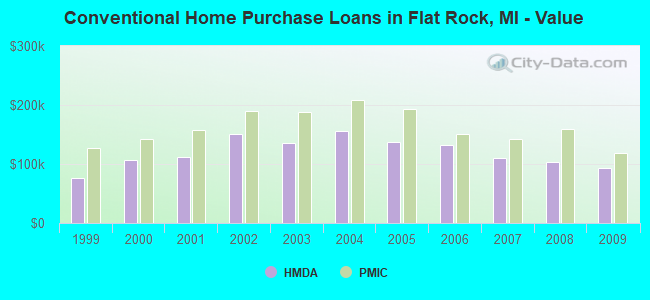
Home Mortgage Disclosure Act Aggregated Statistics For Year 2009 (Based on 2 full tracts)
A) FHA, FSA/RHS & VA Home Purchase Loans
B) Conventional Home Purchase Loans
C) Refinancings
D) Home Improvement Loans
F) Non-occupant Loans on < 5 Family Dwellings (A B C & D)
G) Loans On Manufactured Home Dwelling (A B C & D)
Number
Average Value
Number
Average Value
Number
Average Value
Number
Average Value
Number
Average Value
Number
Average Value
LOANS ORIGINATED
77
$136,325
29
$93,897
79
$131,278
9
$31,222
6
$45,667
7
$27,000
APPLICATIONS APPROVED, NOT ACCEPTED
4
$133,500
3
$57,667
10
$116,400
3
$6,333
1
$67,000
2
$32,500
APPLICATIONS DENIED
13
$164,231
16
$57,250
62
$135,645
11
$14,455
7
$61,143
10
$22,800
APPLICATIONS WITHDRAWN
9
$145,111
2
$91,500
17
$175,059
1
$5,000
1
$35,000
1
$29,000
FILES CLOSED FOR INCOMPLETENESS
2
$192,500
1
$148,000
10
$114,300
0
$0
0
$0
3
$40,000
Aggregated Statistics For Year 2008 (Based on 2 full tracts)
A) FHA, FSA/RHS & VA Home Purchase Loans
B) Conventional Home Purchase Loans
C) Refinancings
D) Home Improvement Loans
F) Non-occupant Loans on < 5 Family Dwellings (A B C & D)
G) Loans On Manufactured Home Dwelling (A B C & D)
Number
Average Value
Number
Average Value
Number
Average Value
Number
Average Value
Number
Average Value
Number
Average Value
LOANS ORIGINATED
42
$141,310
52
$102,885
61
$139,082
10
$20,200
14
$78,429
8
$28,250
APPLICATIONS APPROVED, NOT ACCEPTED
5
$145,200
13
$105,692
9
$137,556
0
$0
0
$0
7
$53,429
APPLICATIONS DENIED
11
$109,727
19
$68,316
63
$171,841
18
$33,444
7
$106,714
11
$29,273
APPLICATIONS WITHDRAWN
8
$123,875
6
$168,500
27
$174,926
2
$41,000
0
$0
0
$0
FILES CLOSED FOR INCOMPLETENESS
1
$270,000
2
$150,000
13
$124,769
0
$0
0
$0
2
$38,500
Aggregated Statistics For Year 2007 (Based on 2 full tracts)
A) FHA, FSA/RHS & VA Home Purchase Loans
B) Conventional Home Purchase Loans
C) Refinancings
D) Home Improvement Loans
E) Loans on Dwellings For 5+ Families
F) Non-occupant Loans on < 5 Family Dwellings (A B C & D)
G) Loans On Manufactured Home Dwelling (A B C & D)
Number
Average Value
Number
Average Value
Number
Average Value
Number
Average Value
Number
Average Value
Number
Average Value
Number
Average Value
LOANS ORIGINATED
9
$131,444
131
$110,977
122
$137,369
26
$36,192
3
$1,456,667
19
$131,632
10
$34,300
APPLICATIONS APPROVED, NOT ACCEPTED
1
$203,000
19
$80,368
58
$119,362
5
$68,000
0
$0
1
$116,000
12
$32,750
APPLICATIONS DENIED
0
$0
52
$112,558
153
$143,641
42
$33,095
0
$0
12
$107,250
31
$28,387
APPLICATIONS WITHDRAWN
1
$126,000
9
$136,667
44
$167,364
6
$17,000
0
$0
0
$0
2
$5,000
FILES CLOSED FOR INCOMPLETENESS
0
$0
11
$155,182
25
$187,200
1
$239,000
0
$0
0
$0
0
$0
Aggregated Statistics For Year 2006 (Based on 2 full tracts)
A) FHA, FSA/RHS & VA Home Purchase Loans
B) Conventional Home Purchase Loans
C) Refinancings
D) Home Improvement Loans
E) Loans on Dwellings For 5+ Families
F) Non-occupant Loans on < 5 Family Dwellings (A B C & D)
G) Loans On Manufactured Home Dwelling (A B C & D)
Number
Average Value
Number
Average Value
Number
Average Value
Number
Average Value
Number
Average Value
Number
Average Value
Number
Average Value
LOANS ORIGINATED
54
$125,481
308
$132,159
242
$122,640
36
$50,833
4
$1,485,250
42
$106,714
20
$32,100
APPLICATIONS APPROVED, NOT ACCEPTED
0
$0
86
$143,605
50
$126,980
9
$28,778
0
$0
1
$135,000
24
$44,208
APPLICATIONS DENIED
32
$96,531
83
$89,193
190
$136,637
44
$31,250
0
$0
18
$64,722
31
$31,097
APPLICATIONS WITHDRAWN
4
$146,000
16
$108,625
54
$162,759
3
$172,000
0
$0
1
$104,000
1
$55,000
FILES CLOSED FOR INCOMPLETENESS
29
$124,310
50
$102,180
54
$125,704
2
$138,500
0
$0
17
$53,235
0
$0
Aggregated Statistics For Year 2005 (Based on 2 full tracts)
A) FHA, FSA/RHS & VA Home Purchase Loans
B) Conventional Home Purchase Loans
C) Refinancings
D) Home Improvement Loans
E) Loans on Dwellings For 5+ Families
F) Non-occupant Loans on < 5 Family Dwellings (A B C & D)
G) Loans On Manufactured Home Dwelling (A B C & D)
Number
Average Value
Number
Average Value
Number
Average Value
Number
Average Value
Number
Average Value
Number
Average Value
Number
Average Value
LOANS ORIGINATED
4
$178,250
344
$136,799
281
$140,221
58
$46,017
1
$237,000
18
$116,778
36
$38,722
APPLICATIONS APPROVED, NOT ACCEPTED
0
$0
59
$111,932
64
$131,844
6
$82,333
0
$0
2
$110,500
27
$48,037
APPLICATIONS DENIED
4
$34,250
107
$80,430
186
$144,989
50
$36,120
0
$0
7
$70,714
70
$42,229
APPLICATIONS WITHDRAWN
2
$154,500
40
$111,500
121
$150,934
15
$132,400
0
$0
3
$107,000
8
$57,375
FILES CLOSED FOR INCOMPLETENESS
0
$0
4
$151,250
52
$177,462
1
$175,000
0
$0
0
$0
0
$0
Aggregated Statistics For Year 2004 (Based on 2 full tracts)
A) FHA, FSA/RHS & VA Home Purchase Loans
B) Conventional Home Purchase Loans
C) Refinancings
D) Home Improvement Loans
F) Non-occupant Loans on < 5 Family Dwellings (A B C & D)
G) Loans On Manufactured Home Dwelling (A B C & D)
Number
Average Value
Number
Average Value
Number
Average Value
Number
Average Value
Number
Average Value
Number
Average Value
LOANS ORIGINATED
9
$160,222
391
$155,120
289
$130,131
40
$47,675
11
$144,727
35
$44,486
APPLICATIONS APPROVED, NOT ACCEPTED
3
$159,333
56
$114,571
54
$134,148
7
$18,143
3
$133,333
36
$50,333
APPLICATIONS DENIED
4
$108,750
69
$106,087
150
$130,460
20
$36,300
3
$90,333
56
$40,232
APPLICATIONS WITHDRAWN
1
$132,000
36
$146,028
114
$151,333
4
$52,750
0
$0
0
$0
FILES CLOSED FOR INCOMPLETENESS
2
$162,000
9
$161,000
39
$133,385
2
$52,500
4
$92,500
0
$0
Aggregated Statistics For Year 2003 (Based on 2 full tracts)
A) FHA, FSA/RHS & VA Home Purchase Loans
B) Conventional Home Purchase Loans
C) Refinancings
D) Home Improvement Loans
E) Loans on Dwellings For 5+ Families
F) Non-occupant Loans on < 5 Family Dwellings (A B C & D)
Number
Average Value
Number
Average Value
Number
Average Value
Number
Average Value
Number
Average Value
Number
Average Value
LOANS ORIGINATED
14
$136,929
223
$135,942
563
$127,073
23
$12,783
1
$175,000
13
$94,308
APPLICATIONS APPROVED, NOT ACCEPTED
1
$95,000
62
$80,242
80
$110,750
3
$12,333
0
$0
2
$70,000
APPLICATIONS DENIED
2
$169,000
110
$67,227
150
$109,340
25
$26,160
0
$0
6
$67,833
APPLICATIONS WITHDRAWN
2
$139,500
22
$148,273
109
$131,174
3
$16,667
0
$0
2
$27,500
FILES CLOSED FOR INCOMPLETENESS
2
$189,000
5
$151,600
20
$129,950
0
$0
0
$0
0
$0
Aggregated Statistics For Year 2002 (Based on 2 full tracts)
A) FHA, FSA/RHS & VA Home Purchase Loans
B) Conventional Home Purchase Loans
C) Refinancings
D) Home Improvement Loans
F) Non-occupant Loans on < 5 Family Dwellings (A B C & D)
Number
Average Value
Number
Average Value
Number
Average Value
Number
Average Value
Number
Average Value
LOANS ORIGINATED
19
$151,211
202
$150,634
389
$127,578
40
$21,650
12
$105,583
APPLICATIONS APPROVED, NOT ACCEPTED
0
$0
59
$77,000
79
$99,975
7
$38,571
4
$113,000
APPLICATIONS DENIED
2
$128,500
118
$52,398
102
$127,637
22
$11,727
7
$85,429
APPLICATIONS WITHDRAWN
2
$151,500
9
$120,000
66
$112,394
2
$62,500
0
$0
FILES CLOSED FOR INCOMPLETENESS
1
$124,000
8
$131,750
18
$164,111
1
$10,000
2
$174,500
Aggregated Statistics For Year 2001 (Based on 2 full tracts)
A) FHA, FSA/RHS & VA Home Purchase Loans
B) Conventional Home Purchase Loans
C) Refinancings
D) Home Improvement Loans
E) Loans on Dwellings For 5+ Families
F) Non-occupant Loans on < 5 Family Dwellings (A B C & D)
Number
Average Value
Number
Average Value
Number
Average Value
Number
Average Value
Number
Average Value
Number
Average Value
LOANS ORIGINATED
22
$139,091
155
$111,271
346
$114,133
46
$24,652
0
$0
8
$80,125
APPLICATIONS APPROVED, NOT ACCEPTED
1
$134,000
126
$59,738
55
$106,673
15
$24,733
0
$0
6
$57,667
APPLICATIONS DENIED
3
$134,000
305
$45,839
128
$75,445
34
$12,618
0
$0
16
$58,750
APPLICATIONS WITHDRAWN
1
$141,000
19
$86,421
51
$121,431
3
$56,667
1
$125,000
4
$85,250
FILES CLOSED FOR INCOMPLETENESS
0
$0
3
$107,667
26
$121,654
0
$0
0
$0
0
$0
Aggregated Statistics For Year 2000 (Based on 2 full tracts)
A) FHA, FSA/RHS & VA Home Purchase Loans
B) Conventional Home Purchase Loans
C) Refinancings
D) Home Improvement Loans
F) Non-occupant Loans on < 5 Family Dwellings (A B C & D)
Number
Average Value
Number
Average Value
Number
Average Value
Number
Average Value
Number
Average Value
LOANS ORIGINATED
28
$119,036
197
$106,005
97
$79,948
59
$20,441
9
$60,778
APPLICATIONS APPROVED, NOT ACCEPTED
1
$34,000
161
$48,851
34
$67,882
20
$20,050
8
$41,875
APPLICATIONS DENIED
1
$112,000
599
$41,454
62
$74,016
31
$13,161
8
$36,625
APPLICATIONS WITHDRAWN
1
$203,000
17
$74,059
25
$74,120
3
$33,333
2
$99,500
FILES CLOSED FOR INCOMPLETENESS
1
$80,000
1
$138,000
8
$83,250
1
$20,000
1
$120,000
Aggregated Statistics For Year 1999 (Based on 2 full tracts)
A) FHA, FSA/RHS & VA Home Purchase Loans
B) Conventional Home Purchase Loans
C) Refinancings
D) Home Improvement Loans
F) Non-occupant Loans on < 5 Family Dwellings (A B C & D)
Detailed PMIC statistics for the following Tracts:5990.00
, 5991.00
2002 - 2018 National Fire Incident Reporting System (NFIRS) incidents
Based on the data from the years 2002 - 2018 the average number of fire incidents per year is 18. The highest number of reported fires - 50 took place in 2018, and the least - 1 in 2014. The data has an increasing trend.
When looking into fire subcategories, the most incidents belonged to: Structure Fires (59.6%), and Outside Fires (20.8%).
Fire incident types reported to NFIRS in Flat Rock, MI


 Recent articles from our blog. Our writers, many of them Ph.D. graduates or candidates, create easy-to-read articles on a wide variety of topics.

 (9.0 miles
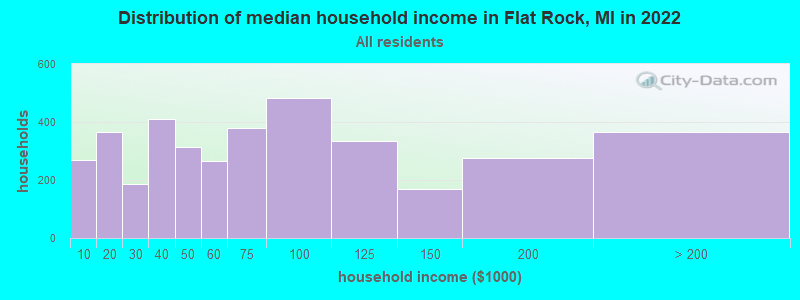


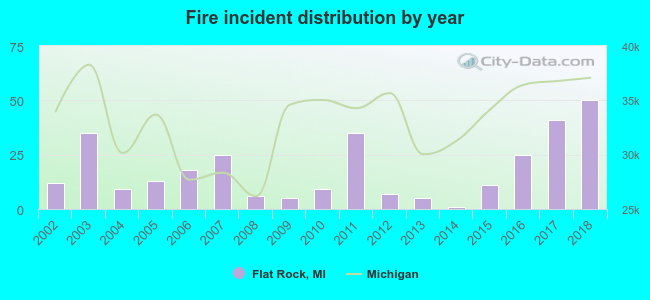 Based on the data from the years 2002 - 2018 the average number of fire incidents per year is 18. The highest number of reported fires - 50 took place in 2018, and the least - 1 in 2014. The data has an increasing trend.
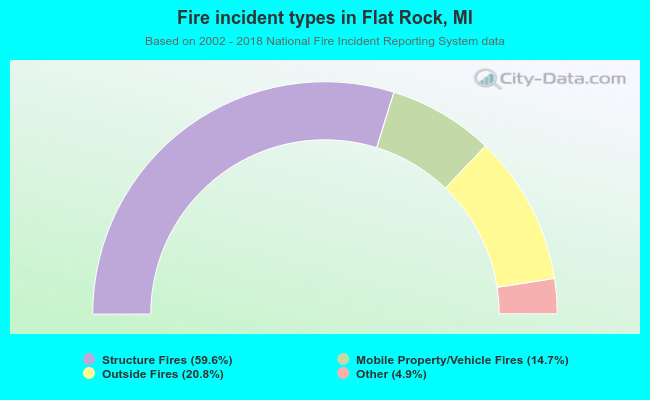 When looking into fire subcategories, the most incidents belonged to: Structure Fires (59.6%), and Outside Fires (20.8%).