Forest Acres, South Carolina Submit your own pictures of this city and show them to the world
OSM Map
General Map
Google Map
MSN Map
OSM Map
General Map
Google Map
MSN Map
OSM Map
General Map
Google Map
MSN Map
OSM Map
General Map
Google Map
MSN Map
Please wait while loading the map...
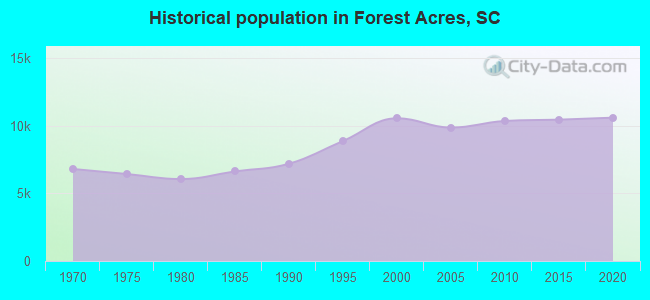
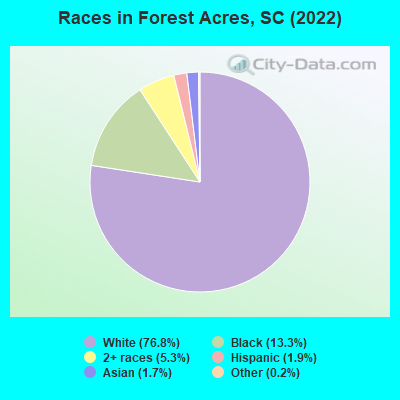
Population in 2022: 10,403 (100% urban, 0% rural). Population change since 2000: -1.5%Males: 4,942 Females: 5,461
March 2022 cost of living index in Forest Acres: 87.2 (less than average, U.S. average is 100) Percentage of residents living in poverty in 2022: 9.7%for White Non-Hispanic residents , 25.7% for Black residents , 2.7% for Hispanic or Latino residents , 1.0% for two or more races residents )Business Search - 14 Million verified businesses
Data:
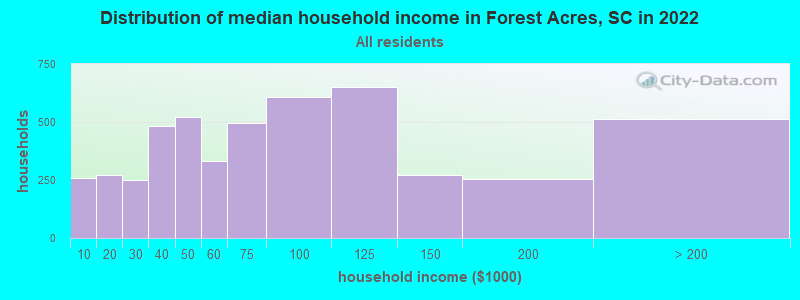
Median household income ($)
Median household income (% change since 2000)
Household income diversity
Ratio of average income to average house value (%)
Ratio of average income to average rent
Median household income ($) - White
Median household income ($) - Black or African American
Median household income ($) - Asian
Median household income ($) - Hispanic or Latino
Median household income ($) - American Indian and Alaska Native
Median household income ($) - Multirace
Median household income ($) - Other Race
Median household income for houses/condos with a mortgage ($)
Median household income for apartments without a mortgage ($)
Races - White alone (%)
Races - White alone (% change since 2000)
Races - Black alone (%)
Races - Black alone (% change since 2000)
Races - American Indian alone (%)
Races - American Indian alone (% change since 2000)
Races - Asian alone (%)
Races - Asian alone (% change since 2000)
Races - Hispanic (%)
Races - Hispanic (% change since 2000)
Races - Native Hawaiian and Other Pacific Islander alone (%)
Races - Native Hawaiian and Other Pacific Islander alone (% change since 2000)
Races - Two or more races (%)
Races - Two or more races (% change since 2000)
Races - Other race alone (%)
Races - Other race alone (% change since 2000)
Racial diversity
Unemployment (%)
Unemployment (% change since 2000)
Unemployment (%) - White
Unemployment (%) - Black or African American
Unemployment (%) - Asian
Unemployment (%) - Hispanic or Latino
Unemployment (%) - American Indian and Alaska Native
Unemployment (%) - Multirace
Unemployment (%) - Other Race
Population density (people per square mile)
Population - Males (%)
Population - Females (%)
Population - Males (%) - White
Population - Males (%) - Black or African American
Population - Males (%) - Asian
Population - Males (%) - Hispanic or Latino
Population - Males (%) - American Indian and Alaska Native
Population - Males (%) - Multirace
Population - Males (%) - Other Race
Population - Females (%) - White
Population - Females (%) - Black or African American
Population - Females (%) - Asian
Population - Females (%) - Hispanic or Latino
Population - Females (%) - American Indian and Alaska Native
Population - Females (%) - Multirace
Population - Females (%) - Other Race
Coronavirus confirmed cases (May 13, 2024)
Deaths caused by coronavirus (May 13, 2024)
Coronavirus confirmed cases (per 100k population) (May 13, 2024)
Deaths caused by coronavirus (per 100k population) (May 13, 2024)
Daily increase in number of cases (May 13, 2024)
Weekly increase in number of cases (May 13, 2024)
Cases doubled (in days) (May 13, 2024)
Hospitalized patients (Apr 18, 2022)
Negative test results (Apr 18, 2022)
Total test results (Apr 18, 2022)
COVID Vaccine doses distributed (per 100k population) (Sep 19, 2023)
COVID Vaccine doses administered (per 100k population) (Sep 19, 2023)
COVID Vaccine doses distributed (Sep 19, 2023)
COVID Vaccine doses administered (Sep 19, 2023)
Likely homosexual households (%)
Likely homosexual households (% change since 2000)
Likely homosexual households - Lesbian couples (%)
Likely homosexual households - Lesbian couples (% change since 2000)
Likely homosexual households - Gay men (%)
Likely homosexual households - Gay men (% change since 2000)
Cost of living index
Median gross rent ($)
Median contract rent ($)
Median monthly housing costs ($)
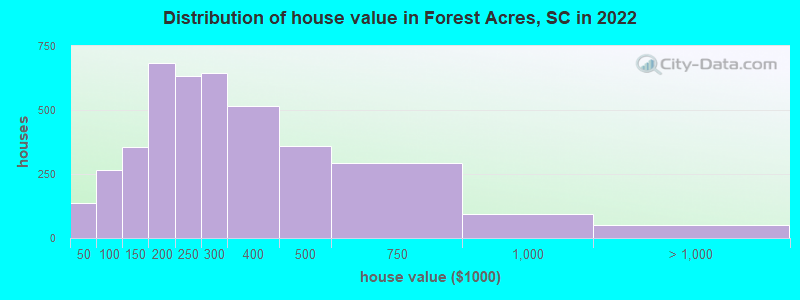
Median house or condo value ($)
Median house or condo value ($ change since 2000)
Mean house or condo value by units in structure - 1, detached ($)
Mean house or condo value by units in structure - 1, attached ($)
Mean house or condo value by units in structure - 2 ($)
Mean house or condo value by units in structure by units in structure - 3 or 4 ($)
Mean house or condo value by units in structure - 5 or more ($)
Mean house or condo value by units in structure - Boat, RV, van, etc. ($)
Mean house or condo value by units in structure - Mobile home ($)
Median house or condo value ($) - White
Median house or condo value ($) - Black or African American
Median house or condo value ($) - Asian
Median house or condo value ($) - Hispanic or Latino
Median house or condo value ($) - American Indian and Alaska Native
Median house or condo value ($) - Multirace
Median house or condo value ($) - Other Race
Median resident age
Resident age diversity
Median resident age - Males
Median resident age - Females
Median resident age - White
Median resident age - Black or African American
Median resident age - Asian
Median resident age - Hispanic or Latino
Median resident age - American Indian and Alaska Native
Median resident age - Multirace
Median resident age - Other Race
Median resident age - Males - White
Median resident age - Males - Black or African American
Median resident age - Males - Asian
Median resident age - Males - Hispanic or Latino
Median resident age - Males - American Indian and Alaska Native
Median resident age - Males - Multirace
Median resident age - Males - Other Race
Median resident age - Females - White
Median resident age - Females - Black or African American
Median resident age - Females - Asian
Median resident age - Females - Hispanic or Latino
Median resident age - Females - American Indian and Alaska Native
Median resident age - Females - Multirace
Median resident age - Females - Other Race
Commute - mean travel time to work (minutes)
Travel time to work - Less than 5 minutes (%)
Travel time to work - Less than 5 minutes (% change since 2000)
Travel time to work - 5 to 9 minutes (%)
Travel time to work - 5 to 9 minutes (% change since 2000)
Travel time to work - 10 to 19 minutes (%)
Travel time to work - 10 to 19 minutes (% change since 2000)
Travel time to work - 20 to 29 minutes (%)
Travel time to work - 20 to 29 minutes (% change since 2000)
Travel time to work - 30 to 39 minutes (%)
Travel time to work - 30 to 39 minutes (% change since 2000)
Travel time to work - 40 to 59 minutes (%)
Travel time to work - 40 to 59 minutes (% change since 2000)
Travel time to work - 60 to 89 minutes (%)
Travel time to work - 60 to 89 minutes (% change since 2000)
Travel time to work - 90 or more minutes (%)
Travel time to work - 90 or more minutes (% change since 2000)
Marital status - Never married (%)
Marital status - Now married (%)
Marital status - Separated (%)
Marital status - Widowed (%)
Marital status - Divorced (%)
Median family income ($)
Median family income (% change since 2000)
Median non-family income ($)
Median non-family income (% change since 2000)
Median per capita income ($)
Median per capita income (% change since 2000)
Median family income ($) - White
Median family income ($) - Black or African American
Median family income ($) - Asian
Median family income ($) - Hispanic or Latino
Median family income ($) - American Indian and Alaska Native
Median family income ($) - Multirace
Median family income ($) - Other Race
Median year house/condo built
Median year apartment built
Year house built - Built 2005 or later (%)
Year house built - Built 2000 to 2004 (%)
Year house built - Built 1990 to 1999 (%)
Year house built - Built 1980 to 1989 (%)
Year house built - Built 1970 to 1979 (%)
Year house built - Built 1960 to 1969 (%)
Year house built - Built 1950 to 1959 (%)
Year house built - Built 1940 to 1949 (%)
Year house built - Built 1939 or earlier (%)
Average household size
Household density (households per square mile)
Average household size - White
Average household size - Black or African American
Average household size - Asian
Average household size - Hispanic or Latino
Average household size - American Indian and Alaska Native
Average household size - Multirace
Average household size - Other Race
Occupied housing units (%)
Vacant housing units (%)
Owner occupied housing units (%)
Renter occupied housing units (%)
Vacancy status - For rent (%)
Vacancy status - For sale only (%)
Vacancy status - Rented or sold, not occupied (%)
Vacancy status - For seasonal, recreational, or occasional use (%)
Vacancy status - For migrant workers (%)
Vacancy status - Other vacant (%)
Residents with income below the poverty level (%)
Residents with income below 50% of the poverty level (%)
Children below poverty level (%)
Poor families by family type - Married-couple family (%)
Poor families by family type - Male, no wife present (%)
Poor families by family type - Female, no husband present (%)
Poverty status for native-born residents (%)
Poverty status for foreign-born residents (%)
Poverty among high school graduates not in families (%)
Poverty among people who did not graduate high school not in families (%)
Residents with income below the poverty level (%) - White
Residents with income below the poverty level (%) - Black or African American
Residents with income below the poverty level (%) - Asian
Residents with income below the poverty level (%) - Hispanic or Latino
Residents with income below the poverty level (%) - American Indian and Alaska Native
Residents with income below the poverty level (%) - Multirace
Residents with income below the poverty level (%) - Other Race
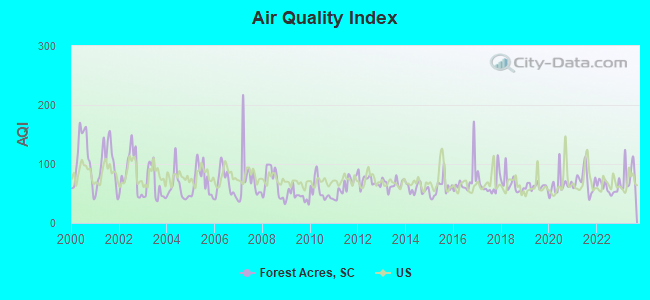
Air pollution - Air Quality Index (AQI)
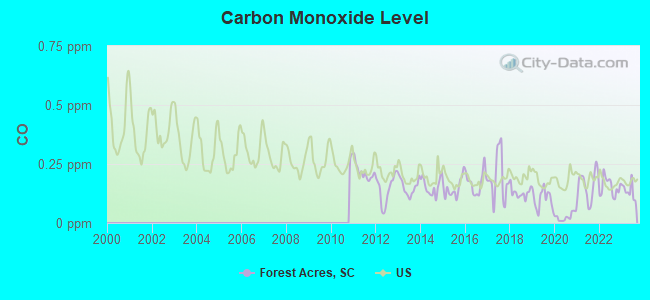
Air pollution - CO
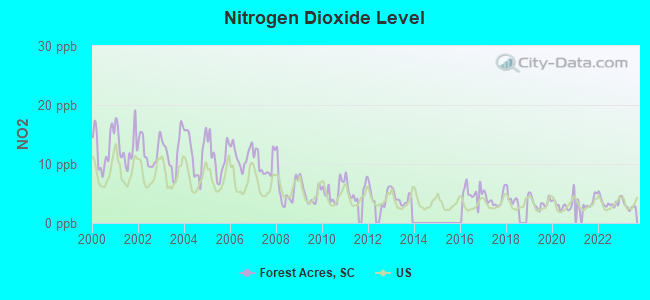
Air pollution - NO2
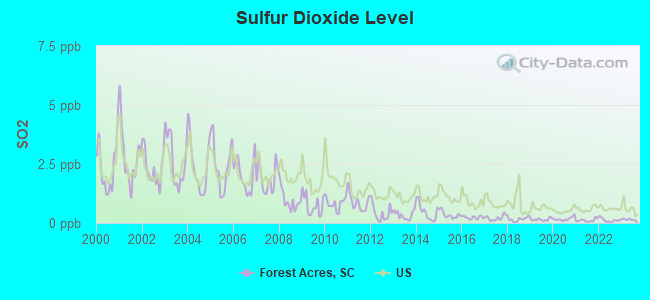
Air pollution - SO2
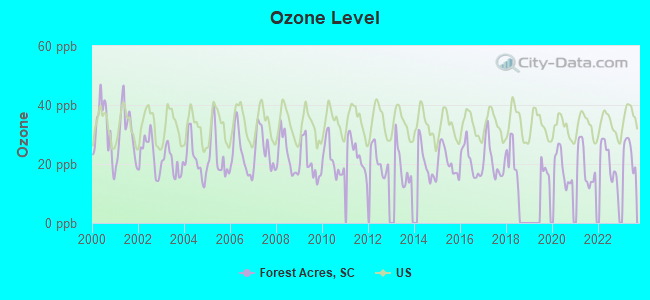
Air pollution - Ozone
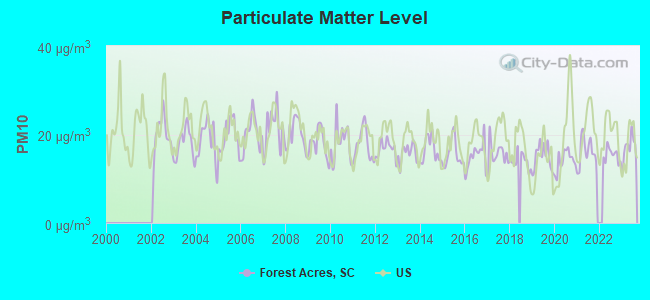
Air pollution - PM10
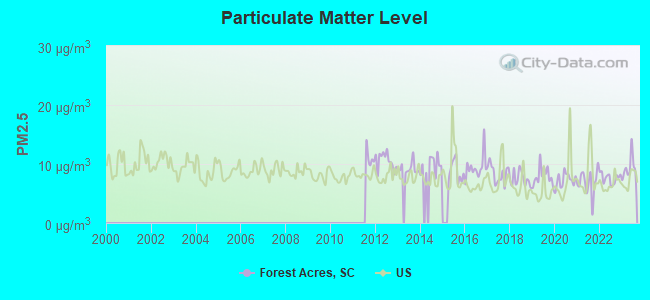
Air pollution - PM25
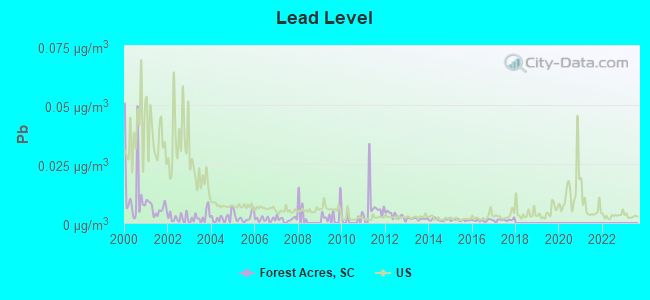
Air pollution - Pb
Crime - Murders per 100,000 population
Crime - Rapes per 100,000 population
Crime - Robberies per 100,000 population
Crime - Assaults per 100,000 population
Crime - Burglaries per 100,000 population
Crime - Thefts per 100,000 population
Crime - Auto thefts per 100,000 population
Crime - Arson per 100,000 population
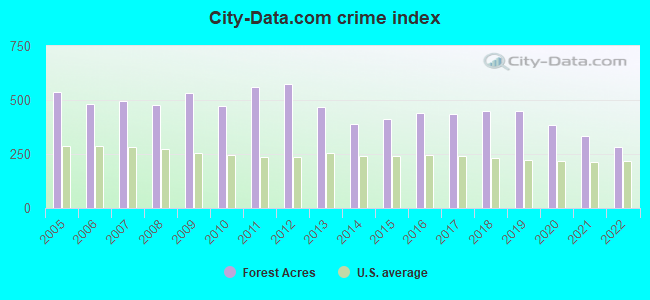
Crime - City-data.com crime index
Crime - Violent crime index
Crime - Property crime index
Crime - Murders per 100,000 population (5 year average)
Crime - Rapes per 100,000 population (5 year average)
Crime - Robberies per 100,000 population (5 year average)
Crime - Assaults per 100,000 population (5 year average)
Crime - Burglaries per 100,000 population (5 year average)
Crime - Thefts per 100,000 population (5 year average)
Crime - Auto thefts per 100,000 population (5 year average)
Crime - Arson per 100,000 population (5 year average)
Crime - City-data.com crime index (5 year average)
Crime - Violent crime index (5 year average)
Crime - Property crime index (5 year average)
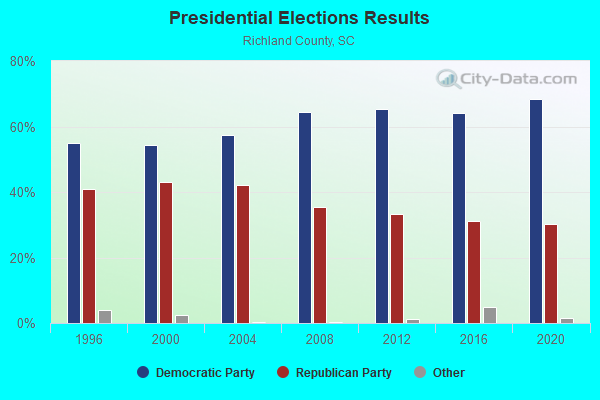
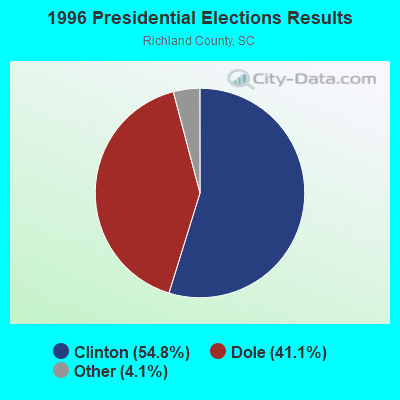
1996 Presidential Elections Results (%) - Democratic Party (Clinton)
1996 Presidential Elections Results (%) - Republican Party (Dole)
1996 Presidential Elections Results (%) - Other
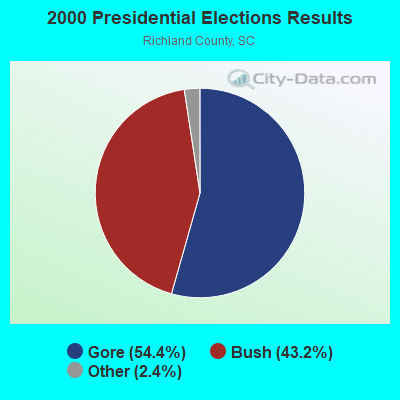
2000 Presidential Elections Results (%) - Democratic Party (Gore)
2000 Presidential Elections Results (%) - Republican Party (Bush)
2000 Presidential Elections Results (%) - Other
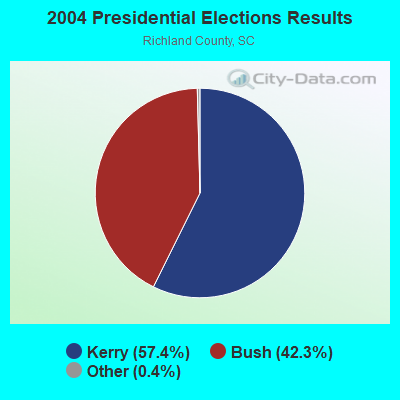
2004 Presidential Elections Results (%) - Democratic Party (Kerry)
2004 Presidential Elections Results (%) - Republican Party (Bush)
2004 Presidential Elections Results (%) - Other
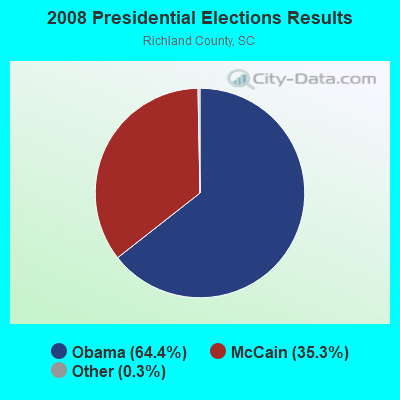
2008 Presidential Elections Results (%) - Democratic Party (Obama)
2008 Presidential Elections Results (%) - Republican Party (McCain)
2008 Presidential Elections Results (%) - Other
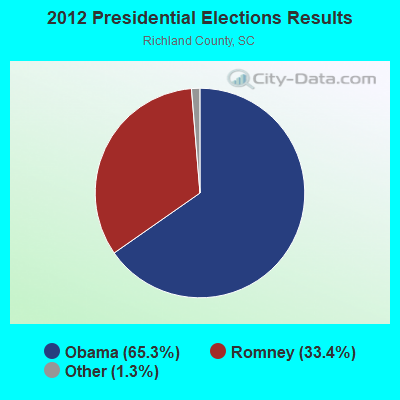
2012 Presidential Elections Results (%) - Democratic Party (Obama)
2012 Presidential Elections Results (%) - Republican Party (Romney)
2012 Presidential Elections Results (%) - Other
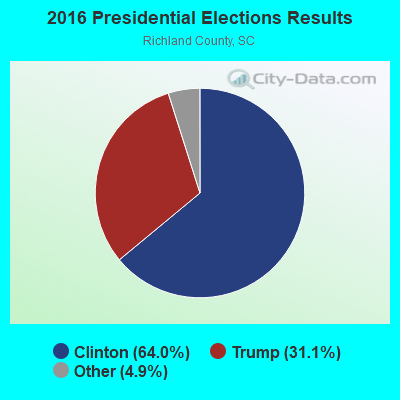
2016 Presidential Elections Results (%) - Democratic Party (Clinton)
2016 Presidential Elections Results (%) - Republican Party (Trump)
2016 Presidential Elections Results (%) - Other
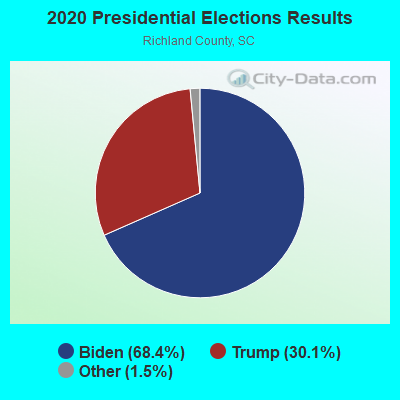
2020 Presidential Elections Results (%) - Democratic Party (Biden)
2020 Presidential Elections Results (%) - Republican Party (Trump)
2020 Presidential Elections Results (%) - Other
Ancestries Reported - Arab (%)
Ancestries Reported - Czech (%)
Ancestries Reported - Danish (%)
Ancestries Reported - Dutch (%)
Ancestries Reported - English (%)
Ancestries Reported - French (%)
Ancestries Reported - French Canadian (%)
Ancestries Reported - German (%)
Ancestries Reported - Greek (%)
Ancestries Reported - Hungarian (%)
Ancestries Reported - Irish (%)
Ancestries Reported - Italian (%)
Ancestries Reported - Lithuanian (%)
Ancestries Reported - Norwegian (%)
Ancestries Reported - Polish (%)
Ancestries Reported - Portuguese (%)
Ancestries Reported - Russian (%)
Ancestries Reported - Scotch-Irish (%)
Ancestries Reported - Scottish (%)
Ancestries Reported - Slovak (%)
Ancestries Reported - Subsaharan African (%)
Ancestries Reported - Swedish (%)
Ancestries Reported - Swiss (%)
Ancestries Reported - Ukrainian (%)
Ancestries Reported - United States (%)
Ancestries Reported - Welsh (%)
Ancestries Reported - West Indian (%)
Ancestries Reported - Other (%)
Educational Attainment - No schooling completed (%)
Educational Attainment - Less than high school (%)
Educational Attainment - High school or equivalent (%)
Educational Attainment - Less than 1 year of college (%)
Educational Attainment - 1 or more years of college (%)
Educational Attainment - Associate degree (%)
Educational Attainment - Bachelor's degree (%)
Educational Attainment - Master's degree (%)
Educational Attainment - Professional school degree (%)
Educational Attainment - Doctorate degree (%)
School Enrollment - Nursery, preschool (%)
School Enrollment - Kindergarten (%)
School Enrollment - Grade 1 to 4 (%)
School Enrollment - Grade 5 to 8 (%)
School Enrollment - Grade 9 to 12 (%)
School Enrollment - College undergrad (%)
School Enrollment - Graduate or professional (%)
School Enrollment - Not enrolled in school (%)
School enrollment - Public schools (%)
School enrollment - Private schools (%)
School enrollment - Not enrolled (%)
Median number of rooms in houses and condos
Median number of rooms in apartments
Housing units lacking complete plumbing facilities (%)
Housing units lacking complete kitchen facilities (%)
Density of houses
Urban houses (%)
Rural houses (%)
Households with people 60 years and over (%)
Households with people 65 years and over (%)
Households with people 75 years and over (%)
Households with one or more nonrelatives (%)
Households with no nonrelatives (%)
Population in households (%)
Family households (%)
Nonfamily households (%)
Population in families (%)
Family households with own children (%)
Median number of bedrooms in owner occupied houses
Mean number of bedrooms in owner occupied houses
Median number of bedrooms in renter occupied houses
Mean number of bedrooms in renter occupied houses
Median number of vehichles in owner occupied houses
Mean number of vehichles in owner occupied houses
Median number of vehichles in renter occupied houses
Mean number of vehichles in renter occupied houses
Mortgage status - with mortgage (%)
Mortgage status - with second mortgage (%)
Mortgage status - with home equity loan (%)
Mortgage status - with both second mortgage and home equity loan (%)
Mortgage status - without a mortgage (%)
Average family size
Average family size - White
Average family size - Black or African American
Average family size - Asian
Average family size - Hispanic or Latino
Average family size - American Indian and Alaska Native
Average family size - Multirace
Average family size - Other Race
Geographical mobility - Same house 1 year ago (%)
Geographical mobility - Moved within same county (%)
Geographical mobility - Moved from different county within same state (%)
Geographical mobility - Moved from different state (%)
Geographical mobility - Moved from abroad (%)
Place of birth - Born in state of residence (%)
Place of birth - Born in other state (%)
Place of birth - Native, outside of US (%)
Place of birth - Foreign born (%)
Housing units in structures - 1, detached (%)
Housing units in structures - 1, attached (%)
Housing units in structures - 2 (%)
Housing units in structures - 3 or 4 (%)
Housing units in structures - 5 to 9 (%)
Housing units in structures - 10 to 19 (%)
Housing units in structures - 20 to 49 (%)
Housing units in structures - 50 or more (%)
Housing units in structures - Mobile home (%)
Housing units in structures - Boat, RV, van, etc. (%)
House/condo owner moved in on average (years ago)
Renter moved in on average (years ago)
Year householder moved into unit - Moved in 1999 to March 2000 (%)
Year householder moved into unit - Moved in 1995 to 1998 (%)
Year householder moved into unit - Moved in 1990 to 1994 (%)
Year householder moved into unit - Moved in 1980 to 1989 (%)
Year householder moved into unit - Moved in 1970 to 1979 (%)
Year householder moved into unit - Moved in 1969 or earlier (%)
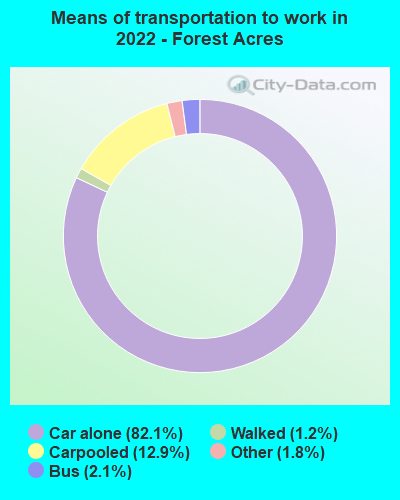
Means of transportation to work - Drove car alone (%)
Means of transportation to work - Carpooled (%)
Means of transportation to work - Public transportation (%)
Means of transportation to work - Bus or trolley bus (%)
Means of transportation to work - Streetcar or trolley car (%)
Means of transportation to work - Subway or elevated (%)
Means of transportation to work - Railroad (%)
Means of transportation to work - Ferryboat (%)
Means of transportation to work - Taxicab (%)
Means of transportation to work - Motorcycle (%)
Means of transportation to work - Bicycle (%)
Means of transportation to work - Walked (%)
Means of transportation to work - Other means (%)
Working at home (%)
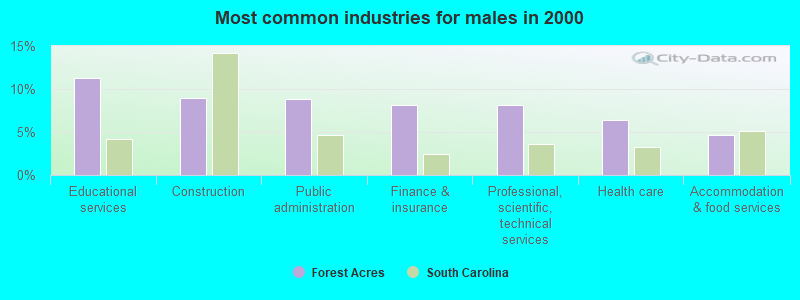
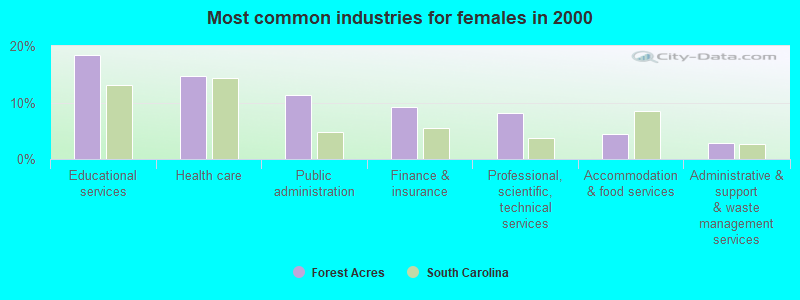
Industry diversity
Most Common Industries - Agriculture, forestry, fishing and hunting, and mining (%)
Most Common Industries - Agriculture, forestry, fishing and hunting (%)
Most Common Industries - Mining, quarrying, and oil and gas extraction (%)
Most Common Industries - Construction (%)
Most Common Industries - Manufacturing (%)
Most Common Industries - Wholesale trade (%)
Most Common Industries - Retail trade (%)
Most Common Industries - Transportation and warehousing, and utilities (%)
Most Common Industries - Transportation and warehousing (%)
Most Common Industries - Utilities (%)
Most Common Industries - Information (%)
Most Common Industries - Finance and insurance, and real estate and rental and leasing (%)
Most Common Industries - Finance and insurance (%)
Most Common Industries - Real estate and rental and leasing (%)
Most Common Industries - Professional, scientific, and management, and administrative and waste management services (%)
Most Common Industries - Professional, scientific, and technical services (%)
Most Common Industries - Management of companies and enterprises (%)
Most Common Industries - Administrative and support and waste management services (%)
Most Common Industries - Educational services, and health care and social assistance (%)
Most Common Industries - Educational services (%)
Most Common Industries - Health care and social assistance (%)
Most Common Industries - Arts, entertainment, and recreation, and accommodation and food services (%)
Most Common Industries - Arts, entertainment, and recreation (%)
Most Common Industries - Accommodation and food services (%)
Most Common Industries - Other services, except public administration (%)
Most Common Industries - Public administration (%)
Occupation diversity
Most Common Occupations - Management, business, science, and arts occupations (%)
Most Common Occupations - Management, business, and financial occupations (%)
Most Common Occupations - Management occupations (%)
Most Common Occupations - Business and financial operations occupations (%)
Most Common Occupations - Computer, engineering, and science occupations (%)
Most Common Occupations - Computer and mathematical occupations (%)
Most Common Occupations - Architecture and engineering occupations (%)
Most Common Occupations - Life, physical, and social science occupations (%)
Most Common Occupations - Education, legal, community service, arts, and media occupations (%)
Most Common Occupations - Community and social service occupations (%)
Most Common Occupations - Legal occupations (%)
Most Common Occupations - Education, training, and library occupations (%)
Most Common Occupations - Arts, design, entertainment, sports, and media occupations (%)
Most Common Occupations - Healthcare practitioners and technical occupations (%)
Most Common Occupations - Health diagnosing and treating practitioners and other technical occupations (%)
Most Common Occupations - Health technologists and technicians (%)
Most Common Occupations - Service occupations (%)
Most Common Occupations - Healthcare support occupations (%)
Most Common Occupations - Protective service occupations (%)
Most Common Occupations - Fire fighting and prevention, and other protective service workers including supervisors (%)
Most Common Occupations - Law enforcement workers including supervisors (%)
Most Common Occupations - Food preparation and serving related occupations (%)
Most Common Occupations - Building and grounds cleaning and maintenance occupations (%)
Most Common Occupations - Personal care and service occupations (%)
Most Common Occupations - Sales and office occupations (%)
Most Common Occupations - Sales and related occupations (%)
Most Common Occupations - Office and administrative support occupations (%)
Most Common Occupations - Natural resources, construction, and maintenance occupations (%)
Most Common Occupations - Farming, fishing, and forestry occupations (%)
Most Common Occupations - Construction and extraction occupations (%)
Most Common Occupations - Installation, maintenance, and repair occupations (%)
Most Common Occupations - Production, transportation, and material moving occupations (%)
Most Common Occupations - Production occupations (%)
Most Common Occupations - Transportation occupations (%)
Most Common Occupations - Material moving occupations (%)
People in Group quarters - Institutionalized population (%)
People in Group quarters - Correctional institutions (%)
People in Group quarters - Federal prisons and detention centers (%)
People in Group quarters - Halfway houses (%)
People in Group quarters - Local jails and other confinement facilities (including police lockups) (%)
People in Group quarters - Military disciplinary barracks (%)
People in Group quarters - State prisons (%)
People in Group quarters - Other types of correctional institutions (%)
People in Group quarters - Nursing homes (%)
People in Group quarters - Hospitals/wards, hospices, and schools for the handicapped (%)
People in Group quarters - Hospitals/wards and hospices for chronically ill (%)
People in Group quarters - Hospices or homes for chronically ill (%)
People in Group quarters - Military hospitals or wards for chronically ill (%)
People in Group quarters - Other hospitals or wards for chronically ill (%)
People in Group quarters - Hospitals or wards for drug/alcohol abuse (%)
People in Group quarters - Mental (Psychiatric) hospitals or wards (%)
People in Group quarters - Schools, hospitals, or wards for the mentally retarded (%)
People in Group quarters - Schools, hospitals, or wards for the physically handicapped (%)
People in Group quarters - Institutions for the deaf (%)
People in Group quarters - Institutions for the blind (%)
People in Group quarters - Orthopedic wards and institutions for the physically handicapped (%)
People in Group quarters - Wards in general hospitals for patients who have no usual home elsewhere (%)
People in Group quarters - Wards in military hospitals for patients who have no usual home elsewhere (%)
People in Group quarters - Juvenile institutions (%)
People in Group quarters - Long-term care (%)
People in Group quarters - Homes for abused, dependent, and neglected children (%)
People in Group quarters - Residential treatment centers for emotionally disturbed children (%)
People in Group quarters - Training schools for juvenile delinquents (%)
People in Group quarters - Short-term care, detention or diagnostic centers for delinquent children (%)
People in Group quarters - Type of juvenile institution unknown (%)
People in Group quarters - Noninstitutionalized population (%)
People in Group quarters - College dormitories (includes college quarters off campus) (%)
People in Group quarters - Military quarters (%)
People in Group quarters - On base (%)
People in Group quarters - Barracks, unaccompanied personnel housing (UPH), (Enlisted/Officer), ;and similar group living quarters for military personnel (%)
People in Group quarters - Transient quarters for temporary residents (%)
People in Group quarters - Military ships (%)
People in Group quarters - Group homes (%)
People in Group quarters - Homes or halfway houses for drug/alcohol abuse (%)
People in Group quarters - Homes for the mentally ill (%)
People in Group quarters - Homes for the mentally retarded (%)
People in Group quarters - Homes for the physically handicapped (%)
People in Group quarters - Other group homes (%)
People in Group quarters - Religious group quarters (%)
People in Group quarters - Dormitories (%)
People in Group quarters - Agriculture workers' dormitories on farms (%)
People in Group quarters - Job Corps and vocational training facilities (%)
People in Group quarters - Other workers' dormitories (%)
People in Group quarters - Crews of maritime vessels (%)
People in Group quarters - Other nonhousehold living situations (%)
People in Group quarters - Other noninstitutional group quarters (%)
Residents speaking English at home (%)
Residents speaking English at home - Born in the United States (%)
Residents speaking English at home - Native, born elsewhere (%)
Residents speaking English at home - Foreign born (%)
Residents speaking Spanish at home (%)
Residents speaking Spanish at home - Born in the United States (%)
Residents speaking Spanish at home - Native, born elsewhere (%)
Residents speaking Spanish at home - Foreign born (%)
Residents speaking other language at home (%)
Residents speaking other language at home - Born in the United States (%)
Residents speaking other language at home - Native, born elsewhere (%)
Residents speaking other language at home - Foreign born (%)
Class of Workers - Employee of private company (%)
Class of Workers - Self-employed in own incorporated business (%)
Class of Workers - Private not-for-profit wage and salary workers (%)
Class of Workers - Local government workers (%)
Class of Workers - State government workers (%)
Class of Workers - Federal government workers (%)
Class of Workers - Self-employed workers in own not incorporated business and Unpaid family workers (%)
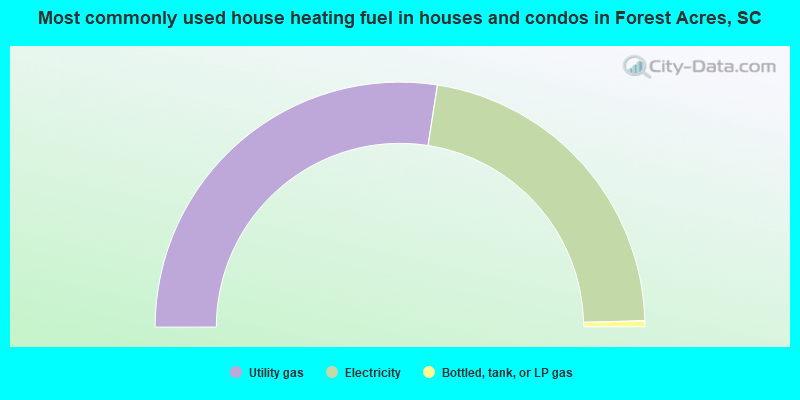
House heating fuel used in houses and condos - Utility gas (%)
House heating fuel used in houses and condos - Bottled, tank, or LP gas (%)
House heating fuel used in houses and condos - Electricity (%)
House heating fuel used in houses and condos - Fuel oil, kerosene, etc. (%)
House heating fuel used in houses and condos - Coal or coke (%)
House heating fuel used in houses and condos - Wood (%)
House heating fuel used in houses and condos - Solar energy (%)
House heating fuel used in houses and condos - Other fuel (%)
House heating fuel used in houses and condos - No fuel used (%)
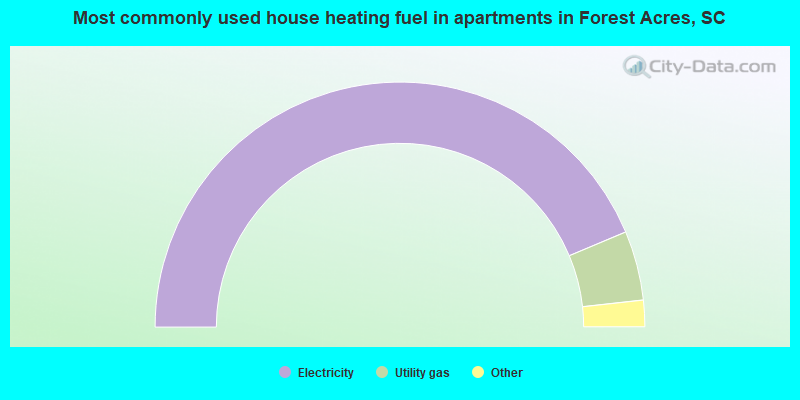
House heating fuel used in apartments - Utility gas (%)
House heating fuel used in apartments - Bottled, tank, or LP gas (%)
House heating fuel used in apartments - Electricity (%)
House heating fuel used in apartments - Fuel oil, kerosene, etc. (%)
House heating fuel used in apartments - Coal or coke (%)
House heating fuel used in apartments - Wood (%)
House heating fuel used in apartments - Solar energy (%)
House heating fuel used in apartments - Other fuel (%)
House heating fuel used in apartments - No fuel used (%)
Armed forces status - In Armed Forces (%)
Armed forces status - Civilian (%)
Armed forces status - Civilian - Veteran (%)
Armed forces status - Civilian - Nonveteran (%)
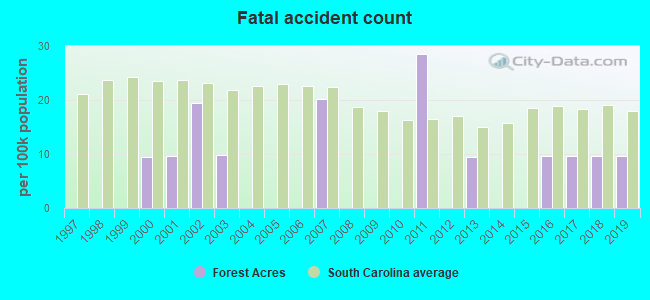
Fatal accidents locations in years 2005-2021
Fatal accidents locations in 2005
Fatal accidents locations in 2006
Fatal accidents locations in 2007
Fatal accidents locations in 2008
Fatal accidents locations in 2009
Fatal accidents locations in 2010
Fatal accidents locations in 2011
Fatal accidents locations in 2012
Fatal accidents locations in 2013
Fatal accidents locations in 2014
Fatal accidents locations in 2015
Fatal accidents locations in 2016
Fatal accidents locations in 2017
Fatal accidents locations in 2018
Fatal accidents locations in 2019
Fatal accidents locations in 2020
Fatal accidents locations in 2021
Alcohol use - People drinking some alcohol every month (%)
Alcohol use - People not drinking at all (%)
Alcohol use - Average days/month drinking alcohol
Alcohol use - Average drinks/week
Alcohol use - Average days/year people drink much
Audiometry - Average condition of hearing (%)
Audiometry - People that can hear a whisper from across a quiet room (%)
Audiometry - People that can hear normal voice from across a quiet room (%)
Audiometry - Ears ringing, roaring, buzzing (%)
Audiometry - Had a job exposure to loud noise (%)
Audiometry - Had off-work exposure to loud noise (%)
Blood Pressure & Cholesterol - Has high blood pressure (%)
Blood Pressure & Cholesterol - Checking blood pressure at home (%)
Blood Pressure & Cholesterol - Frequently checking blood cholesterol (%)
Blood Pressure & Cholesterol - Has high cholesterol level (%)
Consumer Behavior - Money monthly spent on food at supermarket/grocery store
Consumer Behavior - Money monthly spent on food at other stores
Consumer Behavior - Money monthly spent on eating out
Consumer Behavior - Money monthly spent on carryout/delivered foods
Consumer Behavior - Income spent on food at supermarket/grocery store (%)
Consumer Behavior - Income spent on food at other stores (%)
Consumer Behavior - Income spent on eating out (%)
Consumer Behavior - Income spent on carryout/delivered foods (%)
Current Health Status - General health condition (%)
Current Health Status - Blood donors (%)
Current Health Status - Has blood ever tested for HIV virus (%)
Current Health Status - Left-handed people (%)
Dermatology - People using sunscreen (%)
Diabetes - Diabetics (%)
Diabetes - Had a blood test for high blood sugar (%)
Diabetes - People taking insulin (%)
Diet Behavior & Nutrition - Diet health (%)
Diet Behavior & Nutrition - Milk product consumption (# of products/month)
Diet Behavior & Nutrition - Meals not home prepared (#/week)
Diet Behavior & Nutrition - Meals from fast food or pizza place (#/week)
Diet Behavior & Nutrition - Ready-to-eat foods (#/month)
Diet Behavior & Nutrition - Frozen meals/pizza (#/month)
Drug Use - People that ever used marijuana or hashish (%)
Drug Use - Ever used hard drugs (%)
Drug Use - Ever used any form of cocaine (%)
Drug Use - Ever used heroin (%)
Drug Use - Ever used methamphetamine (%)
Health Insurance - People covered by health insurance (%)
Kidney Conditions-Urology - Avg. # of times urinating at night
Medical Conditions - People with asthma (%)
Medical Conditions - People with anemia (%)
Medical Conditions - People with psoriasis (%)
Medical Conditions - People with overweight (%)
Medical Conditions - Elderly people having difficulties in thinking or remembering (%)
Medical Conditions - People who ever received blood transfusion (%)
Medical Conditions - People having trouble seeing even with glass/contacts (%)
Medical Conditions - People with arthritis (%)
Medical Conditions - People with gout (%)
Medical Conditions - People with congestive heart failure (%)
Medical Conditions - People with coronary heart disease (%)
Medical Conditions - People with angina pectoris (%)
Medical Conditions - People who ever had heart attack (%)
Medical Conditions - People who ever had stroke (%)
Medical Conditions - People with emphysema (%)
Medical Conditions - People with thyroid problem (%)
Medical Conditions - People with chronic bronchitis (%)
Medical Conditions - People with any liver condition (%)
Medical Conditions - People who ever had cancer or malignancy (%)
Mental Health - People who have little interest in doing things (%)
Mental Health - People feeling down, depressed, or hopeless (%)
Mental Health - People who have trouble sleeping or sleeping too much (%)
Mental Health - People feeling tired or having little energy (%)
Mental Health - People with poor appetite or overeating (%)
Mental Health - People feeling bad about themself (%)
Mental Health - People who have trouble concentrating on things (%)
Mental Health - People moving or speaking slowly or too fast (%)
Mental Health - People having thoughts they would be better off dead (%)
Oral Health - Average years since last visit a dentist
Oral Health - People embarrassed because of mouth (%)
Oral Health - People with gum disease (%)
Oral Health - General health of teeth and gums (%)
Oral Health - Average days a week using dental floss/device
Oral Health - Average days a week using mouthwash for dental problem
Oral Health - Average number of teeth
Pesticide Use - Households using pesticides to control insects (%)
Pesticide Use - Households using pesticides to kill weeds (%)
Physical Activity - People doing vigorous-intensity work activities (%)
Physical Activity - People doing moderate-intensity work activities (%)
Physical Activity - People walking or bicycling (%)
Physical Activity - People doing vigorous-intensity recreational activities (%)
Physical Activity - People doing moderate-intensity recreational activities (%)
Physical Activity - Average hours a day doing sedentary activities
Physical Activity - Average hours a day watching TV or videos
Physical Activity - Average hours a day using computer
Physical Functioning - People having limitations keeping them from working (%)
Physical Functioning - People limited in amount of work they can do (%)
Physical Functioning - People that need special equipment to walk (%)
Physical Functioning - People experiencing confusion/memory problems (%)
Physical Functioning - People requiring special healthcare equipment (%)
Prescription Medications - Average number of prescription medicines taking
Preventive Aspirin Use - Adults 40+ taking low-dose aspirin (%)
Reproductive Health - Vaginal deliveries (%)
Reproductive Health - Cesarean deliveries (%)
Reproductive Health - Deliveries resulted in a live birth (%)
Reproductive Health - Pregnancies resulted in a delivery (%)
Reproductive Health - Women breastfeeding newborns (%)
Reproductive Health - Women that had a hysterectomy (%)
Reproductive Health - Women that had both ovaries removed (%)
Reproductive Health - Women that have ever taken birth control pills (%)
Reproductive Health - Women taking birth control pills (%)
Reproductive Health - Women that have ever used Depo-Provera or injectables (%)
Reproductive Health - Women that have ever used female hormones (%)
Sexual Behavior - People 18+ that ever had sex (vaginal, anal, or oral) (%)
Sexual Behavior - Males 18+ that ever had vaginal sex with a woman (%)
Sexual Behavior - Males 18+ that ever performed oral sex on a woman (%)
Sexual Behavior - Males 18+ that ever had anal sex with a woman (%)
Sexual Behavior - Males 18+ that ever had any sex with a man (%)
Sexual Behavior - Females 18+ that ever had vaginal sex with a man (%)
Sexual Behavior - Females 18+ that ever performed oral sex on a man (%)
Sexual Behavior - Females 18+ that ever had anal sex with a man (%)
Sexual Behavior - Females 18+ that ever had any kind of sex with a woman (%)
Sexual Behavior - Average age people first had sex
Sexual Behavior - Average number of female sex partners in lifetime (males 18+)
Sexual Behavior - Average number of female vaginal sex partners in lifetime (males 18+)
Sexual Behavior - Average age people first performed oral sex on a woman (18+)
Sexual Behavior - Average number of woman performed oral sex on in lifetime (18+)
Sexual Behavior - Average number of male sex partners in lifetime (males 18+)
Sexual Behavior - Average number of male anal sex partners in lifetime (males 18+)
Sexual Behavior - Average age people first performed oral sex on a man (18+)
Sexual Behavior - Average number of male oral sex partners in lifetime (18+)
Sexual Behavior - People using protection when performing oral sex (%)
Sexual Behavior - Average number of times people have vaginal or anal sex a year
Sexual Behavior - People having sex without condom (%)
Sexual Behavior - Average number of male sex partners in lifetime (females 18+)
Sexual Behavior - Average number of male vaginal sex partners in lifetime (females 18+)
Sexual Behavior - Average number of female sex partners in lifetime (females 18+)
Sexual Behavior - Circumcised males 18+ (%)
Sleep Disorders - Average hours sleeping at night
Sleep Disorders - People that has trouble sleeping (%)
Smoking-Cigarette Use - People smoking cigarettes (%)
Taste & Smell - People 40+ having problems with smell (%)
Taste & Smell - People 40+ having problems with taste (%)
Taste & Smell - People 40+ that ever had wisdom teeth removed (%)
Taste & Smell - People 40+ that ever had tonsils teeth removed (%)
Taste & Smell - People 40+ that ever had a loss of consciousness because of a head injury (%)
Taste & Smell - People 40+ that ever had a broken nose or other serious injury to face or skull (%)
Taste & Smell - People 40+ that ever had two or more sinus infections (%)
Weight - Average height (inches)
Weight - Average weight (pounds)
Weight - Average BMI
Weight - People that are obese (%)
Weight - People that ever were obese (%)
Weight - People trying to lose weight (%)
Officers per 1,000 residents here:
2.53South Carolina average:
2.21
Latest news from Forest Acres, SC collected exclusively by city-data.com from local newspapers, TV, and radio stations
Ancestries: English (17.0%), American (12.5%), German (8.1%), Irish (6.1%), Italian (6.0%), European (4.7%).
Current Local Time:
Land area: 4.59 square miles.
Population density: 2,267 people per square mile (low).
501 residents are foreign born (1.6% Asia , 1.1% Europe , 1.0% Africa , 0.7% North America ).
This city:
4.7%South Carolina:
5.3%
Median real estate property taxes paid for housing units with mortgages in 2022: $1,663 (0.6%)Median real estate property taxes paid for housing units with no mortgage in 2022: $1,185 (0.6%)
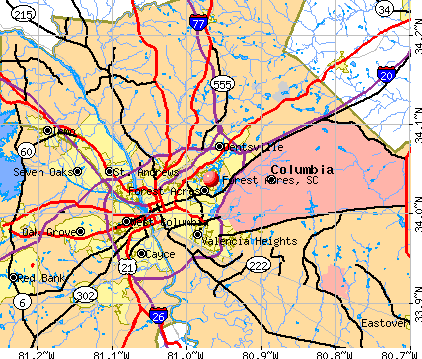
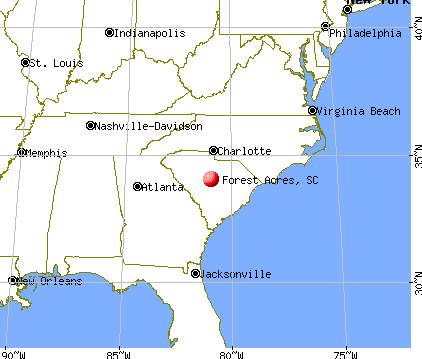
Nearest city with pop. 50,000+: Columbia, SC
Nearest city with pop. 200,000+: Charlotte, NC
Nearest city with pop. 1,000,000+: Philadelphia, PA
Nearest cities:
Latitude: 34.04 N, Longitude: 80.97 W
Daytime population change due to commuting: +2,409 (+22.6%)Workers who live and work in this city: 790 (16.2%)
Area code commonly used in this area: 803
Property values in Forest Acres, SC
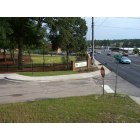
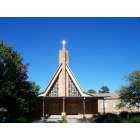
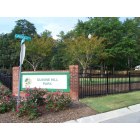
Forest Acres tourist attractions:
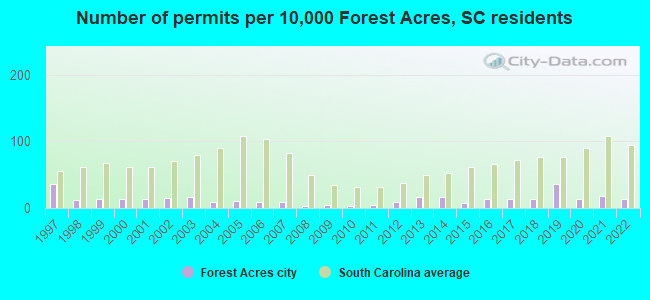
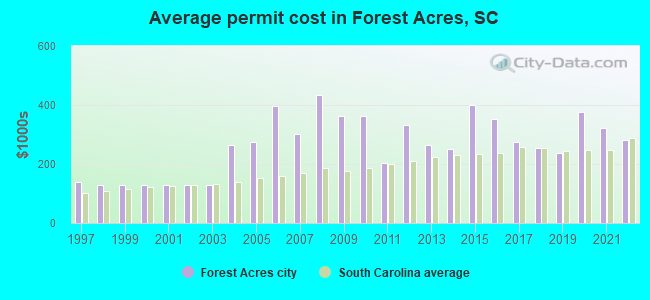
Single-family new house construction building permits:
2022: 15 buildings , average cost: $282,5002021: 19 buildings , average cost: $320,5002020: 15 buildings , average cost: $376,6002019: 38 buildings , average cost: $236,9002018: 15 buildings , average cost: $253,3002017: 14 buildings , average cost: $275,4002016: 15 buildings , average cost: $352,2002015: 8 buildings , average cost: $398,5002014: 17 buildings , average cost: $251,2002013: 17 buildings , average cost: $263,6002012: 9 buildings , average cost: $333,4002011: 4 buildings , average cost: $205,0002010: 3 buildings , average cost: $363,9002009: 4 buildings , average cost: $363,9002008: 3 buildings , average cost: $433,3002007: 10 buildings , average cost: $301,0002006: 10 buildings , average cost: $398,3002005: 12 buildings , average cost: $274,0002004: 9 buildings , average cost: $265,4002003: 17 buildings , average cost: $129,0002002: 16 buildings , average cost: $129,0002001: 14 buildings , average cost: $129,0002000: 14 buildings , average cost: $129,0001999: 15 buildings , average cost: $129,0001998: 13 buildings , average cost: $129,0001997: 38 buildings , average cost: $140,300Unemployment in December 2023: Here:
3.1%South Carolina:
3.1%
Population change in the 1990s: +482 (+4.8%).
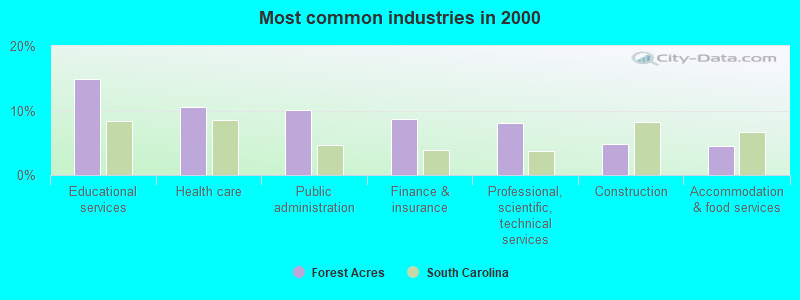
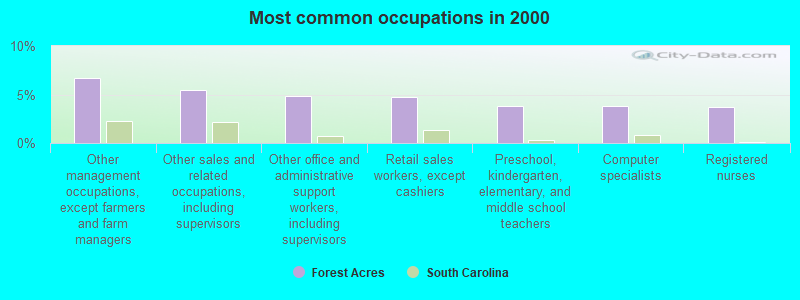
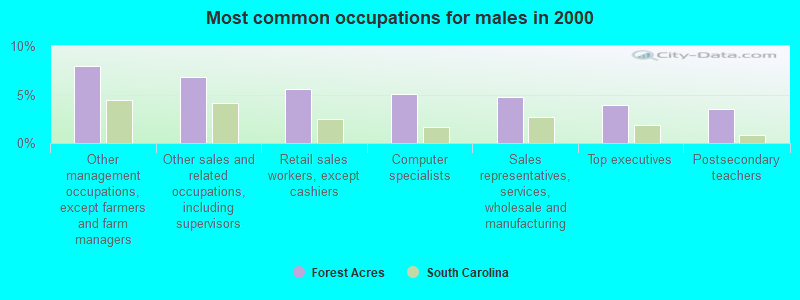
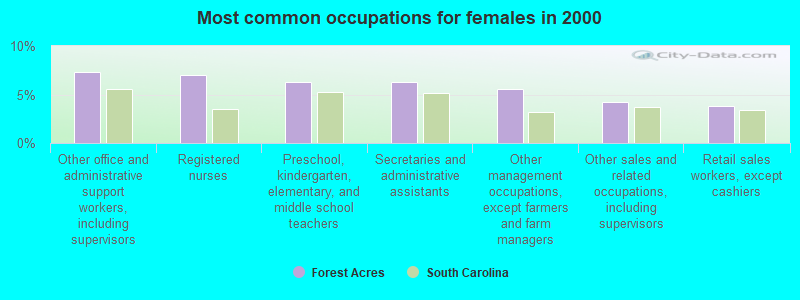
Most common occupations in Forest Acres, SC (%)
Both Males Females
Other management occupations, except farmers and farm managers (6.7%)
Other sales and related occupations, including supervisors (5.5%)
Other office and administrative support workers, including supervisors (4.9%)
Retail sales workers, except cashiers (4.7%)
Preschool, kindergarten, elementary, and middle school teachers (3.8%)
Computer specialists (3.8%)
Registered nurses (3.7%)
Other management occupations, except farmers and farm managers (7.9%)
Other sales and related occupations, including supervisors (6.8%)
Retail sales workers, except cashiers (5.6%)
Computer specialists (5.0%)
Sales representatives, services, wholesale and manufacturing (4.8%)
Top executives (4.0%)
Postsecondary teachers (3.5%)
Other office and administrative support workers, including supervisors (7.3%)
Registered nurses (7.0%)
Preschool, kindergarten, elementary, and middle school teachers (6.3%)
Secretaries and administrative assistants (6.3%)
Other management occupations, except farmers and farm managers (5.6%)
Other sales and related occupations, including supervisors (4.3%)
Retail sales workers, except cashiers (3.8%)
Tornado activity:
Forest Acres-area historical tornado activity is slightly above South Carolina state average. It is 32% greater than the overall U.S. average.
On 3/28/1984, a category F4 (max. wind speeds 207-260 mph) tornado 26.5 miles away from the Forest Acres city center killed 5 people and injured 49 people and caused between $5,000,000 and $50,000,000 in damages.
On 8/16/1994, a category F3 (max. wind speeds 158-206 mph) tornado 16.8 miles away from the city center injured 40 people and caused between $5,000,000 and $50,000,000 in damages.
Earthquake activity:
Forest Acres-area historical earthquake activity is significantly above South Carolina state average. It is 27% smaller than the overall U.S. average. On 8/2/1974 at 08:52:09, a magnitude 4.9 (4.3 MB, 4.9 LG, Class: Light, Intensity: IV - V) earthquake occurred 88.0 miles away from the city center On 8/9/2020 at 12:07:37, a magnitude 5.1 (5.1 MW, Depth: 4.7 mi, Class: Moderate, Intensity: VI - VII) earthquake occurred 168.7 miles away from Forest Acres center On 11/22/1974 at 05:25:55, a magnitude 4.7 (4.7 MB) earthquake occurred 91.9 miles away from Forest Acres center On 8/23/2011 at 17:51:04, a magnitude 5.8 (5.8 MW, Depth: 3.7 mi) earthquake occurred 316.9 miles away from the city center On 8/21/1992 at 16:31:55, a magnitude 4.4 (4.1 MB, 4.1 LG, 4.4 LG, Depth: 6.2 mi) earthquake occurred 84.2 miles away from the city center On 2/15/2014 at 03:23:38, a magnitude 4.1 (4.1 MW, Depth: 3.2 mi) earthquake occurred 66.3 miles away from Forest Acres center Magnitude types: regional Lg-wave magnitude (LG), body-wave magnitude (MB), moment magnitude (MW) Natural disasters: The number of natural disasters in Richland County (15) is near the US average (15).Major Disasters (Presidential) Declared: 7Emergencies Declared: 6Hurricanes: 7, Floods: 2, Storms: 2, Winter Storms: 2, Drought: 1, Ice Storm: 1, Tropical Storm: 1, Other: 1 (Note: some incidents may be assigned to more than one category). Hospitals and medical centers near Forest Acres: CARTER STREET COMMUNITY RES. (Hospital, about 2 miles away; COLUMBIA, SC)
RICHLAND CONVALESCENT CTR (Nursing Home, about 2 miles away; COLUMBIA, SC)
NHC HEALTHCARE - PARKLANE (Nursing Home, about 3 miles away; COLUMBIA, SC)
HEARTLAND OF COLUMBIA REHAB AND NURSING CENTER (Nursing Home, about 3 miles away; COLUMBIA, SC)
CRAFTS-FARROW STATE HOSP (Hospital, about 3 miles away; COLUMBIA, SC)
DOWDY GARDNER NCC-FARMER (Nursing Home, about 3 miles away; COLUMBIA, SC)
DOWDY GARDNER NURSING CTR MCLENDON (Nursing Home, about 3 miles away; COLUMBIA, SC)
Amtrak station near Forest Acres: 6 miles: COLUMBIA (850 PULASKI ST.) Services: ticket office, fully wheelchair accessible, enclosed waiting area, public restrooms, public payphones, vending machines, free short-term parking, free long-term parking, call for car rental service, taxi stand.
Colleges/universities with over 2000 students nearest to Forest Acres:
Benedict College (about 4 miles; Columbia, SC ; Full-time enrollment: 3,039)
University of South Carolina-Columbia (about 5 miles; Columbia, SC ; FT enrollment: 27,789)
Midlands Technical College (about 11 miles; West Columbia, SC ; FT enrollment: 8,916)
Orangeburg Calhoun Technical College (about 36 miles; Orangeburg, SC ; FT enrollment: 2,113)
Central Carolina Technical College (about 36 miles; Sumter, SC ; FT enrollment: 3,108)
South Carolina State University (about 39 miles; Orangeburg, SC ; FT enrollment: 3,481)
Denmark Technical College (about 51 miles; Denmark, SC ; FT enrollment: 2,050)
Notable locations in Forest Acres: (A) , Forest Lake Country Club (B) . Display/hide their locations on the map
Shopping Centers: (1) , Richland Mall Shopping Center (2) , Boulevard Plaza Shopping Center (3) , Arcadia Lakes Plaza Shopping Center (4) . Display/hide their locations on the map
Churches in Forest Acres include: (A) , Forest Drive Church (B) , Malone Chapel (C) , Saint Martins-in-the-Fields Church (D) . Display/hide their locations on the map
Reservoirs: (A) , Boyden Arbor Lake (B) , Spring Lake (C) , Rockford Lake (D) , Upper Rocky Ford Lake (E) , Coopers Pond (F) , Forest Lake (G) . Display/hide their locations on the map
Streams, rivers, and creeks: (A) , Jackson Creek (B) , Eightmile Branch (C) . Display/hide their locations on the map
Parks in Forest Acres include: (1) , Forest Lake Park (2) . Display/hide their locations on the map
Richland County has a predicted average indoor radon screening level less than 2 pCi/L (pico curies per liter) - Low Potential Average household size: This city:
2.1 peopleSouth Carolina:
2.5 people
Percentage of family households: This city:
55.0%Whole state:
67.5%
Percentage of households with unmarried partners: This city:
4.6%Whole state:
6.0%
Likely homosexual households (counted as self-reported same-sex unmarried-partner households)
Lesbian couples: 0.4% of all households Gay men: 0.5% of all households
54 people in group homes for juveniles (non-correctional) in 2010people in group homes intended for adults in 2010People in group quarters in Forest Acres in 2000:
66 people in homes for abused, dependent, and neglected children
55 people in nursing homes
2 people in religious group quarters
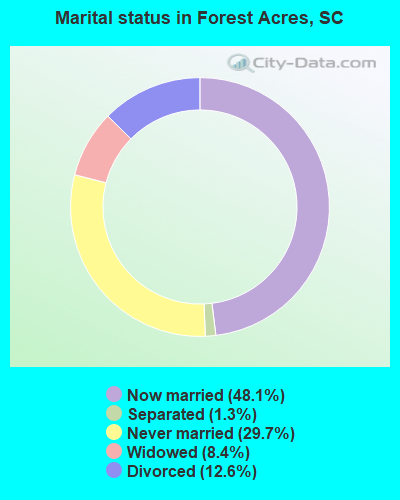
For population 15 years and over in Forest Acres:
Never married: 29.7%Now married: 48.1%Separated: 1.3%Widowed: 8.4%Divorced: 12.6% For population 25 years and over in Forest Acres:
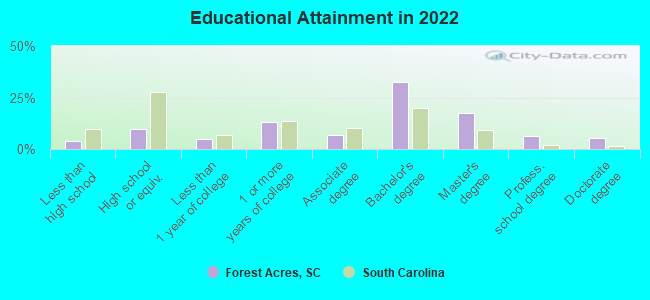
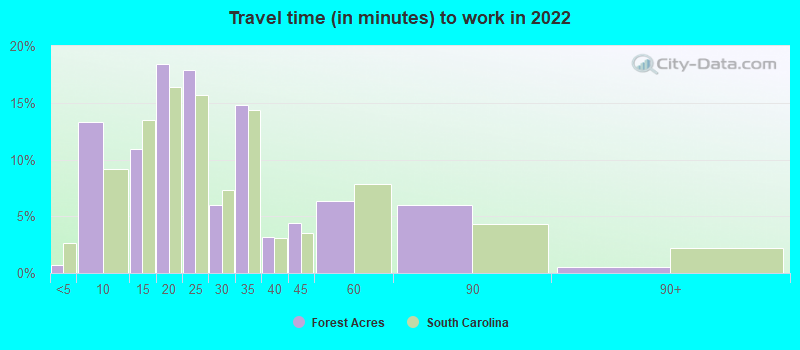
High school or higher: 95.8%Bachelor's degree or higher: 60.6%Graduate or professional degree: 26.7%Unemployed: 2.8%Mean travel time to work (commute): 20.3 minutes
Education Gini index (Inequality in education) Here:
9.9South Carolina average:
11.1
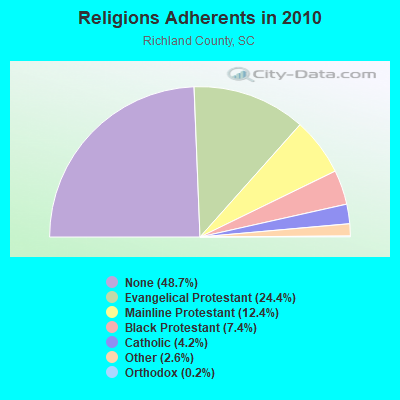
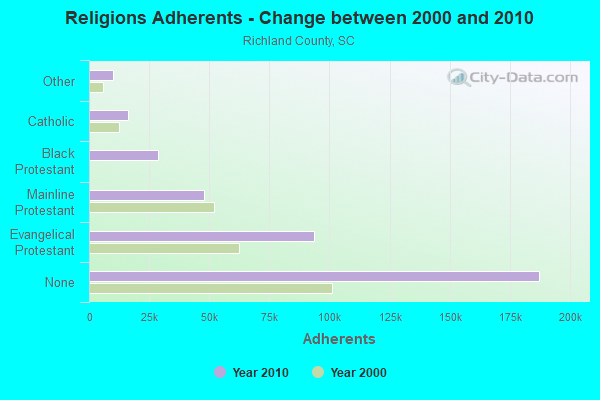
Religion statistics for Forest Acres, SC (based on Richland County data)
Religion Adherents Congregations Evangelical Protestant 93,739 263 Mainline Protestant 47,813 98 Black Protestant 28,502 56 Catholic 16,300 8 Other 10,136 32 Orthodox 700 1 None 187,314 -
Source: Clifford Grammich, Kirk Hadaway, Richard Houseal, Dale E.Jones, Alexei Krindatch, Richie Stanley and Richard H.Taylor. 2012. 2010 U.S.Religion Census: Religious Congregations & Membership Study. Association of Statisticians of American Religious Bodies. Jones, Dale E., et al. 2002. Congregations and Membership in the United States 2000. Nashville, TN: Glenmary Research Center. Graphs represent county-level data
Food Environment Statistics: Number of grocery stores : 53Richland County :
1.48 / 10,000 pop.South Carolina :
1.99 / 10,000 pop.
Number of supercenters and club stores : 3Richland County :
0.08 / 10,000 pop.South Carolina :
0.15 / 10,000 pop.
Number of convenience stores (no gas) : 14Richland County :
0.39 / 10,000 pop.South Carolina :
0.85 / 10,000 pop.
Number of convenience stores (with gas) : 145Here :
4.05 / 10,000 pop.South Carolina :
5.38 / 10,000 pop.
Number of full-service restaurants : 252This county :
7.04 / 10,000 pop.South Carolina :
7.75 / 10,000 pop.
Adult diabetes rate : Richland County :
10.1%State :
10.6%
Adult obesity rate : Richland County :
30.0%State :
29.4%
Low-income preschool obesity rate : Richland County :
9.3%South Carolina :
13.4%
Health and Nutrition: Healthy diet rate : Forest Acres:
57.3%South Carolina:
49.2%
Average overall health of teeth and gums : Forest Acres:
57.4%State:
46.2%
People feeling badly about themselves : Forest Acres:
17.0%State:
20.4%
People not drinking alcohol at all : Here:
9.3%South Carolina:
11.0%
Average hours sleeping at night : Forest Acres:
7.0South Carolina:
6.8
Overweight people : Forest Acres:
35.8%South Carolina:
34.4%
General health condition : Forest Acres:
62.5%State:
55.6%
Average condition of hearing : This city:
80.4%State:
79.9%
More about Health and Nutrition of Forest Acres, SC Residents
Local government employment and payroll (March 2022)
Function
Full-time employees
Monthly full-time payroll
Average yearly full-time wage
Part-time employees
Monthly part-time payroll
Police Protection - Officers
25 $128,834 $61,840 0 $0 Solid Waste Management
19 $56,763 $35,850 0 $0 Police - Other
8 $31,445 $47,168 0 $0 Other Government Administration
6 $35,012 $70,024 1 $485 Parks and Recreation
2 $6,714 $40,284 0 $0 Financial Administration
2 $12,844 $77,064 0 $0 Judicial and Legal
2 $8,657 $51,942 1 $1,363 Welfare
1 $4,982 $59,784 0 $0
Totals for Government
65 $285,252 $52,662 2 $1,848
Forest Acres government finances - Expenditure in 2018 (per resident):
Current Operations - Police Protection: $2,531,000 ($243.30)
Solid Waste Management: $1,333,000 ($128.14)General - Other: $1,143,000 ($109.87)Central Staff Services: $780,000 ($74.98)Judicial and Legal Services: $280,000 ($26.92)Financial Administration: $239,000 ($22.97)Parks and Recreation: $197,000 ($18.94)General Public Buildings: $94,000 ($9.04)General - Interest on Debt: $8,000 ($0.77)
Other Capital Outlay - Solid Waste Management: $177,000 ($17.01)
Police Protection: $112,000 ($10.77)Total Salaries and Wages: $3,128,000 ($300.68)
Forest Acres government finances - Revenue in 2018 (per resident):
Charges - Other: $7,000 ($0.67)
Miscellaneous - Fines and Forfeits: $202,000 ($19.42)
Interest Earnings: $93,000 ($8.94)General Revenue - Other: $50,000 ($4.81)Rents: $48,000 ($4.61)Sale of Property: $2,000 ($0.19)State Intergovernmental - General Local Government Support: $234,000 ($22.49)
Other: $34,000 ($3.27)Tax - Occupation and Business License - Other: $2,319,000 ($222.92)
General Sales and Gross Receipts: $1,550,000 ($149.00)Property: $1,448,000 ($139.19)Public Utility License: $1,032,000 ($99.20)Other Selective Sales: $955,000 ($91.80)Other License: $392,000 ($37.68)Alcoholic Beverage License: $20,000 ($1.92)
Forest Acres government finances - Cash and Securities in 2018 (per resident):
Other Funds - Cash and Securities: $10,436,000 ($1003.17)
9.04% of this county's 2021 resident taxpayers lived in other counties in 2020 ($52,630 average adjusted gross income )
Here:
9.04%South Carolina average:
8.89%
0.11% of residents moved from foreign countries ($735 average AGI )Richland County:
0.11%South Carolina average:
0.04%
Top counties from which taxpayers relocated into this county between 2020 and 2021:
9.17% of this county's 2020 resident taxpayers moved to other counties in 2021 ($60,065 average adjusted gross income )
Here:
9.17%South Carolina average:
7.46%
0.07% of residents moved to foreign countries ($494 average AGI )Richland County:
0.07%South Carolina average:
0.03%
Top counties to which taxpayers relocated from this county between 2020 and 2021: Businesses in Forest Acres, SC
Strongest AM radio stations in Forest Acres:
WBAJ (890 AM; daytime; 50 kW; BLYTHEWOOD, SC; Owner: FAMILY FIRST)
WCEO (840 AM; daytime; 50 kW; COLUMBIA, SC; Owner: EASTERN BROADCASTING GROUP, INC.)
WQXL (1470 AM; 5 kW; COLUMBIA, SC; Owner: METRO COMMUNICATIONS, INCORP.)
WISW (1320 AM; 5 kW; COLUMBIA, SC; Owner: CITADEL BROADCASTING COMPANY)
WVOC (560 AM; 5 kW; COLUMBIA, SC; Owner: CAPSTAR TX LIMITED PARTNERSHIP)
WCOS (1400 AM; 1 kW; COLUMBIA, SC; Owner: CAPSTAR TX LIMITED PARTNERSHIP)
WGCV (620 AM; 1 kW; CAYCE, SC; Owner: GLORY COMMUNICATIONS, INC.)
WOIC (1230 AM; 1 kW; COLUMBIA, SC; Owner: URBAN RADIO OF SOUTH CAROLINA, LLC)
WLGO (1170 AM; daytime; 10 kW; LEXINGTON, SC; Owner: LEVAS COMMUNICATIONS, LLC)
WAGL (1560 AM; daytime; 50 kW; LANCASTER, SC; Owner: PALMETTO BROADCASTING SYSTEM, INC.)
WBCU (1460 AM; 50 kW; UNION, SC)
WBT (1110 AM; 50 kW; CHARLOTTE, NC; Owner: JEFFERSON-PILOT COMMUNICATNS CO. OF NORTH CAROLINA)
WLFJ (660 AM; daytime; 50 kW; GREENVILLE, SC; Owner: CLEAR CHANNEL BROADCASTING LICENSES, INC.)
Strongest FM radio stations in Forest Acres:
WARQ (93.5 FM; COLUMBIA, SC; Owner: URBAN RADIO OF SOUTH CAROLINA, LLC)
W240AX (95.9 FM; COLUMBIA, SC; Owner: BIBLE BROADCASTING NETWORK, INC.)
WMHK (89.7 FM; COLUMBIA, SC; Owner: COLUMBIA BIBLE COLLEGE B/CING CO.)
WOMG (103.1 FM; COLUMBIA, SC; Owner: CITADEL BROADCASTING COMPANY)
WLTY (96.7 FM; CAYCE, SC; Owner: CAPSTAR TX LIMITED PARTNERSHIP)
WLTR (91.3 FM; COLUMBIA, SC; Owner: SOUTH CAROLINA EDUCATIONAL TV COMMISSION)
WNOK (104.7 FM; COLUMBIA, SC; Owner: CAPSTAR TX LIMITED PARTNERSHIP)
WCOS-FM (97.5 FM; COLUMBIA, SC; Owner: CAPSTAR TX LIMITED PARTNERSHIP)
WUSC-FM (90.5 FM; COLUMBIA, SC; Owner: THE UNIVERSITY OF SOUTH CAROLINA)
WWDM (101.3 FM; SUMTER, SC; Owner: URBAN RADIO OF SOUTH CAROLINA, LLC)
WXBT (100.1 FM; WEST COLUMBIA, SC; Owner: CAPSTAR TX LIMITED PARTNERSHIP)
W207BQ (89.3 FM; COLUMBIA, SC; Owner: CALVARY CHAPEL OF TWIN FALLS, INC.)
WMFX (102.3 FM; ST. ANDREWS, SC; Owner: URBAN RADIO OF SOUTH CAROLINA, LLC)
WTCB (106.7 FM; ORANGEBURG, SC; Owner: CITADEL BROADCASTING COMPANY)
WFMV (95.3 FM; SOUTH CONGAREE, SC; Owner: GLORY COMMUNICATIONS, INC.)
WRJA-FM (88.1 FM; SUMTER, SC; Owner: SOUTH CAROLINA EDUCATIONAL TV COMMISSION)
WZMJ (93.1 FM; BATESBURG, SC; Owner: URBAN RADIO OF SOUTH CAROLINA, LLC)
WLXC (98.5 FM; LEXINGTON, SC; Owner: CITADEL BROADCASTING COMPANY)
WHXT (103.9 FM; ORANGEBURG, SC; Owner: URBAN RADIO OF SOUTH CAROLINA, LLC)
WYFV (88.7 FM; CAYCE, SC; Owner: BIBLE BROADCASTING NETWORK, INC.)
TV broadcast stations around Forest Acres:
W21CA (Channel 21; COLUMBIA, SC; Owner: DOVE BROADCASTING, INC.)
WRLK-TV (Channel 35; COLUMBIA, SC; Owner: SOUTH CAROLINA EDUCATIONAL TV COMMISSION)
WLTX (Channel 19; COLUMBIA, SC; Owner: PACIFIC AND SOUTHERN COMPANY, INC.)
WOLO-TV (Channel 25; COLUMBIA, SC; Owner: SOUTH CAROLINA BROADCASTING PARTNERS)
WACH (Channel 57; COLUMBIA, SC; Owner: RAYCOM AMERICA, INC.)
WIS (Channel 10; COLUMBIA, SC; Owner: LIBCO, INC.)
WBHQ (Channel 63; SUMTER, SC; Owner: COLUMBIA BROADCASTING, INC.)
W39CL (Channel 39; COLUMBIA, SC; Owner: NATIONAL MINORITY T.V., INC.)
W31BS (Channel 31; ORANGEBURG, SC; Owner: DOVE BROADCASTING INC.)
WRJA-TV (Channel 27; SUMTER, SC; Owner: SOUTH CAROLINA EDUCATIONAL TV COMMISSION)
W67DP (Channel 67; COLUMBIA, SC; Owner: DOVE BROADCASTING, INC.)
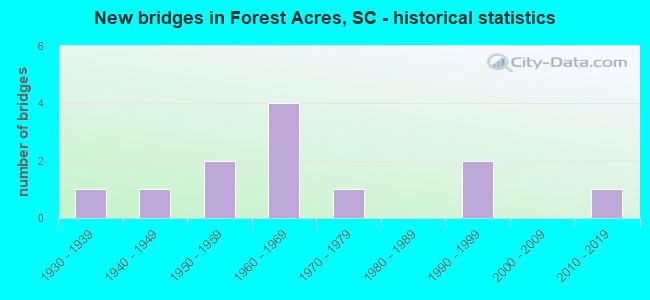
National Bridge Inventory (NBI) Statistics 12 Number of bridges98ft / 30.2m Total length $1,492,000 Total costs180,150 Total average daily traffic9,155 Total average daily truck traffic
New bridges - historical statistics
1 1930-1939 1 1940-1949 2 1950-1959 4 1960-1969 1 1970-1979 2 1990-1999 1 2010-2019
See full National Bridge Inventory statistics for Forest Acres, SC
FCC Registered Antenna Towers: 36 (
See the full list of FCC Registered Antenna Towers in Forest Acres )
FCC Registered Microwave Towers: 12 (
See the full list of FCC Registered Microwave Towers in this town )
FCC Registered Paging Towers: 1 (
See the full list of FCC Registered Paging Towers )
FCC Registered Amateur Radio Licenses: 2
Call Sign: KG4KGL, Licensee ID: L00295911, Grant Date: 11/13/2020, Expiration Date: 11/02/2030, Certifier: Robert S Jenkins, Registrant: Robert S Jenkins, 6413 Bridgewoood Road, Forest Acres, SC 29206Call Sign: KJ4ABJ, Licensee ID: L01334706, Grant Date: 10/06/2017, Expiration Date: 10/22/2027, Certifier: Michael J Conroy, Registrant: Michael J Conroy, 4421 Briarwood Rd, Forest Acres, SC 29206
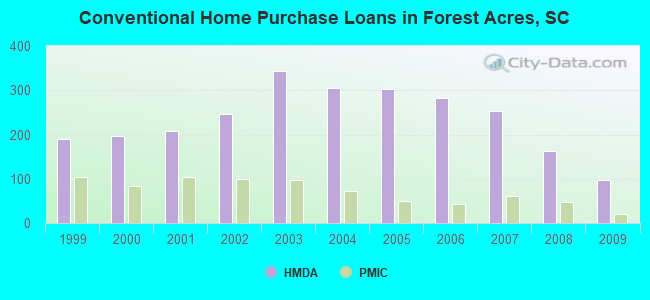
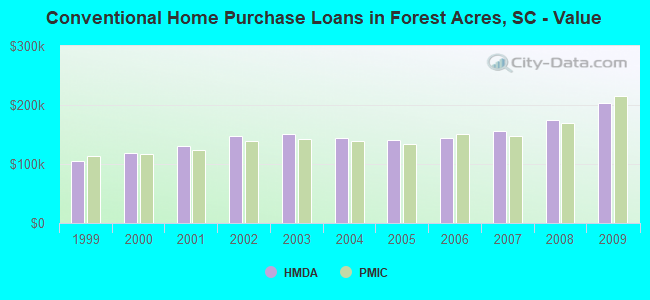
Home Mortgage Disclosure Act Aggregated Statistics For Year 2009(Based on 6 partial tracts) A) FHA, FSA/RHS & VA B) Conventional C) Refinancings D) Home Improvement Loans E) Loans on Dwellings For 5+ Families F) Non-occupant Loans on Number Average Value Number Average Value Number Average Value Number Average Value Number Average Value Number Average Value
LOANS ORIGINATED 64 $145,776 97 $202,747 398 $194,186 14 $205,198 1 $5,098,510 25 $164,749 APPLICATIONS APPROVED, NOT ACCEPTED 2 $154,220 3 $145,560 29 $176,739 3 $131,627 0 $0 1 $119,090 APPLICATIONS DENIED 11 $161,133 11 $122,045 85 $173,144 4 $190,160 0 $0 5 $107,926 APPLICATIONS WITHDRAWN 4 $122,375 11 $205,832 66 $193,708 1 $375,820 0 $0 2 $71,990 FILES CLOSED FOR INCOMPLETENESS 1 $161,520 3 $143,023 14 $241,888 0 $0 0 $0 0 $0
Aggregated Statistics For Year 2008(Based on 6 partial tracts) A) FHA, FSA/RHS & VA B) Conventional C) Refinancings D) Home Improvement Loans E) Loans on Dwellings For 5+ Families F) Non-occupant Loans on G) Loans On Manufactured Number Average Value Number Average Value Number Average Value Number Average Value Number Average Value Number Average Value Number Average Value
LOANS ORIGINATED 27 $165,609 162 $175,039 218 $185,402 10 $83,150 2 $843,510 41 $139,530 0 $0 APPLICATIONS APPROVED, NOT ACCEPTED 1 $99,760 11 $171,743 29 $155,313 4 $75,970 0 $0 3 $141,560 0 $0 APPLICATIONS DENIED 8 $142,885 16 $131,995 66 $162,602 11 $55,081 0 $0 6 $89,820 1 $27,940 APPLICATIONS WITHDRAWN 3 $178,680 8 $253,884 29 $177,355 4 $170,258 0 $0 5 $139,878 0 $0 FILES CLOSED FOR INCOMPLETENESS 1 $125,460 7 $147,399 13 $210,333 0 $0 0 $0 0 $0 0 $0
Aggregated Statistics For Year 2007(Based on 6 partial tracts) A) FHA, FSA/RHS & VA B) Conventional C) Refinancings D) Home Improvement Loans F) Non-occupant Loans on Number Average Value Number Average Value Number Average Value Number Average Value Number Average Value
LOANS ORIGINATED 4 $123,835 252 $155,154 192 $185,917 22 $55,289 55 $117,197 APPLICATIONS APPROVED, NOT ACCEPTED 1 $152,340 36 $139,287 29 $128,106 5 $50,646 3 $171,463 APPLICATIONS DENIED 1 $149,550 32 $160,178 105 $145,182 23 $52,854 8 $96,770 APPLICATIONS WITHDRAWN 1 $144,560 27 $186,946 40 $168,063 4 $58,445 7 $87,701 FILES CLOSED FOR INCOMPLETENESS 0 $0 4 $224,650 10 $158,890 0 $0 0 $0
Aggregated Statistics For Year 2006(Based on 6 partial tracts) A) FHA, FSA/RHS & VA B) Conventional C) Refinancings D) Home Improvement Loans E) Loans on Dwellings For 5+ Families F) Non-occupant Loans on G) Loans On Manufactured Number Average Value Number Average Value Number Average Value Number Average Value Number Average Value Number Average Value Number Average Value
LOANS ORIGINATED 15 $137,509 282 $143,440 191 $165,398 19 $68,577 1 $601,440 56 $98,011 1 $7,330 APPLICATIONS APPROVED, NOT ACCEPTED 0 $0 44 $124,984 33 $134,373 4 $54,805 0 $0 5 $75,154 2 $39,850 APPLICATIONS DENIED 2 $108,330 39 $117,110 117 $130,059 25 $77,358 0 $0 19 $73,183 3 $38,993 APPLICATIONS WITHDRAWN 1 $62,350 25 $153,014 55 $131,420 2 $118,775 0 $0 4 $110,698 0 $0 FILES CLOSED FOR INCOMPLETENESS 0 $0 3 $164,727 16 $157,908 0 $0 0 $0 0 $0 0 $0
Aggregated Statistics For Year 2005(Based on 6 partial tracts) A) FHA, FSA/RHS & VA B) Conventional C) Refinancings D) Home Improvement Loans F) Non-occupant Loans on G) Loans On Manufactured Number Average Value Number Average Value Number Average Value Number Average Value Number Average Value Number Average Value
LOANS ORIGINATED 14 $126,494 302 $140,872 246 $157,492 24 $96,130 63 $106,720 0 $0 APPLICATIONS APPROVED, NOT ACCEPTED 0 $0 32 $115,754 31 $127,134 5 $127,730 5 $73,684 1 $15,880 APPLICATIONS DENIED 2 $102,335 43 $130,764 112 $131,243 17 $51,315 14 $89,254 1 $50,960 APPLICATIONS WITHDRAWN 2 $127,665 22 $123,326 72 $150,990 8 $192,710 6 $160,625 0 $0 FILES CLOSED FOR INCOMPLETENESS 0 $0 9 $129,733 32 $161,781 3 $23,833 1 $146,750 0 $0
Aggregated Statistics For Year 2004(Based on 6 partial tracts) A) FHA, FSA/RHS & VA B) Conventional C) Refinancings D) Home Improvement Loans E) Loans on Dwellings For 5+ Families F) Non-occupant Loans on G) Loans On Manufactured Number Average Value Number Average Value Number Average Value Number Average Value Number Average Value Number Average Value Number Average Value
LOANS ORIGINATED 15 $136,307 306 $144,291 276 $144,628 20 $69,460 1 $5,273,190 69 $112,285 1 $43,350 APPLICATIONS APPROVED, NOT ACCEPTED 0 $0 22 $144,308 41 $124,311 4 $121,582 0 $0 8 $77,054 1 $17,830 APPLICATIONS DENIED 2 $118,025 37 $101,993 102 $115,884 20 $44,219 0 $0 9 $92,733 4 $53,232 APPLICATIONS WITHDRAWN 1 $106,440 25 $147,313 63 $149,094 6 $69,820 0 $0 4 $113,240 0 $0 FILES CLOSED FOR INCOMPLETENESS 0 $0 5 $135,256 27 $148,464 3 $144,600 0 $0 2 $75,715 0 $0
Aggregated Statistics For Year 2003(Based on 6 partial tracts) A) FHA, FSA/RHS & VA B) Conventional C) Refinancings D) Home Improvement Loans F) Non-occupant Loans on Number Average Value Number Average Value Number Average Value Number Average Value Number Average Value
LOANS ORIGINATED 19 $117,323 344 $150,686 722 $134,053 23 $63,756 62 $88,501 APPLICATIONS APPROVED, NOT ACCEPTED 1 $210,610 14 $136,077 58 $114,240 2 $41,610 8 $94,465 APPLICATIONS DENIED 1 $155,980 24 $114,248 141 $121,823 9 $59,469 7 $77,591 APPLICATIONS WITHDRAWN 3 $142,047 24 $129,926 79 $125,838 3 $74,607 5 $111,470 FILES CLOSED FOR INCOMPLETENESS 0 $0 3 $133,110 27 $149,157 2 $16,755 1 $788,910
Aggregated Statistics For Year 2002(Based on 6 partial tracts) A) FHA, FSA/RHS & VA B) Conventional C) Refinancings D) Home Improvement Loans E) Loans on Dwellings For 5+ Families F) Non-occupant Loans on Number Average Value Number Average Value Number Average Value Number Average Value Number Average Value Number Average Value
LOANS ORIGINATED 12 $121,698 247 $146,883 446 $134,387 27 $47,072 1 $3,708,280 72 $108,468 APPLICATIONS APPROVED, NOT ACCEPTED 0 $0 16 $91,489 45 $107,682 7 $77,409 0 $0 4 $75,388 APPLICATIONS DENIED 1 $68,390 32 $88,664 110 $96,751 13 $17,322 0 $0 11 $74,982 APPLICATIONS WITHDRAWN 2 $108,975 26 $137,277 66 $124,839 5 $51,846 0 $0 5 $82,710 FILES CLOSED FOR INCOMPLETENESS 0 $0 2 $85,660 17 $122,546 0 $0 0 $0 2 $112,995
Aggregated Statistics For Year 2001(Based on 6 partial tracts) A) FHA, FSA/RHS & VA B) Conventional C) Refinancings D) Home Improvement Loans F) Non-occupant Loans on Number Average Value Number Average Value Number Average Value Number Average Value Number Average Value
LOANS ORIGINATED 21 $109,170 209 $129,770 359 $130,220 20 $28,206 48 $81,881 APPLICATIONS APPROVED, NOT ACCEPTED 0 $0 14 $101,374 31 $100,997 4 $45,582 4 $83,720 APPLICATIONS DENIED 1 $57,690 34 $84,222 101 $91,954 16 $24,236 6 $86,467 APPLICATIONS WITHDRAWN 2 $77,720 26 $112,245 67 $110,907 4 $33,072 4 $115,680 FILES CLOSED FOR INCOMPLETENESS 0 $0 2 $46,325 19 $108,554 2 $19,785 1 $25,650
Aggregated Statistics For Year 2000(Based on 6 partial tracts) A) FHA, FSA/RHS & VA B) Conventional C) Refinancings D) Home Improvement Loans F) Non-occupant Loans on Number Average Value Number Average Value Number Average Value Number Average Value Number Average Value
LOANS ORIGINATED 23 $96,033 196 $119,260 102 $101,721 18 $24,167 16 $53,610 APPLICATIONS APPROVED, NOT ACCEPTED 4 $100,902 13 $79,581 30 $177,238 6 $68,928 1 $141,210 APPLICATIONS DENIED 6 $62,348 40 $79,370 73 $79,853 10 $18,288 5 $110,030 APPLICATIONS WITHDRAWN 1 $136,430 18 $137,459 33 $72,336 2 $32,160 3 $42,417 FILES CLOSED FOR INCOMPLETENESS 1 $57,990 5 $112,950 12 $73,639 0 $0 1 $26,260
Aggregated Statistics For Year 1999(Based on 6 partial tracts) A) FHA, FSA/RHS & VA B) Conventional C) Refinancings D) Home Improvement Loans F) Non-occupant Loans on Number Average Value Number Average Value Number Average Value Number Average Value Number Average Value
LOANS ORIGINATED 30 $91,754 190 $104,794 217 $97,734 26 $20,150 22 $97,658 APPLICATIONS APPROVED, NOT ACCEPTED 3 $74,897 18 $98,931 42 $88,675 7 $15,104 3 $120,377 APPLICATIONS DENIED 2 $54,100 57 $60,273 84 $78,214 13 $24,892 4 $60,775 APPLICATIONS WITHDRAWN 2 $86,530 10 $89,582 48 $83,061 4 $80,932 2 $49,940 FILES CLOSED FOR INCOMPLETENESS 1 $71,040 4 $208,852 11 $88,814 0 $0 0 $0
Detailed HMDA statistics for the following Tracts:
0012.00
, 0111.01 , 0111.02 , 0112.01 , 0112.02 , 0113.01
Private Mortgage Insurance Companies Aggregated Statistics For Year 2009(Based on 6 partial tracts) A) Conventional B) Refinancings C) Non-occupant Loans on Number Average Value Number Average Value Number Average Value
LOANS ORIGINATED 21 $215,556 16 $177,192 0 $0 APPLICATIONS APPROVED, NOT ACCEPTED 2 $85,660 4 $257,560 2 $101,650 APPLICATIONS DENIED 2 $119,540 2 $182,090 0 $0 APPLICATIONS WITHDRAWN 1 $80,430 0 $0 0 $0 FILES CLOSED FOR INCOMPLETENESS 1 $107,420 0 $0 0 $0
Aggregated Statistics For Year 2008(Based on 6 partial tracts) A) Conventional B) Refinancings C) Non-occupant Loans on Number Average Value Number Average Value Number Average Value
LOANS ORIGINATED 48 $169,863 22 $199,384 7 $134,597 APPLICATIONS APPROVED, NOT ACCEPTED 10 $146,257 3 $219,687 0 $0 APPLICATIONS DENIED 1 $169,900 0 $0 0 $0 APPLICATIONS WITHDRAWN 3 $136,363 2 $195,600 1 $66,330 FILES CLOSED FOR INCOMPLETENESS 2 $135,420 0 $0 1 $208,880
Aggregated Statistics For Year 2007(Based on 6 partial tracts) A) Conventional B) Refinancings C) Non-occupant Loans on Number Average Value Number Average Value Number Average Value
LOANS ORIGINATED 62 $148,286 23 $208,385 10 $108,190 APPLICATIONS APPROVED, NOT ACCEPTED 10 $176,485 6 $236,995 1 $39,080 APPLICATIONS DENIED 2 $85,700 1 $91,030 1 $128,920 APPLICATIONS WITHDRAWN 2 $187,355 1 $112,230 1 $104,750 FILES CLOSED FOR INCOMPLETENESS 0 $0 0 $0 0 $0
Aggregated Statistics For Year 2006(Based on 6 partial tracts) A) Conventional B) Refinancings C) Non-occupant Loans on Number Average Value Number Average Value Number Average Value
LOANS ORIGINATED 43 $151,472 19 $188,201 9 $95,020 APPLICATIONS APPROVED, NOT ACCEPTED 4 $280,000 3 $148,490 2 $286,915 APPLICATIONS DENIED 1 $70,220 1 $207,600 0 $0 APPLICATIONS WITHDRAWN 0 $0 2 $114,675 0 $0 FILES CLOSED FOR INCOMPLETENESS 0 $0 0 $0 0 $0
Aggregated Statistics For Year 2005(Based on 6 partial tracts) A) Conventional B) Refinancings C) Non-occupant Loans on Number Average Value Number Average Value Number Average Value
LOANS ORIGINATED 49 $133,101 23 $145,491 11 $97,731 APPLICATIONS APPROVED, NOT ACCEPTED 5 $142,780 11 $188,127 1 $206,890 APPLICATIONS DENIED 2 $87,670 0 $0 1 $104,560 APPLICATIONS WITHDRAWN 4 $187,062 1 $141,280 1 $127,260 FILES CLOSED FOR INCOMPLETENESS 2 $119,145 0 $0 1 $101,270
Aggregated Statistics For Year 2004(Based on 6 partial tracts) A) Conventional B) Refinancings C) Non-occupant Loans on Number Average Value Number Average Value Number Average Value
LOANS ORIGINATED 72 $138,576 28 $146,804 9 $108,798 APPLICATIONS APPROVED, NOT ACCEPTED 10 $142,240 14 $128,354 2 $114,555 APPLICATIONS DENIED 2 $104,970 1 $145,910 1 $145,910 APPLICATIONS WITHDRAWN 6 $138,688 3 $173,833 1 $78,550 FILES CLOSED FOR INCOMPLETENESS 0 $0 1 $94,140 0 $0
Aggregated Statistics For Year 2003(Based on 6 partial tracts) A) Conventional B) Refinancings C) Non-occupant Loans on Number Average Value Number Average Value Number Average Value
LOANS ORIGINATED 98 $142,486 103 $139,769 8 $78,411 APPLICATIONS APPROVED, NOT ACCEPTED 8 $143,449 20 $127,992 0 $0 APPLICATIONS DENIED 4 $138,202 1 $58,620 0 $0 APPLICATIONS WITHDRAWN 7 $86,700 6 $105,988 2 $64,635 FILES CLOSED FOR INCOMPLETENESS 0 $0 0 $0 0 $0
Aggregated Statistics For Year 2002(Based on 6 partial tracts) A) Conventional B) Refinancings C) Non-occupant Loans on Number Average Value Number Average Value Number Average Value
LOANS ORIGINATED 99 $138,668 78 $142,182 6 $114,573 APPLICATIONS APPROVED, NOT ACCEPTED 7 $119,579 15 $139,620 1 $100,520 APPLICATIONS DENIED 2 $111,525 0 $0 0 $0 APPLICATIONS WITHDRAWN 7 $137,584 7 $132,903 2 $93,075 FILES CLOSED FOR INCOMPLETENESS 0 $0 1 $74,820 1 $74,820
Aggregated Statistics For Year 2001(Based on 6 partial tracts) A) Conventional B) Refinancings C) Non-occupant Loans on Number Average Value Number Average Value Number Average Value
LOANS ORIGINATED 104 $124,105 66 $128,408 7 $114,006 APPLICATIONS APPROVED, NOT ACCEPTED 12 $131,407 7 $121,163 0 $0 APPLICATIONS DENIED 1 $79,320 3 $85,397 1 $79,320 APPLICATIONS WITHDRAWN 3 $105,133 2 $150,920 0 $0 FILES CLOSED FOR INCOMPLETENESS 1 $72,660 1 $70,460 0 $0
Aggregated Statistics For Year 2000(Based on 6 partial tracts) A) Conventional B) Refinancings C) Non-occupant Loans on Number Average Value Number Average Value Number Average Value
LOANS ORIGINATED 83 $117,660 10 $141,469 4 $60,808 APPLICATIONS APPROVED, NOT ACCEPTED 7 $108,454 2 $64,925 0 $0 APPLICATIONS DENIED 2 $106,720 2 $118,600 2 $63,730 APPLICATIONS WITHDRAWN 7 $100,761 0 $0 0 $0 FILES CLOSED FOR INCOMPLETENESS 0 $0 1 $116,590 0 $0
Aggregated Statistics For Year 1999(Based on 6 partial tracts) A) Conventional B) Refinancings C) Non-occupant Loans on Number Average Value Number Average Value Number Average Value
LOANS ORIGINATED 104 $112,783 29 $111,526 2 $80,075 APPLICATIONS APPROVED, NOT ACCEPTED 4 $112,002 5 $120,978 0 $0 APPLICATIONS DENIED 3 $90,593 2 $106,730 0 $0 APPLICATIONS WITHDRAWN 2 $151,465 1 $44,930 0 $0 FILES CLOSED FOR INCOMPLETENESS 0 $0 1 $71,650 0 $0
Detailed PMIC statistics for the following Tracts:
0012.00
, 0111.01 , 0111.02 , 0112.01 , 0112.02 , 0113.01 Forest Acres compared to South Carolina state average:
Unemployed percentage significantly below state average. Black race population percentage below state average. Hispanic race population percentage significantly below state average. Median age above state average. Length of stay since moving in significantly above state average. House age above state average. Percentage of population with a bachelor's degree or higher significantly above state average. Forest Acres on our top lists :
#27 on the list of "Top 101 cities with largest percentage of females in occupations: legal occupations (population 5,000+)"
#43 on the list of "Top 101 cities with the largest percentage of people in homes for abused, dependent, and neglected children (population 1,000+)"
#29 (29206) on the list of "Top 101 zip codes with the largest percentage of Scotch-Irish first ancestries (pop 5,000+)"
#3 on the list of "Top 101 counties with the lowest lead air pollution readings in 2012 (µg/m3 )"
#10 on the list of "Top 101 counties with the lowest Ozone (1-hour) air pollution readings in 2012 (ppm)"
#25 on the list of "Top 101 counties with the highest lead air pollution readings in 2012 (µg/m3 )"
#28 on the list of "Top 101 counties with the lowest Sulfur Oxides Annual air pollution readings in 2012 (µg/m3 )"
#32 on the list of "Top 101 counties with the most Black Protestant adherents"


 Recent articles from our blog. Our writers, many of them Ph.D. graduates or candidates, create easy-to-read articles on a wide variety of topics.

 (2.9 miles