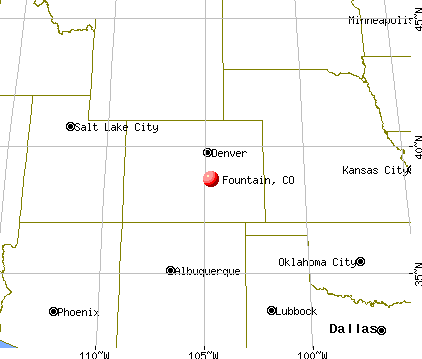
Fountain, Colorado
Fountain: Pike's Peak from Fountain Creek Regional Park
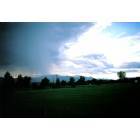
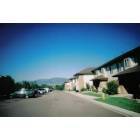
Fountain: Beautiful Fountain, CO
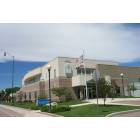
Fountain: Fire Department
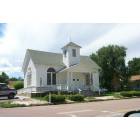
Fountain: Baptist Church
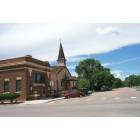
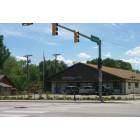
Fountain: Downtown
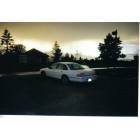
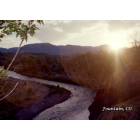
Fountain: sunset at fountain park
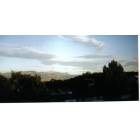
Fountain: Pikes Peak-From Fountain, Colorado
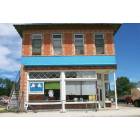
Fountain: Downtown
Fountain: Cheyenne Mountains from Fountain Ridge Apartments
Fountain: Beautiful Fountain, CO
Fountain: Post Office
- see
44
more - add
your
Submit your own pictures of this city and show them to the world
- OSM Map
- General Map
- Google Map
- MSN Map
Population change since 2000: +90.2%
| Males: 14,580 | |
| Females: 14,327 |
| Median resident age: | 30.8 years |
| Colorado median age: | 37.7 years |
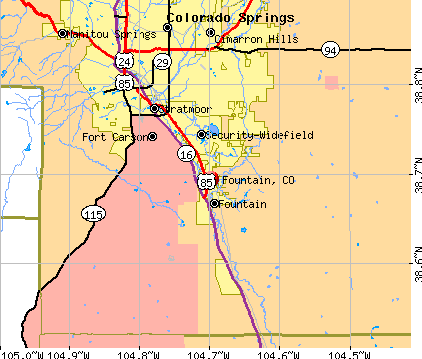
Zip codes: 80817, 80928, 81008.
Fountain Zip Code Map| Fountain: | $79,963 |
| CO: | $89,302 |
Estimated per capita income in 2022: $33,204 (it was $15,975 in 2000)
Fountain city income, earnings, and wages data
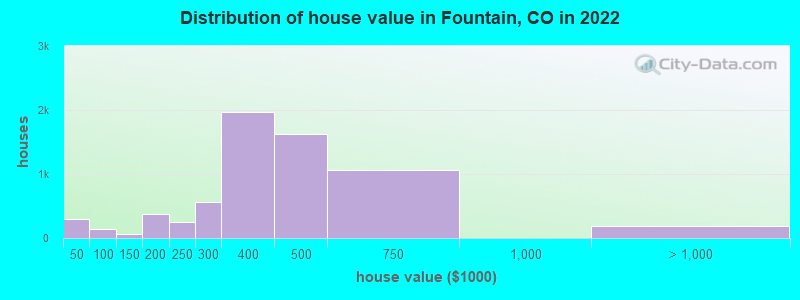
Estimated median house or condo value in 2022: $401,878 (it was $113,900 in 2000)
| Fountain: | $401,878 |
| CO: | $531,100 |
Mean prices in 2022: all housing units: $503,275; detached houses: $535,696; townhouses or other attached units: $381,161; in 2-unit structures: $406,006; in 3-to-4-unit structures: $554,292; in 5-or-more-unit structures: $266,423; mobile homes: $79,761; occupied boats, rvs, vans, etc.: $4,596
Median gross rent in 2022: $1,714.
(5.6% for White Non-Hispanic residents, 12.4% for Black residents, 12.0% for Hispanic or Latino residents, 27.6% for American Indian residents, 3.0% for other race residents, 10.7% for two or more races residents)
Detailed information about poverty and poor residents in Fountain, CO

Compare current foreclosures in Fountain, CO:
| Photo | Address | Area | Beds / Baths | Price | Details |
|---|---|---|---|---|---|

|
#1
Liberty Ct
Fountain, CO 80817
|
2,225 sq. feet
|
2 baths 5 beds |
show details | |

|
#2
Linda Mood Dr
Fountain, CO 80817
|
1,146 sq. feet
|
1 baths 3 beds |
show details | |

|
#3
Daffodil St
Fountain, CO 80817
|
1,992 sq. feet
|
2 baths 3 beds |
show details | |

|
#4
Araia Dr
Fountain, CO 80817
|
1,504 sq. feet
|
3 baths 3 beds |
show details | |

|
#5
Fountain Mesa Rd
Fountain, CO 80817
|
1,288 sq. feet
|
2 baths 3 beds |
show details | |

|
#6
Brook Valley Dr
Fountain, CO 80817
|
2,501 sq. feet
|
4 baths 4 beds |
show details | |

|
#7
Southmoor Dr
Fountain, CO 80817
|
1,478 sq. feet
|
3 baths 3 beds |
show details | |

|
#8
La Plano Pt
Fountain, CO 80817
|
1,848 sq. feet
|
2 baths 3 beds |
show details | |

|
#9
Campground Dr
Fountain, CO 80817
|
2,560 sq. feet
|
2 baths 3 beds |
show details | |

|
#10
Indian Village Hts
Fountain, CO 80817
|
2,014 sq. feet
|
2 baths 4 beds |
show details |
| Photo | Address | Area | Beds / Baths | Price | Details |
|---|---|---|---|---|---|

|
#11
Rye Ridge Rd
Fountain, CO 80817
|
1,538 sq. feet
|
2 baths 3 beds |
show details | |

|
#12
Cherry Cir
Fountain, CO 80817
|
1,134 sq. feet
|
1 baths 3 beds |
show details | |

|
#13
Dobbs Dr
Fountain, CO 80817
|
1,624 sq. feet
|
2 baths 4 beds |
show details | |

|
#14
Hayloft Ln
Fountain, CO 80817
|
2,308 sq. feet
|
3 baths 4 beds |
show details | |

|
#15
Falling Star Rd
Fountain, CO 80817
|
2,228 sq. feet
|
3 baths 4 beds |
show details | |

|
#16
Medicine Bow Ave
Fountain, CO 80817
|
1,809 sq. feet
|
2 baths 3 beds |
show details | |

|
#17
R E A Rd
Fountain, CO 80817
|
2,276 sq. feet
|
1 baths 4 beds |
show details | |

|
#18
Mount View Ln
Fountain, CO 80817
|
960 sq. feet
|
1 baths 2 beds |
show details | |

|
#19
Daffodil St
Fountain, CO 80817
|
1,251 sq. feet
|
2 baths 3 beds |
show details | |

|
#20
Sandy Springs Pt
Fountain, CO 80817
|
1,486 sq. feet
|
2 baths 2 beds |
show details |
| Photo | Address | Area | Beds / Baths | Price | Details |
|---|---|---|---|---|---|

|
#21
Ancestra Dr
Fountain, CO 80817
|
2,484 sq. feet
|
3 baths 4 beds |
show details | |

|
#22
Mount View Ln
Fountain, CO 80817
|
960 sq. feet
|
1 baths 2 beds |
show details | |

|
#23
Cherry Cir
Fountain, CO 80817
|
1,134 sq. feet
|
1 baths 3 beds |
show details | |

|
#24
Calle Fontana
Fountain, CO 80817
|
1,707 sq. feet
|
2 baths 4 beds |
show details | |

|
#25
N Walnut St
Fountain, CO 80817
|
3,797 sq. feet
|
2 baths 5 beds |
show details | |

|
#26
Diamond E Rd
Fountain, CO 80817
|
1,110 sq. feet
|
1 baths 3 beds |
show details | |

|
#27
Wells Pt
Fountain, CO 80817
|
1,306 sq. feet
|
2 baths 2 beds |
show details | |

|
#28
Medicine Bow Ave
Fountain, CO 80817
|
3,129 sq. feet
|
3 baths 4 beds |
show details | |

|
#29
Fountain Mesa Rd
Fountain, CO 80817
|
1,288 sq. feet
|
2 baths 3 beds |
show details | |

|
#30
Colonial Dr
Fountain, CO 80817
|
928 sq. feet
|
1 baths 3 beds |
show details |
| Photo | Address | Area | Beds / Baths | Price | Details |
|---|---|---|---|---|---|

|
#31
Double D Rd
Fountain, CO 80817
|
1,676 sq. feet
|
2 baths 3 beds |
show details | |

|
#32
Cormorant Dr
Fountain, CO 80817
|
1,514 sq. feet
|
2 baths 3 beds |
show details | |

|
#33
Bromefield Dr
Fountain, CO 80817
|
1,991 sq. feet
|
2 baths 4 beds |
show details | |

|
#34
Barn Owl Dr
Fountain, CO 80817
|
1,240 sq. feet
|
2 baths 3 beds |
show details | |

|
#35
Legend Oak Dr
Fountain, CO 80817
|
1,448 sq. feet
|
2 baths 3 beds |
show details | |

|
#36
Blossom Field Rd
Fountain, CO 80817
|
1,140 sq. feet
|
1 baths 3 beds |
show details | |

|
#37
Calle Corona
Fountain, CO 80817
|
1,005 sq. feet
|
1 baths 3 beds |
show details | |

|
#38
Lords Hill Dr
Fountain, CO 80817
|
1,304 sq. feet
|
2 baths 3 beds |
show details | |

|
#39
Outback Vw
Fountain, CO 80817
|
1,280 sq. feet
|
2 baths 3 beds |
show details | |

|
#40
Outback Vw
Fountain, CO 80817
|
1,280 sq. feet
|
2 baths 3 beds |
show details |
| Photo | Address | Area | Beds / Baths | Price | Details |
|---|---|---|---|---|---|

|
#41
Yearling Ct
Fountain, CO 80817
|
1,592 sq. feet
|
2 baths 3 beds |
show details | |

|
#42
Via Duran Pt
Fountain, CO 80817
|
1,904 sq. feet
|
2 baths 4 beds |
show details | |

|
#43
R E A Rd
Fountain, CO 80817
|
2,276 sq. feet
|
1 baths 4 beds |
show details | |

|
#44
Via Duran Pt
Fountain, CO 80817
|
1,904 sq. feet
|
2 baths 4 beds |
show details | |

|
#45
Southmoor Dr
Fountain, CO 80817
|
1,174 sq. feet
|
1 baths 2 beds |
show details | |

|
#46
Diamond E Rd
Fountain, CO 80817
|
1,110 sq. feet
|
1 baths 3 beds |
show details | |

|
#47
Falling Star Rd
Fountain, CO 80817
|
2,238 sq. feet
|
2 baths 2 beds |
show details | |

|
#48
Indian Village Hts
Fountain, CO 80817
|
2,014 sq. feet
|
2 baths 4 beds |
show details | |

|
#49
River Dr
Fountain, CO 80817
|
1,431 sq. feet
|
2 baths 4 beds |
show details | |

|
Check over 1 million property listings on Foreclosure.com!
|
browse all offers | |||


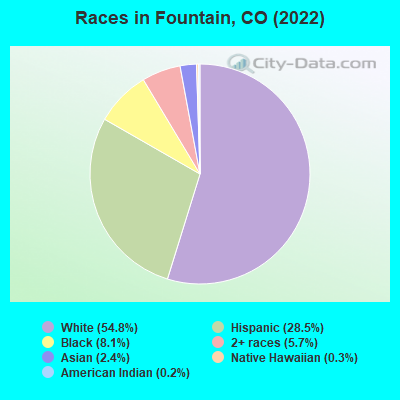
- 16,39954.8%White alone
- 8,52728.5%Hispanic
- 2,4178.1%Black alone
- 1,7095.7%Two or more races
- 7192.4%Asian alone
- 820.3%Native Hawaiian and Other
Pacific Islander alone - 730.2%American Indian alone
- 250.08%Other race alone
According to our research of Colorado and other state lists, there were 83 registered sex offenders living in Fountain, Colorado as of April 27, 2024.
The ratio of all residents to sex offenders in Fountain is 347 to 1.
Type |
2009 |
2011 |
2012 |
2013 |
2014 |
2015 |
2016 |
2017 |
2018 |
2019 |
2020 |
2021 |
2022 |
|---|---|---|---|---|---|---|---|---|---|---|---|---|---|
| Murders (per 100,000) | 1 (4.9) | 2 (7.6) | 0 (0.0) | 0 (0.0) | 0 (0.0) | 0 (0.0) | 1 (3.6) | 0 (0.0) | 1 (3.3) | 2 (6.4) | 1 (3.2) | 0 (0.0) | 1 (3.4) |
| Rapes (per 100,000) | 10 (49.5) | 9 (34.2) | 11 (41.0) | 19 (69.9) | 13 (47.2) | 22 (78.5) | 32 (113.8) | 29 (99.3) | 31 (102.1) | 22 (70.9) | 27 (86.3) | 24 (76.1) | 21 (71.3) |
| Robberies (per 100,000) | 6 (29.7) | 12 (45.6) | 12 (44.7) | 7 (25.8) | 9 (32.6) | 10 (35.7) | 14 (49.8) | 14 (47.9) | 12 (39.5) | 15 (48.3) | 14 (44.7) | 15 (47.5) | 23 (78.1) |
| Assaults (per 100,000) | 3 (14.8) | 5 (19.0) | 45 (167.7) | 49 (180.4) | 61 (221.3) | 71 (253.3) | 51 (181.4) | 105 (359.6) | 75 (247.0) | 87 (280.3) | 89 (284.4) | 78 (247.2) | 56 (190.2) |
| Burglaries (per 100,000) | 106 (524.6) | 99 (376.5) | 121 (450.8) | 127 (467.5) | 114 (413.5) | 107 (381.7) | 69 (245.4) | 115 (393.8) | 84 (276.6) | 98 (315.7) | 72 (230.1) | 71 (225.0) | 96 (326.0) |
| Thefts (per 100,000) | 394 (1,950) | 408 (1,552) | 554 (2,064) | 457 (1,682) | 536 (1,944) | 668 (2,383) | 563 (2,002) | 566 (1,938) | 446 (1,469) | 479 (1,543) | 485 (1,550) | 469 (1,486) | 438 (1,487) |
| Auto thefts (per 100,000) | 32 (158.4) | 32 (121.7) | 36 (134.1) | 35 (128.9) | 40 (145.1) | 36 (128.4) | 97 (345.0) | 100 (342.4) | 106 (349.1) | 88 (283.5) | 60 (191.7) | 99 (313.7) | 86 (292.1) |
| Arson (per 100,000) | 2 (9.9) | 8 (30.4) | 3 (11.2) | 5 (18.4) | 2 (7.3) | 2 (7.1) | 2 (7.1) | 5 (17.1) | 3 (9.9) | 2 (6.4) | 4 (12.8) | 3 (9.5) | 10 (34.0) |
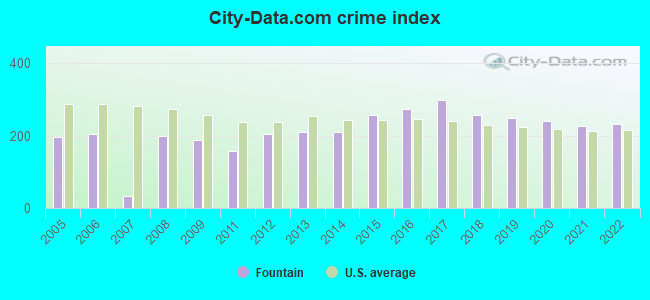
| City-Data.com crime index | 188.8 | 158.2 | 204.6 | 210.1 | 210.1 | 256.5 | 274.3 | 298.2 | 255.5 | 246.6 | 239.1 | 224.8 | 231.0 |
The City-Data.com crime index weighs serious crimes and violent crimes more heavily. Higher means more crime, U.S. average is 246.1. It adjusts for the number of visitors and daily workers commuting into cities.
Crime rate in Fountain detailed stats: murders, rapes, robberies, assaults, burglaries, thefts, arson
Full-time law enforcement employees in 2021, including police officers: 65 (57 officers - 46 male; 11 female).
| Officers per 1,000 residents here: | 1.81 |
| Colorado average: | 2.14 |
 Recent articles from our blog. Our writers, many of them Ph.D. graduates or candidates, create easy-to-read articles on a wide variety of topics.


Latest news from Fountain, CO collected exclusively by city-data.com from local newspapers, TV, and radio stations
Fountain, CO City Guides:
Ancestries: German (15.1%), American (10.3%), English (4.0%), Irish (3.7%), Italian (2.3%), European (1.7%).
Current Local Time: MST time zone
Incorporated on 4/23/1903
Elevation: 5546 feet
Land area: 14.0 square miles.
Population density: 2,065 people per square mile (low).
2,117 residents are foreign born (3.8% Latin America, 1.7% Europe, 1.6% Asia).
| This city: | 7.1% |
| Colorado: | 9.5% |
Median real estate property taxes paid for housing units with mortgages in 2022: $1,477 (0.4%)
Median real estate property taxes paid for housing units with no mortgage in 2022: $1,227 (0.3%)
Nearest city with pop. 50,000+: Colorado Springs, CO  (12.8 miles , pop. 360,890).
Nearest city with pop. 1,000,000+: Phoenix, AZ (545.2 miles , pop. 1,321,045).
Nearest cities:
), ), ), )Latitude: 38.69 N, Longitude: 104.70 W
Daytime population change due to commuting: -6,934 (-23.2%)
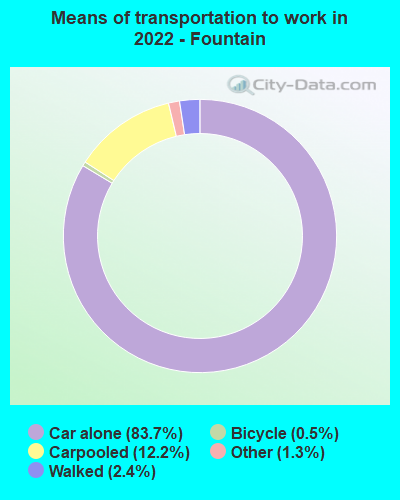
Workers who live and work in this city: 2,750 (19.0%)
Fountain, Colorado accommodation & food services, waste management - Economy and Business Data
| Here: | 3.4% |
| Colorado: | 3.2% |
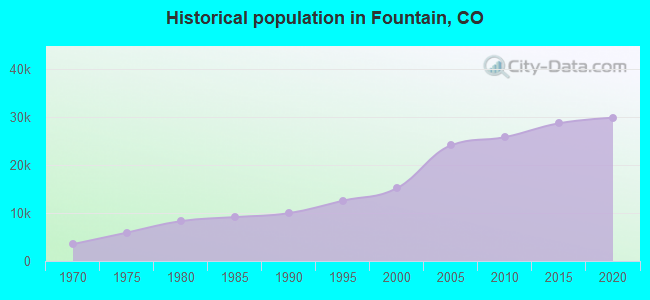
Population change in the 1990s: +4,138 (+37.4%).
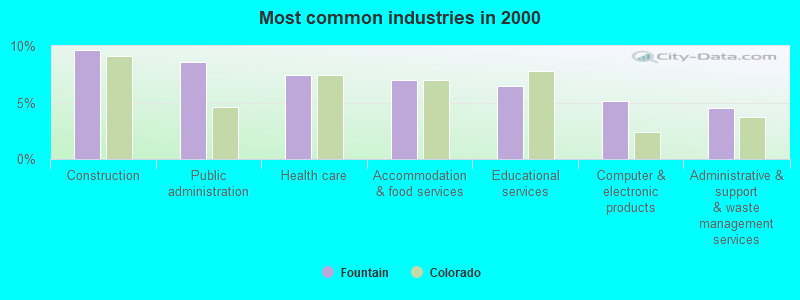
- Construction (9.6%)
- Public administration (8.6%)
- Health care (7.4%)
- Accommodation & food services (7.0%)
- Educational services (6.5%)
- Computer & electronic products (5.2%)
- Administrative & support & waste management services (4.5%)
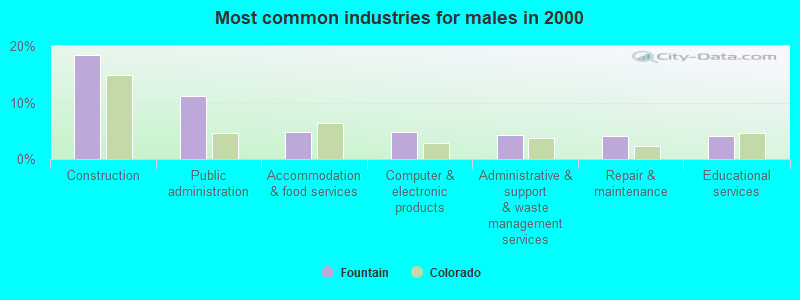
- Construction (18.4%)
- Public administration (11.1%)
- Accommodation & food services (4.8%)
- Computer & electronic products (4.8%)
- Administrative & support & waste management services (4.2%)
- Repair & maintenance (4.1%)
- Educational services (4.0%)
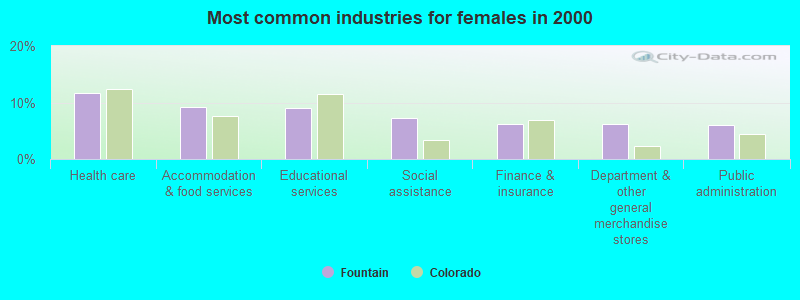
- Health care (11.8%)
- Accommodation & food services (9.2%)
- Educational services (9.0%)
- Social assistance (7.2%)
- Finance & insurance (6.3%)
- Department & other general merchandise stores (6.2%)
- Public administration (6.1%)
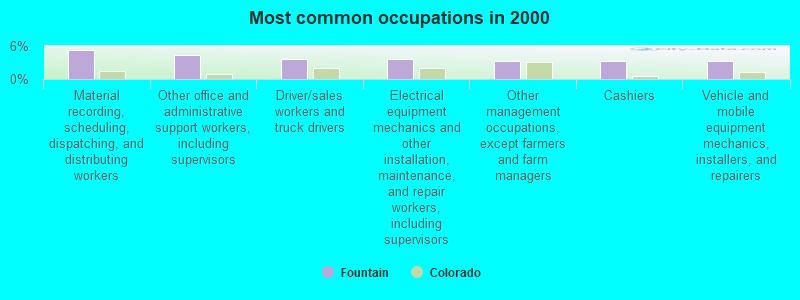
- Material recording, scheduling, dispatching, and distributing workers (5.3%)
- Other office and administrative support workers, including supervisors (4.3%)
- Driver/sales workers and truck drivers (3.7%)
- Electrical equipment mechanics and other installation, maintenance, and repair workers, including supervisors (3.6%)
- Other management occupations, except farmers and farm managers (3.3%)
- Cashiers (3.3%)
- Vehicle and mobile equipment mechanics, installers, and repairers (3.2%)
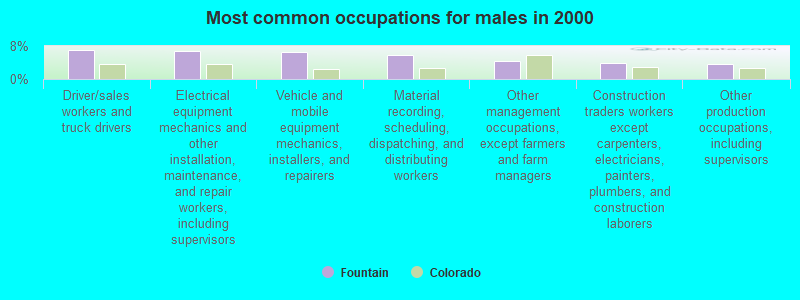
- Driver/sales workers and truck drivers (7.0%)
- Electrical equipment mechanics and other installation, maintenance, and repair workers, including supervisors (6.7%)
- Vehicle and mobile equipment mechanics, installers, and repairers (6.5%)
- Material recording, scheduling, dispatching, and distributing workers (5.9%)
- Other management occupations, except farmers and farm managers (4.3%)
- Construction traders workers except carpenters, electricians, painters, plumbers, and construction laborers (3.8%)
- Other production occupations, including supervisors (3.7%)
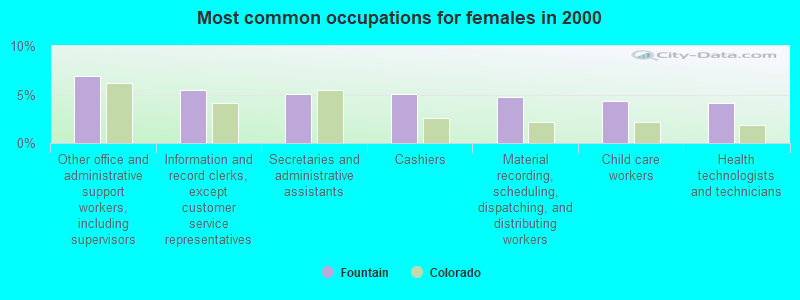
- Other office and administrative support workers, including supervisors (6.9%)
- Information and record clerks, except customer service representatives (5.5%)
- Secretaries and administrative assistants (5.1%)
- Cashiers (5.0%)
- Material recording, scheduling, dispatching, and distributing workers (4.7%)
- Child care workers (4.4%)
- Health technologists and technicians (4.1%)
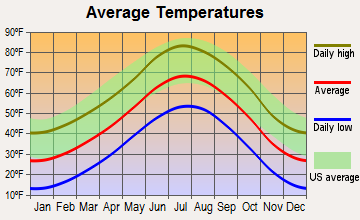
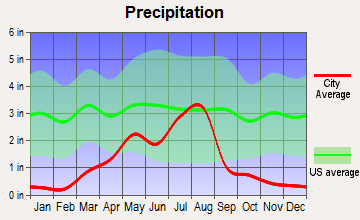
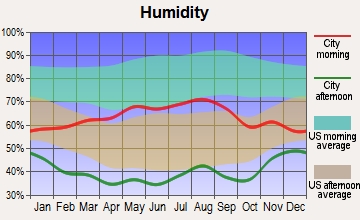
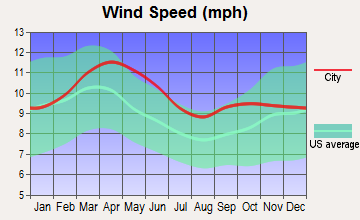
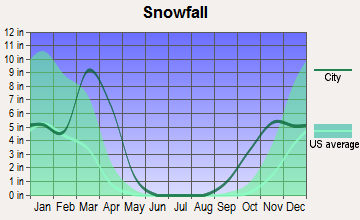
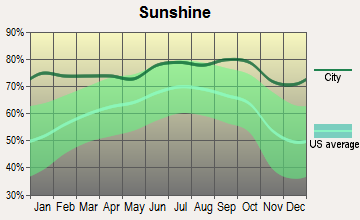
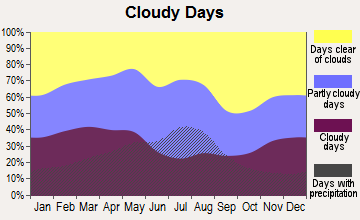
Average climate in Fountain, Colorado
Based on data reported by over 4,000 weather stations
|
|

(lower is better)
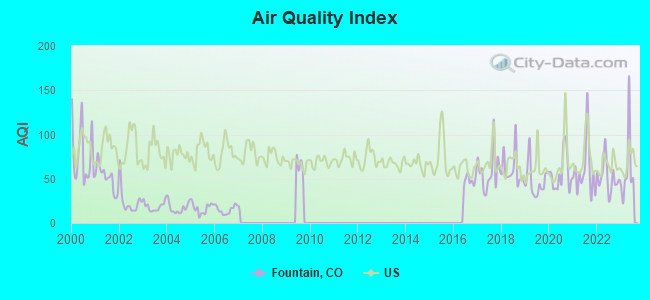
Air Quality Index (AQI) level in 2023 was 61.0. This is about average.
| City: | 61.0 |
| U.S.: | 72.6 |
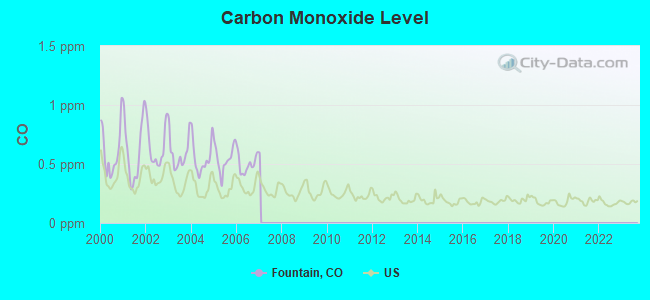
Carbon Monoxide (CO) [ppm] level in 2006 was 0.503. This is significantly worse than average. Closest monitor was 3.8 miles away from the city center.
| City: | 0.503 |
| U.S.: | 0.251 |
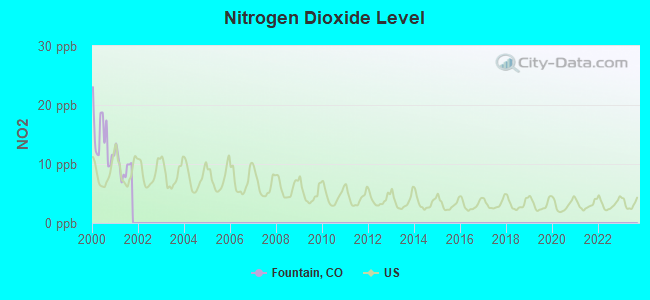
Nitrogen Dioxide (NO2) [ppb] level in 2001 was 9.74. This is significantly worse than average. Closest monitor was 3.8 miles away from the city center.
| City: | 9.74 |
| U.S.: | 5.11 |
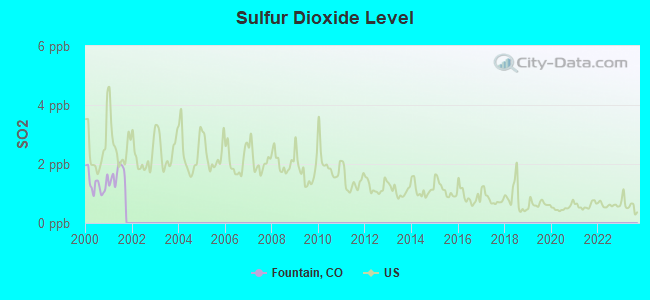
Sulfur Dioxide (SO2) [ppb] level in 2001 was 1.64. This is about average. Closest monitor was 3.8 miles away from the city center.
| City: | 1.64 |
| U.S.: | 1.51 |
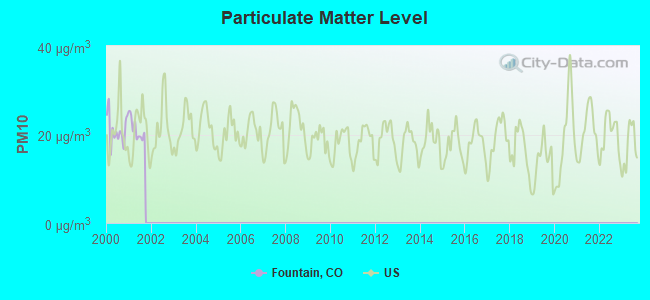
Particulate Matter (PM10) [µg/m3] level in 2001 was 21.2. This is about average. Closest monitor was 3.8 miles away from the city center.
| City: | 21.2 |
| U.S.: | 19.2 |
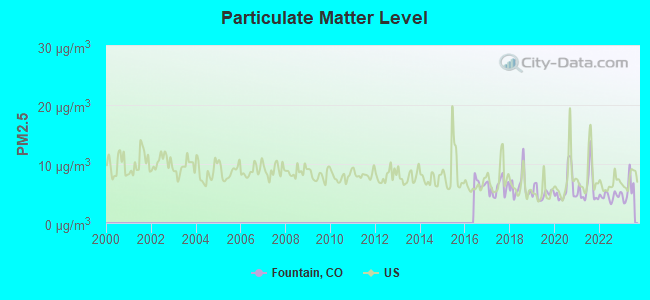
Particulate Matter (PM2.5) [µg/m3] level in 2023 was 5.60. This is significantly better than average. Closest monitor was 11.6 miles away from the city center.
| City: | 5.60 |
| U.S.: | 8.11 |
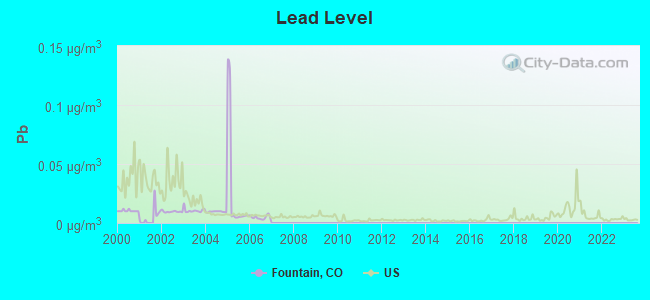
Lead (Pb) [µg/m3] level in 2006 was 0.00479. This is significantly better than average. Closest monitor was 11.3 miles away from the city center.
| City: | 0.00479 |
| U.S.: | 0.00931 |
Tornado activity:
Fountain-area historical tornado activity is near Colorado state average. It is 33% smaller than the overall U.S. average.
On 6/24/1979, a category F3 (max. wind speeds 158-206 mph) tornado 11.8 miles away from the Fountain city center injured one person and caused between $50,000 and $500,000 in damages.
On 6/13/1977, a category F3 tornado 19.7 miles away from the city center .
Earthquake activity:
Fountain-area historical earthquake activity is significantly above Colorado state average. It is 710% greater than the overall U.S. average.On 8/18/1959 at 06:37:13, a magnitude 7.7 (7.7 UK, Class: Major, Intensity: VIII - XII) earthquake occurred 509.4 miles away from Fountain center, causing $26,000,000 total damage
On 8/23/2011 at 05:46:18, a magnitude 5.3 (5.3 MW, Depth: 2.5 mi, Class: Moderate, Intensity: VI - VII) earthquake occurred 112.8 miles away from the city center
On 8/10/2005 at 22:08:22, a magnitude 5.0 (5.0 MW, Depth: 3.1 mi) earthquake occurred 121.0 miles away from the city center
On 8/10/2005 at 22:08:22, a magnitude 5.0 (5.0 MB, 4.7 MS, 5.0 MW) earthquake occurred 122.7 miles away from the city center
On 10/18/1984 at 15:30:23, a magnitude 5.5 (5.4 MB, 5.1 MS, 5.5 ML) earthquake occurred 260.0 miles away from the city center
On 8/22/2011 at 23:30:19, a magnitude 4.7 (4.7 MW, Depth: 3.1 mi, Class: Light, Intensity: IV - V) earthquake occurred 115.2 miles away from Fountain center
Magnitude types: body-wave magnitude (MB), local magnitude (ML), surface-wave magnitude (MS), moment magnitude (MW)
Natural disasters:
The number of natural disasters in El Paso County (17) is near the US average (15).Major Disasters (Presidential) Declared: 10
Emergencies Declared: 5
Causes of natural disasters: Floods: 7, Storms: 7, Fires: 4, Landslides: 4, Mudslides: 4, Snows: 2, Tornadoes: 2, Drought: 1, Flash Flood: 1, Heavy Rain: 1, Hurricane: 1, Snowstorm: 1, Other: 1 (Note: some incidents may be assigned to more than one category).
Hospitals and medical centers in Fountain:
Other hospitals and medical centers near Fountain:
- A. M. HEALTH, INC. (Home Health Center, about 5 miles away; SECURITY, CO)
- ASPEN LIVING CENTER (Nursing Home, about 9 miles away; COLORADO SPRINGS, CO)
- HUMAN TOUCH HOME HEALTH CARE AGENCY INC (Home Health Center, about 10 miles away; COLORADO SPRINGS, CO)
- CHEYENNE MOUNTAIN CARE AND REHABILITATION CENTER (Nursing Home, about 10 miles away; COLORADO SPRINGS, CO)
- LAUREL MANOR CARE CENTER (Nursing Home, about 10 miles away; COLORADO SPRINGS, CO)
- MGA HOME HEALTHCARE COLORADO INC (Home Health Center, about 10 miles away; COLORADO SPRINGS, CO)
- SOLAMOR HOSPICE OF COLORADO SPRINGS (Hospital, about 10 miles away; COLORADO SPRINGS, CO)
Colleges/universities with over 2000 students nearest to Fountain:
- Pikes Peak Community College (about 7 miles; Colorado Springs, CO; Full-time enrollment: 10,395)
- Colorado College (about 13 miles; Colorado Springs, CO; FT enrollment: 2,199)
- University of Colorado Colorado Springs (about 15 miles; Colorado Springs, CO; FT enrollment: 8,700)
- Colorado Technical University-Online (about 16 miles; Colorado Springs, CO; FT enrollment: 22,771)
- Colorado Technical University-Colorado Springs (about 16 miles; Colorado Springs, CO; FT enrollment: 2,049)
- United States Air Force Academy (about 25 miles; USAFA, CO; FT enrollment: 5,088)
- Colorado State University-Pueblo (about 28 miles; Pueblo, CO; FT enrollment: 5,993)
Public high schools in Fountain:
- FOUNTAIN-FORT CARSON HIGH SCHOOL (Students: 1,511, Location: 900 JIMMY CAMP ROAD, Grades: 9-12)
- WELTE EDUCATION CENTER (Location: 301 EAST IOWA, Grades: 6-12)
Public elementary/middle schools in Fountain:
- FOUNTAIN MIDDLE SCHOOL (Students: 842, Location: 515 N. SANTE FE, Grades: 6-8)
- JORDAHL ELEMENTARY SCHOOL (Students: 502, Location: 800 PROGRESS DRIVE, Grades: PK-5)
- JANITELL JUNIOR HIGH SCHOOL (Students: 492, Location: 7635 FOUNTAIN MESA ROAD, Grades: 6-8)
- ARAGON ELEMENTARY SCHOOL (Students: 487, Location: 211 SOUTH MAIN STREET, Grades: PK-5)
- EAGLESIDE ELEMENTARY SCHOOL (Students: 380, Location: 9750 SENTRY DRIVE, Grades: PK-5)
- MESA ELEMENTARY SCHOOL (Location: 400 CAMINO DEL REY, Grades: PK-5)
- PRAIRIE HEIGHTS ELEMENTARY SCHOOL (Location: 7930 INDIAN VILLAGE HEIGHTS, Grades: PK-5)
Points of interest:
Notable locations in Fountain: Fountain Fire Department Station 2 (A), Fountain Fire Department Station 3 (B), Fountain Fire Department Station 1 Headquarters (C). Display/hide their locations on the map
Cemetery: Fairview Cemetery at Fountain (1). Display/hide its location on the map
Hotel: Fountain/COS Area/Ft Carson (6120 East Champlin Drive) (1). Display/hide its approximate location on the map
Birthplace of: Chase Headley - Baseball player.
Drinking water stations with addresses in Fountain and their reported violations in the past:
FOUNTAIN CITY OF (Population served: 20,000, Purch surface water):Past health violations:Past monitoring violations:
- MCL, Monthly (TCR) - In OCT-2008, Contaminant: Coliform. Follow-up actions: St Public Notif requested (OCT-21-2008), St Violation/Reminder Notice (OCT-21-2008), St Public Notif received (NOV-24-2008), St Compliance achieved (SEP-28-2009)
- Monitoring and Reporting (DBP) - Between JAN-2009 and MAR-2009, Contaminant: Chlorine. Follow-up actions: St Public Notif requested (MAY-08-2009), St Violation/Reminder Notice (MAY-08-2009), St Public Notif received (JUN-30-2009), St Compliance achieved (JUL-07-2009)
- Monitoring and Reporting (DBP) - Between OCT-2006 and DEC-2006, Contaminant: Total Haloacetic Acids (HAA5). Follow-up actions: St Violation/Reminder Notice (FEB-12-2007), St Compliance achieved (FEB-27-2007)
- Monitoring and Reporting (DBP) - Between OCT-2006 and DEC-2006, Contaminant: TTHM. Follow-up actions: St Violation/Reminder Notice (FEB-12-2007), St Compliance achieved (FEB-27-2007)
- One minor monitoring violation
- 124 regular monitoring violations
Drinking water stations with addresses in Fountain that have no violations reported:
- PONDEROSA CG (Population served: 70, Primary Water Source Type: Groundwater)
| This city: | 3.0 people |
| Colorado: | 2.5 people |
| This city: | 79.4% |
| Whole state: | 63.9% |
| This city: | 5.4% |
| Whole state: | 6.5% |
Likely homosexual households (counted as self-reported same-sex unmarried-partner households)
- Lesbian couples: 0.3% of all households
- Gay men: 0.2% of all households
Banks with branches in Fountain (2011 data):
- U.S. Bank National Association: Fountain Safeway Branch at 6925 Mesa Ridge Parkway, branch established on 2006/10/13. Info updated 2012/01/30: Bank assets: $330,470.8 mil, Deposits: $236,091.5 mil, headquarters in Cincinnati, OH, positive income, 3121 total offices, Holding Company: U.S. Bancorp
- Peoples National Bank: Fountain Branch at 6830 Mesa Ridge Parkway, branch established on 2007/08/21. Info updated 2007/12/13: Bank assets: $196.6 mil, Deposits: $148.0 mil, headquarters in Colorado Springs, CO, positive income, Commercial Lending Specialization, 8 total offices, Holding Company: Winter Trust Of 12/3/74
- JPMorgan Chase Bank, National Association: Mesa Ridge & Fountain Mesa Banking C at 7780 Fountain Mesa Road, branch established on 2007/10/29. Info updated 2011/11/10: Bank assets: $1,811,678.0 mil, Deposits: $1,190,738.0 mil, headquarters in Columbus, OH, positive income, International Specialization, 5577 total offices, Holding Company: Jpmorgan Chase & Co.
- Pikes Peak National Bank: Valley Branch at 6615 Camden Boulevard, branch established on 1995/11/20. Info updated 2006/11/03: Bank assets: $74.4 mil, Deposits: $66.6 mil, headquarters in Colorado Springs, CO, negative income in the last year, Commercial Lending Specialization, 3 total offices, Holding Company: Pikes Peak National Company
- Academy Bank, National Association: Hwy 85/87 Branch at 6510 U.S. Highway 85/87, branch established on 2000/04/28. Info updated 2008/06/10: Bank assets: $282.1 mil, Deposits: $218.0 mil, headquarters in Colorado Springs, CO, positive income, Commercial Lending Specialization, 54 total offices, Holding Company: Dickinson Financial Corporation Ii
- First State Bank of Colorado: Fountain Branch at 410 South Santa Fe, branch established on 1968/03/11. Info updated 2010/07/09: Bank assets: $179.8 mil, Deposits: $155.0 mil, headquarters in Hotchkiss, CO, positive income, Commercial Lending Specialization, 5 total offices, Holding Company: Custer Bancorp.
For population 15 years and over in Fountain:
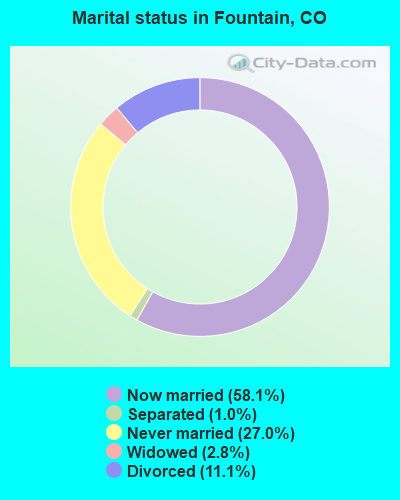
- Never married: 27.0%
- Now married: 58.1%
- Separated: 1.0%
- Widowed: 2.8%
- Divorced: 11.1%
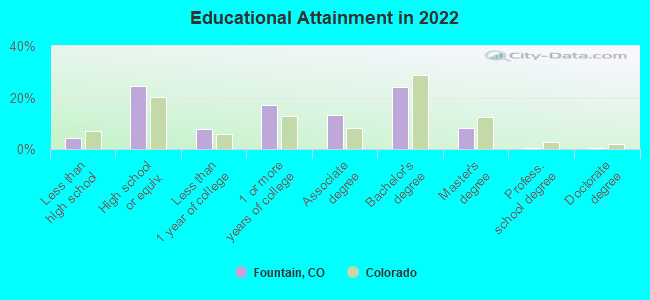
For population 25 years and over in Fountain:
- High school or higher: 95.1%
- Bachelor's degree or higher: 31.1%
- Graduate or professional degree: 8.3%
- Unemployed: 6.3%
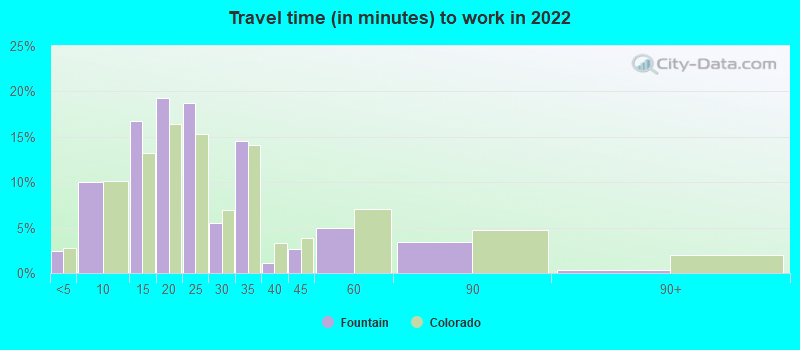
- Mean travel time to work (commute): 23.8 minutes
| Here: | 8.9 |
| Colorado average: | 11.1 |
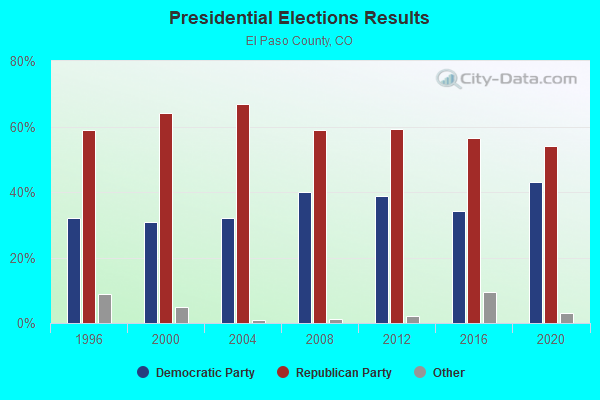
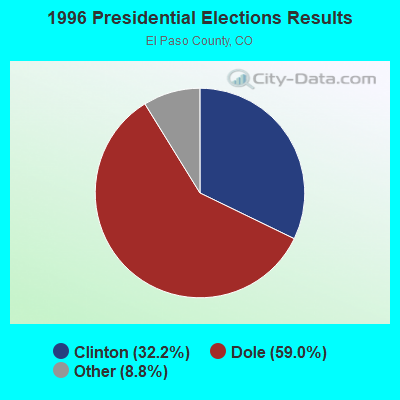
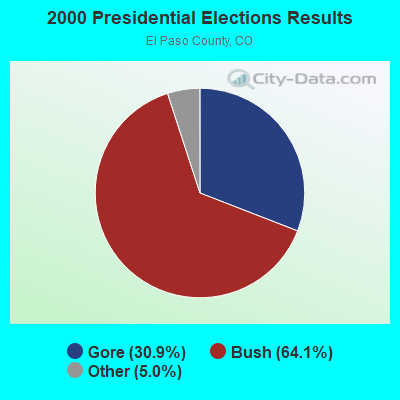
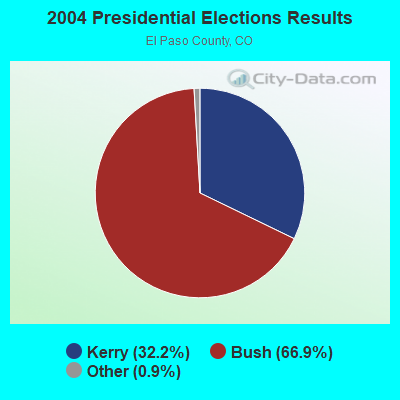
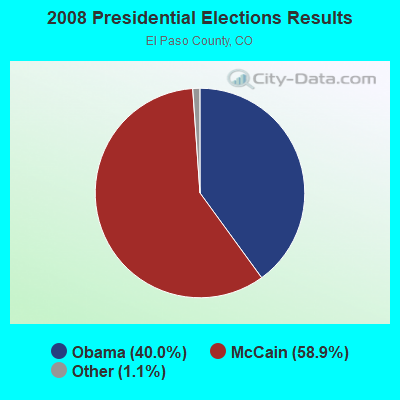
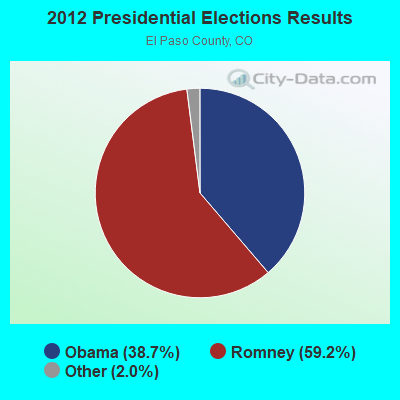
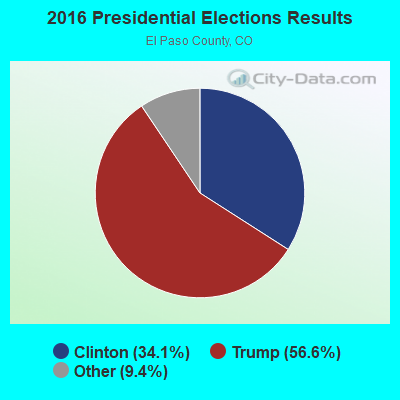
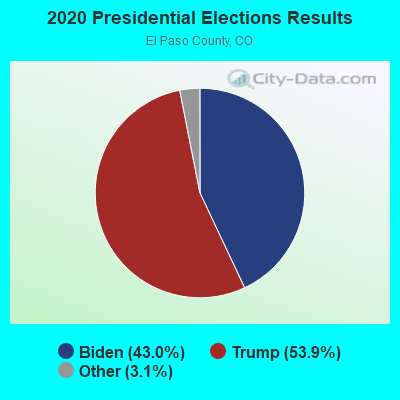
Graphs represent county-level data. Detailed 2008 Election Results
Religion statistics for Fountain, CO (based on El Paso County data)
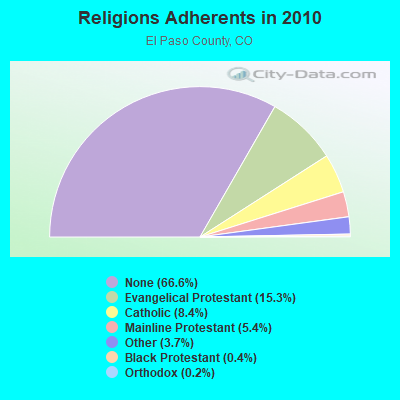
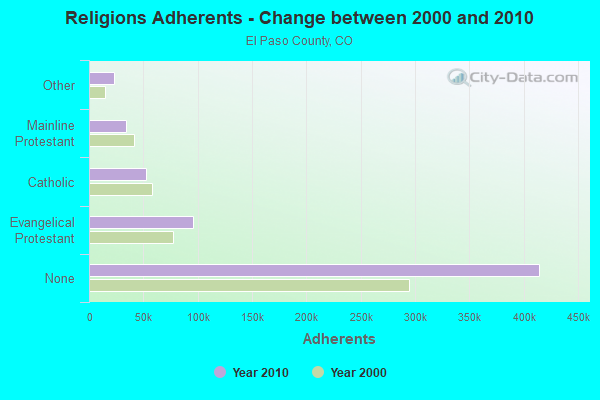
| Religion | Adherents | Congregations |
|---|---|---|
| Evangelical Protestant | 95,284 | 265 |
| Catholic | 52,310 | 23 |
| Mainline Protestant | 33,697 | 61 |
| Other | 22,775 | 62 |
| Black Protestant | 2,686 | 11 |
| Orthodox | 947 | 4 |
| None | 414,564 | - |
Food Environment Statistics:
| This county: | 0.97 / 10,000 pop. |
| State: | 1.50 / 10,000 pop. |
| This county: | 0.15 / 10,000 pop. |
| Colorado: | 0.15 / 10,000 pop. |
| El Paso County: | 0.34 / 10,000 pop. |
| State: | 0.45 / 10,000 pop. |
| This county: | 2.87 / 10,000 pop. |
| State: | 3.13 / 10,000 pop. |
| El Paso County: | 6.64 / 10,000 pop. |
| Colorado: | 8.99 / 10,000 pop. |
| Here: | 5.5% |
| State: | 5.3% |
| Here: | 19.8% |
| State: | 18.4% |
| El Paso County: | 7.0% |
| Colorado: | 9.6% |
Health and Nutrition:
| Fountain: | 48.9% |
| Colorado: | 49.4% |
| Fountain: | 48.0% |
| State: | 47.8% |
| Fountain: | 28.9 |
| Colorado: | 28.5 |
| Here: | 21.9% |
| State: | 20.7% |
| This city: | 10.1% |
| State: | 9.7% |
| This city: | 6.7 |
| Colorado: | 6.8 |
| Fountain: | 34.1% |
| Colorado: | 33.3% |
| This city: | 57.4% |
| State: | 57.3% |
| Fountain: | 81.8% |
| Colorado: | 80.2% |
More about Health and Nutrition of Fountain, CO Residents
| Local government employment and payroll (March 2022) | |||||
| Function | Full-time employees | Monthly full-time payroll | Average yearly full-time wage | Part-time employees | Monthly part-time payroll |
|---|---|---|---|---|---|
| Police Protection - Officers | 56 | $390,002 | $83,572 | 2 | $1,533 |
| Electric Power | 47 | $354,036 | $90,392 | 2 | $7,433 |
| Firefighters | 28 | $217,748 | $93,321 | 24 | $36,615 |
| Other Government Administration | 18 | $132,994 | $88,663 | 2 | $2,790 |
| Other and Unallocable | 13 | $80,452 | $74,263 | 1 | $452 |
| Financial Administration | 12 | $89,070 | $89,070 | 2 | $7,856 |
| Water Supply | 12 | $82,622 | $82,622 | 2 | $1,989 |
| Streets and Highways | 9 | $46,936 | $62,581 | 0 | $0 |
| Police - Other | 7 | $39,432 | $67,598 | 1 | $1,566 |
| Parks and Recreation | 6 | $32,003 | $64,006 | 16 | $4,989 |
| Housing and Community Development (Local) | 2 | $11,370 | $68,220 | 3 | $3,669 |
| Judicial and Legal | 2 | $7,289 | $43,734 | 0 | $0 |
| Fire - Other | 2 | $12,300 | $73,800 | 0 | $0 |
| Transit | 0 | $0 | 8 | $14,238 | |
| Totals for Government | 214 | $1,496,255 | $83,902 | 63 | $83,130 |
Fountain government finances - Expenditure in 2021 (per resident):
- Construction - Housing and Community Development: $2,156,000 ($74.58)
- Current Operations - Electric Utilities: $25,387,000 ($878.23)
Police Protection: $8,685,000 ($300.45)
Water Utilities: $7,915,000 ($273.81)
Local Fire Protection: $6,532,000 ($225.97)
General - Other: $3,667,000 ($126.86)
Financial Administration: $2,089,000 ($72.27)
Regular Highways: $1,933,000 ($66.87)
Parks and Recreation: $1,066,000 ($36.88)
General Public Buildings: $666,000 ($23.04)
Transit Utilities: $661,000 ($22.87)
Housing and Community Development: $657,000 ($22.73)
Protective Inspection and Regulation - Other: $443,000 ($15.33)
Central Staff Services: $299,000 ($10.34)
Judicial and Legal Services: $264,000 ($9.13)
Miscellaneous Commercial Activities - Other: $43,000 ($1.49)
- Electric Utilities - Interest on Debt: $2,169,000 ($75.03)
- Total Salaries and Wages: $24,517,000 ($848.13)
- Transit Utilities - Interest on Debt: $6,000 ($0.21)
- Water Utilities - Interest on Debt: $2,915,000 ($100.84)
Fountain government finances - Revenue in 2021 (per resident):
- Charges - Other: $862,000 ($29.82)
Housing and Community Development: $451,000 ($15.60)
Parks and Recreation: $148,000 ($5.12)
Miscellaneous Commercial Activities: $16,000 ($0.55)
- Federal Intergovernmental - Other: $2,613,000 ($90.39)
Public Welfare: $322,000 ($11.14)
- Miscellaneous - Fines and Forfeits: $292,000 ($10.10)
Interest Earnings: $141,000 ($4.88)
General Revenue - Other: $60,000 ($2.08)
- Revenue - Electric Utilities: $26,234,000 ($907.53)
Water Utilities: $12,064,000 ($417.34)
Transit Utilities: $1,271,000 ($43.97)
- State Intergovernmental - Highways: $794,000 ($27.47)
- Tax - General Sales and Gross Receipts: $20,989,000 ($726.09)
Property: $2,835,000 ($98.07)
Other License: $2,165,000 ($74.90)
Other Selective Sales: $383,000 ($13.25)
Occupation and Business License - Other: $146,000 ($5.05)
Fountain government finances - Debt in 2021 (per resident):
- Long Term Debt - Beginning Outstanding - Unspecified Public Purpose: $127,229,000 ($4401.32)
Outstanding Unspecified Public Purpose: $123,165,000 ($4260.73)
Retired Unspecified Public Purpose: $13,063,000 ($451.90)
Issue, Unspecified Public Purpose: $9,000,000 ($311.34)
Fountain government finances - Cash and Securities in 2021 (per resident):
- Bond Funds - Cash and Securities: $4,446,000 ($153.80)
- Other Funds - Cash and Securities: $38,403,000 ($1328.50)
- Sinking Funds - Cash and Securities: $4,764,000 ($164.80)
9.81% of this county's 2021 resident taxpayers lived in other counties in 2020 ($64,463 average adjusted gross income)
| Here: | 9.81% |
| Colorado average: | 11.28% |
0.28% of residents moved from foreign countries ($1,844 average AGI)
El Paso County: 0.28% Colorado average: 0.05%
Top counties from which taxpayers relocated into this county between 2020 and 2021:
| from Arapahoe County, CO | |
| from Douglas County, CO | |
| from Denver County, CO |
9.66% of this county's 2020 resident taxpayers moved to other counties in 2021 ($62,154 average adjusted gross income)
| Here: | 9.66% |
| Colorado average: | 11.05% |
0.19% of residents moved to foreign countries ($1,409 average AGI)
El Paso County: 0.19% Colorado average: 0.03%
Top counties to which taxpayers relocated from this county between 2020 and 2021:
| to Pueblo County, CO | |
| to Denver County, CO | |
| to Douglas County, CO |
| Businesses in Fountain, CO | ||||
| Name | Count | Name | Count | |
|---|---|---|---|---|
| 7-Eleven | 2 | Papa John's Pizza | 1 | |
| AT&T | 1 | Payless | 1 | |
| Advance Auto Parts | 1 | Pizza Hut | 1 | |
| Applebee's | 1 | Popeyes | 1 | |
| AutoZone | 1 | RadioShack | 1 | |
| Big O Tires | 1 | SONIC Drive-In | 1 | |
| Blockbuster | 1 | Safeway | 1 | |
| Burger King | 1 | Starbucks | 1 | |
| Carl\s Jr. | 1 | Subway | 5 | |
| DHL | 1 | Super 8 | 1 | |
| Dairy Queen | 1 | T-Mobile | 2 | |
| Domino's Pizza | 1 | Taco Bell | 2 | |
| FedEx | 3 | U-Haul | 3 | |
| Goodwill | 3 | UPS | 2 | |
| H&R Block | 2 | Vons | 1 | |
| Jack In The Box | 1 | Walgreens | 1 | |
| Kroger | 2 | Walmart | 1 | |
| Little Caesars Pizza | 1 | Wendy's | 1 | |
| Lowe's | 1 | YMCA | 1 | |
| McDonald's | 2 | |||
Strongest AM radio stations in Fountain:
- KWYD (1580 AM; 10 kW; COLORADO SPRINGS, CO; Owner: PILGRIM COMMUNICATIONS, INC.)
- KCBR (1040 AM; daytime; 15 kW; MONUMENT, CO; Owner: KLZ RADIO, INC.)
- KCMN (1530 AM; 15 kW; COLORADO SPRINGS, CO)
- KKCS (1460 AM; 5 kW; COLORADO SPRINGS, CO; Owner: WALTON STATIONS - COLORADO, INC.)
- KBZC (1300 AM; 5 kW; COLORADO SPRINGS, CO; Owner: CITADEL BROADCASTING COMPANY)
- KOA (850 AM; 50 kW; DENVER, CO; Owner: JACOR BROADCASTING OF COLORADO, INC.)
- KMXA (1090 AM; 50 kW; AURORA, CO; Owner: ENTRAVISION HOLDINGS, LLC)
- KLTT (670 AM; 50 kW; COMMERCE CITY, CO; Owner: KLZ RADIO, INC.)
- KKZN (760 AM; 50 kW; THORNTON, CO; Owner: JACOR BROADCASTING OF COLORADO, INC.)
- KVOR (740 AM; 3 kW; COLORADO SPRINGS, CO; Owner: CITADEL BROADCASTING COMPANY)
- KRDO (1240 AM; 1 kW; COLORADO SPRINGS, CO; Owner: THE PIKES PEAK BROADCASTING CO.)
- KGHF (1350 AM; 5 kW; PUEBLO, CO; Owner: CLEAR CHANNEL BROADCASTING LICENSES, INC.)
- KCUV (1510 AM; 25 kW; LITTLETON, CO; Owner: PEOPLE WIRELESS, INC.)
Strongest FM radio stations in Fountain:
- KKFM (98.1 FM; COLORADO SPRINGS, CO; Owner: CITADEL BROADCASTING COMPANY)
- KKCS-FM (101.9 FM; COLORADO SPRINGS, CO; Owner: WALTON STATIONS - COLORADO, INC.)
- KBIQ (102.7 FM; MANITOU SPRINGS, CO; Owner: BISON MEDIA, INC.)
- KRCC (91.5 FM; COLORADO SPRINGS, CO; Owner: THE COLORADO COLLEGE)
- KSKX (105.5 FM; SECURITY, CO; Owner: OPTIMA COMMUNICATIONS, INC.)
- KGFT (100.7 FM; PUEBLO, CO; Owner: BISON MEDIA, INC)
- KTLF (90.5 FM; COLORADO SPRINGS, CO; Owner: EDUCATIONAL COMMUNICATIONS OF COLORADO SPRINGS, INC.)
- KKLI (106.3 FM; WIDEFIELD, CO; Owner: CAPSTAR TX LIMITED PARTNERSHIP)
- KMOM (96.1 FM; FOUNTAIN, CO; Owner: AMFM TEXAS LICENSES LIMITED PARTNERSHIP)
- KCME (88.7 FM; MANITOU SPRINGS, CO; Owner: CHEYENNE MOUNTAIN PUBLIC BROADCAST HOUSE, INC)
- KSPZ (92.9 FM; COLORADO SPRINGS, CO; Owner: CITADEL BROADCASTING COMPANY)
- KVUU (99.9 FM; PUEBLO, CO; Owner: CAPSTAR TX LIMITED PARTNERSHIP)
- KRDO-FM (95.1 FM; COLORADO SPRINGS, CO; Owner: THE PIKES PEAK BROADCASTING CO.)
- KILO (94.3 FM; COLORADO SPRINGS, CO; Owner: COLORADO SPRINGS RADIO BCSTERS, INC.)
- KEPC (89.7 FM; COLORADO SPRINGS, CO; Owner: PIKES PEAK COMMUNITY COLLEGE)
- KKMG (98.9 FM; PUEBLO, CO; Owner: CITADEL BROADCASTING COMPANY)
- KCCY (96.9 FM; PUEBLO, CO; Owner: CAPSTAR TX LIMITED PARTNERSHIP)
- KYZX (103.9 FM; PUEBLO WEST, CO; Owner: COLORADO SPRINGS RADIO B/CASTRS, INC)
- KTLC (89.1 FM; CANON CITY, CO; Owner: MAKE A DIFFERENCE FOUNDATION, INC.)
- K203AT (88.5 FM; WESTCLIFFE, ETC., CO; Owner: THE COLORADO COLLEGE)
TV broadcast stations around Fountain:
- KKTV (Channel 11; COLORADO SPRINGS, CO; Owner: GRAY MIDAMERICA TV LICENSEE CORP.)
- KTSC (Channel 8; PUEBLO, CO; Owner: ROCKY MOUNTAIN PUBLIC BROADCASTING NETWORK, INC.)
- KGHB-CA (Channel 27; PUEBLO, ETC., CO; Owner: ENTRAVISION HOLDINGS, LLC)
- K23GJ (Channel 23; COLORADO SPRINGS, CO; Owner: SYNCOM MEDIA GROUP, INC.)
- KRDO-TV (Channel 13; COLORADO SPRINGS, CO; Owner: THE PIKES PEAK BROADCASTING COMPANY)
- KXRM-TV (Channel 21; COLORADO SPRINGS, CO; Owner: RAYCOM NATIONAL, INC.)
- K49CJ (Channel 49; COLORADO SPRINGS, CO; Owner: TELEMUNDO OF COLORADO SPRINGS, INC.)
- KJCS-LP (Channel 38; COLORADO SPRINGS, CO; Owner: BETA BROADCASTING, INC.)
- K63DW (Channel 63; COLORADO SPRINGS, CO; Owner: ROCKY MTN.PUB.B/CING.NETWORK,INC.)
- K30AA (Channel 30; COLORADO SPRINGS, CO; Owner: SANGRE DE CRISTO COMMUNICATIONS, INC.)
- K43CG (Channel 43; COLORADO SPRINGS, CO; Owner: FULL GOSPEL OUTREACH, INC.)
- KXTU-LP (Channel 57; COLORADO SPRINGS, CO; Owner: RAYCOM NATIONAL, INC.)
- KWHS-LP (Channel 51; COLORADO SPRINGS, CO; Owner: LE SEA BROADCASTING CORPORATION)
- K32EO (Channel 32; COLORADO SPRINGS, CO; Owner: FRONT RANGE EDUCATIONAL MEDIA CORP.)
- National Bridge Inventory (NBI) Statistics
- 47Number of bridges
- 630ft / 192mTotal length
- $1,668,000Total costs
- 698,112Total average daily traffic
- 56,270Total average daily truck traffic
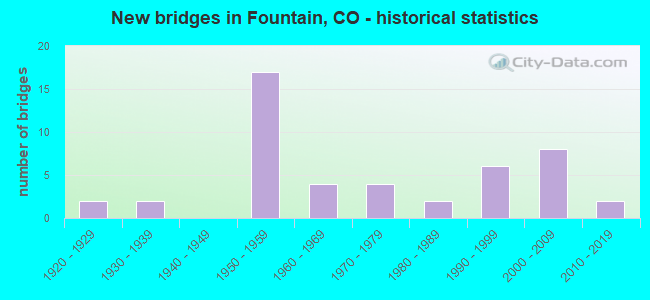
- New bridges - historical statistics
- 21920-1929
- 21930-1939
- 171950-1959
- 41960-1969
- 41970-1979
- 21980-1989
- 61990-1999
- 82000-2009
- 22010-2019
FCC Registered Antenna Towers: 100 (See the full list of FCC Registered Antenna Towers)
FCC Registered Private Land Mobile Towers: 1 (See the full list of FCC Registered Private Land Mobile Towers in Fountain, CO)
FCC Registered Broadcast Land Mobile Towers: 28 (See the full list of FCC Registered Broadcast Land Mobile Towers)
FCC Registered Microwave Towers: 47 (See the full list of FCC Registered Microwave Towers in this town)
FCC Registered Amateur Radio Licenses: 141 (See the full list of FCC Registered Amateur Radio Licenses in Fountain)
FAA Registered Aircraft: 8 (See the full list of FAA Registered Aircraft in Fountain)
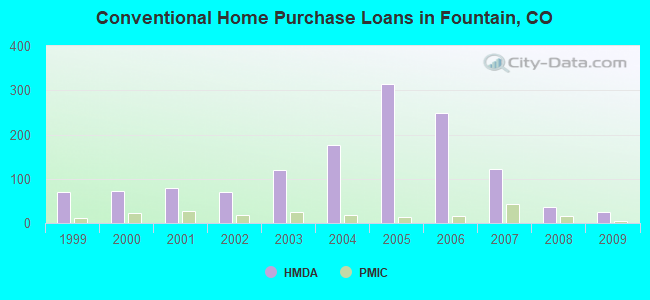
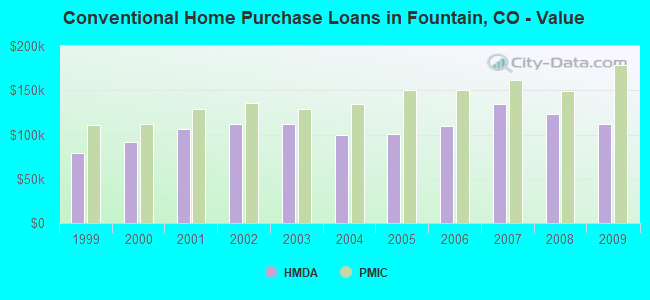
| Home Mortgage Disclosure Act Aggregated Statistics For Year 2009 (Based on 9 partial tracts) | ||||||||||||
| A) FHA, FSA/RHS & VA Home Purchase Loans | B) Conventional Home Purchase Loans | C) Refinancings | D) Home Improvement Loans | F) Non-occupant Loans on < 5 Family Dwellings (A B C & D) | G) Loans On Manufactured Home Dwelling (A B C & D) | |||||||
|---|---|---|---|---|---|---|---|---|---|---|---|---|
| Number | Average Value | Number | Average Value | Number | Average Value | Number | Average Value | Number | Average Value | Number | Average Value | |
| LOANS ORIGINATED | 159 | $168,685 | 25 | $112,389 | 279 | $176,002 | 11 | $23,319 | 23 | $113,077 | 7 | $92,337 |
| APPLICATIONS APPROVED, NOT ACCEPTED | 9 | $146,411 | 2 | $91,675 | 29 | $162,221 | 1 | $7,840 | 2 | $92,650 | 2 | $96,700 |
| APPLICATIONS DENIED | 16 | $150,109 | 5 | $90,886 | 80 | $148,109 | 18 | $26,982 | 7 | $109,446 | 2 | $75,185 |
| APPLICATIONS WITHDRAWN | 19 | $159,723 | 5 | $111,160 | 56 | $165,995 | 3 | $64,377 | 4 | $88,965 | 1 | $68,030 |
| FILES CLOSED FOR INCOMPLETENESS | 2 | $136,070 | 0 | $0 | 13 | $174,123 | 0 | $0 | 0 | $0 | 0 | $0 |
Detailed HMDA statistics for the following Tracts: 0045.01 , 0045.03, 0045.06, 0045.07, 0045.08, 0045.09
| Private Mortgage Insurance Companies Aggregated Statistics For Year 2009 (Based on 9 partial tracts) | ||||
| A) Conventional Home Purchase Loans | B) Refinancings | |||
|---|---|---|---|---|
| Number | Average Value | Number | Average Value | |
| LOANS ORIGINATED | 4 | $178,485 | 6 | $181,362 |
| APPLICATIONS APPROVED, NOT ACCEPTED | 1 | $188,380 | 1 | $218,310 |
| APPLICATIONS DENIED | 1 | $224,220 | 5 | $122,726 |
| APPLICATIONS WITHDRAWN | 0 | $0 | 0 | $0 |
| FILES CLOSED FOR INCOMPLETENESS | 0 | $0 | 0 | $0 |
Detailed PMIC statistics for the following Tracts: 0045.01 , 0045.03, 0045.06, 0045.07, 0045.08, 0045.09
2002 - 2018 National Fire Incident Reporting System (NFIRS) incidents
- Fire incident types reported to NFIRS in Fountain, CO
- 1,06053.7%Outside Fires
- 52626.6%Structure Fires
- 33216.8%Mobile Property/Vehicle Fires
- 572.9%Other
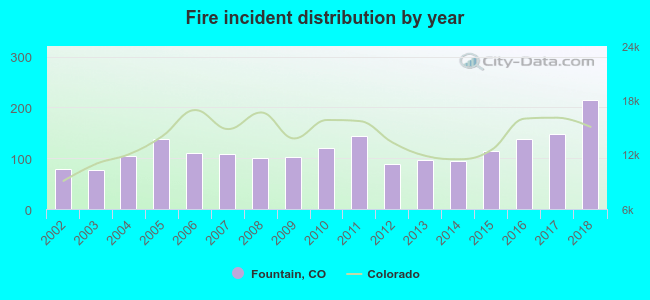 Based on the data from the years 2002 - 2018 the average number of fire incidents per year is 116. The highest number of fires - 214 took place in 2018, and the least - 77 in 2003. The data has a rising trend.
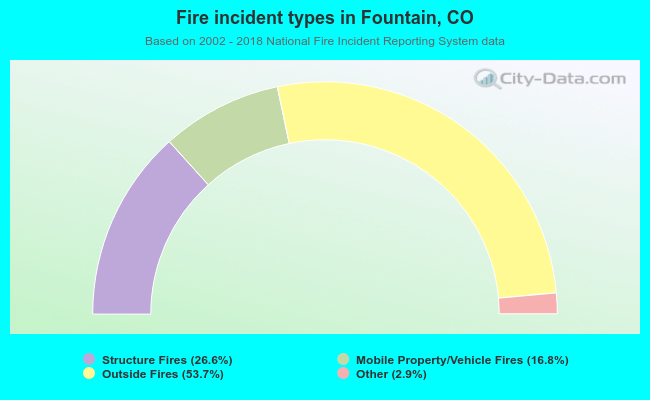 When looking into fire subcategories, the most reports belonged to: Outside Fires (53.7%), and Structure Fires (26.6%).
| Most common first names in Fountain, CO among deceased individuals | ||
| Name | Count | Lived (average) |
|---|---|---|
| John | 37 | 69.0 years |
| Robert | 33 | 65.9 years |
| Mary | 32 | 73.7 years |
| William | 30 | 70.9 years |
| James | 24 | 70.0 years |
| Charles | 22 | 72.1 years |
| George | 20 | 69.1 years |
| Donald | 13 | 66.2 years |
| Margaret | 12 | 76.7 years |
| Joe | 11 | 71.7 years |
| Most common last names in Fountain, CO among deceased individuals | ||
| Last name | Count | Lived (average) |
|---|---|---|
| Smith | 15 | 69.1 years |
| Brown | 11 | 72.8 years |
| Martinez | 9 | 81.4 years |
| Johnson | 9 | 74.1 years |
| Trujillo | 9 | 70.7 years |
| Davis | 8 | 71.0 years |
| Miller | 7 | 78.7 years |
| Ryan | 6 | 67.0 years |
| Christian | 6 | 69.5 years |
| Wilson | 6 | 74.7 years |
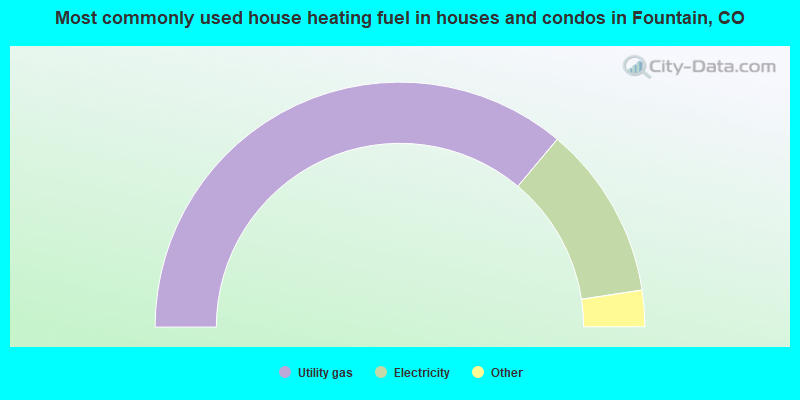
- 72.2%Utility gas
- 23.0%Electricity
- 3.5%Bottled, tank, or LP gas
- 0.8%No fuel used
- 0.2%Wood
- 0.2%Solar energy
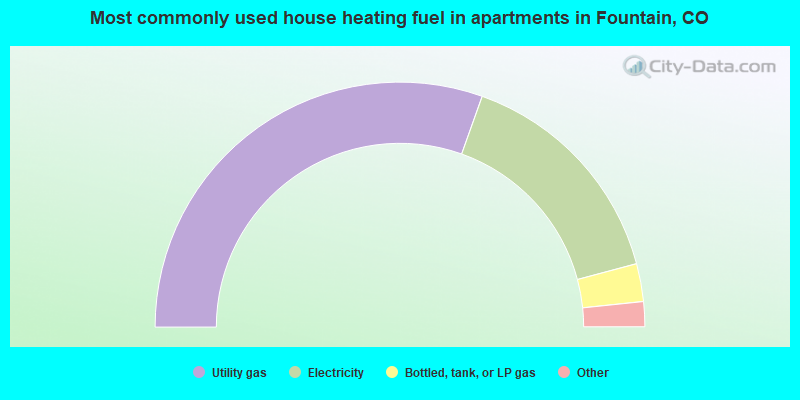
- 60.9%Utility gas
- 30.8%Electricity
- 5.0%Bottled, tank, or LP gas
- 2.7%No fuel used
- 0.6%Fuel oil, kerosene, etc.
Fountain compared to Colorado state average:
- Unemployed percentage below state average.
- Black race population percentage significantly above state average.
- Hispanic race population percentage above state average.
- Median age significantly below state average.
- House age below state average.
- Number of college students above state average.
Fountain on our top lists:
- #77 on the list of "Top 101 cities with largest percentage of males in occupations: fire fighting and prevention workers including supervisors (population 5,000+)"
- #77 on the list of "Top 101 cities with largest percentage of males in industries: public administration (population 5,000+)"
- #96 on the list of "Top 101 cities with largest percentage of females in industries: public administration (population 5,000+)"
- #30 on the list of "Top 101 counties with the highest percentage of residents relocating from foreign countries between 2010 and 2011 (pop. 50,000+)"
- #32 on the list of "Top 101 counties with the lowest average weight of females"
- #39 on the list of "Top 101 counties with the highest percentage of residents that exercised in the past month"
- #42 on the list of "Top 101 counties with the highest percentage of residents relocating to foreign countries in 2011 (pop. 50,000+)"
- #43 on the list of "Top 101 counties with the highest Particulate Matter (PM10) Annual air pollution readings in 2012 (µg/m3)"

|
|
Total of 20 patent applications in 2008-2024.