Security-Widefield, Colorado Submit your own pictures of this place and show them to the world
OSM Map
General Map
Google Map
MSN Map
OSM Map
General Map
Google Map
MSN Map
OSM Map
General Map
Google Map
MSN Map
OSM Map
General Map
Google Map
MSN Map
Please wait while loading the map...
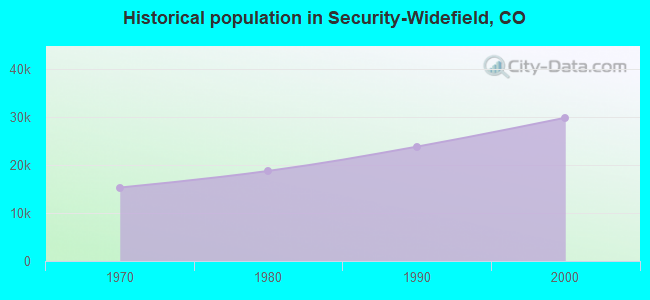
Population in 2010: 32,882. Population change since 2000: +10.2%Males: 16,462 Females: 16,420
March 2022 cost of living index in Security-Widefield: 99.7 (near average, U.S. average is 100) Percentage of residents living in poverty in 2022: 9.6%for White Non-Hispanic residents , 16.7% for Black residents , 13.5% for Hispanic or Latino residents , 13.2% for American Indian residents , 12.6% for Native Hawaiian and other Pacific Islander residents , 5.0% for other race residents , 14.8% for two or more races residents )
Profiles of local businesses
Business Search - 14 Million verified businesses
Data:
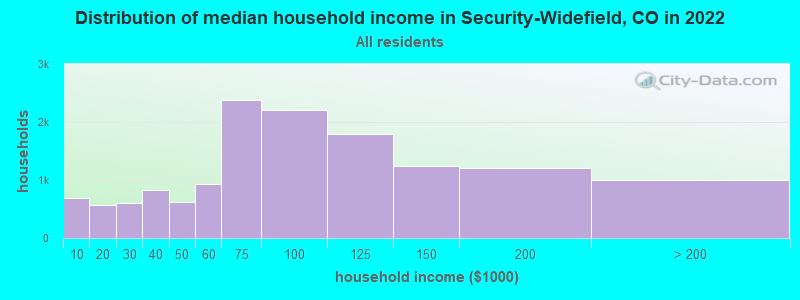
Median household income ($)
Median household income (% change since 2000)
Household income diversity
Ratio of average income to average house value (%)
Ratio of average income to average rent
Median household income ($) - White
Median household income ($) - Black or African American
Median household income ($) - Asian
Median household income ($) - Hispanic or Latino
Median household income ($) - American Indian and Alaska Native
Median household income ($) - Multirace
Median household income ($) - Other Race
Median household income for houses/condos with a mortgage ($)
Median household income for apartments without a mortgage ($)
Races - White alone (%)
Races - White alone (% change since 2000)
Races - Black alone (%)
Races - Black alone (% change since 2000)
Races - American Indian alone (%)
Races - American Indian alone (% change since 2000)
Races - Asian alone (%)
Races - Asian alone (% change since 2000)
Races - Hispanic (%)
Races - Hispanic (% change since 2000)
Races - Native Hawaiian and Other Pacific Islander alone (%)
Races - Native Hawaiian and Other Pacific Islander alone (% change since 2000)
Races - Two or more races (%)
Races - Two or more races (% change since 2000)
Races - Other race alone (%)
Races - Other race alone (% change since 2000)
Racial diversity
Unemployment (%)
Unemployment (% change since 2000)
Unemployment (%) - White
Unemployment (%) - Black or African American
Unemployment (%) - Asian
Unemployment (%) - Hispanic or Latino
Unemployment (%) - American Indian and Alaska Native
Unemployment (%) - Multirace
Unemployment (%) - Other Race
Population density (people per square mile)
Population - Males (%)
Population - Females (%)
Population - Males (%) - White
Population - Males (%) - Black or African American
Population - Males (%) - Asian
Population - Males (%) - Hispanic or Latino
Population - Males (%) - American Indian and Alaska Native
Population - Males (%) - Multirace
Population - Males (%) - Other Race
Population - Females (%) - White
Population - Females (%) - Black or African American
Population - Females (%) - Asian
Population - Females (%) - Hispanic or Latino
Population - Females (%) - American Indian and Alaska Native
Population - Females (%) - Multirace
Population - Females (%) - Other Race
Coronavirus confirmed cases (Apr 28, 2024)
Deaths caused by coronavirus (Apr 28, 2024)
Coronavirus confirmed cases (per 100k population) (Apr 28, 2024)
Deaths caused by coronavirus (per 100k population) (Apr 28, 2024)
Daily increase in number of cases (Apr 28, 2024)
Weekly increase in number of cases (Apr 28, 2024)
Cases doubled (in days) (Apr 28, 2024)
Hospitalized patients (Apr 18, 2022)
Negative test results (Apr 18, 2022)
Total test results (Apr 18, 2022)
COVID Vaccine doses distributed (per 100k population) (Sep 19, 2023)
COVID Vaccine doses administered (per 100k population) (Sep 19, 2023)
COVID Vaccine doses distributed (Sep 19, 2023)
COVID Vaccine doses administered (Sep 19, 2023)
Likely homosexual households (%)
Likely homosexual households (% change since 2000)
Likely homosexual households - Lesbian couples (%)
Likely homosexual households - Lesbian couples (% change since 2000)
Likely homosexual households - Gay men (%)
Likely homosexual households - Gay men (% change since 2000)
Cost of living index
Median gross rent ($)
Median contract rent ($)
Median monthly housing costs ($)
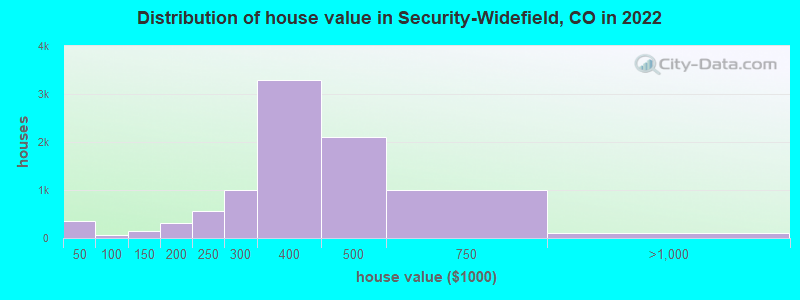
Median house or condo value ($)
Median house or condo value ($ change since 2000)
Mean house or condo value by units in structure - 1, detached ($)
Mean house or condo value by units in structure - 1, attached ($)
Mean house or condo value by units in structure - 2 ($)
Mean house or condo value by units in structure by units in structure - 3 or 4 ($)
Mean house or condo value by units in structure - 5 or more ($)
Mean house or condo value by units in structure - Boat, RV, van, etc. ($)
Mean house or condo value by units in structure - Mobile home ($)
Median house or condo value ($) - White
Median house or condo value ($) - Black or African American
Median house or condo value ($) - Asian
Median house or condo value ($) - Hispanic or Latino
Median house or condo value ($) - American Indian and Alaska Native
Median house or condo value ($) - Multirace
Median house or condo value ($) - Other Race
Median resident age
Resident age diversity
Median resident age - Males
Median resident age - Females
Median resident age - White
Median resident age - Black or African American
Median resident age - Asian
Median resident age - Hispanic or Latino
Median resident age - American Indian and Alaska Native
Median resident age - Multirace
Median resident age - Other Race
Median resident age - Males - White
Median resident age - Males - Black or African American
Median resident age - Males - Asian
Median resident age - Males - Hispanic or Latino
Median resident age - Males - American Indian and Alaska Native
Median resident age - Males - Multirace
Median resident age - Males - Other Race
Median resident age - Females - White
Median resident age - Females - Black or African American
Median resident age - Females - Asian
Median resident age - Females - Hispanic or Latino
Median resident age - Females - American Indian and Alaska Native
Median resident age - Females - Multirace
Median resident age - Females - Other Race
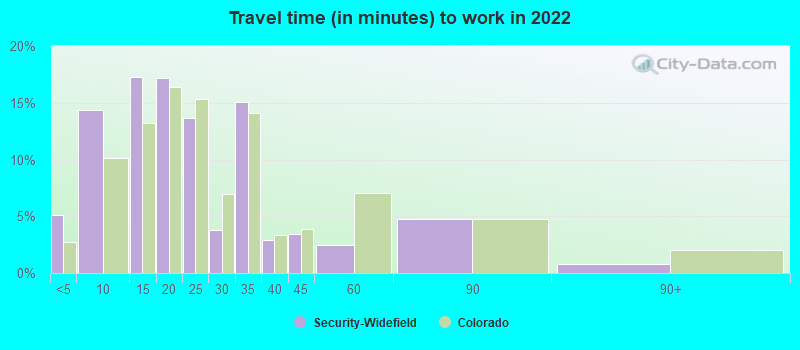
Commute - mean travel time to work (minutes)
Travel time to work - Less than 5 minutes (%)
Travel time to work - Less than 5 minutes (% change since 2000)
Travel time to work - 5 to 9 minutes (%)
Travel time to work - 5 to 9 minutes (% change since 2000)
Travel time to work - 10 to 19 minutes (%)
Travel time to work - 10 to 19 minutes (% change since 2000)
Travel time to work - 20 to 29 minutes (%)
Travel time to work - 20 to 29 minutes (% change since 2000)
Travel time to work - 30 to 39 minutes (%)
Travel time to work - 30 to 39 minutes (% change since 2000)
Travel time to work - 40 to 59 minutes (%)
Travel time to work - 40 to 59 minutes (% change since 2000)
Travel time to work - 60 to 89 minutes (%)
Travel time to work - 60 to 89 minutes (% change since 2000)
Travel time to work - 90 or more minutes (%)
Travel time to work - 90 or more minutes (% change since 2000)
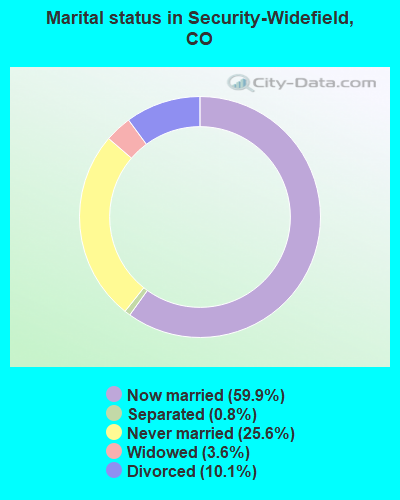
Marital status - Never married (%)
Marital status - Now married (%)
Marital status - Separated (%)
Marital status - Widowed (%)
Marital status - Divorced (%)
Median family income ($)
Median family income (% change since 2000)
Median non-family income ($)
Median non-family income (% change since 2000)
Median per capita income ($)
Median per capita income (% change since 2000)
Median family income ($) - White
Median family income ($) - Black or African American
Median family income ($) - Asian
Median family income ($) - Hispanic or Latino
Median family income ($) - American Indian and Alaska Native
Median family income ($) - Multirace
Median family income ($) - Other Race
Median year house/condo built
Median year apartment built
Year house built - Built 2005 or later (%)
Year house built - Built 2000 to 2004 (%)
Year house built - Built 1990 to 1999 (%)
Year house built - Built 1980 to 1989 (%)
Year house built - Built 1970 to 1979 (%)
Year house built - Built 1960 to 1969 (%)
Year house built - Built 1950 to 1959 (%)
Year house built - Built 1940 to 1949 (%)
Year house built - Built 1939 or earlier (%)
Average household size
Household density (households per square mile)
Average household size - White
Average household size - Black or African American
Average household size - Asian
Average household size - Hispanic or Latino
Average household size - American Indian and Alaska Native
Average household size - Multirace
Average household size - Other Race
Occupied housing units (%)
Vacant housing units (%)
Owner occupied housing units (%)
Renter occupied housing units (%)
Vacancy status - For rent (%)
Vacancy status - For sale only (%)
Vacancy status - Rented or sold, not occupied (%)
Vacancy status - For seasonal, recreational, or occasional use (%)
Vacancy status - For migrant workers (%)
Vacancy status - Other vacant (%)
Residents with income below the poverty level (%)
Residents with income below 50% of the poverty level (%)
Children below poverty level (%)
Poor families by family type - Married-couple family (%)
Poor families by family type - Male, no wife present (%)
Poor families by family type - Female, no husband present (%)
Poverty status for native-born residents (%)
Poverty status for foreign-born residents (%)
Poverty among high school graduates not in families (%)
Poverty among people who did not graduate high school not in families (%)
Residents with income below the poverty level (%) - White
Residents with income below the poverty level (%) - Black or African American
Residents with income below the poverty level (%) - Asian
Residents with income below the poverty level (%) - Hispanic or Latino
Residents with income below the poverty level (%) - American Indian and Alaska Native
Residents with income below the poverty level (%) - Multirace
Residents with income below the poverty level (%) - Other Race
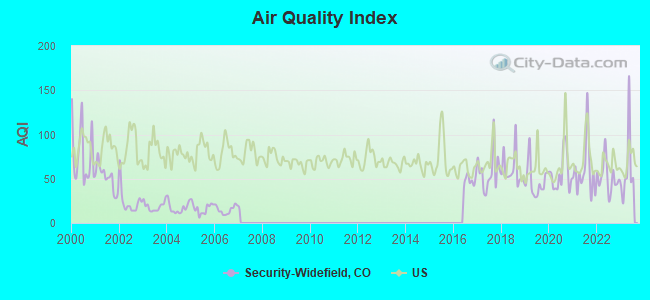
Air pollution - Air Quality Index (AQI)
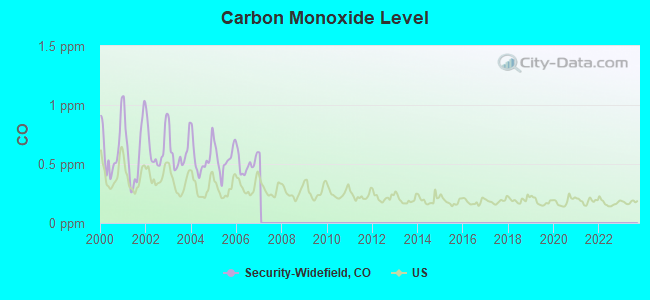
Air pollution - CO
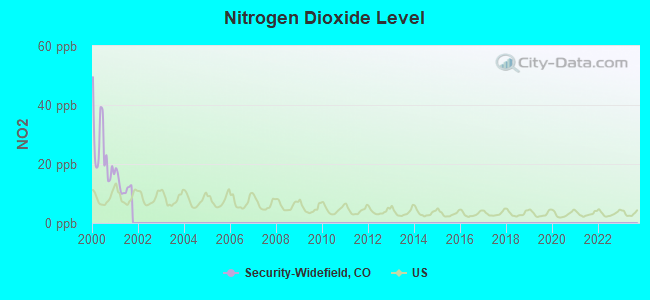
Air pollution - NO2
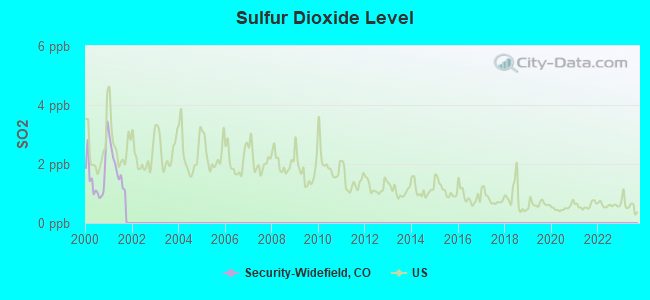
Air pollution - SO2
Air pollution - Ozone
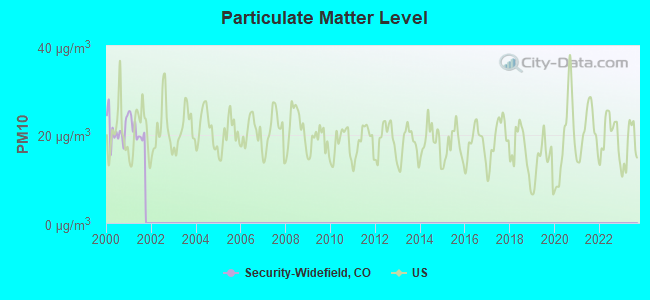
Air pollution - PM10
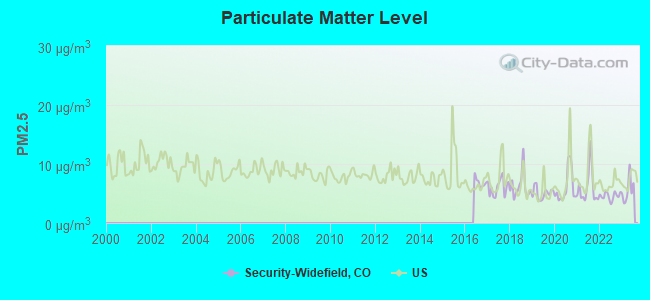
Air pollution - PM25
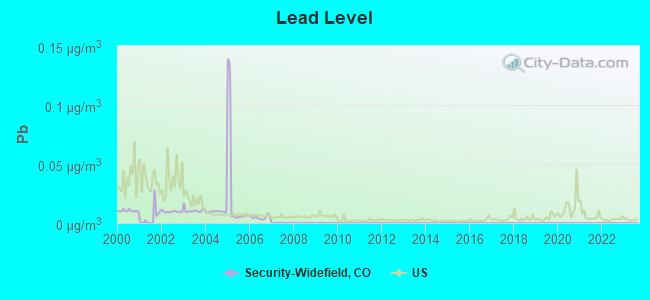
Air pollution - Pb
Crime - Murders per 100,000 population
Crime - Rapes per 100,000 population
Crime - Robberies per 100,000 population
Crime - Assaults per 100,000 population
Crime - Burglaries per 100,000 population
Crime - Thefts per 100,000 population
Crime - Auto thefts per 100,000 population
Crime - Arson per 100,000 population
Crime - City-data.com crime index
Crime - Violent crime index
Crime - Property crime index
Crime - Murders per 100,000 population (5 year average)
Crime - Rapes per 100,000 population (5 year average)
Crime - Robberies per 100,000 population (5 year average)
Crime - Assaults per 100,000 population (5 year average)
Crime - Burglaries per 100,000 population (5 year average)
Crime - Thefts per 100,000 population (5 year average)
Crime - Auto thefts per 100,000 population (5 year average)
Crime - Arson per 100,000 population (5 year average)
Crime - City-data.com crime index (5 year average)
Crime - Violent crime index (5 year average)
Crime - Property crime index (5 year average)
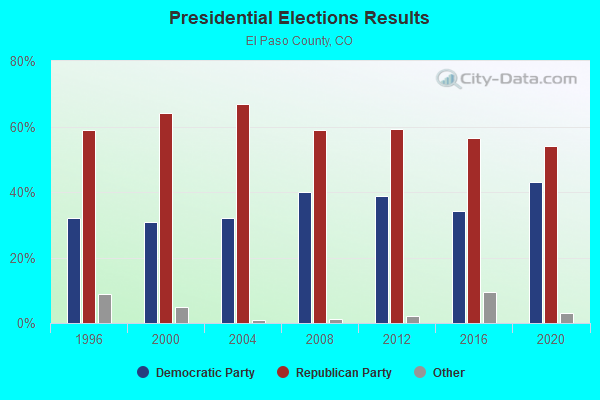
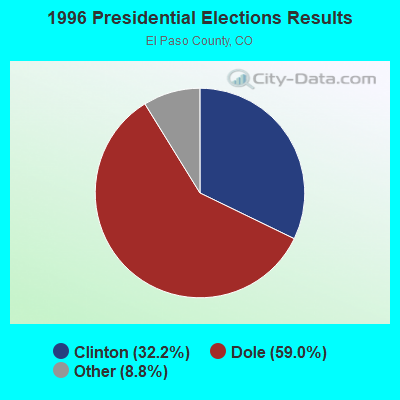
1996 Presidential Elections Results (%) - Democratic Party (Clinton)
1996 Presidential Elections Results (%) - Republican Party (Dole)
1996 Presidential Elections Results (%) - Other
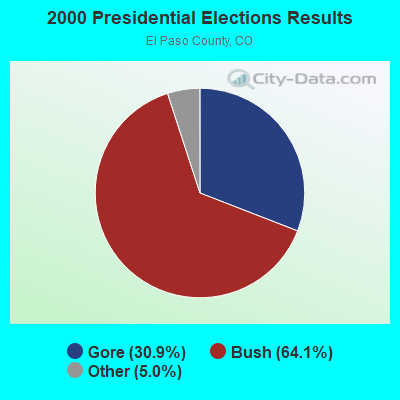
2000 Presidential Elections Results (%) - Democratic Party (Gore)
2000 Presidential Elections Results (%) - Republican Party (Bush)
2000 Presidential Elections Results (%) - Other
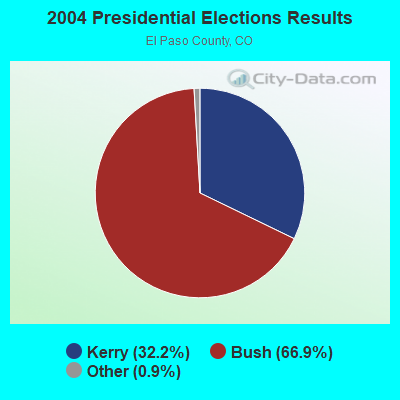
2004 Presidential Elections Results (%) - Democratic Party (Kerry)
2004 Presidential Elections Results (%) - Republican Party (Bush)
2004 Presidential Elections Results (%) - Other
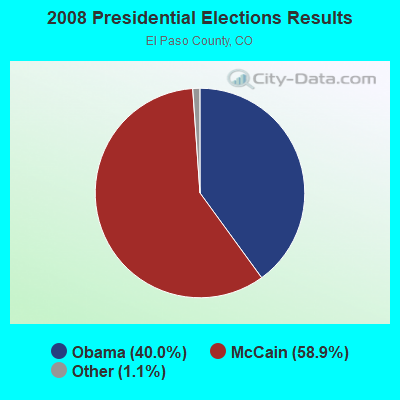
2008 Presidential Elections Results (%) - Democratic Party (Obama)
2008 Presidential Elections Results (%) - Republican Party (McCain)
2008 Presidential Elections Results (%) - Other
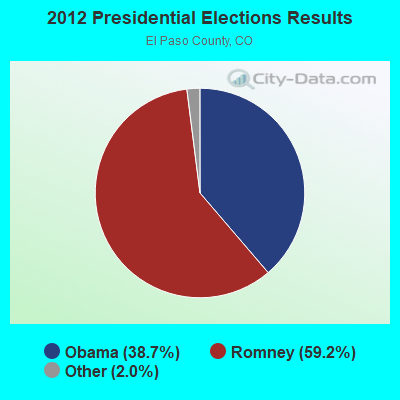
2012 Presidential Elections Results (%) - Democratic Party (Obama)
2012 Presidential Elections Results (%) - Republican Party (Romney)
2012 Presidential Elections Results (%) - Other
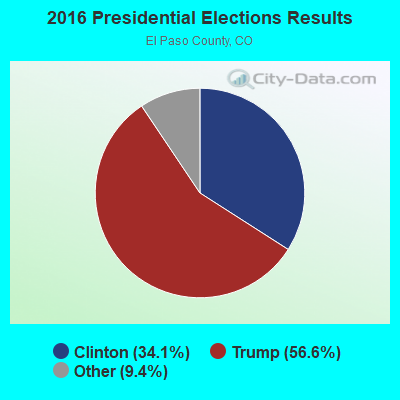
2016 Presidential Elections Results (%) - Democratic Party (Clinton)
2016 Presidential Elections Results (%) - Republican Party (Trump)
2016 Presidential Elections Results (%) - Other
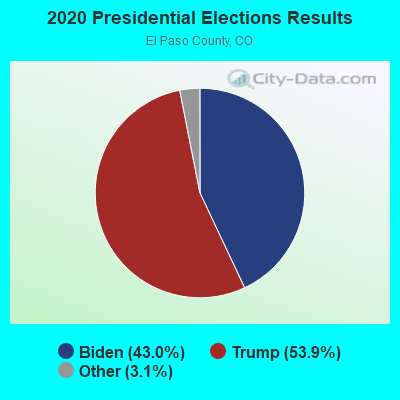
2020 Presidential Elections Results (%) - Democratic Party (Biden)
2020 Presidential Elections Results (%) - Republican Party (Trump)
2020 Presidential Elections Results (%) - Other
Ancestries Reported - Arab (%)
Ancestries Reported - Czech (%)
Ancestries Reported - Danish (%)
Ancestries Reported - Dutch (%)
Ancestries Reported - English (%)
Ancestries Reported - French (%)
Ancestries Reported - French Canadian (%)
Ancestries Reported - German (%)
Ancestries Reported - Greek (%)
Ancestries Reported - Hungarian (%)
Ancestries Reported - Irish (%)
Ancestries Reported - Italian (%)
Ancestries Reported - Lithuanian (%)
Ancestries Reported - Norwegian (%)
Ancestries Reported - Polish (%)
Ancestries Reported - Portuguese (%)
Ancestries Reported - Russian (%)
Ancestries Reported - Scotch-Irish (%)
Ancestries Reported - Scottish (%)
Ancestries Reported - Slovak (%)
Ancestries Reported - Subsaharan African (%)
Ancestries Reported - Swedish (%)
Ancestries Reported - Swiss (%)
Ancestries Reported - Ukrainian (%)
Ancestries Reported - United States (%)
Ancestries Reported - Welsh (%)
Ancestries Reported - West Indian (%)
Ancestries Reported - Other (%)
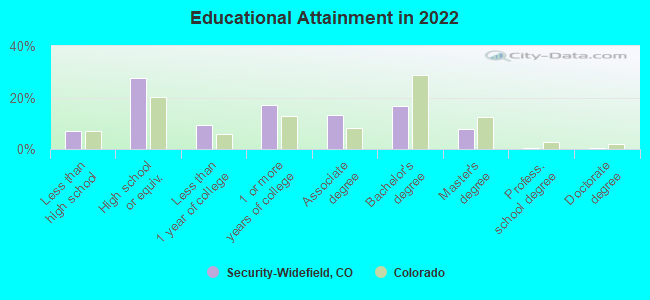
Educational Attainment - No schooling completed (%)
Educational Attainment - Less than high school (%)
Educational Attainment - High school or equivalent (%)
Educational Attainment - Less than 1 year of college (%)
Educational Attainment - 1 or more years of college (%)
Educational Attainment - Associate degree (%)
Educational Attainment - Bachelor's degree (%)
Educational Attainment - Master's degree (%)
Educational Attainment - Professional school degree (%)
Educational Attainment - Doctorate degree (%)
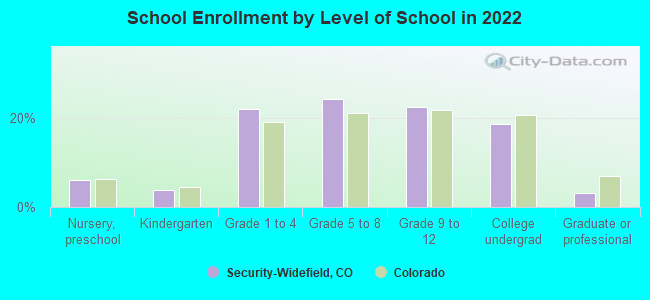
School Enrollment - Nursery, preschool (%)
School Enrollment - Kindergarten (%)
School Enrollment - Grade 1 to 4 (%)
School Enrollment - Grade 5 to 8 (%)
School Enrollment - Grade 9 to 12 (%)
School Enrollment - College undergrad (%)
School Enrollment - Graduate or professional (%)
School Enrollment - Not enrolled in school (%)
School enrollment - Public schools (%)
School enrollment - Private schools (%)
School enrollment - Not enrolled (%)
Median number of rooms in houses and condos
Median number of rooms in apartments
Housing units lacking complete plumbing facilities (%)
Housing units lacking complete kitchen facilities (%)
Density of houses
Urban houses (%)
Rural houses (%)
Households with people 60 years and over (%)
Households with people 65 years and over (%)
Households with people 75 years and over (%)
Households with one or more nonrelatives (%)
Households with no nonrelatives (%)
Population in households (%)
Family households (%)
Nonfamily households (%)
Population in families (%)
Family households with own children (%)
Median number of bedrooms in owner occupied houses
Mean number of bedrooms in owner occupied houses
Median number of bedrooms in renter occupied houses
Mean number of bedrooms in renter occupied houses
Median number of vehichles in owner occupied houses
Mean number of vehichles in owner occupied houses
Median number of vehichles in renter occupied houses
Mean number of vehichles in renter occupied houses
Mortgage status - with mortgage (%)
Mortgage status - with second mortgage (%)
Mortgage status - with home equity loan (%)
Mortgage status - with both second mortgage and home equity loan (%)
Mortgage status - without a mortgage (%)
Average family size
Average family size - White
Average family size - Black or African American
Average family size - Asian
Average family size - Hispanic or Latino
Average family size - American Indian and Alaska Native
Average family size - Multirace
Average family size - Other Race
Geographical mobility - Same house 1 year ago (%)
Geographical mobility - Moved within same county (%)
Geographical mobility - Moved from different county within same state (%)
Geographical mobility - Moved from different state (%)
Geographical mobility - Moved from abroad (%)
Place of birth - Born in state of residence (%)
Place of birth - Born in other state (%)
Place of birth - Native, outside of US (%)
Place of birth - Foreign born (%)
Housing units in structures - 1, detached (%)
Housing units in structures - 1, attached (%)
Housing units in structures - 2 (%)
Housing units in structures - 3 or 4 (%)
Housing units in structures - 5 to 9 (%)
Housing units in structures - 10 to 19 (%)
Housing units in structures - 20 to 49 (%)
Housing units in structures - 50 or more (%)
Housing units in structures - Mobile home (%)
Housing units in structures - Boat, RV, van, etc. (%)
House/condo owner moved in on average (years ago)
Renter moved in on average (years ago)
Year householder moved into unit - Moved in 1999 to March 2000 (%)
Year householder moved into unit - Moved in 1995 to 1998 (%)
Year householder moved into unit - Moved in 1990 to 1994 (%)
Year householder moved into unit - Moved in 1980 to 1989 (%)
Year householder moved into unit - Moved in 1970 to 1979 (%)
Year householder moved into unit - Moved in 1969 or earlier (%)
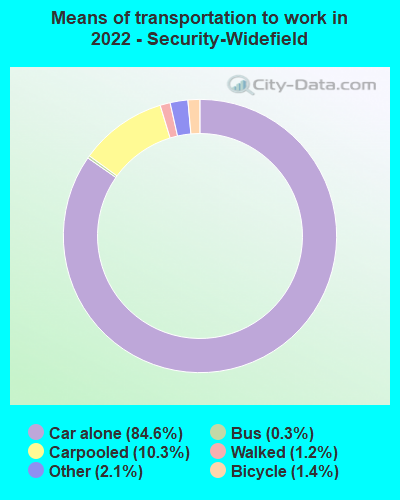
Means of transportation to work - Drove car alone (%)
Means of transportation to work - Carpooled (%)
Means of transportation to work - Public transportation (%)
Means of transportation to work - Bus or trolley bus (%)
Means of transportation to work - Streetcar or trolley car (%)
Means of transportation to work - Subway or elevated (%)
Means of transportation to work - Railroad (%)
Means of transportation to work - Ferryboat (%)
Means of transportation to work - Taxicab (%)
Means of transportation to work - Motorcycle (%)
Means of transportation to work - Bicycle (%)
Means of transportation to work - Walked (%)
Means of transportation to work - Other means (%)
Working at home (%)
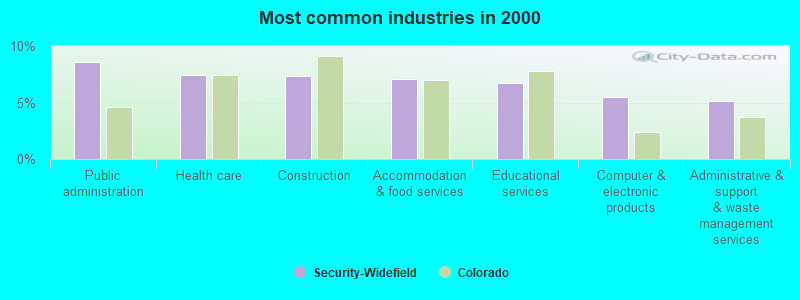
Industry diversity
Most Common Industries - Agriculture, forestry, fishing and hunting, and mining (%)
Most Common Industries - Agriculture, forestry, fishing and hunting (%)
Most Common Industries - Mining, quarrying, and oil and gas extraction (%)
Most Common Industries - Construction (%)
Most Common Industries - Manufacturing (%)
Most Common Industries - Wholesale trade (%)
Most Common Industries - Retail trade (%)
Most Common Industries - Transportation and warehousing, and utilities (%)
Most Common Industries - Transportation and warehousing (%)
Most Common Industries - Utilities (%)
Most Common Industries - Information (%)
Most Common Industries - Finance and insurance, and real estate and rental and leasing (%)
Most Common Industries - Finance and insurance (%)
Most Common Industries - Real estate and rental and leasing (%)
Most Common Industries - Professional, scientific, and management, and administrative and waste management services (%)
Most Common Industries - Professional, scientific, and technical services (%)
Most Common Industries - Management of companies and enterprises (%)
Most Common Industries - Administrative and support and waste management services (%)
Most Common Industries - Educational services, and health care and social assistance (%)
Most Common Industries - Educational services (%)
Most Common Industries - Health care and social assistance (%)
Most Common Industries - Arts, entertainment, and recreation, and accommodation and food services (%)
Most Common Industries - Arts, entertainment, and recreation (%)
Most Common Industries - Accommodation and food services (%)
Most Common Industries - Other services, except public administration (%)
Most Common Industries - Public administration (%)
Occupation diversity
Most Common Occupations - Management, business, science, and arts occupations (%)
Most Common Occupations - Management, business, and financial occupations (%)
Most Common Occupations - Management occupations (%)
Most Common Occupations - Business and financial operations occupations (%)
Most Common Occupations - Computer, engineering, and science occupations (%)
Most Common Occupations - Computer and mathematical occupations (%)
Most Common Occupations - Architecture and engineering occupations (%)
Most Common Occupations - Life, physical, and social science occupations (%)
Most Common Occupations - Education, legal, community service, arts, and media occupations (%)
Most Common Occupations - Community and social service occupations (%)
Most Common Occupations - Legal occupations (%)
Most Common Occupations - Education, training, and library occupations (%)
Most Common Occupations - Arts, design, entertainment, sports, and media occupations (%)
Most Common Occupations - Healthcare practitioners and technical occupations (%)
Most Common Occupations - Health diagnosing and treating practitioners and other technical occupations (%)
Most Common Occupations - Health technologists and technicians (%)
Most Common Occupations - Service occupations (%)
Most Common Occupations - Healthcare support occupations (%)
Most Common Occupations - Protective service occupations (%)
Most Common Occupations - Fire fighting and prevention, and other protective service workers including supervisors (%)
Most Common Occupations - Law enforcement workers including supervisors (%)
Most Common Occupations - Food preparation and serving related occupations (%)
Most Common Occupations - Building and grounds cleaning and maintenance occupations (%)
Most Common Occupations - Personal care and service occupations (%)
Most Common Occupations - Sales and office occupations (%)
Most Common Occupations - Sales and related occupations (%)
Most Common Occupations - Office and administrative support occupations (%)
Most Common Occupations - Natural resources, construction, and maintenance occupations (%)
Most Common Occupations - Farming, fishing, and forestry occupations (%)
Most Common Occupations - Construction and extraction occupations (%)
Most Common Occupations - Installation, maintenance, and repair occupations (%)
Most Common Occupations - Production, transportation, and material moving occupations (%)
Most Common Occupations - Production occupations (%)
Most Common Occupations - Transportation occupations (%)
Most Common Occupations - Material moving occupations (%)
People in Group quarters - Institutionalized population (%)
People in Group quarters - Correctional institutions (%)
People in Group quarters - Federal prisons and detention centers (%)
People in Group quarters - Halfway houses (%)
People in Group quarters - Local jails and other confinement facilities (including police lockups) (%)
People in Group quarters - Military disciplinary barracks (%)
People in Group quarters - State prisons (%)
People in Group quarters - Other types of correctional institutions (%)
People in Group quarters - Nursing homes (%)
People in Group quarters - Hospitals/wards, hospices, and schools for the handicapped (%)
People in Group quarters - Hospitals/wards and hospices for chronically ill (%)
People in Group quarters - Hospices or homes for chronically ill (%)
People in Group quarters - Military hospitals or wards for chronically ill (%)
People in Group quarters - Other hospitals or wards for chronically ill (%)
People in Group quarters - Hospitals or wards for drug/alcohol abuse (%)
People in Group quarters - Mental (Psychiatric) hospitals or wards (%)
People in Group quarters - Schools, hospitals, or wards for the mentally retarded (%)
People in Group quarters - Schools, hospitals, or wards for the physically handicapped (%)
People in Group quarters - Institutions for the deaf (%)
People in Group quarters - Institutions for the blind (%)
People in Group quarters - Orthopedic wards and institutions for the physically handicapped (%)
People in Group quarters - Wards in general hospitals for patients who have no usual home elsewhere (%)
People in Group quarters - Wards in military hospitals for patients who have no usual home elsewhere (%)
People in Group quarters - Juvenile institutions (%)
People in Group quarters - Long-term care (%)
People in Group quarters - Homes for abused, dependent, and neglected children (%)
People in Group quarters - Residential treatment centers for emotionally disturbed children (%)
People in Group quarters - Training schools for juvenile delinquents (%)
People in Group quarters - Short-term care, detention or diagnostic centers for delinquent children (%)
People in Group quarters - Type of juvenile institution unknown (%)
People in Group quarters - Noninstitutionalized population (%)
People in Group quarters - College dormitories (includes college quarters off campus) (%)
People in Group quarters - Military quarters (%)
People in Group quarters - On base (%)
People in Group quarters - Barracks, unaccompanied personnel housing (UPH), (Enlisted/Officer), ;and similar group living quarters for military personnel (%)
People in Group quarters - Transient quarters for temporary residents (%)
People in Group quarters - Military ships (%)
People in Group quarters - Group homes (%)
People in Group quarters - Homes or halfway houses for drug/alcohol abuse (%)
People in Group quarters - Homes for the mentally ill (%)
People in Group quarters - Homes for the mentally retarded (%)
People in Group quarters - Homes for the physically handicapped (%)
People in Group quarters - Other group homes (%)
People in Group quarters - Religious group quarters (%)
People in Group quarters - Dormitories (%)
People in Group quarters - Agriculture workers' dormitories on farms (%)
People in Group quarters - Job Corps and vocational training facilities (%)
People in Group quarters - Other workers' dormitories (%)
People in Group quarters - Crews of maritime vessels (%)
People in Group quarters - Other nonhousehold living situations (%)
People in Group quarters - Other noninstitutional group quarters (%)
Residents speaking English at home (%)
Residents speaking English at home - Born in the United States (%)
Residents speaking English at home - Native, born elsewhere (%)
Residents speaking English at home - Foreign born (%)
Residents speaking Spanish at home (%)
Residents speaking Spanish at home - Born in the United States (%)
Residents speaking Spanish at home - Native, born elsewhere (%)
Residents speaking Spanish at home - Foreign born (%)
Residents speaking other language at home (%)
Residents speaking other language at home - Born in the United States (%)
Residents speaking other language at home - Native, born elsewhere (%)
Residents speaking other language at home - Foreign born (%)
Class of Workers - Employee of private company (%)
Class of Workers - Self-employed in own incorporated business (%)
Class of Workers - Private not-for-profit wage and salary workers (%)
Class of Workers - Local government workers (%)
Class of Workers - State government workers (%)
Class of Workers - Federal government workers (%)
Class of Workers - Self-employed workers in own not incorporated business and Unpaid family workers (%)
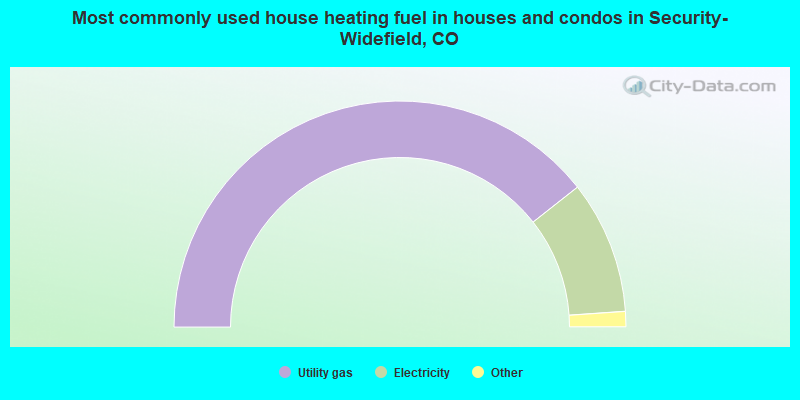
House heating fuel used in houses and condos - Utility gas (%)
House heating fuel used in houses and condos - Bottled, tank, or LP gas (%)
House heating fuel used in houses and condos - Electricity (%)
House heating fuel used in houses and condos - Fuel oil, kerosene, etc. (%)
House heating fuel used in houses and condos - Coal or coke (%)
House heating fuel used in houses and condos - Wood (%)
House heating fuel used in houses and condos - Solar energy (%)
House heating fuel used in houses and condos - Other fuel (%)
House heating fuel used in houses and condos - No fuel used (%)
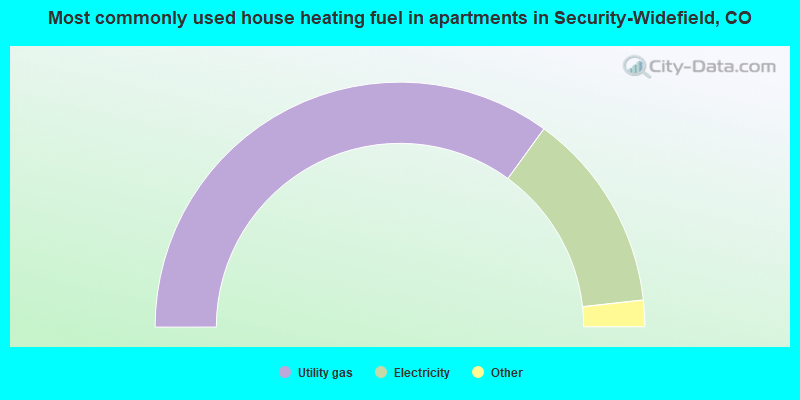
House heating fuel used in apartments - Utility gas (%)
House heating fuel used in apartments - Bottled, tank, or LP gas (%)
House heating fuel used in apartments - Electricity (%)
House heating fuel used in apartments - Fuel oil, kerosene, etc. (%)
House heating fuel used in apartments - Coal or coke (%)
House heating fuel used in apartments - Wood (%)
House heating fuel used in apartments - Solar energy (%)
House heating fuel used in apartments - Other fuel (%)
House heating fuel used in apartments - No fuel used (%)
Armed forces status - In Armed Forces (%)
Armed forces status - Civilian (%)
Armed forces status - Civilian - Veteran (%)
Armed forces status - Civilian - Nonveteran (%)
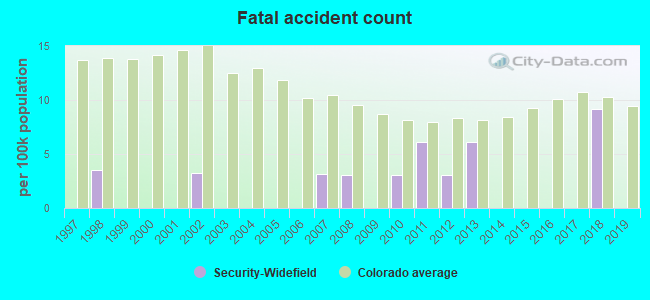
Fatal accidents locations in years 2005-2021
Fatal accidents locations in 2005
Fatal accidents locations in 2006
Fatal accidents locations in 2007
Fatal accidents locations in 2008
Fatal accidents locations in 2009
Fatal accidents locations in 2010
Fatal accidents locations in 2011
Fatal accidents locations in 2012
Fatal accidents locations in 2013
Fatal accidents locations in 2014
Fatal accidents locations in 2015
Fatal accidents locations in 2016
Fatal accidents locations in 2017
Fatal accidents locations in 2018
Fatal accidents locations in 2019
Fatal accidents locations in 2020
Fatal accidents locations in 2021
Alcohol use - People drinking some alcohol every month (%)
Alcohol use - People not drinking at all (%)
Alcohol use - Average days/month drinking alcohol
Alcohol use - Average drinks/week
Alcohol use - Average days/year people drink much
Audiometry - Average condition of hearing (%)
Audiometry - People that can hear a whisper from across a quiet room (%)
Audiometry - People that can hear normal voice from across a quiet room (%)
Audiometry - Ears ringing, roaring, buzzing (%)
Audiometry - Had a job exposure to loud noise (%)
Audiometry - Had off-work exposure to loud noise (%)
Blood Pressure & Cholesterol - Has high blood pressure (%)
Blood Pressure & Cholesterol - Checking blood pressure at home (%)
Blood Pressure & Cholesterol - Frequently checking blood cholesterol (%)
Blood Pressure & Cholesterol - Has high cholesterol level (%)
Consumer Behavior - Money monthly spent on food at supermarket/grocery store
Consumer Behavior - Money monthly spent on food at other stores
Consumer Behavior - Money monthly spent on eating out
Consumer Behavior - Money monthly spent on carryout/delivered foods
Consumer Behavior - Income spent on food at supermarket/grocery store (%)
Consumer Behavior - Income spent on food at other stores (%)
Consumer Behavior - Income spent on eating out (%)
Consumer Behavior - Income spent on carryout/delivered foods (%)
Current Health Status - General health condition (%)
Current Health Status - Blood donors (%)
Current Health Status - Has blood ever tested for HIV virus (%)
Current Health Status - Left-handed people (%)
Dermatology - People using sunscreen (%)
Diabetes - Diabetics (%)
Diabetes - Had a blood test for high blood sugar (%)
Diabetes - People taking insulin (%)
Diet Behavior & Nutrition - Diet health (%)
Diet Behavior & Nutrition - Milk product consumption (# of products/month)
Diet Behavior & Nutrition - Meals not home prepared (#/week)
Diet Behavior & Nutrition - Meals from fast food or pizza place (#/week)
Diet Behavior & Nutrition - Ready-to-eat foods (#/month)
Diet Behavior & Nutrition - Frozen meals/pizza (#/month)
Drug Use - People that ever used marijuana or hashish (%)
Drug Use - Ever used hard drugs (%)
Drug Use - Ever used any form of cocaine (%)
Drug Use - Ever used heroin (%)
Drug Use - Ever used methamphetamine (%)
Health Insurance - People covered by health insurance (%)
Kidney Conditions-Urology - Avg. # of times urinating at night
Medical Conditions - People with asthma (%)
Medical Conditions - People with anemia (%)
Medical Conditions - People with psoriasis (%)
Medical Conditions - People with overweight (%)
Medical Conditions - Elderly people having difficulties in thinking or remembering (%)
Medical Conditions - People who ever received blood transfusion (%)
Medical Conditions - People having trouble seeing even with glass/contacts (%)
Medical Conditions - People with arthritis (%)
Medical Conditions - People with gout (%)
Medical Conditions - People with congestive heart failure (%)
Medical Conditions - People with coronary heart disease (%)
Medical Conditions - People with angina pectoris (%)
Medical Conditions - People who ever had heart attack (%)
Medical Conditions - People who ever had stroke (%)
Medical Conditions - People with emphysema (%)
Medical Conditions - People with thyroid problem (%)
Medical Conditions - People with chronic bronchitis (%)
Medical Conditions - People with any liver condition (%)
Medical Conditions - People who ever had cancer or malignancy (%)
Mental Health - People who have little interest in doing things (%)
Mental Health - People feeling down, depressed, or hopeless (%)
Mental Health - People who have trouble sleeping or sleeping too much (%)
Mental Health - People feeling tired or having little energy (%)
Mental Health - People with poor appetite or overeating (%)
Mental Health - People feeling bad about themself (%)
Mental Health - People who have trouble concentrating on things (%)
Mental Health - People moving or speaking slowly or too fast (%)
Mental Health - People having thoughts they would be better off dead (%)
Oral Health - Average years since last visit a dentist
Oral Health - People embarrassed because of mouth (%)
Oral Health - People with gum disease (%)
Oral Health - General health of teeth and gums (%)
Oral Health - Average days a week using dental floss/device
Oral Health - Average days a week using mouthwash for dental problem
Oral Health - Average number of teeth
Pesticide Use - Households using pesticides to control insects (%)
Pesticide Use - Households using pesticides to kill weeds (%)
Physical Activity - People doing vigorous-intensity work activities (%)
Physical Activity - People doing moderate-intensity work activities (%)
Physical Activity - People walking or bicycling (%)
Physical Activity - People doing vigorous-intensity recreational activities (%)
Physical Activity - People doing moderate-intensity recreational activities (%)
Physical Activity - Average hours a day doing sedentary activities
Physical Activity - Average hours a day watching TV or videos
Physical Activity - Average hours a day using computer
Physical Functioning - People having limitations keeping them from working (%)
Physical Functioning - People limited in amount of work they can do (%)
Physical Functioning - People that need special equipment to walk (%)
Physical Functioning - People experiencing confusion/memory problems (%)
Physical Functioning - People requiring special healthcare equipment (%)
Prescription Medications - Average number of prescription medicines taking
Preventive Aspirin Use - Adults 40+ taking low-dose aspirin (%)
Reproductive Health - Vaginal deliveries (%)
Reproductive Health - Cesarean deliveries (%)
Reproductive Health - Deliveries resulted in a live birth (%)
Reproductive Health - Pregnancies resulted in a delivery (%)
Reproductive Health - Women breastfeeding newborns (%)
Reproductive Health - Women that had a hysterectomy (%)
Reproductive Health - Women that had both ovaries removed (%)
Reproductive Health - Women that have ever taken birth control pills (%)
Reproductive Health - Women taking birth control pills (%)
Reproductive Health - Women that have ever used Depo-Provera or injectables (%)
Reproductive Health - Women that have ever used female hormones (%)
Sexual Behavior - People 18+ that ever had sex (vaginal, anal, or oral) (%)
Sexual Behavior - Males 18+ that ever had vaginal sex with a woman (%)
Sexual Behavior - Males 18+ that ever performed oral sex on a woman (%)
Sexual Behavior - Males 18+ that ever had anal sex with a woman (%)
Sexual Behavior - Males 18+ that ever had any sex with a man (%)
Sexual Behavior - Females 18+ that ever had vaginal sex with a man (%)
Sexual Behavior - Females 18+ that ever performed oral sex on a man (%)
Sexual Behavior - Females 18+ that ever had anal sex with a man (%)
Sexual Behavior - Females 18+ that ever had any kind of sex with a woman (%)
Sexual Behavior - Average age people first had sex
Sexual Behavior - Average number of female sex partners in lifetime (males 18+)
Sexual Behavior - Average number of female vaginal sex partners in lifetime (males 18+)
Sexual Behavior - Average age people first performed oral sex on a woman (18+)
Sexual Behavior - Average number of woman performed oral sex on in lifetime (18+)
Sexual Behavior - Average number of male sex partners in lifetime (males 18+)
Sexual Behavior - Average number of male anal sex partners in lifetime (males 18+)
Sexual Behavior - Average age people first performed oral sex on a man (18+)
Sexual Behavior - Average number of male oral sex partners in lifetime (18+)
Sexual Behavior - People using protection when performing oral sex (%)
Sexual Behavior - Average number of times people have vaginal or anal sex a year
Sexual Behavior - People having sex without condom (%)
Sexual Behavior - Average number of male sex partners in lifetime (females 18+)
Sexual Behavior - Average number of male vaginal sex partners in lifetime (females 18+)
Sexual Behavior - Average number of female sex partners in lifetime (females 18+)
Sexual Behavior - Circumcised males 18+ (%)
Sleep Disorders - Average hours sleeping at night
Sleep Disorders - People that has trouble sleeping (%)
Smoking-Cigarette Use - People smoking cigarettes (%)
Taste & Smell - People 40+ having problems with smell (%)
Taste & Smell - People 40+ having problems with taste (%)
Taste & Smell - People 40+ that ever had wisdom teeth removed (%)
Taste & Smell - People 40+ that ever had tonsils teeth removed (%)
Taste & Smell - People 40+ that ever had a loss of consciousness because of a head injury (%)
Taste & Smell - People 40+ that ever had a broken nose or other serious injury to face or skull (%)
Taste & Smell - People 40+ that ever had two or more sinus infections (%)
Weight - Average height (inches)
Weight - Average weight (pounds)
Weight - Average BMI
Weight - People that are obese (%)
Weight - People that ever were obese (%)
Weight - People trying to lose weight (%)
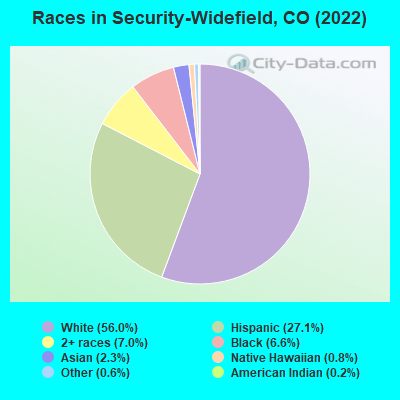
22,215 56.0% White alone 10,743 27.1% Hispanic 2,796 7.0% Two or more races 2,608 6.6% Black alone 916 2.3% Asian alone 323 0.8% Native Hawaiian and Other 252 0.6% Other race alone 72 0.2% American Indian alone
Ancestries: German (10.3%), American (8.9%), English (5.7%), Irish (3.9%), European (2.9%), African (2.9%).
Current Local Time:
Land area: 14.5 square miles.
Population density: 2,264 people per square mile (low).
2,828 residents are foreign born (2.7% Europe , 2.4% Latin America , 1.5% Asia ).
This place:
7.1%Colorado:
9.5%
Median real estate property taxes paid for housing units with mortgages in 2022: $1,541 (0.4%)Median real estate property taxes paid for housing units with no mortgage in 2022: $1,299 (0.4%)
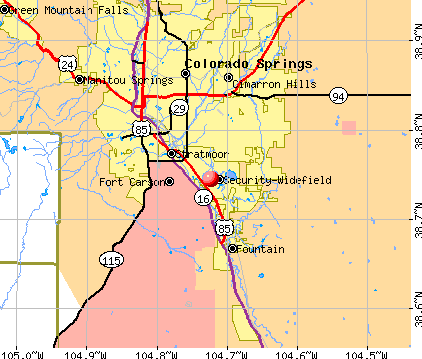
Nearest city with pop. 50,000+: Colorado Springs, CO
Nearest city with pop. 1,000,000+: Phoenix, AZ
Nearest cities:
Rock Creek Park, CO (2.6 miles),
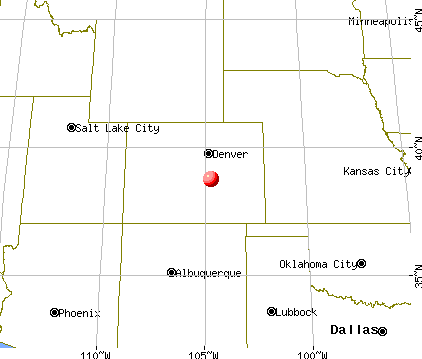
Latitude: 38.74 N, Longitude: 104.72 W
Daytime population change due to commuting: -13,633 (-34.3%)Workers who live and work in this place: 2,928 (15.4%)
Unemployment in December 2023:
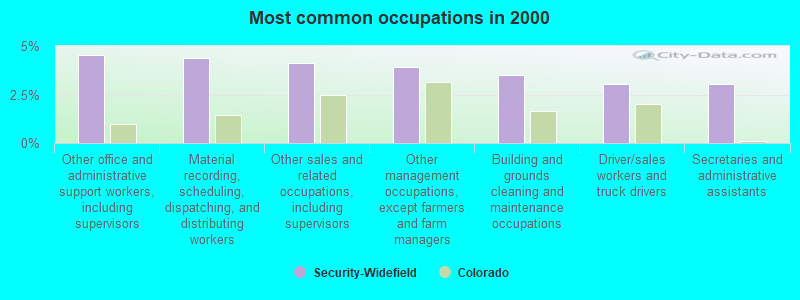
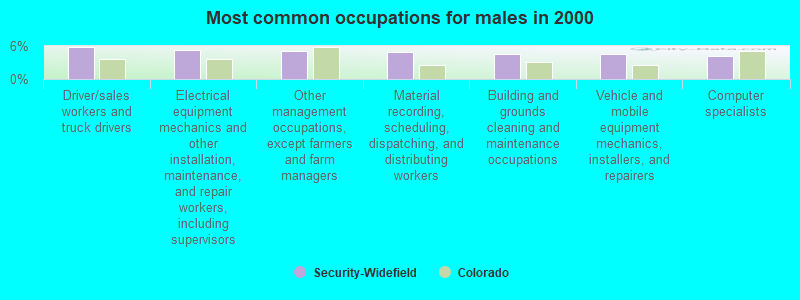
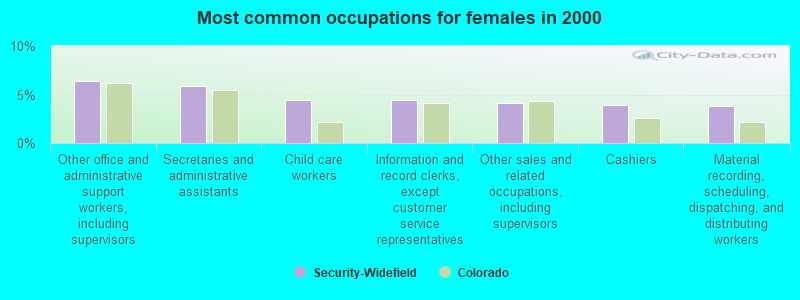
Most common occupations in Security-Widefield, CO (%)
Both Males Females
Other office and administrative support workers, including supervisors (4.5%)
Material recording, scheduling, dispatching, and distributing workers (4.4%)
Other sales and related occupations, including supervisors (4.1%)
Other management occupations, except farmers and farm managers (3.9%)
Building and grounds cleaning and maintenance occupations (3.5%)
Driver/sales workers and truck drivers (3.0%)
Secretaries and administrative assistants (3.0%)
Driver/sales workers and truck drivers (5.7%)
Electrical equipment mechanics and other installation, maintenance, and repair workers, including supervisors (5.2%)
Other management occupations, except farmers and farm managers (5.1%)
Material recording, scheduling, dispatching, and distributing workers (5.0%)
Building and grounds cleaning and maintenance occupations (4.5%)
Vehicle and mobile equipment mechanics, installers, and repairers (4.5%)
Computer specialists (4.2%)
Other office and administrative support workers, including supervisors (6.4%)
Secretaries and administrative assistants (5.9%)
Child care workers (4.5%)
Information and record clerks, except customer service representatives (4.4%)
Other sales and related occupations, including supervisors (4.2%)
Cashiers (3.9%)
Material recording, scheduling, dispatching, and distributing workers (3.8%)
Tornado activity:
Security-Widefield-area historical tornado activity is near Colorado state average. It is 29% smaller than the overall U.S. average.
On 6/24/1979, a category F3 (max. wind speeds 158-206 mph) tornado 8.2 miles away from the Security-Widefield place center injured one person and caused between $50,000 and $500,000 in damages.
On 6/13/1977, a category F3 tornado 16.1 miles away from the place center .
Earthquake activity:
Security-Widefield-area historical earthquake activity is significantly above Colorado state average. It is 711% greater than the overall U.S. average. On 8/18/1959 at 06:37:13, a magnitude 7.7 (7.7 UK, Class: Major, Intensity: VIII - XII) earthquake occurred 505.7 miles away from the city center, causing $26,000,000 total damage On 8/23/2011 at 05:46:18, a magnitude 5.3 (5.3 MW, Depth: 2.5 mi, Class: Moderate, Intensity: VI - VII) earthquake occurred 116.3 miles away from the city center On 8/10/2005 at 22:08:22, a magnitude 5.0 (5.0 MW, Depth: 3.1 mi) earthquake occurred 124.5 miles away from the city center On 8/10/2005 at 22:08:22, a magnitude 5.0 (5.0 MB, 4.7 MS, 5.0 MW) earthquake occurred 126.2 miles away from Security-Widefield center On 10/18/1984 at 15:30:23, a magnitude 5.5 (5.4 MB, 5.1 MS, 5.5 ML) earthquake occurred 256.3 miles away from Security-Widefield center On 8/22/2011 at 23:30:19, a magnitude 4.7 (4.7 MW, Depth: 3.1 mi, Class: Light, Intensity: IV - V) earthquake occurred 118.8 miles away from the city center Magnitude types: body-wave magnitude (MB), local magnitude (ML), surface-wave magnitude (MS), moment magnitude (MW) Natural disasters: The number of natural disasters in El Paso County (17) is near the US average (15).Major Disasters (Presidential) Declared: 10Emergencies Declared: 5Floods: 7, Storms: 7, Fires: 4, Landslides: 4, Mudslides: 4, Snows: 2, Tornadoes: 2, Drought: 1, Flash Flood: 1, Heavy Rain: 1, Hurricane: 1, Snowstorm: 1, Other: 1 (Note: some incidents may be assigned to more than one category). Hospitals and medical centers near Security-Widefield: A. M. HEALTH, INC. (Home Health Center, about 1 miles away; SECURITY, CO)
FOUNTAIN DIALYSIS CENTER (DVA) (Dialysis Facility, about 2 miles away; FOUNTAIN, CO)
ASPEN LIVING CENTER (Nursing Home, about 6 miles away; COLORADO SPRINGS, CO)
HUMAN TOUCH HOME HEALTH CARE AGENCY INC (Home Health Center, about 6 miles away; COLORADO SPRINGS, CO)
LAUREL MANOR CARE CENTER (Nursing Home, about 6 miles away; COLORADO SPRINGS, CO)
CHEYENNE MOUNTAIN CARE AND REHABILITATION CENTER (Nursing Home, about 6 miles away; COLORADO SPRINGS, CO)
TERRACE GARDENS HEALTH CARE CENTER (Nursing Home, about 6 miles away; COLORADO SPRINGS, CO)
Amtrak station near Security-Widefield: 8 miles: COLORADO SPRINGS (120 S. WEBER) - Bus Station Services: enclosed waiting area, call for taxi service.
Colleges/universities with over 2000 students nearest to Security-Widefield:
Pikes Peak Community College (about 4 miles; Colorado Springs, CO ; Full-time enrollment: 10,395)
Colorado College (about 9 miles; Colorado Springs, CO ; FT enrollment: 2,199)
University of Colorado Colorado Springs (about 12 miles; Colorado Springs, CO ; FT enrollment: 8,700)
Colorado Technical University-Online (about 12 miles; Colorado Springs, CO ; FT enrollment: 22,771)
Colorado Technical University-Colorado Springs (about 12 miles; Colorado Springs, CO ; FT enrollment: 2,049)
United States Air Force Academy (about 21 miles; USAFA, CO ; FT enrollment: 5,088)
Colorado State University-Pueblo (about 32 miles; Pueblo, CO ; FT enrollment: 5,993)
Notable locations in Security-Widefield: (A) , Security Fire Department Station 3 (B) , Security Fire Department Station 2 (C) , Security Fire Department Station 1 (D) . Display/hide their locations on the map
Reservoirs: (A) , A McCray Reservoir (B) , Fountain Valley Reservoir Number 3 (C) , Big Johnson Reservoir (D) , Little Johnson Reservoir (E) . Display/hide their locations on the map
El Paso County has a predicted average indoor radon screening level greater than 4 pCi/L (pico curies per liter) - Highest Potential Average household size: This place:
2.9 peopleColorado:
2.5 people
Percentage of family households: This place:
78.8%Whole state:
63.9%
Percentage of households with unmarried partners: This place:
4.4%Whole state:
6.5%
Likely homosexual households (counted as self-reported same-sex unmarried-partner households)
Lesbian couples: 0.4% of all households Gay men: 0.1% of all households
181 people in workers' group living quarters and job corps centers in 2010people in other noninstitutional group quarters in 2000
For population 15 years and over in Security-Widefield:
Never married: 25.6%Now married: 59.9%Separated: 0.8%Widowed: 3.6%Divorced: 10.1% For population 25 years and over in Security-Widefield:
High school or higher: 92.6%Bachelor's degree or higher: 23.4%Graduate or professional degree: 7.7%Unemployed: 4.7%Mean travel time to work (commute): 19.6 minutes
Education Gini index (Inequality in education) Here:
9.8Colorado average:
11.1
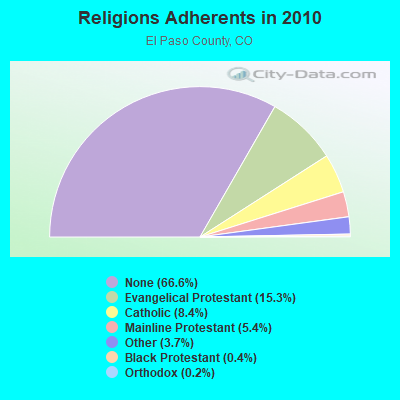
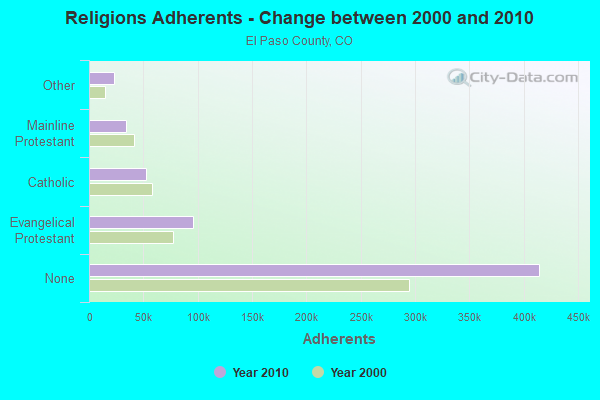
Religion statistics for Security-Widefield, CO (based on El Paso County data)
Religion Adherents Congregations Evangelical Protestant 95,284 265 Catholic 52,310 23 Mainline Protestant 33,697 61 Other 22,775 62 Black Protestant 2,686 11 Orthodox 947 4 None 414,564 -
Source: Clifford Grammich, Kirk Hadaway, Richard Houseal, Dale E.Jones, Alexei Krindatch, Richie Stanley and Richard H.Taylor. 2012. 2010 U.S.Religion Census: Religious Congregations & Membership Study. Association of Statisticians of American Religious Bodies. Jones, Dale E., et al. 2002. Congregations and Membership in the United States 2000. Nashville, TN: Glenmary Research Center. Graphs represent county-level data
Food Environment Statistics: Number of grocery stores : 57El Paso County :
0.97 / 10,000 pop.State :
1.50 / 10,000 pop.
Number of supercenters and club stores : 9El Paso County :
0.15 / 10,000 pop.Colorado :
0.15 / 10,000 pop.
Number of convenience stores (no gas) : 20El Paso County :
0.34 / 10,000 pop.Colorado :
0.45 / 10,000 pop.
Number of convenience stores (with gas) : 168Here :
2.87 / 10,000 pop.Colorado :
3.13 / 10,000 pop.
Number of full-service restaurants : 389This county :
6.64 / 10,000 pop.Colorado :
8.99 / 10,000 pop.
Adult diabetes rate : El Paso County :
5.5%State :
5.3%
Adult obesity rate : This county :
19.8%Colorado :
18.4%
Low-income preschool obesity rate : Health and Nutrition: Healthy diet rate : This city:
49.8%Colorado:
49.4%
Average overall health of teeth and gums : Security-Widefield:
47.8%State:
47.8%
Average BMI : This city:
29.0Colorado:
28.5
People feeling badly about themselves : Security-Widefield:
20.7%Colorado:
20.7%
People not drinking alcohol at all : This city:
11.0%Colorado:
9.7%
Average hours sleeping at night : Overweight people : Security-Widefield:
35.5%State:
33.3%
General health condition : Average condition of hearing : Security-Widefield:
80.5%Colorado:
80.2%
More about Health and Nutrition of Security-Widefield, CO Residents
9.81% of this county's 2021 resident taxpayers lived in other counties in 2020 ($64,463 average adjusted gross income )
Here:
9.81%Colorado average:
11.28%
0.28% of residents moved from foreign countries ($1,844 average AGI )El Paso County:
0.28%Colorado average:
0.05%
Top counties from which taxpayers relocated into this county between 2020 and 2021:
9.66% of this county's 2020 resident taxpayers moved to other counties in 2021 ($62,154 average adjusted gross income )
Here:
9.66%Colorado average:
11.05%
0.19% of residents moved to foreign countries ($1,409 average AGI )El Paso County:
0.19%Colorado average:
0.03%
Top counties to which taxpayers relocated from this county between 2020 and 2021: Strongest AM radio stations in Security-Widefield:
KWYD (1580 AM; 10 kW; COLORADO SPRINGS, CO; Owner: PILGRIM COMMUNICATIONS, INC.)
KCBR (1040 AM; daytime; 15 kW; MONUMENT, CO; Owner: KLZ RADIO, INC.)
KCMN (1530 AM; 15 kW; COLORADO SPRINGS, CO)
KKCS (1460 AM; 5 kW; COLORADO SPRINGS, CO; Owner: WALTON STATIONS - COLORADO, INC.)
KBZC (1300 AM; 5 kW; COLORADO SPRINGS, CO; Owner: CITADEL BROADCASTING COMPANY)
KOA (850 AM; 50 kW; DENVER, CO; Owner: JACOR BROADCASTING OF COLORADO, INC.)
KMXA (1090 AM; 50 kW; AURORA, CO; Owner: ENTRAVISION HOLDINGS, LLC)
KRDO (1240 AM; 1 kW; COLORADO SPRINGS, CO; Owner: THE PIKES PEAK BROADCASTING CO.)
KLTT (670 AM; 50 kW; COMMERCE CITY, CO; Owner: KLZ RADIO, INC.)
KKZN (760 AM; 50 kW; THORNTON, CO; Owner: JACOR BROADCASTING OF COLORADO, INC.)
KVOR (740 AM; 3 kW; COLORADO SPRINGS, CO; Owner: CITADEL BROADCASTING COMPANY)
KCUV (1510 AM; 25 kW; LITTLETON, CO; Owner: PEOPLE WIRELESS, INC.)
KXRE (1490 AM; 1 kW; MANITOU SPRINGS, CO; Owner: LATINO COMMUNICATIONS, LLC)
Strongest FM radio stations in Security-Widefield:
KKCS-FM (101.9 FM; COLORADO SPRINGS, CO; Owner: WALTON STATIONS - COLORADO, INC.)
KBIQ (102.7 FM; MANITOU SPRINGS, CO; Owner: BISON MEDIA, INC.)
KKFM (98.1 FM; COLORADO SPRINGS, CO; Owner: CITADEL BROADCASTING COMPANY)
KRCC (91.5 FM; COLORADO SPRINGS, CO; Owner: THE COLORADO COLLEGE)
KSKX (105.5 FM; SECURITY, CO; Owner: OPTIMA COMMUNICATIONS, INC.)
KGFT (100.7 FM; PUEBLO, CO; Owner: BISON MEDIA, INC)
KMOM (96.1 FM; FOUNTAIN, CO; Owner: AMFM TEXAS LICENSES LIMITED PARTNERSHIP)
KTLF (90.5 FM; COLORADO SPRINGS, CO; Owner: EDUCATIONAL COMMUNICATIONS OF COLORADO SPRINGS, INC.)
KKLI (106.3 FM; WIDEFIELD, CO; Owner: CAPSTAR TX LIMITED PARTNERSHIP)
KSPZ (92.9 FM; COLORADO SPRINGS, CO; Owner: CITADEL BROADCASTING COMPANY)
KVUU (99.9 FM; PUEBLO, CO; Owner: CAPSTAR TX LIMITED PARTNERSHIP)
KCME (88.7 FM; MANITOU SPRINGS, CO; Owner: CHEYENNE MOUNTAIN PUBLIC BROADCAST HOUSE, INC)
KRDO-FM (95.1 FM; COLORADO SPRINGS, CO; Owner: THE PIKES PEAK BROADCASTING CO.)
KILO (94.3 FM; COLORADO SPRINGS, CO; Owner: COLORADO SPRINGS RADIO BCSTERS, INC.)
KEPC (89.7 FM; COLORADO SPRINGS, CO; Owner: PIKES PEAK COMMUNITY COLLEGE)
KKMG (98.9 FM; PUEBLO, CO; Owner: CITADEL BROADCASTING COMPANY)
KCCY (96.9 FM; PUEBLO, CO; Owner: CAPSTAR TX LIMITED PARTNERSHIP)
KYZX (103.9 FM; PUEBLO WEST, CO; Owner: COLORADO SPRINGS RADIO B/CASTRS, INC)
KTLC (89.1 FM; CANON CITY, CO; Owner: MAKE A DIFFERENCE FOUNDATION, INC.)
K203AT (88.5 FM; WESTCLIFFE, ETC., CO; Owner: THE COLORADO COLLEGE)
TV broadcast stations around Security-Widefield:
KKTV (Channel 11; COLORADO SPRINGS, CO; Owner: GRAY MIDAMERICA TV LICENSEE CORP.)
KTSC (Channel 8; PUEBLO, CO; Owner: ROCKY MOUNTAIN PUBLIC BROADCASTING NETWORK, INC.)
KGHB-CA (Channel 27; PUEBLO, ETC., CO; Owner: ENTRAVISION HOLDINGS, LLC)
K23GJ (Channel 23; COLORADO SPRINGS, CO; Owner: SYNCOM MEDIA GROUP, INC.)
KRDO-TV (Channel 13; COLORADO SPRINGS, CO; Owner: THE PIKES PEAK BROADCASTING COMPANY)
KXRM-TV (Channel 21; COLORADO SPRINGS, CO; Owner: RAYCOM NATIONAL, INC.)
K49CJ (Channel 49; COLORADO SPRINGS, CO; Owner: TELEMUNDO OF COLORADO SPRINGS, INC.)
KJCS-LP (Channel 38; COLORADO SPRINGS, CO; Owner: BETA BROADCASTING, INC.)
K63DW (Channel 63; COLORADO SPRINGS, CO; Owner: ROCKY MTN.PUB.B/CING.NETWORK,INC.)
K30AA (Channel 30; COLORADO SPRINGS, CO; Owner: SANGRE DE CRISTO COMMUNICATIONS, INC.)
K43CG (Channel 43; COLORADO SPRINGS, CO; Owner: FULL GOSPEL OUTREACH, INC.)
KXTU-LP (Channel 57; COLORADO SPRINGS, CO; Owner: RAYCOM NATIONAL, INC.)
KWHS-LP (Channel 51; COLORADO SPRINGS, CO; Owner: LE SEA BROADCASTING CORPORATION)
K32EO (Channel 32; COLORADO SPRINGS, CO; Owner: FRONT RANGE EDUCATIONAL MEDIA CORP.)
National Bridge Inventory (NBI) Statistics 8 Number of bridges59ft / 17.9m Total length $733,000 Total costs45,875 Total average daily traffic3,181 Total average daily truck traffic
FCC Registered Microwave Towers: 7
WIDEFIELD HS, Widefield Hs, 615 Widefield Dr. (Lat: 38.754972 Lon: -104.735611), Type: Pole, Structure height: 33.5 m, Call Sign: WQJB305, Assigned Frequencies: 21875.0 MHz, 22325.0 MHz, 21925.0 MHz, 22025.0 MHz, 22225.0 MHz, 21875.0 MHz, 22325.0 MHz, 21875.0 MHz, 22325.0 MHz, 21875.0 MHz... (+5 more), Grant Date: 07/14/2008, Expiration Date: 07/14/2018, Cancellation Date: 09/12/2016, Certifier: Jeffrey J Youle, Registrant: Affiniti, LLC, 9208 Waterford Centre Blvd, Suite 150, Austin, TX 78758, Phone: (512) 334-4100, Fax: (512) 334-4099, Email:
SPROUL JHS, Sproul Jhs, 235 Sumac Dr. (Lat: 38.763694 Lon: -104.747417), Type: Pole, Structure height: 33.5 m, Call Sign: WQJB366, Assigned Frequencies: 23075.0 MHz, 23175.0 MHz, 23025.0 MHz, 23325.0 MHz, 23075.0 MHz, 23175.0 MHz, 23075.0 MHz, 23175.0 MHz, 23075.0 MHz, 23175.0 MHz... (+4 more), Grant Date: 07/14/2008, Expiration Date: 07/14/2018, Cancellation Date: 09/12/2016, Certifier: Jeffrey J Youle, Registrant: Affiniti, LLC, 9208 Waterford Centre Blvd, Suite 150, Austin, TX 78758, Phone: (512) 334-4100, Fax: (512) 334-4099, Email:
ADMIN, Widefield Admin, 1820 Main St. (Lat: 38.767472 Lon: -104.740333), Type: Pole, Structure height: 33.5 m, Call Sign: WQJC222, Assigned Frequencies: 21925.0 MHz, 21975.0 MHz, 21825.0 MHz, 21925.0 MHz, 21975.0 MHz, 21925.0 MHz, 21975.0 MHz, 21925.0 MHz, 21975.0 MHz, 21925.0 MHz... (+3 more), Grant Date: 07/22/2008, Expiration Date: 07/22/2018, Cancellation Date: 09/12/2016, Certifier: Jeffrey J Youle, Registrant: Affiniti, LLC, 9208 Waterford Centre Blvd, Suite 150, Austin, TX 78758, Phone: (512) 334-4100, Fax: (512) 334-4099, Email:
WATSON JHS, Watson Jhs, 136 Fontaine Blvd. (Lat: 38.737917 Lon: -104.723222), Type: Pole, Structure height: 33.5 m, Call Sign: WQJC514, Assigned Frequencies: 23025.0 MHz, 23525.0 MHz, 23175.0 MHz, 23225.0 MHz, 23025.0 MHz, 23525.0 MHz, 23025.0 MHz, 23525.0 MHz, 23025.0 MHz, 23525.0 MHz... (+4 more), Grant Date: 07/24/2008, Expiration Date: 07/24/2018, Cancellation Date: 09/12/2016, Certifier: Jeffrey J Youle, Registrant: Affiniti, LLC, 9208 Waterford Centre Blvd, Suite 150, Austin, TX 78758, Phone: (512) 334-4100, Fax: (512) 334-4099, Email:
SUNRISE ES, Sunrise Es, 7070 Grand Valley Dr. (Lat: 38.729444 Lon: -104.686028), Type: Pole, Structure height: 30.5 m, Call Sign: WQJC656, Assigned Frequencies: 23075.0 MHz, 23125.0 MHz, 23175.0 MHz, 23075.0 MHz, 23125.0 MHz, 23175.0 MHz, 23075.0 MHz, 23125.0 MHz, 23175.0 MHz, 23075.0 MHz... (+8 more), Grant Date: 07/25/2008, Expiration Date: 07/25/2018, Cancellation Date: 09/12/2016, Certifier: Jeffrey J Youle, Registrant: Affiniti, LLC, 9208 Waterford Centre Blvd, Suite 150, Austin, TX 78758, Phone: (512) 334-4100, Fax: (512) 334-4099, Email:
DN14XC237, 7375 Southmoor Dr. (Lat: 38.725333 Lon: -104.723222), Type: Mtower, Structure height: 33.2 m, Call Sign: WQSY649, Assigned Frequencies: 10935.0 MHz, 10935.0 MHz, 10935.0 MHz, 10935.0 MHz, 10935.0 MHz, 10935.0 MHz, 10935.0 MHz, 10815.0 MHz, 10775.0 MHz, 10815.0 MHz... (+6 more), Grant Date: 12/10/2013, Expiration Date: 12/10/2023, Cancellation Date: 11/06/2023, Certifier: David Werblow, Registrant: T-Mobile Usa, Inc., 12920 Se 38th Street, Bellevue, WA 98006, Phone: (425) 383-8401, Email:
DN01088A, 7375 Southmoor Dr (Lat: 38.725583 Lon: -104.723500), Type: Mtower, Structure height: 36.9 m, Call Sign: WQWC785, Assigned Frequencies: 10895.0 MHz, 10895.0 MHz, 10895.0 MHz, 10895.0 MHz, 10895.0 MHz, 10895.0 MHz, 10895.0 MHz, 10895.0 MHz, 10895.0 MHz, 10895.0 MHz... (+22 more), Grant Date: 07/20/2015, Expiration Date: 07/20/2025, Certifier: David Werblow, Registrant: T-Mobile Usa, Inc., 12920 Se 38th Street, Bellevue, WA 98006, Phone: (425) 383-8401, Fax: (425) 383-4040, Email:
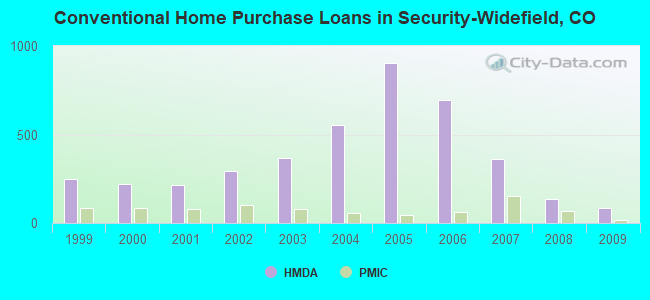
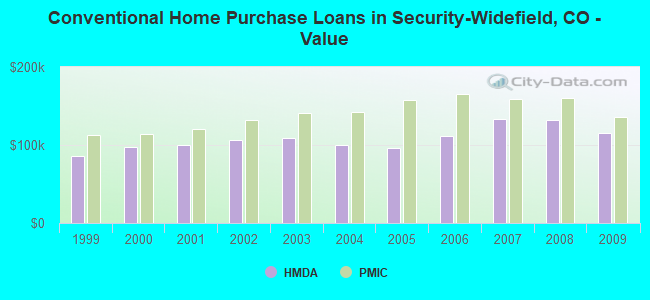
Home Mortgage Disclosure Act Aggregated Statistics For Year 2009(Based on 4 full and 5 partial tracts) A) FHA, FSA/RHS & VA B) Conventional C) Refinancings D) Home Improvement Loans F) Non-occupant Loans on G) Loans On Manufactured Number Average Value Number Average Value Number Average Value Number Average Value Number Average Value Number Average Value
LOANS ORIGINATED 457 $164,150 84 $114,970 927 $168,392 45 $25,557 61 $119,138 3 $81,907 APPLICATIONS APPROVED, NOT ACCEPTED 25 $151,220 3 $225,830 88 $161,708 4 $12,862 4 $96,242 1 $80,770 APPLICATIONS DENIED 39 $161,868 15 $91,555 270 $159,407 67 $30,341 21 $101,720 2 $30,695 APPLICATIONS WITHDRAWN 47 $169,485 11 $147,382 177 $167,377 19 $51,714 6 $150,272 0 $0 FILES CLOSED FOR INCOMPLETENESS 7 $131,774 0 $0 47 $159,245 0 $0 1 $173,900 0 $0
Aggregated Statistics For Year 2008(Based on 4 full and 5 partial tracts) A) FHA, FSA/RHS & VA B) Conventional C) Refinancings D) Home Improvement Loans F) Non-occupant Loans on G) Loans On Manufactured Number Average Value Number Average Value Number Average Value Number Average Value Number Average Value Number Average Value
LOANS ORIGINATED 301 $173,060 137 $131,897 540 $160,114 84 $25,506 78 $102,243 2 $77,135 APPLICATIONS APPROVED, NOT ACCEPTED 24 $181,015 23 $142,331 103 $163,832 19 $28,411 13 $137,395 1 $65,100 APPLICATIONS DENIED 35 $160,059 32 $125,695 450 $150,914 153 $32,531 40 $112,249 5 $37,192 APPLICATIONS WITHDRAWN 31 $185,648 26 $162,738 170 $170,647 18 $65,596 17 $153,047 0 $0 FILES CLOSED FOR INCOMPLETENESS 5 $177,998 1 $109,640 39 $151,198 5 $73,098 5 $167,300 0 $0
Aggregated Statistics For Year 2007(Based on 4 full and 5 partial tracts) A) FHA, FSA/RHS & VA B) Conventional C) Refinancings D) Home Improvement Loans F) Non-occupant Loans on G) Loans On Manufactured Number Average Value Number Average Value Number Average Value Number Average Value Number Average Value Number Average Value
LOANS ORIGINATED 273 $183,992 362 $133,395 711 $133,338 137 $33,785 129 $113,441 5 $63,406 APPLICATIONS APPROVED, NOT ACCEPTED 13 $182,056 44 $116,446 151 $139,354 40 $65,854 20 $115,220 1 $84,570 APPLICATIONS DENIED 31 $166,867 99 $124,651 756 $140,271 142 $35,939 59 $119,962 7 $44,301 APPLICATIONS WITHDRAWN 25 $199,665 62 $132,199 345 $143,041 22 $79,253 23 $141,718 0 $0 FILES CLOSED FOR INCOMPLETENESS 4 $175,115 16 $145,021 70 $153,877 6 $78,623 9 $132,496 0 $0
Aggregated Statistics For Year 2006(Based on 4 full and 5 partial tracts) A) FHA, FSA/RHS & VA B) Conventional C) Refinancings D) Home Improvement Loans E) Loans on Dwellings For 5+ Families F) Non-occupant Loans on G) Loans On Manufactured Number Average Value Number Average Value Number Average Value Number Average Value Number Average Value Number Average Value Number Average Value
LOANS ORIGINATED 341 $189,401 693 $111,147 998 $118,013 157 $31,276 1 $2,990,320 213 $104,838 7 $106,779 APPLICATIONS APPROVED, NOT ACCEPTED 11 $182,915 87 $103,302 234 $126,429 52 $58,841 0 $0 35 $114,257 2 $35,590 APPLICATIONS DENIED 25 $177,572 180 $107,290 865 $134,137 203 $39,784 0 $0 73 $100,101 9 $60,532 APPLICATIONS WITHDRAWN 38 $188,383 147 $111,801 627 $140,209 36 $85,604 0 $0 51 $109,284 1 $97,320 FILES CLOSED FOR INCOMPLETENESS 11 $211,764 34 $107,729 89 $153,134 4 $51,828 0 $0 14 $83,394 0 $0
Aggregated Statistics For Year 2005(Based on 4 full and 5 partial tracts) A) FHA, FSA/RHS & VA B) Conventional C) Refinancings D) Home Improvement Loans E) Loans on Dwellings For 5+ Families F) Non-occupant Loans on G) Loans On Manufactured Number Average Value Number Average Value Number Average Value Number Average Value Number Average Value Number Average Value Number Average Value
LOANS ORIGINATED 330 $174,920 904 $95,707 1,182 $116,836 165 $43,019 1 $1,772,640 238 $98,437 8 $79,319 APPLICATIONS APPROVED, NOT ACCEPTED 13 $184,638 120 $92,833 206 $128,649 51 $51,849 0 $0 32 $91,178 6 $46,847 APPLICATIONS DENIED 32 $165,335 214 $98,972 894 $133,172 210 $35,327 0 $0 73 $109,083 15 $63,527 APPLICATIONS WITHDRAWN 28 $179,212 146 $104,023 658 $135,750 52 $102,820 0 $0 49 $105,323 2 $135,990 FILES CLOSED FOR INCOMPLETENESS 1 $160,840 28 $84,095 154 $139,326 8 $41,848 0 $0 14 $91,356 0 $0
Aggregated Statistics For Year 2004(Based on 4 full and 5 partial tracts) A) FHA, FSA/RHS & VA B) Conventional C) Refinancings D) Home Improvement Loans E) Loans on Dwellings For 5+ Families F) Non-occupant Loans on G) Loans On Manufactured Number Average Value Number Average Value Number Average Value Number Average Value Number Average Value Number Average Value Number Average Value
LOANS ORIGINATED 313 $157,375 556 $99,504 1,276 $119,397 133 $36,607 1 $337,190 138 $105,436 4 $91,998 APPLICATIONS APPROVED, NOT ACCEPTED 11 $150,036 79 $102,815 258 $119,537 28 $48,531 0 $0 19 $95,791 7 $101,413 APPLICATIONS DENIED 44 $142,160 204 $94,423 837 $123,804 171 $32,237 0 $0 60 $109,713 10 $50,180 APPLICATIONS WITHDRAWN 29 $151,359 92 $116,698 507 $129,128 36 $44,253 0 $0 20 $104,178 4 $151,102 FILES CLOSED FOR INCOMPLETENESS 3 $156,457 13 $133,382 154 $134,197 13 $56,972 0 $0 9 $104,884 0 $0
Aggregated Statistics For Year 2003(Based on 4 full and 5 partial tracts) A) FHA, FSA/RHS & VA B) Conventional C) Refinancings D) Home Improvement Loans E) Loans on Dwellings For 5+ Families F) Non-occupant Loans on Number Average Value Number Average Value Number Average Value Number Average Value Number Average Value Number Average Value
LOANS ORIGINATED 346 $155,230 365 $108,981 2,578 $117,531 110 $21,159 1 $2,794,710 213 $97,702 APPLICATIONS APPROVED, NOT ACCEPTED 12 $136,598 44 $115,707 354 $117,219 18 $22,652 0 $0 28 $109,075 APPLICATIONS DENIED 21 $134,980 114 $100,366 909 $117,056 127 $19,537 0 $0 44 $101,635 APPLICATIONS WITHDRAWN 40 $145,784 57 $108,664 589 $122,244 30 $22,065 0 $0 23 $111,702 FILES CLOSED FOR INCOMPLETENESS 3 $143,063 10 $102,496 102 $113,484 2 $13,555 0 $0 3 $94,993
Aggregated Statistics For Year 2002(Based on 3 full and 4 partial tracts) A) FHA, FSA/RHS & VA B) Conventional C) Refinancings D) Home Improvement Loans E) Loans on Dwellings For 5+ Families F) Non-occupant Loans on Number Average Value Number Average Value Number Average Value Number Average Value Number Average Value Number Average Value
LOANS ORIGINATED 357 $142,486 292 $106,102 1,239 $110,661 142 $29,870 2 $743,175 127 $93,550 APPLICATIONS APPROVED, NOT ACCEPTED 7 $133,400 29 $89,676 201 $107,505 16 $27,994 0 $0 6 $98,873 APPLICATIONS DENIED 19 $136,415 58 $78,344 540 $103,270 130 $23,372 1 $417,810 26 $91,872 APPLICATIONS WITHDRAWN 36 $136,063 38 $92,817 419 $114,159 21 $30,552 0 $0 10 $76,547 FILES CLOSED FOR INCOMPLETENESS 5 $124,944 13 $106,177 111 $112,440 5 $48,340 0 $0 5 $78,166
Aggregated Statistics For Year 2001(Based on 3 full and 4 partial tracts) A) FHA, FSA/RHS & VA B) Conventional C) Refinancings D) Home Improvement Loans E) Loans on Dwellings For 5+ Families F) Non-occupant Loans on Number Average Value Number Average Value Number Average Value Number Average Value Number Average Value Number Average Value
LOANS ORIGINATED 475 $134,588 217 $99,896 1,071 $104,040 196 $24,475 1 $763,780 80 $88,856 APPLICATIONS APPROVED, NOT ACCEPTED 22 $121,840 35 $71,418 153 $92,428 18 $15,958 0 $0 8 $86,488 APPLICATIONS DENIED 32 $122,872 73 $72,449 481 $90,890 113 $19,671 0 $0 12 $83,899 APPLICATIONS WITHDRAWN 58 $129,477 45 $108,887 419 $105,033 44 $22,130 0 $0 15 $87,121 FILES CLOSED FOR INCOMPLETENESS 7 $138,320 8 $92,420 72 $98,446 5 $27,906 0 $0 5 $71,852
Aggregated Statistics For Year 2000(Based on 3 full and 4 partial tracts) A) FHA, FSA/RHS & VA B) Conventional C) Refinancings D) Home Improvement Loans E) Loans on Dwellings For 5+ Families F) Non-occupant Loans on Number Average Value Number Average Value Number Average Value Number Average Value Number Average Value Number Average Value
LOANS ORIGINATED 385 $123,778 223 $97,031 377 $76,083 201 $24,513 1 $587,360 60 $76,706 APPLICATIONS APPROVED, NOT ACCEPTED 11 $118,813 27 $87,093 77 $76,840 58 $21,305 0 $0 2 $71,790 APPLICATIONS DENIED 22 $118,291 107 $75,667 328 $71,147 152 $23,019 0 $0 17 $71,995 APPLICATIONS WITHDRAWN 29 $123,610 38 $94,020 173 $83,043 38 $33,095 0 $0 5 $55,160 FILES CLOSED FOR INCOMPLETENESS 3 $119,267 2 $86,890 53 $87,203 2 $28,620 0 $0 2 $80,970
Aggregated Statistics For Year 1999(Based on 3 full and 5 partial tracts) A) FHA, FSA/RHS & VA B) Conventional C) Refinancings D) Home Improvement Loans E) Loans on Dwellings For 5+ Families F) Non-occupant Loans on Number Average Value Number Average Value Number Average Value Number Average Value Number Average Value Number Average Value
LOANS ORIGINATED 455 $119,235 248 $85,257 780 $78,881 206 $20,442 1 $503,650 72 $72,299 APPLICATIONS APPROVED, NOT ACCEPTED 6 $116,022 27 $71,041 201 $78,261 63 $17,188 0 $0 8 $65,199 APPLICATIONS DENIED 45 $122,157 116 $64,704 484 $76,542 191 $21,021 0 $0 18 $66,994 APPLICATIONS WITHDRAWN 33 $119,550 43 $85,210 326 $89,867 27 $43,447 0 $0 15 $100,017 FILES CLOSED FOR INCOMPLETENESS 8 $115,425 9 $95,054 60 $92,453 7 $19,819 0 $0 6 $91,593
Detailed mortgage data for all 9 tracts in Security Widefield, CO
Private Mortgage Insurance Companies Aggregated Statistics For Year 2009(Based on 4 full and 5 partial tracts) A) Conventional B) Refinancings C) Non-occupant Loans on Number Average Value Number Average Value Number Average Value
LOANS ORIGINATED 15 $135,734 26 $185,941 2 $100,710 APPLICATIONS APPROVED, NOT ACCEPTED 2 $110,425 4 $151,458 0 $0 APPLICATIONS DENIED 10 $120,254 12 $134,790 0 $0 APPLICATIONS WITHDRAWN 2 $134,945 3 $174,683 0 $0 FILES CLOSED FOR INCOMPLETENESS 1 $130,170 1 $153,220 0 $0
Aggregated Statistics For Year 2008(Based on 4 full and 5 partial tracts) A) Conventional B) Refinancings C) Non-occupant Loans on Number Average Value Number Average Value Number Average Value
LOANS ORIGINATED 69 $160,598 51 $162,665 15 $116,662 APPLICATIONS APPROVED, NOT ACCEPTED 18 $163,928 26 $182,065 2 $172,190 APPLICATIONS DENIED 8 $115,728 5 $156,274 7 $109,920 APPLICATIONS WITHDRAWN 1 $169,440 4 $208,620 0 $0 FILES CLOSED FOR INCOMPLETENESS 1 $135,150 3 $143,460 0 $0
Aggregated Statistics For Year 2007(Based on 4 full and 5 partial tracts) A) Conventional B) Refinancings C) Non-occupant Loans on Number Average Value Number Average Value Number Average Value
LOANS ORIGINATED 151 $159,264 101 $162,810 16 $125,688 APPLICATIONS APPROVED, NOT ACCEPTED 11 $171,953 16 $156,620 1 $95,150 APPLICATIONS DENIED 3 $78,597 3 $185,860 3 $136,733 APPLICATIONS WITHDRAWN 5 $153,570 5 $220,214 0 $0 FILES CLOSED FOR INCOMPLETENESS 1 $100,920 0 $0 0 $0
Aggregated Statistics For Year 2006(Based on 4 full and 5 partial tracts) A) Conventional B) Refinancings C) Non-occupant Loans on Number Average Value Number Average Value Number Average Value
LOANS ORIGINATED 62 $165,940 56 $154,959 12 $130,289 APPLICATIONS APPROVED, NOT ACCEPTED 4 $121,678 16 $165,761 2 $189,535 APPLICATIONS DENIED 0 $0 0 $0 0 $0 APPLICATIONS WITHDRAWN 4 $204,320 7 $169,110 0 $0 FILES CLOSED FOR INCOMPLETENESS 1 $160,950 0 $0 0 $0
Aggregated Statistics For Year 2005(Based on 4 full and 5 partial tracts) A) Conventional B) Refinancings C) Non-occupant Loans on Number Average Value Number Average Value Number Average Value
LOANS ORIGINATED 43 $157,810 84 $147,652 4 $133,085 APPLICATIONS APPROVED, NOT ACCEPTED 9 $173,681 14 $158,580 1 $210,690 APPLICATIONS DENIED 0 $0 3 $167,957 3 $155,103 APPLICATIONS WITHDRAWN 7 $91,974 9 $157,601 3 $145,353 FILES CLOSED FOR INCOMPLETENESS 1 $79,990 0 $0 0 $0
Aggregated Statistics For Year 2004(Based on 4 full and 5 partial tracts) A) Conventional B) Refinancings C) Non-occupant Loans on Number Average Value Number Average Value Number Average Value
LOANS ORIGINATED 54 $141,701 109 $146,901 10 $115,099 APPLICATIONS APPROVED, NOT ACCEPTED 8 $150,996 36 $146,038 3 $99,580 APPLICATIONS DENIED 0 $0 2 $119,760 1 $152,690 APPLICATIONS WITHDRAWN 6 $125,372 12 $158,895 1 $119,370 FILES CLOSED FOR INCOMPLETENESS 1 $137,020 0 $0 0 $0
Aggregated Statistics For Year 2003(Based on 4 full and 5 partial tracts) A) Conventional B) Refinancings C) Non-occupant Loans on Number Average Value Number Average Value Number Average Value
LOANS ORIGINATED 77 $140,754 282 $140,283 29 $125,516 APPLICATIONS APPROVED, NOT ACCEPTED 13 $130,536 74 $139,428 5 $121,048 APPLICATIONS DENIED 2 $116,420 7 $133,811 3 $112,860 APPLICATIONS WITHDRAWN 8 $149,975 17 $142,926 2 $94,070 FILES CLOSED FOR INCOMPLETENESS 0 $0 1 $119,370 0 $0
Aggregated Statistics For Year 2002(Based on 3 full and 4 partial tracts) A) Conventional B) Refinancings C) Non-occupant Loans on Number Average Value Number Average Value Number Average Value
LOANS ORIGINATED 100 $132,049 150 $135,130 17 $109,084 APPLICATIONS APPROVED, NOT ACCEPTED 12 $156,642 32 $133,251 0 $0 APPLICATIONS DENIED 1 $149,000 4 $162,910 0 $0 APPLICATIONS WITHDRAWN 3 $148,877 8 $137,751 0 $0 FILES CLOSED FOR INCOMPLETENESS 1 $228,340 2 $123,880 0 $0
Aggregated Statistics For Year 2001(Based on 3 full and 4 partial tracts) A) Conventional B) Refinancings C) Non-occupant Loans on Number Average Value Number Average Value Number Average Value
LOANS ORIGINATED 80 $120,778 153 $128,217 14 $102,764 APPLICATIONS APPROVED, NOT ACCEPTED 10 $101,219 11 $120,675 2 $89,360 APPLICATIONS DENIED 2 $144,290 7 $142,251 2 $109,425 APPLICATIONS WITHDRAWN 1 $123,800 5 $124,520 0 $0 FILES CLOSED FOR INCOMPLETENESS 0 $0 0 $0 0 $0
Aggregated Statistics For Year 2000(Based on 3 full and 4 partial tracts) A) Conventional B) Refinancings C) Non-occupant Loans on Number Average Value Number Average Value Number Average Value
LOANS ORIGINATED 83 $113,865 43 $107,523 15 $92,473 APPLICATIONS APPROVED, NOT ACCEPTED 10 $98,226 11 $97,351 1 $146,880 APPLICATIONS DENIED 3 $110,490 4 $114,532 1 $130,390 APPLICATIONS WITHDRAWN 5 $104,656 1 $85,000 1 $86,130 FILES CLOSED FOR INCOMPLETENESS 2 $137,270 0 $0 0 $0
Aggregated Statistics For Year 1999(Based on 3 full and 5 partial tracts) A) Conventional B) Refinancings C) Non-occupant Loans on Number Average Value Number Average Value Number Average Value
LOANS ORIGINATED 84 $113,334 77 $103,440 11 $85,620 APPLICATIONS APPROVED, NOT ACCEPTED 5 $113,900 16 $99,224 1 $123,500 APPLICATIONS DENIED 5 $120,250 13 $99,949 2 $109,040 APPLICATIONS WITHDRAWN 2 $77,845 4 $131,695 1 $59,740 FILES CLOSED FOR INCOMPLETENESS 1 $110,380 4 $92,890 0 $0
Security-Widefield compared to Colorado state average:
Unemployed percentage significantly below state average. Black race population percentage above state average. Renting percentage below state average. Length of stay since moving in significantly above state average. Number of rooms per house above state average.


 Recent articles from our blog. Our writers, many of them Ph.D. graduates or candidates, create easy-to-read articles on a wide variety of topics.

 (9.0 miles