Galena, Ohio Submit your own pictures of this village and show them to the world
OSM Map
General Map
Google Map
MSN Map
OSM Map
General Map
Google Map
MSN Map
OSM Map
General Map
Google Map
MSN Map
OSM Map
General Map
Google Map
MSN Map
Please wait while loading the map...
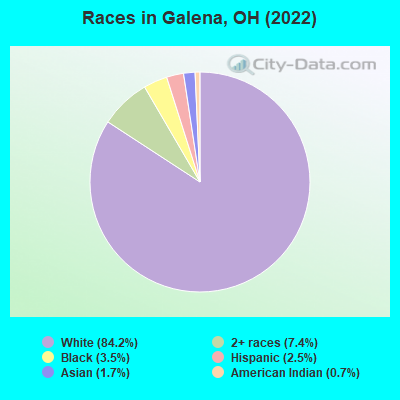
Population in 2022: 991 (82% urban, 18% rural). Population change since 2000: +224.9%Males: 467 Females: 524
March 2022 cost of living index in Galena: 94.6 (less than average, U.S. average is 100) Percentage of residents living in poverty in 2022: 12.0%for White Non-Hispanic residents , 8.3% for Black residents , 58.6% for Hispanic or Latino residents , 55.0% for other race residents )Business Search - 14 Million verified businesses
Data:
Median household income ($)
Median household income (% change since 2000)
Household income diversity
Ratio of average income to average house value (%)
Ratio of average income to average rent
Median household income ($) - White
Median household income ($) - Black or African American
Median household income ($) - Asian
Median household income ($) - Hispanic or Latino
Median household income ($) - American Indian and Alaska Native
Median household income ($) - Multirace
Median household income ($) - Other Race
Median household income for houses/condos with a mortgage ($)
Median household income for apartments without a mortgage ($)
Races - White alone (%)
Races - White alone (% change since 2000)
Races - Black alone (%)
Races - Black alone (% change since 2000)
Races - American Indian alone (%)
Races - American Indian alone (% change since 2000)
Races - Asian alone (%)
Races - Asian alone (% change since 2000)
Races - Hispanic (%)
Races - Hispanic (% change since 2000)
Races - Native Hawaiian and Other Pacific Islander alone (%)
Races - Native Hawaiian and Other Pacific Islander alone (% change since 2000)
Races - Two or more races (%)
Races - Two or more races (% change since 2000)
Races - Other race alone (%)
Races - Other race alone (% change since 2000)
Racial diversity
Unemployment (%)
Unemployment (% change since 2000)
Unemployment (%) - White
Unemployment (%) - Black or African American
Unemployment (%) - Asian
Unemployment (%) - Hispanic or Latino
Unemployment (%) - American Indian and Alaska Native
Unemployment (%) - Multirace
Unemployment (%) - Other Race
Population density (people per square mile)
Population - Males (%)
Population - Females (%)
Population - Males (%) - White
Population - Males (%) - Black or African American
Population - Males (%) - Asian
Population - Males (%) - Hispanic or Latino
Population - Males (%) - American Indian and Alaska Native
Population - Males (%) - Multirace
Population - Males (%) - Other Race
Population - Females (%) - White
Population - Females (%) - Black or African American
Population - Females (%) - Asian
Population - Females (%) - Hispanic or Latino
Population - Females (%) - American Indian and Alaska Native
Population - Females (%) - Multirace
Population - Females (%) - Other Race
Coronavirus confirmed cases (Apr 27, 2024)
Deaths caused by coronavirus (Apr 27, 2024)
Coronavirus confirmed cases (per 100k population) (Apr 27, 2024)
Deaths caused by coronavirus (per 100k population) (Apr 27, 2024)
Daily increase in number of cases (Apr 27, 2024)
Weekly increase in number of cases (Apr 27, 2024)
Cases doubled (in days) (Apr 27, 2024)
Hospitalized patients (Apr 18, 2022)
Negative test results (Apr 18, 2022)
Total test results (Apr 18, 2022)
COVID Vaccine doses distributed (per 100k population) (Sep 19, 2023)
COVID Vaccine doses administered (per 100k population) (Sep 19, 2023)
COVID Vaccine doses distributed (Sep 19, 2023)
COVID Vaccine doses administered (Sep 19, 2023)
Likely homosexual households (%)
Likely homosexual households (% change since 2000)
Likely homosexual households - Lesbian couples (%)
Likely homosexual households - Lesbian couples (% change since 2000)
Likely homosexual households - Gay men (%)
Likely homosexual households - Gay men (% change since 2000)
Cost of living index
Median gross rent ($)
Median contract rent ($)
Median monthly housing costs ($)
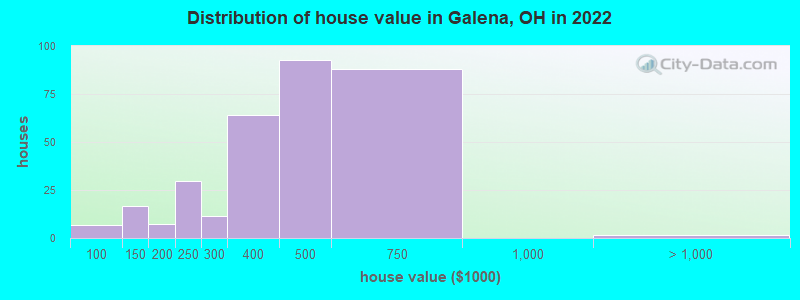
Median house or condo value ($)
Median house or condo value ($ change since 2000)
Mean house or condo value by units in structure - 1, detached ($)
Mean house or condo value by units in structure - 1, attached ($)
Mean house or condo value by units in structure - 2 ($)
Mean house or condo value by units in structure by units in structure - 3 or 4 ($)
Mean house or condo value by units in structure - 5 or more ($)
Mean house or condo value by units in structure - Boat, RV, van, etc. ($)
Mean house or condo value by units in structure - Mobile home ($)
Median house or condo value ($) - White
Median house or condo value ($) - Black or African American
Median house or condo value ($) - Asian
Median house or condo value ($) - Hispanic or Latino
Median house or condo value ($) - American Indian and Alaska Native
Median house or condo value ($) - Multirace
Median house or condo value ($) - Other Race
Median resident age
Resident age diversity
Median resident age - Males
Median resident age - Females
Median resident age - White
Median resident age - Black or African American
Median resident age - Asian
Median resident age - Hispanic or Latino
Median resident age - American Indian and Alaska Native
Median resident age - Multirace
Median resident age - Other Race
Median resident age - Males - White
Median resident age - Males - Black or African American
Median resident age - Males - Asian
Median resident age - Males - Hispanic or Latino
Median resident age - Males - American Indian and Alaska Native
Median resident age - Males - Multirace
Median resident age - Males - Other Race
Median resident age - Females - White
Median resident age - Females - Black or African American
Median resident age - Females - Asian
Median resident age - Females - Hispanic or Latino
Median resident age - Females - American Indian and Alaska Native
Median resident age - Females - Multirace
Median resident age - Females - Other Race
Commute - mean travel time to work (minutes)
Travel time to work - Less than 5 minutes (%)
Travel time to work - Less than 5 minutes (% change since 2000)
Travel time to work - 5 to 9 minutes (%)
Travel time to work - 5 to 9 minutes (% change since 2000)
Travel time to work - 10 to 19 minutes (%)
Travel time to work - 10 to 19 minutes (% change since 2000)
Travel time to work - 20 to 29 minutes (%)
Travel time to work - 20 to 29 minutes (% change since 2000)
Travel time to work - 30 to 39 minutes (%)
Travel time to work - 30 to 39 minutes (% change since 2000)
Travel time to work - 40 to 59 minutes (%)
Travel time to work - 40 to 59 minutes (% change since 2000)
Travel time to work - 60 to 89 minutes (%)
Travel time to work - 60 to 89 minutes (% change since 2000)
Travel time to work - 90 or more minutes (%)
Travel time to work - 90 or more minutes (% change since 2000)
Marital status - Never married (%)
Marital status - Now married (%)
Marital status - Separated (%)
Marital status - Widowed (%)
Marital status - Divorced (%)
Median family income ($)
Median family income (% change since 2000)
Median non-family income ($)
Median non-family income (% change since 2000)
Median per capita income ($)
Median per capita income (% change since 2000)
Median family income ($) - White
Median family income ($) - Black or African American
Median family income ($) - Asian
Median family income ($) - Hispanic or Latino
Median family income ($) - American Indian and Alaska Native
Median family income ($) - Multirace
Median family income ($) - Other Race
Median year house/condo built
Median year apartment built
Year house built - Built 2005 or later (%)
Year house built - Built 2000 to 2004 (%)
Year house built - Built 1990 to 1999 (%)
Year house built - Built 1980 to 1989 (%)
Year house built - Built 1970 to 1979 (%)
Year house built - Built 1960 to 1969 (%)
Year house built - Built 1950 to 1959 (%)
Year house built - Built 1940 to 1949 (%)
Year house built - Built 1939 or earlier (%)
Average household size
Household density (households per square mile)
Average household size - White
Average household size - Black or African American
Average household size - Asian
Average household size - Hispanic or Latino
Average household size - American Indian and Alaska Native
Average household size - Multirace
Average household size - Other Race
Occupied housing units (%)
Vacant housing units (%)
Owner occupied housing units (%)
Renter occupied housing units (%)
Vacancy status - For rent (%)
Vacancy status - For sale only (%)
Vacancy status - Rented or sold, not occupied (%)
Vacancy status - For seasonal, recreational, or occasional use (%)
Vacancy status - For migrant workers (%)
Vacancy status - Other vacant (%)
Residents with income below the poverty level (%)
Residents with income below 50% of the poverty level (%)
Children below poverty level (%)
Poor families by family type - Married-couple family (%)
Poor families by family type - Male, no wife present (%)
Poor families by family type - Female, no husband present (%)
Poverty status for native-born residents (%)
Poverty status for foreign-born residents (%)
Poverty among high school graduates not in families (%)
Poverty among people who did not graduate high school not in families (%)
Residents with income below the poverty level (%) - White
Residents with income below the poverty level (%) - Black or African American
Residents with income below the poverty level (%) - Asian
Residents with income below the poverty level (%) - Hispanic or Latino
Residents with income below the poverty level (%) - American Indian and Alaska Native
Residents with income below the poverty level (%) - Multirace
Residents with income below the poverty level (%) - Other Race
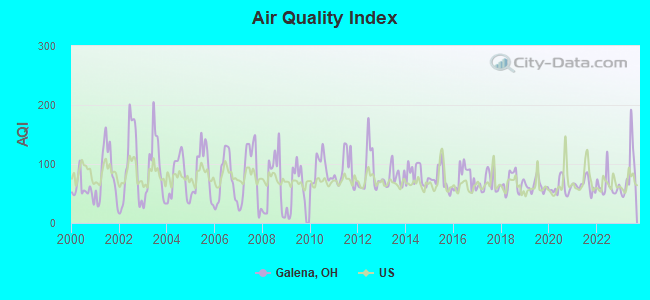
Air pollution - Air Quality Index (AQI)
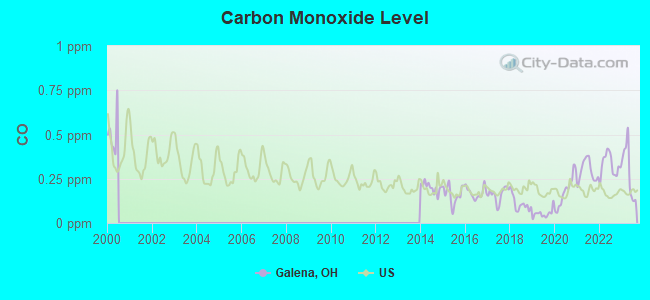
Air pollution - CO
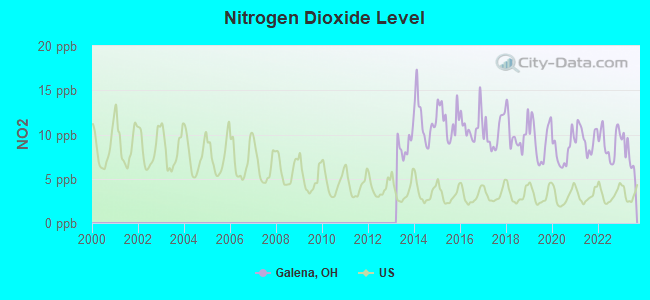
Air pollution - NO2
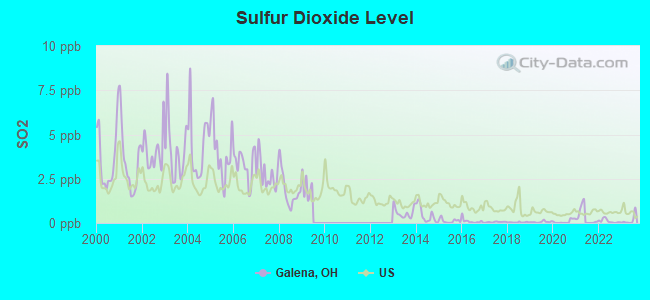
Air pollution - SO2
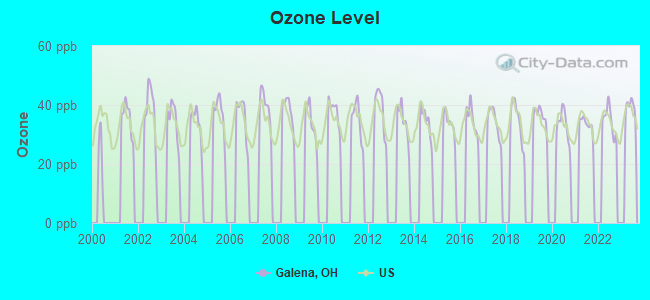
Air pollution - Ozone
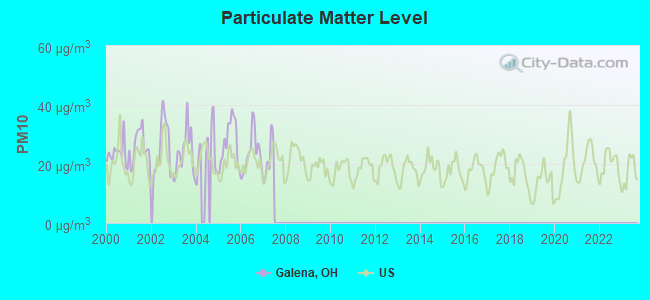
Air pollution - PM10
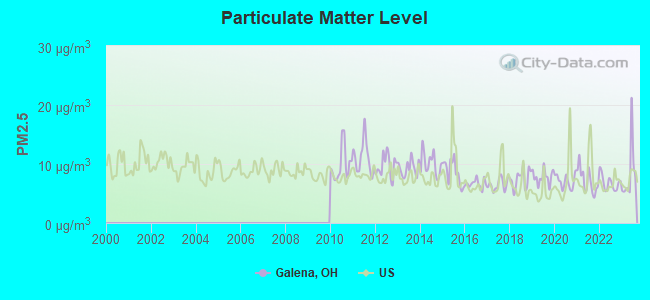
Air pollution - PM25
Air pollution - Pb
Crime - Murders per 100,000 population
Crime - Rapes per 100,000 population
Crime - Robberies per 100,000 population
Crime - Assaults per 100,000 population
Crime - Burglaries per 100,000 population
Crime - Thefts per 100,000 population
Crime - Auto thefts per 100,000 population
Crime - Arson per 100,000 population
Crime - City-data.com crime index
Crime - Violent crime index
Crime - Property crime index
Crime - Murders per 100,000 population (5 year average)
Crime - Rapes per 100,000 population (5 year average)
Crime - Robberies per 100,000 population (5 year average)
Crime - Assaults per 100,000 population (5 year average)
Crime - Burglaries per 100,000 population (5 year average)
Crime - Thefts per 100,000 population (5 year average)
Crime - Auto thefts per 100,000 population (5 year average)
Crime - Arson per 100,000 population (5 year average)
Crime - City-data.com crime index (5 year average)
Crime - Violent crime index (5 year average)
Crime - Property crime index (5 year average)
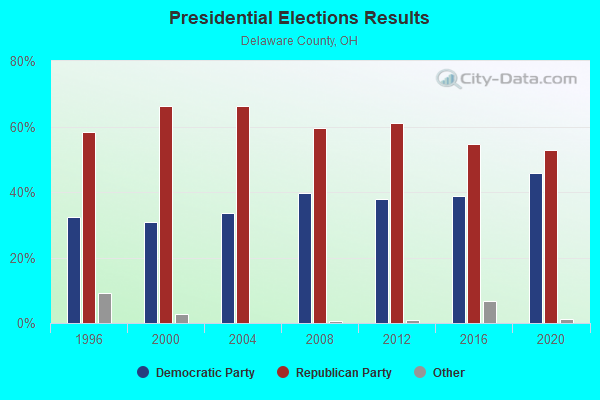
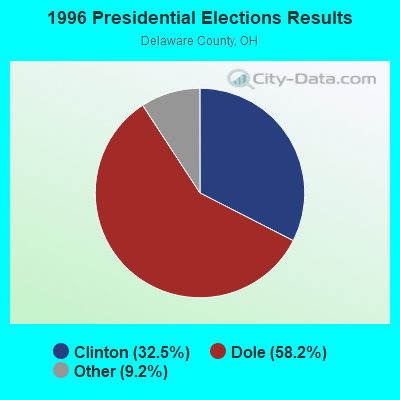
1996 Presidential Elections Results (%) - Democratic Party (Clinton)
1996 Presidential Elections Results (%) - Republican Party (Dole)
1996 Presidential Elections Results (%) - Other
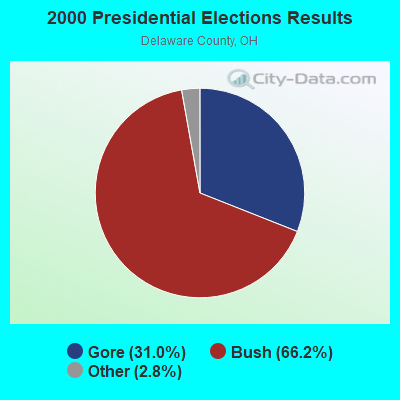
2000 Presidential Elections Results (%) - Democratic Party (Gore)
2000 Presidential Elections Results (%) - Republican Party (Bush)
2000 Presidential Elections Results (%) - Other
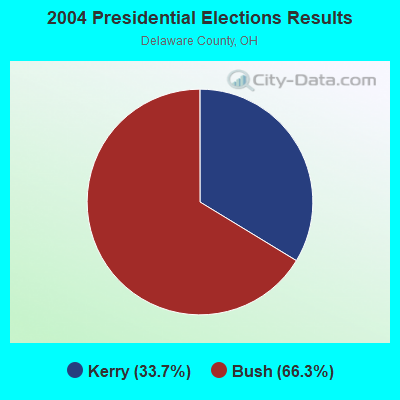
2004 Presidential Elections Results (%) - Democratic Party (Kerry)
2004 Presidential Elections Results (%) - Republican Party (Bush)
2004 Presidential Elections Results (%) - Other
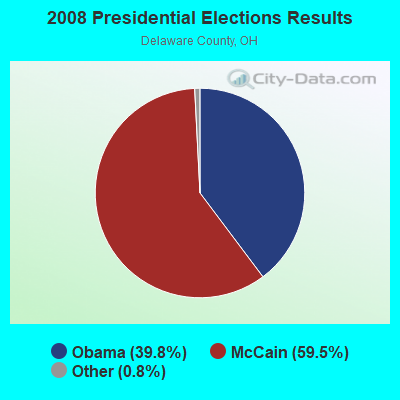
2008 Presidential Elections Results (%) - Democratic Party (Obama)
2008 Presidential Elections Results (%) - Republican Party (McCain)
2008 Presidential Elections Results (%) - Other
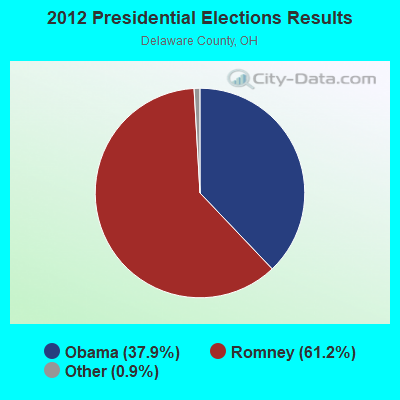
2012 Presidential Elections Results (%) - Democratic Party (Obama)
2012 Presidential Elections Results (%) - Republican Party (Romney)
2012 Presidential Elections Results (%) - Other
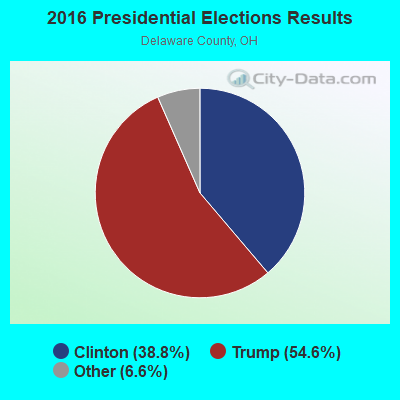
2016 Presidential Elections Results (%) - Democratic Party (Clinton)
2016 Presidential Elections Results (%) - Republican Party (Trump)
2016 Presidential Elections Results (%) - Other
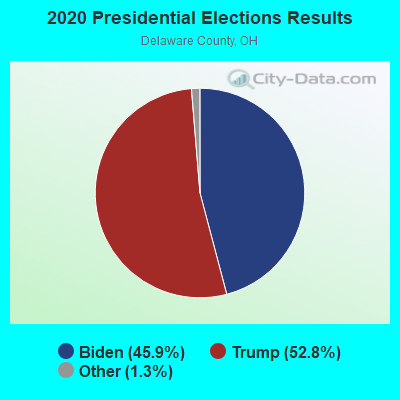
2020 Presidential Elections Results (%) - Democratic Party (Biden)
2020 Presidential Elections Results (%) - Republican Party (Trump)
2020 Presidential Elections Results (%) - Other
Ancestries Reported - Arab (%)
Ancestries Reported - Czech (%)
Ancestries Reported - Danish (%)
Ancestries Reported - Dutch (%)
Ancestries Reported - English (%)
Ancestries Reported - French (%)
Ancestries Reported - French Canadian (%)
Ancestries Reported - German (%)
Ancestries Reported - Greek (%)
Ancestries Reported - Hungarian (%)
Ancestries Reported - Irish (%)
Ancestries Reported - Italian (%)
Ancestries Reported - Lithuanian (%)
Ancestries Reported - Norwegian (%)
Ancestries Reported - Polish (%)
Ancestries Reported - Portuguese (%)
Ancestries Reported - Russian (%)
Ancestries Reported - Scotch-Irish (%)
Ancestries Reported - Scottish (%)
Ancestries Reported - Slovak (%)
Ancestries Reported - Subsaharan African (%)
Ancestries Reported - Swedish (%)
Ancestries Reported - Swiss (%)
Ancestries Reported - Ukrainian (%)
Ancestries Reported - United States (%)
Ancestries Reported - Welsh (%)
Ancestries Reported - West Indian (%)
Ancestries Reported - Other (%)
Educational Attainment - No schooling completed (%)
Educational Attainment - Less than high school (%)
Educational Attainment - High school or equivalent (%)
Educational Attainment - Less than 1 year of college (%)
Educational Attainment - 1 or more years of college (%)
Educational Attainment - Associate degree (%)
Educational Attainment - Bachelor's degree (%)
Educational Attainment - Master's degree (%)
Educational Attainment - Professional school degree (%)
Educational Attainment - Doctorate degree (%)
School Enrollment - Nursery, preschool (%)
School Enrollment - Kindergarten (%)
School Enrollment - Grade 1 to 4 (%)
School Enrollment - Grade 5 to 8 (%)
School Enrollment - Grade 9 to 12 (%)
School Enrollment - College undergrad (%)
School Enrollment - Graduate or professional (%)
School Enrollment - Not enrolled in school (%)
School enrollment - Public schools (%)
School enrollment - Private schools (%)
School enrollment - Not enrolled (%)
Median number of rooms in houses and condos
Median number of rooms in apartments
Housing units lacking complete plumbing facilities (%)
Housing units lacking complete kitchen facilities (%)
Density of houses
Urban houses (%)
Rural houses (%)
Households with people 60 years and over (%)
Households with people 65 years and over (%)
Households with people 75 years and over (%)
Households with one or more nonrelatives (%)
Households with no nonrelatives (%)
Population in households (%)
Family households (%)
Nonfamily households (%)
Population in families (%)
Family households with own children (%)
Median number of bedrooms in owner occupied houses
Mean number of bedrooms in owner occupied houses
Median number of bedrooms in renter occupied houses
Mean number of bedrooms in renter occupied houses
Median number of vehichles in owner occupied houses
Mean number of vehichles in owner occupied houses
Median number of vehichles in renter occupied houses
Mean number of vehichles in renter occupied houses
Mortgage status - with mortgage (%)
Mortgage status - with second mortgage (%)
Mortgage status - with home equity loan (%)
Mortgage status - with both second mortgage and home equity loan (%)
Mortgage status - without a mortgage (%)
Average family size
Average family size - White
Average family size - Black or African American
Average family size - Asian
Average family size - Hispanic or Latino
Average family size - American Indian and Alaska Native
Average family size - Multirace
Average family size - Other Race
Geographical mobility - Same house 1 year ago (%)
Geographical mobility - Moved within same county (%)
Geographical mobility - Moved from different county within same state (%)
Geographical mobility - Moved from different state (%)
Geographical mobility - Moved from abroad (%)
Place of birth - Born in state of residence (%)
Place of birth - Born in other state (%)
Place of birth - Native, outside of US (%)
Place of birth - Foreign born (%)
Housing units in structures - 1, detached (%)
Housing units in structures - 1, attached (%)
Housing units in structures - 2 (%)
Housing units in structures - 3 or 4 (%)
Housing units in structures - 5 to 9 (%)
Housing units in structures - 10 to 19 (%)
Housing units in structures - 20 to 49 (%)
Housing units in structures - 50 or more (%)
Housing units in structures - Mobile home (%)
Housing units in structures - Boat, RV, van, etc. (%)
House/condo owner moved in on average (years ago)
Renter moved in on average (years ago)
Year householder moved into unit - Moved in 1999 to March 2000 (%)
Year householder moved into unit - Moved in 1995 to 1998 (%)
Year householder moved into unit - Moved in 1990 to 1994 (%)
Year householder moved into unit - Moved in 1980 to 1989 (%)
Year householder moved into unit - Moved in 1970 to 1979 (%)
Year householder moved into unit - Moved in 1969 or earlier (%)
Means of transportation to work - Drove car alone (%)
Means of transportation to work - Carpooled (%)
Means of transportation to work - Public transportation (%)
Means of transportation to work - Bus or trolley bus (%)
Means of transportation to work - Streetcar or trolley car (%)
Means of transportation to work - Subway or elevated (%)
Means of transportation to work - Railroad (%)
Means of transportation to work - Ferryboat (%)
Means of transportation to work - Taxicab (%)
Means of transportation to work - Motorcycle (%)
Means of transportation to work - Bicycle (%)
Means of transportation to work - Walked (%)
Means of transportation to work - Other means (%)
Working at home (%)
Industry diversity
Most Common Industries - Agriculture, forestry, fishing and hunting, and mining (%)
Most Common Industries - Agriculture, forestry, fishing and hunting (%)
Most Common Industries - Mining, quarrying, and oil and gas extraction (%)
Most Common Industries - Construction (%)
Most Common Industries - Manufacturing (%)
Most Common Industries - Wholesale trade (%)
Most Common Industries - Retail trade (%)
Most Common Industries - Transportation and warehousing, and utilities (%)
Most Common Industries - Transportation and warehousing (%)
Most Common Industries - Utilities (%)
Most Common Industries - Information (%)
Most Common Industries - Finance and insurance, and real estate and rental and leasing (%)
Most Common Industries - Finance and insurance (%)
Most Common Industries - Real estate and rental and leasing (%)
Most Common Industries - Professional, scientific, and management, and administrative and waste management services (%)
Most Common Industries - Professional, scientific, and technical services (%)
Most Common Industries - Management of companies and enterprises (%)
Most Common Industries - Administrative and support and waste management services (%)
Most Common Industries - Educational services, and health care and social assistance (%)
Most Common Industries - Educational services (%)
Most Common Industries - Health care and social assistance (%)
Most Common Industries - Arts, entertainment, and recreation, and accommodation and food services (%)
Most Common Industries - Arts, entertainment, and recreation (%)
Most Common Industries - Accommodation and food services (%)
Most Common Industries - Other services, except public administration (%)
Most Common Industries - Public administration (%)
Occupation diversity
Most Common Occupations - Management, business, science, and arts occupations (%)
Most Common Occupations - Management, business, and financial occupations (%)
Most Common Occupations - Management occupations (%)
Most Common Occupations - Business and financial operations occupations (%)
Most Common Occupations - Computer, engineering, and science occupations (%)
Most Common Occupations - Computer and mathematical occupations (%)
Most Common Occupations - Architecture and engineering occupations (%)
Most Common Occupations - Life, physical, and social science occupations (%)
Most Common Occupations - Education, legal, community service, arts, and media occupations (%)
Most Common Occupations - Community and social service occupations (%)
Most Common Occupations - Legal occupations (%)
Most Common Occupations - Education, training, and library occupations (%)
Most Common Occupations - Arts, design, entertainment, sports, and media occupations (%)
Most Common Occupations - Healthcare practitioners and technical occupations (%)
Most Common Occupations - Health diagnosing and treating practitioners and other technical occupations (%)
Most Common Occupations - Health technologists and technicians (%)
Most Common Occupations - Service occupations (%)
Most Common Occupations - Healthcare support occupations (%)
Most Common Occupations - Protective service occupations (%)
Most Common Occupations - Fire fighting and prevention, and other protective service workers including supervisors (%)
Most Common Occupations - Law enforcement workers including supervisors (%)
Most Common Occupations - Food preparation and serving related occupations (%)
Most Common Occupations - Building and grounds cleaning and maintenance occupations (%)
Most Common Occupations - Personal care and service occupations (%)
Most Common Occupations - Sales and office occupations (%)
Most Common Occupations - Sales and related occupations (%)
Most Common Occupations - Office and administrative support occupations (%)
Most Common Occupations - Natural resources, construction, and maintenance occupations (%)
Most Common Occupations - Farming, fishing, and forestry occupations (%)
Most Common Occupations - Construction and extraction occupations (%)
Most Common Occupations - Installation, maintenance, and repair occupations (%)
Most Common Occupations - Production, transportation, and material moving occupations (%)
Most Common Occupations - Production occupations (%)
Most Common Occupations - Transportation occupations (%)
Most Common Occupations - Material moving occupations (%)
People in Group quarters - Institutionalized population (%)
People in Group quarters - Correctional institutions (%)
People in Group quarters - Federal prisons and detention centers (%)
People in Group quarters - Halfway houses (%)
People in Group quarters - Local jails and other confinement facilities (including police lockups) (%)
People in Group quarters - Military disciplinary barracks (%)
People in Group quarters - State prisons (%)
People in Group quarters - Other types of correctional institutions (%)
People in Group quarters - Nursing homes (%)
People in Group quarters - Hospitals/wards, hospices, and schools for the handicapped (%)
People in Group quarters - Hospitals/wards and hospices for chronically ill (%)
People in Group quarters - Hospices or homes for chronically ill (%)
People in Group quarters - Military hospitals or wards for chronically ill (%)
People in Group quarters - Other hospitals or wards for chronically ill (%)
People in Group quarters - Hospitals or wards for drug/alcohol abuse (%)
People in Group quarters - Mental (Psychiatric) hospitals or wards (%)
People in Group quarters - Schools, hospitals, or wards for the mentally retarded (%)
People in Group quarters - Schools, hospitals, or wards for the physically handicapped (%)
People in Group quarters - Institutions for the deaf (%)
People in Group quarters - Institutions for the blind (%)
People in Group quarters - Orthopedic wards and institutions for the physically handicapped (%)
People in Group quarters - Wards in general hospitals for patients who have no usual home elsewhere (%)
People in Group quarters - Wards in military hospitals for patients who have no usual home elsewhere (%)
People in Group quarters - Juvenile institutions (%)
People in Group quarters - Long-term care (%)
People in Group quarters - Homes for abused, dependent, and neglected children (%)
People in Group quarters - Residential treatment centers for emotionally disturbed children (%)
People in Group quarters - Training schools for juvenile delinquents (%)
People in Group quarters - Short-term care, detention or diagnostic centers for delinquent children (%)
People in Group quarters - Type of juvenile institution unknown (%)
People in Group quarters - Noninstitutionalized population (%)
People in Group quarters - College dormitories (includes college quarters off campus) (%)
People in Group quarters - Military quarters (%)
People in Group quarters - On base (%)
People in Group quarters - Barracks, unaccompanied personnel housing (UPH), (Enlisted/Officer), ;and similar group living quarters for military personnel (%)
People in Group quarters - Transient quarters for temporary residents (%)
People in Group quarters - Military ships (%)
People in Group quarters - Group homes (%)
People in Group quarters - Homes or halfway houses for drug/alcohol abuse (%)
People in Group quarters - Homes for the mentally ill (%)
People in Group quarters - Homes for the mentally retarded (%)
People in Group quarters - Homes for the physically handicapped (%)
People in Group quarters - Other group homes (%)
People in Group quarters - Religious group quarters (%)
People in Group quarters - Dormitories (%)
People in Group quarters - Agriculture workers' dormitories on farms (%)
People in Group quarters - Job Corps and vocational training facilities (%)
People in Group quarters - Other workers' dormitories (%)
People in Group quarters - Crews of maritime vessels (%)
People in Group quarters - Other nonhousehold living situations (%)
People in Group quarters - Other noninstitutional group quarters (%)
Residents speaking English at home (%)
Residents speaking English at home - Born in the United States (%)
Residents speaking English at home - Native, born elsewhere (%)
Residents speaking English at home - Foreign born (%)
Residents speaking Spanish at home (%)
Residents speaking Spanish at home - Born in the United States (%)
Residents speaking Spanish at home - Native, born elsewhere (%)
Residents speaking Spanish at home - Foreign born (%)
Residents speaking other language at home (%)
Residents speaking other language at home - Born in the United States (%)
Residents speaking other language at home - Native, born elsewhere (%)
Residents speaking other language at home - Foreign born (%)
Class of Workers - Employee of private company (%)
Class of Workers - Self-employed in own incorporated business (%)
Class of Workers - Private not-for-profit wage and salary workers (%)
Class of Workers - Local government workers (%)
Class of Workers - State government workers (%)
Class of Workers - Federal government workers (%)
Class of Workers - Self-employed workers in own not incorporated business and Unpaid family workers (%)
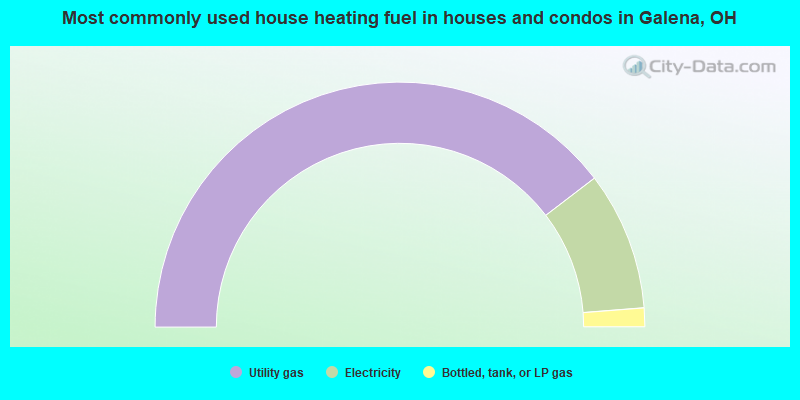
House heating fuel used in houses and condos - Utility gas (%)
House heating fuel used in houses and condos - Bottled, tank, or LP gas (%)
House heating fuel used in houses and condos - Electricity (%)
House heating fuel used in houses and condos - Fuel oil, kerosene, etc. (%)
House heating fuel used in houses and condos - Coal or coke (%)
House heating fuel used in houses and condos - Wood (%)
House heating fuel used in houses and condos - Solar energy (%)
House heating fuel used in houses and condos - Other fuel (%)
House heating fuel used in houses and condos - No fuel used (%)
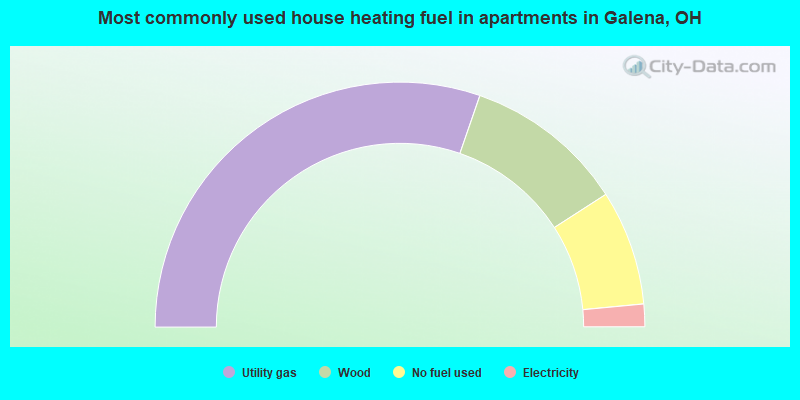
House heating fuel used in apartments - Utility gas (%)
House heating fuel used in apartments - Bottled, tank, or LP gas (%)
House heating fuel used in apartments - Electricity (%)
House heating fuel used in apartments - Fuel oil, kerosene, etc. (%)
House heating fuel used in apartments - Coal or coke (%)
House heating fuel used in apartments - Wood (%)
House heating fuel used in apartments - Solar energy (%)
House heating fuel used in apartments - Other fuel (%)
House heating fuel used in apartments - No fuel used (%)
Armed forces status - In Armed Forces (%)
Armed forces status - Civilian (%)
Armed forces status - Civilian - Veteran (%)
Armed forces status - Civilian - Nonveteran (%)
Fatal accidents locations in years 2005-2021
Fatal accidents locations in 2005
Fatal accidents locations in 2006
Fatal accidents locations in 2007
Fatal accidents locations in 2008
Fatal accidents locations in 2009
Fatal accidents locations in 2010
Fatal accidents locations in 2011
Fatal accidents locations in 2012
Fatal accidents locations in 2013
Fatal accidents locations in 2014
Fatal accidents locations in 2015
Fatal accidents locations in 2016
Fatal accidents locations in 2017
Fatal accidents locations in 2018
Fatal accidents locations in 2019
Fatal accidents locations in 2020
Fatal accidents locations in 2021
Alcohol use - People drinking some alcohol every month (%)
Alcohol use - People not drinking at all (%)
Alcohol use - Average days/month drinking alcohol
Alcohol use - Average drinks/week
Alcohol use - Average days/year people drink much
Audiometry - Average condition of hearing (%)
Audiometry - People that can hear a whisper from across a quiet room (%)
Audiometry - People that can hear normal voice from across a quiet room (%)
Audiometry - Ears ringing, roaring, buzzing (%)
Audiometry - Had a job exposure to loud noise (%)
Audiometry - Had off-work exposure to loud noise (%)
Blood Pressure & Cholesterol - Has high blood pressure (%)
Blood Pressure & Cholesterol - Checking blood pressure at home (%)
Blood Pressure & Cholesterol - Frequently checking blood cholesterol (%)
Blood Pressure & Cholesterol - Has high cholesterol level (%)
Consumer Behavior - Money monthly spent on food at supermarket/grocery store
Consumer Behavior - Money monthly spent on food at other stores
Consumer Behavior - Money monthly spent on eating out
Consumer Behavior - Money monthly spent on carryout/delivered foods
Consumer Behavior - Income spent on food at supermarket/grocery store (%)
Consumer Behavior - Income spent on food at other stores (%)
Consumer Behavior - Income spent on eating out (%)
Consumer Behavior - Income spent on carryout/delivered foods (%)
Current Health Status - General health condition (%)
Current Health Status - Blood donors (%)
Current Health Status - Has blood ever tested for HIV virus (%)
Current Health Status - Left-handed people (%)
Dermatology - People using sunscreen (%)
Diabetes - Diabetics (%)
Diabetes - Had a blood test for high blood sugar (%)
Diabetes - People taking insulin (%)
Diet Behavior & Nutrition - Diet health (%)
Diet Behavior & Nutrition - Milk product consumption (# of products/month)
Diet Behavior & Nutrition - Meals not home prepared (#/week)
Diet Behavior & Nutrition - Meals from fast food or pizza place (#/week)
Diet Behavior & Nutrition - Ready-to-eat foods (#/month)
Diet Behavior & Nutrition - Frozen meals/pizza (#/month)
Drug Use - People that ever used marijuana or hashish (%)
Drug Use - Ever used hard drugs (%)
Drug Use - Ever used any form of cocaine (%)
Drug Use - Ever used heroin (%)
Drug Use - Ever used methamphetamine (%)
Health Insurance - People covered by health insurance (%)
Kidney Conditions-Urology - Avg. # of times urinating at night
Medical Conditions - People with asthma (%)
Medical Conditions - People with anemia (%)
Medical Conditions - People with psoriasis (%)
Medical Conditions - People with overweight (%)
Medical Conditions - Elderly people having difficulties in thinking or remembering (%)
Medical Conditions - People who ever received blood transfusion (%)
Medical Conditions - People having trouble seeing even with glass/contacts (%)
Medical Conditions - People with arthritis (%)
Medical Conditions - People with gout (%)
Medical Conditions - People with congestive heart failure (%)
Medical Conditions - People with coronary heart disease (%)
Medical Conditions - People with angina pectoris (%)
Medical Conditions - People who ever had heart attack (%)
Medical Conditions - People who ever had stroke (%)
Medical Conditions - People with emphysema (%)
Medical Conditions - People with thyroid problem (%)
Medical Conditions - People with chronic bronchitis (%)
Medical Conditions - People with any liver condition (%)
Medical Conditions - People who ever had cancer or malignancy (%)
Mental Health - People who have little interest in doing things (%)
Mental Health - People feeling down, depressed, or hopeless (%)
Mental Health - People who have trouble sleeping or sleeping too much (%)
Mental Health - People feeling tired or having little energy (%)
Mental Health - People with poor appetite or overeating (%)
Mental Health - People feeling bad about themself (%)
Mental Health - People who have trouble concentrating on things (%)
Mental Health - People moving or speaking slowly or too fast (%)
Mental Health - People having thoughts they would be better off dead (%)
Oral Health - Average years since last visit a dentist
Oral Health - People embarrassed because of mouth (%)
Oral Health - People with gum disease (%)
Oral Health - General health of teeth and gums (%)
Oral Health - Average days a week using dental floss/device
Oral Health - Average days a week using mouthwash for dental problem
Oral Health - Average number of teeth
Pesticide Use - Households using pesticides to control insects (%)
Pesticide Use - Households using pesticides to kill weeds (%)
Physical Activity - People doing vigorous-intensity work activities (%)
Physical Activity - People doing moderate-intensity work activities (%)
Physical Activity - People walking or bicycling (%)
Physical Activity - People doing vigorous-intensity recreational activities (%)
Physical Activity - People doing moderate-intensity recreational activities (%)
Physical Activity - Average hours a day doing sedentary activities
Physical Activity - Average hours a day watching TV or videos
Physical Activity - Average hours a day using computer
Physical Functioning - People having limitations keeping them from working (%)
Physical Functioning - People limited in amount of work they can do (%)
Physical Functioning - People that need special equipment to walk (%)
Physical Functioning - People experiencing confusion/memory problems (%)
Physical Functioning - People requiring special healthcare equipment (%)
Prescription Medications - Average number of prescription medicines taking
Preventive Aspirin Use - Adults 40+ taking low-dose aspirin (%)
Reproductive Health - Vaginal deliveries (%)
Reproductive Health - Cesarean deliveries (%)
Reproductive Health - Deliveries resulted in a live birth (%)
Reproductive Health - Pregnancies resulted in a delivery (%)
Reproductive Health - Women breastfeeding newborns (%)
Reproductive Health - Women that had a hysterectomy (%)
Reproductive Health - Women that had both ovaries removed (%)
Reproductive Health - Women that have ever taken birth control pills (%)
Reproductive Health - Women taking birth control pills (%)
Reproductive Health - Women that have ever used Depo-Provera or injectables (%)
Reproductive Health - Women that have ever used female hormones (%)
Sexual Behavior - People 18+ that ever had sex (vaginal, anal, or oral) (%)
Sexual Behavior - Males 18+ that ever had vaginal sex with a woman (%)
Sexual Behavior - Males 18+ that ever performed oral sex on a woman (%)
Sexual Behavior - Males 18+ that ever had anal sex with a woman (%)
Sexual Behavior - Males 18+ that ever had any sex with a man (%)
Sexual Behavior - Females 18+ that ever had vaginal sex with a man (%)
Sexual Behavior - Females 18+ that ever performed oral sex on a man (%)
Sexual Behavior - Females 18+ that ever had anal sex with a man (%)
Sexual Behavior - Females 18+ that ever had any kind of sex with a woman (%)
Sexual Behavior - Average age people first had sex
Sexual Behavior - Average number of female sex partners in lifetime (males 18+)
Sexual Behavior - Average number of female vaginal sex partners in lifetime (males 18+)
Sexual Behavior - Average age people first performed oral sex on a woman (18+)
Sexual Behavior - Average number of woman performed oral sex on in lifetime (18+)
Sexual Behavior - Average number of male sex partners in lifetime (males 18+)
Sexual Behavior - Average number of male anal sex partners in lifetime (males 18+)
Sexual Behavior - Average age people first performed oral sex on a man (18+)
Sexual Behavior - Average number of male oral sex partners in lifetime (18+)
Sexual Behavior - People using protection when performing oral sex (%)
Sexual Behavior - Average number of times people have vaginal or anal sex a year
Sexual Behavior - People having sex without condom (%)
Sexual Behavior - Average number of male sex partners in lifetime (females 18+)
Sexual Behavior - Average number of male vaginal sex partners in lifetime (females 18+)
Sexual Behavior - Average number of female sex partners in lifetime (females 18+)
Sexual Behavior - Circumcised males 18+ (%)
Sleep Disorders - Average hours sleeping at night
Sleep Disorders - People that has trouble sleeping (%)
Smoking-Cigarette Use - People smoking cigarettes (%)
Taste & Smell - People 40+ having problems with smell (%)
Taste & Smell - People 40+ having problems with taste (%)
Taste & Smell - People 40+ that ever had wisdom teeth removed (%)
Taste & Smell - People 40+ that ever had tonsils teeth removed (%)
Taste & Smell - People 40+ that ever had a loss of consciousness because of a head injury (%)
Taste & Smell - People 40+ that ever had a broken nose or other serious injury to face or skull (%)
Taste & Smell - People 40+ that ever had two or more sinus infections (%)
Weight - Average height (inches)
Weight - Average weight (pounds)
Weight - Average BMI
Weight - People that are obese (%)
Weight - People that ever were obese (%)
Weight - People trying to lose weight (%)
Latest news from Galena, OH collected exclusively by city-data.com from local newspapers, TV, and radio stations
Ancestries: German (21.4%), American (20.2%), English (8.9%), Irish (5.0%), European (3.7%), Italian (3.0%).
Current Local Time:
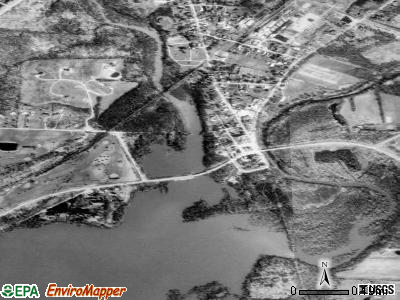
Land area: 0.60 square miles.
Population density: 1,656 people per square mile (low).
73 residents are foreign born (2.0% Asia , 1.6% Latin America , 1.1% Europe , 1.1% Africa ).
This village:
5.8%Ohio:
4.9%
Median real estate property taxes paid for housing units with mortgages in 2022: $5,157 (1.1%)Median real estate property taxes paid for housing units with no mortgage in 2022: $4,694 (1.3%)
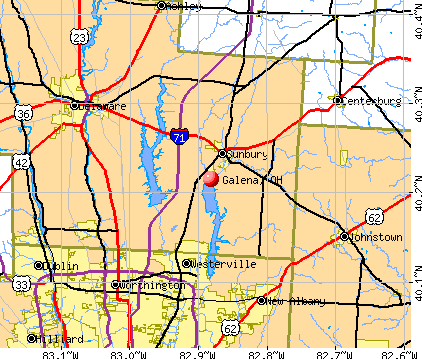
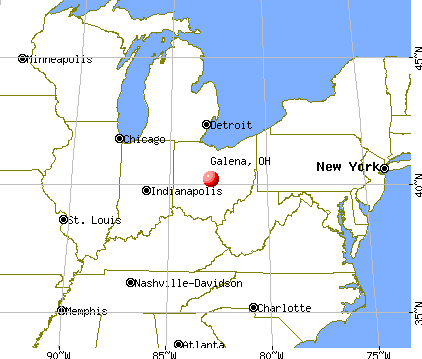
Nearest city with pop. 50,000+: Columbus, OH
Nearest city with pop. 1,000,000+: Chicago, IL
Nearest cities:
Kilbourne, OH (3.0 miles),
Latitude: 40.22 N, Longitude: 82.88 W
Unemployment in December 2023:
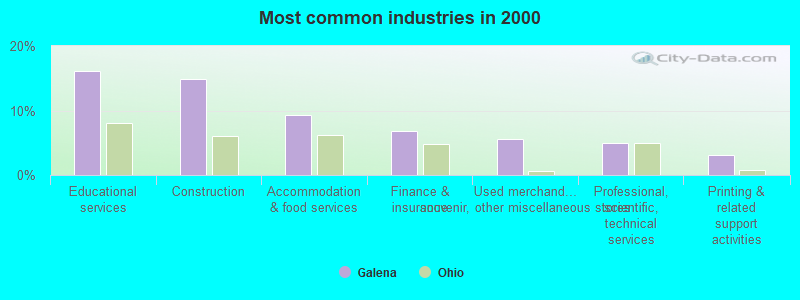
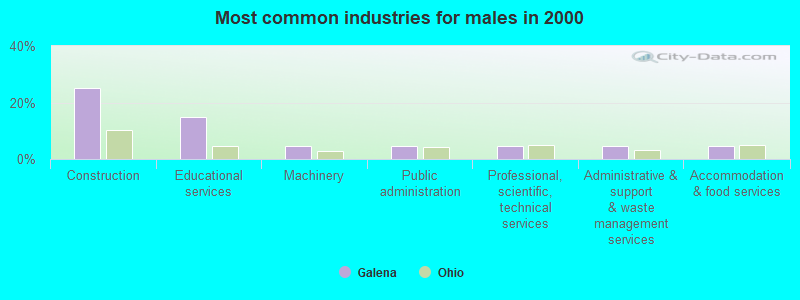
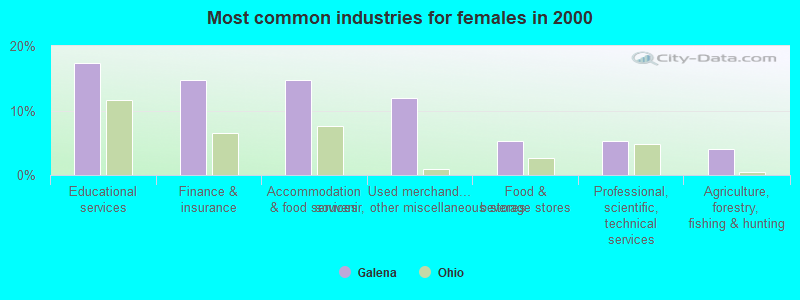
Most common industries in Galena, OH (%)
Both Males Females
Educational services (16.0%)
Construction (14.8%)
Accommodation & food services (9.3%)
Finance & insurance (6.8%)
Used merchandise, gift, novelty, souvenir, other miscellaneous stores (5.6%)
Professional, scientific, technical services (4.9%)
Printing & related support activities (3.1%)
Construction (25.3%)
Educational services (14.9%)
Machinery (4.6%)
Public administration (4.6%)
Professional, scientific, technical services (4.6%)
Administrative & support & waste management services (4.6%)
Accommodation & food services (4.6%)
Educational services (17.3%)
Finance & insurance (14.7%)
Accommodation & food services (14.7%)
Used merchandise, gift, novelty, souvenir, other miscellaneous stores (12.0%)
Food & beverage stores (5.3%)
Professional, scientific, technical services (5.3%)
Agriculture, forestry, fishing & hunting (4.0%)
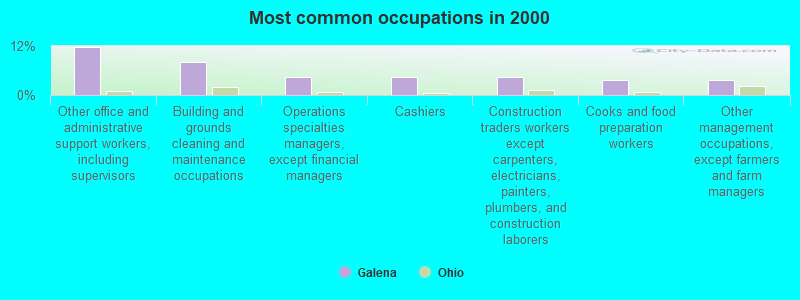
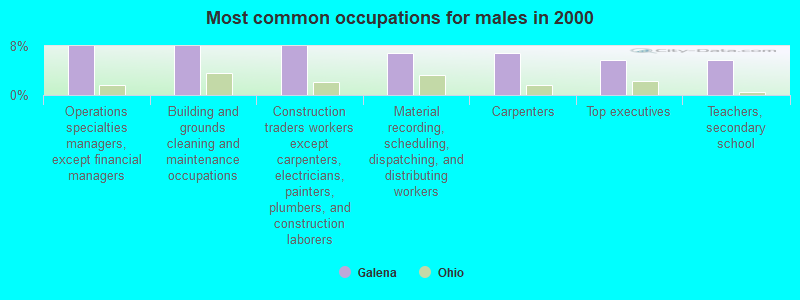
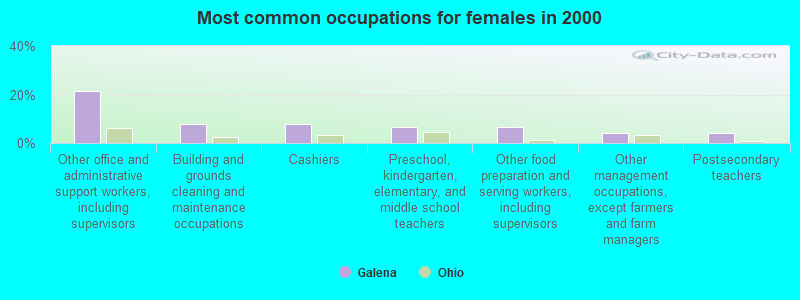
Most common occupations in Galena, OH (%)
Both Males Females
Other office and administrative support workers, including supervisors (11.7%)
Building and grounds cleaning and maintenance occupations (8.0%)
Operations specialties managers, except financial managers (4.3%)
Cashiers (4.3%)
Construction traders workers except carpenters, electricians, painters, plumbers, and construction laborers (4.3%)
Cooks and food preparation workers (3.7%)
Other management occupations, except farmers and farm managers (3.7%)
Operations specialties managers, except financial managers (8.0%)
Building and grounds cleaning and maintenance occupations (8.0%)
Construction traders workers except carpenters, electricians, painters, plumbers, and construction laborers (8.0%)
Material recording, scheduling, dispatching, and distributing workers (6.9%)
Carpenters (6.9%)
Top executives (5.7%)
Teachers, secondary school (5.7%)
Other office and administrative support workers, including supervisors (21.3%)
Building and grounds cleaning and maintenance occupations (8.0%)
Cashiers (8.0%)
Preschool, kindergarten, elementary, and middle school teachers (6.7%)
Other food preparation and serving workers, including supervisors (6.7%)
Other management occupations, except farmers and farm managers (4.0%)
Postsecondary teachers (4.0%)
Tornado activity:
Galena-area historical tornado activity is near Ohio state average. It is 22% greater than the overall U.S. average.
On 4/3/1974, a category F5 (max. wind speeds 261-318 mph) tornado 43.2 miles away from the Galena village center killed 36 people and injured 1150 people and caused between $50,000,000 and $500,000,000 in damages.
On 5/31/1985, a category F3 (max. wind speeds 158-206 mph) tornado 9.1 miles away from the village center killed one person and injured 20 people and caused between $5,000,000 and $50,000,000 in damages.
Earthquake activity:
Galena-area historical earthquake activity is significantly above Ohio state average. It is 23% smaller than the overall U.S. average. On 7/27/1980 at 18:52:21, a magnitude 5.2 (5.1 MB, 4.7 MS, 5.0 UK, 5.2 UK, Class: Moderate, Intensity: VI - VII) earthquake occurred 150.2 miles away from Galena center On 9/25/1998 at 19:52:52, a magnitude 5.2 (4.8 MB, 4.3 MS, 5.2 LG, 4.5 MW, Depth: 3.1 mi) earthquake occurred 157.1 miles away from the city center On 1/31/1986 at 16:46:43, a magnitude 5.0 (5.0 MB) earthquake occurred 131.5 miles away from Galena center On 8/23/2011 at 17:51:04, a magnitude 5.8 (5.8 MW, Depth: 3.7 mi) earthquake occurred 309.7 miles away from the city center On 7/12/1986 at 08:19:37, a magnitude 4.5 (4.5 MB, Class: Light, Intensity: IV - V) earthquake occurred 81.6 miles away from the city center On 4/18/2008 at 09:36:59, a magnitude 5.4 (5.1 MB, 4.8 MS, 5.4 MW, 5.2 MW) earthquake occurred 294.1 miles away from Galena center Magnitude types: regional Lg-wave magnitude (LG), body-wave magnitude (MB), surface-wave magnitude (MS), moment magnitude (MW) Natural disasters: The number of natural disasters in Delaware County (10) is smaller than the US average (15).Major Disasters (Presidential) Declared: 5Emergencies Declared: 4Storms: 3, Floods: 2, Snows: 2, Tornadoes: 2, Blizzard: 1, Hurricane: 1, Mudslide: 1, Snowstorm: 1, Tropical Depression: 1, Wind: 1, Winter Storm: 1, Other: 1 (Note: some incidents may be assigned to more than one category). Hospitals and medical centers near Galena: SUNBURY NURSING HOME (Nursing Home, about 3 miles away; SUNBURY, OH)
COUNTRY VIEW OF SUNBURY (Nursing Home, about 6 miles away; SUNBURY, OH)
MCHS-WESTERVILLE (Nursing Home, about 7 miles away; WESTERVILLE, OH)
EDGEWOOD MANOR OF WESTERVILLE (Nursing Home, about 7 miles away; WESTERVILLE, OH)
MANN NURSING HOME (Nursing Home, about 7 miles away; WESTERVILLE, OH)
NURSING SUPPORT CARE, LLC (Home Health Center, about 7 miles away; WESTERVILLE, OH)
ST ANN'S SKILLED NURSING FACILITY (Nursing Home, about 8 miles away; WESTERVILLE, OH)
Amtrak station near Galena: 19 miles: COLUMBUS (111 EAST TOWN ST.) - Bus Station Services: enclosed waiting area, public restrooms, public payphones.
Colleges/universities with over 2000 students nearest to Galena:
Otterbein University (about 7 miles; Westerville, OH ; Full-time enrollment: 2,933)
Ohio Dominican University (about 16 miles; Columbus, OH ; FT enrollment: 2,045)
Ohio State University-Main Campus (about 17 miles; Columbus, OH ; FT enrollment: 50,395)
Columbus State Community College (about 18 miles; Columbus, OH ; FT enrollment: 24,488)
Capital University (about 19 miles; Columbus, OH ; FT enrollment: 3,029)
Franklin University (about 19 miles; Columbus, OH ; FT enrollment: 3,736)
DeVry University-Ohio (about 20 miles; Columbus, OH ; FT enrollment: 3,896)
Public elementary/middle schools in Galena: WALNUT CREEK ELEMENTARY Students: 582, Location: 5600 GRAND OAK BLVD, Grades: KG-5)HYLEN SOUDERS ELEMENTARY SCHOOL Students: 417, Location: 4121 MILLER PAUL RD, Grades: PK-4)JOHNNYCAKE CORNERS ELEMENTARY SCHOOL Location: 6783 FALLING MEADOWS DR, Grades: PK-5)
BERKSHIRE MIDDLE SCHOOL Location: 2869 S. THREE B'S & K ROAD, Grades: 6-8)
See full list of schools located in Galena Delaware County has a predicted average indoor radon screening level greater than 4 pCi/L (pico curies per liter) - Highest Potential Average household size: This village:
3.0 peopleOhio:
2.4 people
Percentage of family households: This village:
80.4%Whole state:
65.0%
Percentage of households with unmarried partners: This village:
6.1%Whole state:
6.8%
No gay or lesbian households reported
Banks with branches in Galena (2011 data):
The Delaware County Bank and Trust Company: Galena Branch at 10 Park Street, branch established on 1965/07/01. Info updated 2011/11/15: Bank assets: $523.6 mil, Deposits: $446.1 mil, headquarters in Lewis Center, OH, negative income in the last year , Commercial Lending Specialization, 21 total offices , Holding Company: Dcb Financial Corp
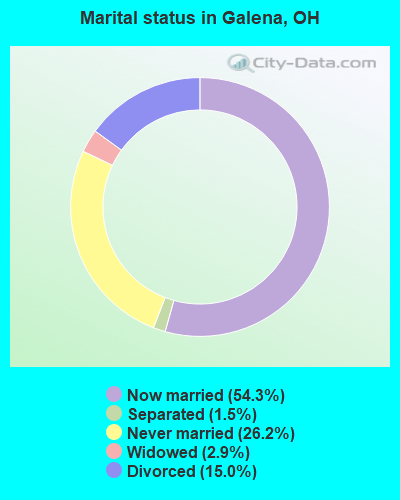
For population 15 years and over in Galena:
Never married: 26.2%Now married: 54.3%Separated: 1.5%Widowed: 2.9%Divorced: 15.0% For population 25 years and over in Galena:
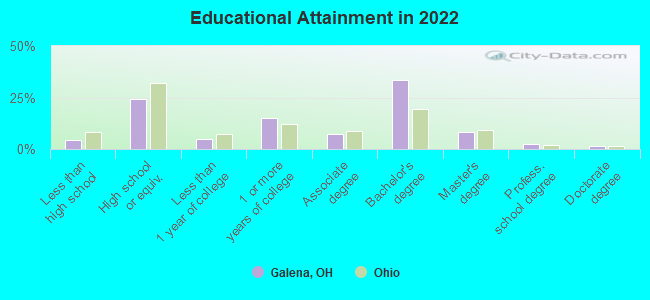
High school or higher: 96.6%Bachelor's degree or higher: 45.2%Graduate or professional degree: 12.9%Unemployed: 3.6%Mean travel time to work (commute): 25.1 minutes
Education Gini index (Inequality in education) Here:
10.7Ohio average:
11.0
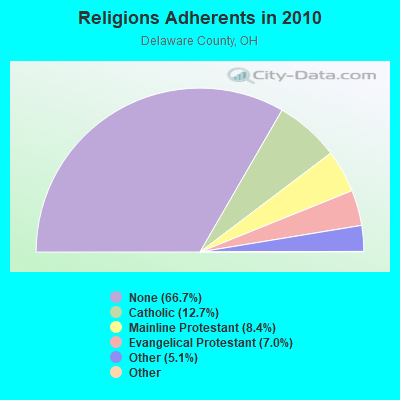
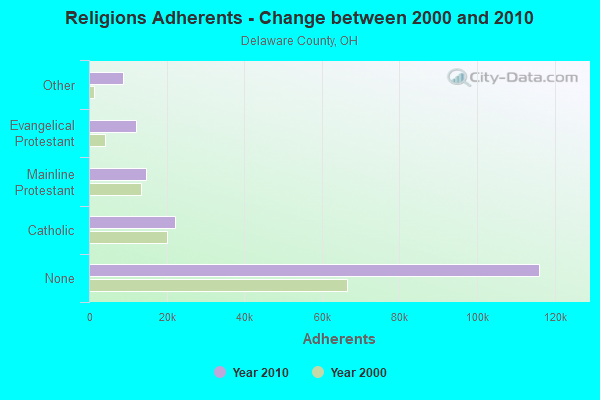
Religion statistics for Galena, OH (based on Delaware County data)
Religion Adherents Congregations Catholic 22,100 5 Mainline Protestant 14,636 41 Evangelical Protestant 12,235 61 Other 8,872 17 Black Protestant 139 1 Orthodox 114 1 None 116,118 -
Source: Clifford Grammich, Kirk Hadaway, Richard Houseal, Dale E.Jones, Alexei Krindatch, Richie Stanley and Richard H.Taylor. 2012. 2010 U.S.Religion Census: Religious Congregations & Membership Study. Association of Statisticians of American Religious Bodies. Jones, Dale E., et al. 2002. Congregations and Membership in the United States 2000. Nashville, TN: Glenmary Research Center. Graphs represent county-level data
Food Environment Statistics: Number of grocery stores : 17Delaware County :
1.06 / 10,000 pop.State :
1.89 / 10,000 pop.
Number of supercenters and club stores : 4This county :
0.25 / 10,000 pop.Ohio :
0.13 / 10,000 pop.
Number of convenience stores (no gas) : 8This county :
0.50 / 10,000 pop.State :
1.25 / 10,000 pop.
Number of convenience stores (with gas) : 31This county :
1.93 / 10,000 pop.Ohio :
2.93 / 10,000 pop.
Number of full-service restaurants : 116Here :
7.23 / 10,000 pop.State :
6.25 / 10,000 pop.
Adult diabetes rate : Delaware County :
8.3%State :
10.3%
Adult obesity rate : Delaware County :
27.1%Ohio :
29.1%
Low-income preschool obesity rate : Delaware County :
14.3%Ohio :
11.9%
Health and Nutrition:
Average overall health of teeth and gums : People feeling badly about themselves : People not drinking alcohol at all : Average hours sleeping at night : Overweight people : This city:
36.0%Ohio:
34.3%
General health condition : Average condition of hearing : More about Health and Nutrition of Galena, OH Residents
Local government employment and payroll (March 2022)
Function
Full-time employees
Monthly full-time payroll
Average yearly full-time wage
Part-time employees
Monthly part-time payroll
Streets and Highways
2 $6,387 $38,322 0 $0 Other Government Administration
1 $924 $11,088 11 $8,658 Financial Administration
1 $1,464 $17,568 1 $2,108
Totals for Government
4 $8,775 $26,325 12 $10,767
Galena government finances - Expenditure in 2017 (per resident):
Current Operations - Sewerage: $248,000 ($250.25)
Regular Highways: $59,000 ($59.54)Judicial and Legal Services: $44,000 ($44.40)Financial Administration: $39,000 ($39.35)General - Other: $28,000 ($28.25)General Public Buildings: $10,000 ($10.09)General - Interest on Debt: $44,000 ($44.40)
Total Salaries and Wages: $162,000 ($163.47)
Galena government finances - Revenue in 2017 (per resident):
Charges - Sewerage: $268,000 ($270.43)
Other: $7,000 ($7.06)Miscellaneous Commercial Activities: $3,000 ($3.03)Local Intergovernmental - Other: $65,000 ($65.59)
Highways: $6,000 ($6.05)Miscellaneous - Interest Earnings: $4,000 ($4.04)
State Intergovernmental - Highways: $30,000 ($30.27)
Tax - Individual Income: $383,000 ($386.48)
Property: $73,000 ($73.66)Other License: $15,000 ($15.14)Alcoholic Beverage License: $2,000 ($2.02)
Galena government finances - Debt in 2017 (per resident):
Long Term Debt - Beginning Outstanding - Unspecified Public Purpose: $1,099,000 ($1108.98)
Outstanding Unspecified Public Purpose: $1,061,000 ($1070.64)Retired Unspecified Public Purpose: $37,000 ($37.34)
Galena government finances - Cash and Securities in 2017 (per resident):
Other Funds - Cash and Securities: $914,000 ($922.30)
Strongest AM radio stations in Galena:
WRFD (880 AM; daytime; 23 kW; COLUMBUS-WORTHINGTON, OH; Owner: SALEM MEDIA OF OHIO, INC.)
WTVN (610 AM; 50 kW; COLUMBUS, OH; Owner: CITICASTERS LICENSES, L.P.)
WDLR (1550 AM; 4 kW; DELAWARE, OH; Owner: THE FIFTEEN FIFTY CORPORATION)
WOSU (820 AM; 5 kW; COLUMBUS, OH; Owner: THE OHIO STATE UNIVERSITY)
WBNS (1460 AM; 5 kW; COLUMBUS, OH; Owner: RADIOHIO, INCORPORATED)
WLW (700 AM; 50 kW; CINCINNATI, OH; Owner: JACOR BROADCASTING CORPORATION)
WKNR (850 AM; 50 kW; CLEVELAND, OH; Owner: CARON BROADCASTING, INC.)
WTAM (1100 AM; 50 kW; CLEVELAND, OH; Owner: JACOR BROADCASTING CORPORATION)
WHK (1220 AM; 50 kW; CLEVELAND, OH; Owner: CARON BROADCASTING, INC.)
WWVA (1170 AM; 53 kW; WHEELING, WV; Owner: CAPSTAR TX LIMITED PARTNERSHIP)
WJR (760 AM; 50 kW; DETROIT, MI; Owner: ABC, INC.)
WFDF (910 AM; 50 kW; FLINT, MI; Owner: ABC, INC.)
WVKO (1580 AM; 1 kW; COLUMBUS, OH; Owner: ASSOCIATED RADIO, INC.)
Strongest FM radio stations in Galena:
WEGE (103.9 FM; WESTERVILLE, OH; Owner: NORTH AMERICAN BROADCASTING CO. INC.)
WODB (107.9 FM; DELAWARE, OH; Owner: FRANKLIN COMMUNICATIONS, INC.)
WSNY (94.7 FM; COLUMBUS, OH; Owner: FRANKLIN COMMUNICATIONS, INC.)
W201AK (88.1 FM; COLUMBUS, OH; Owner: THE CEDARVILLE UNIVERSITY)
WOSU-FM (89.7 FM; COLUMBUS, OH; Owner: THE OHIO STATE UNIVERSITY)
WSMZ (103.1 FM; JOHNSTOWN, OH; Owner: STOP 26- RIVERBEND, INC.)
WBZX (99.7 FM; COLUMBUS, OH; Owner: NORTH AMERICAN BROADCASTING CO., INC)
WBNS-FM (97.1 FM; COLUMBUS, OH; Owner: RADIO OHIO, INC.)
WXMG (98.9 FM; UPPER ARLINGTON, OH; Owner: BLUE CHIP BROADCASTING LICENSES, LTD)
WCOL-FM (92.3 FM; COLUMBUS, OH; Owner: CITICASTERS LICENSES, L.P.)
WLVQ (96.3 FM; COLUMBUS, OH; Owner: INFINITY RADIO OPERATIONS INC.)
WCVO (104.9 FM; GAHANNA, OH; Owner: CHRISTIAN VOICE OF CENTRAL OHIO)
WUFM (88.7 FM; COLUMBUS, OH; Owner: SPIRIT COMMUNICATIONS, INC)
WNCI (97.9 FM; COLUMBUS, OH; Owner: CITICASTERS LICENSES, L.P.)
WFJX (105.7 FM; HILLIARD, OH; Owner: CITICASTERS LICENSES, L.P.)
WRVT (88.7 FM; RUTLAND, VT; Owner: VERMONT PUBLIC RADIO)
WCBE (90.5 FM; COLUMBUS, OH; Owner: BD.OF EDUC.,CITY SCH.DIST.,COLUMBUS)
WCKX (107.5 FM; COLUMBUS, OH; Owner: BLUE CHIP BROADCASTING LICENSES, LTD)
WQIO (93.7 FM; MOUNT VERNON, OH; Owner: CAPSTAR TX LIMITED PARTNERSHIP)
WWBK (98.3 FM; FREDERICKTOWN, OH; Owner: CAPSTAR TX LIMITED PARTNERSHIP)
TV broadcast stations around Galena:
WOSU-TV (Channel 34; COLUMBUS, OH; Owner: THE OHIO STATE UNIVERSITY)
WCPX-LP (Channel 48; COLUMBUS, OH; Owner: PAXSON COMMUNICATIONS LICENSE COMPANY, LLC)
WBNS-TV (Channel 10; COLUMBUS, OH; Owner: WBNS-TV, INC.)
WCMH-TV (Channel 4; COLUMBUS, OH; Owner: OUTLET BROADCASTING, INC.)
WSYX (Channel 6; COLUMBUS, OH; Owner: WSYX LICENSEE, INC.)
WTTE (Channel 28; COLUMBUS, OH; Owner: COLUMBUS (WTTE-TV) LICENSEE, INC.)
WINJ-LP (Channel 8; COLUMBUS, OH; Owner: THE NEW LIFE FELLOWSHIP OF CHURCHES)
WCLL-LP (Channel 19; COLUMBUS, OH; Owner: JONATHAN W. OWENS)
WDEM-LP (Channel 17; COLUMBUS, OH; Owner: TRIPLETT & ASSOCIATES, INC.)
WXCB-LP (Channel 42; DELAWARE, OH; Owner: CENTRAL OHIO ASSOCIATION OF CHRISTIAN BROADCASTERS)
WMFD-TV (Channel 68; MANSFIELD, OH; Owner: MID-STATE TELEVISION,INC.)
W43BZ (Channel 43; COLUMBUS, OH; Owner: VENTANA TELEVISION, INC.)
W23BZ (Channel 23; COLUMBUS, OH; Owner: NATIONAL MINORITY T.V., INC.)
WWHO (Channel 53; CHILLICOTHE, OH; Owner: UPN STATIONS GROUP INC.)
Galena fatal accident list:
Oct 24, 2021 07:52 PM, Sr-3 N State St, Lat: 40.231567, Lon: -82.880439, Vehicles: 1, Persons: 1, Fatalities: 1Lat: 40.229070, Lon: -82.883630, Vehicles: 2, Persons: 2, Fatalities: 1Lat: 40.227445, Lon: -82.885070, Vehicles: 2, Persons: 2, Fatalities: 1Vehicles: 2, Persons: 3, Fatalities: 1Vehicles: 2, Persons: 3, Fatalities: 1
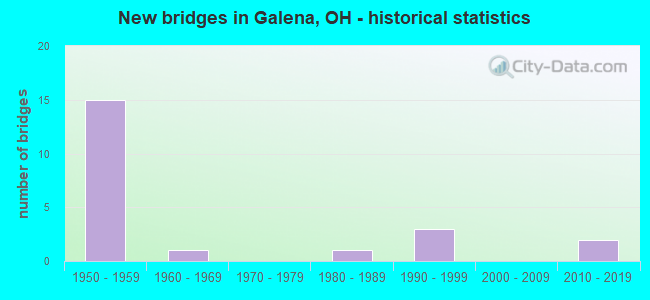
National Bridge Inventory (NBI) Statistics 22 Number of bridges236ft / 72.2m Total length $220,000 Total costs395,662 Total average daily traffic66,578 Total average daily truck traffic
New bridges - historical statistics
15 1950-1959 1 1960-1969 1 1980-1989 3 1990-1999 2 2010-2019
See full National Bridge Inventory statistics for Galena, OH
FCC Registered Antenna Towers: 59 (
See the full list of FCC Registered Antenna Towers in Galena )
FCC Registered Broadcast Land Mobile Towers: 6
GENOA FD, 7049 Big Walnut Road (Lat: 40.181444 Lon: -82.911694), Type: Tower, Structure height: 60.6 m, Call Sign: WPGR356, Assigned Frequencies: 852.900 MHz, Grant Date: 02/25/2015, Expiration Date: 03/03/2025, Registrant: County Of Delaware, 10 Court Street, Delaware, OH 43015, Phone: (740) 833-2160, Fax: (740) 833-2159, Email:
7049 Big Walnut Rd (Lat: 40.180611 Lon: -82.911278), Call Sign: KUV660, Assigned Frequencies: 33.8200 MHz, 33.8600 MHz, Grant Date: 01/13/1997, Expiration Date: 03/25/2002, Cancellation Date: 05/26/2002, Registrant: Genoa, Township Of, 7049 Big Walnut Rd, Galena, OH 43021, Phone: (614) 965-4216 3883 S Sr 605 (Lat: 40.163667 Lon: -82.805722), Call Sign: KXA446, Assigned Frequencies: 33.8200 MHz, 33.8600 MHz, Grant Date: 07/19/1999, Expiration Date: 09/19/2004, Cancellation Date: 11/20/2004, Registrant: Harlem Township Fire Dept, 3883 S Sr 605, Galena, OH 43021, Phone: (614) 965-4821 Lat: 40.161750 Lon: -82.951583, Call Sign: WQCL580, Assigned Frequencies: 467.437 MHz, 451.362 MHz, 462.287 MHz, 456.362 MHz, Grant Date: 03/24/2015, Expiration Date: 04/01/2025, Certifier: Chris Haunty, Registrant: Mitchell Communications Inc., 3470 Manchester Rd, Akron, OH 44319, Phone: (330) 644-0122, Fax: (214) 355-4971, Email:
Lat: 40.238694 Lon: -82.947111, Call Sign: WRDL944, Assigned Frequencies: 462.262 MHz, 467.262 MHz, 462.362 MHz, 467.362 MHz, Grant Date: 05/31/2019, Expiration Date: 05/31/2029, Certifier: Todd Voss, Registrant: Cara Enterprises Inc, Las Vegas, NV 89140-0124, Phone: (702) 838-9728, Fax: (702) 363-4607, Email:
3300 Miller Paul Rd (Lat: 40.181556 Lon: -82.829083), Call Sign: WRYD836, Assigned Frequencies: 452.187 MHz, 457.187 MHz, Grant Date: 07/28/2023, Expiration Date: 07/28/2033, Certifier: Glenn A Hay, Registrant: Mitchell Communications Inc, 3470 Manchester Rd, Akron, OH 44319, Phone: (330) 644-0122, Email:
FCC Registered Microwave Towers: 5
GALENA, 750 Bale Kenyon (Lat: 40.168389 Lon: -82.961278), Overall height: 50.3 m, Call Sign: WMQ908, Assigned Frequencies: 10618.7 MHz, Grant Date: 01/03/2001, Expiration Date: 02/01/2011, Cancellation Date: 08/03/2010, Registrant: Verizon Wireless, 1120 Sanctuary Pkwy, #150 Gasa5reg, Alpharetta, GA 30009-7630, Phone: (770) 797-1070, Fax: (770) 797-1036, Email:
GENOA PD, 7049 Big Walnut Road (Lat: 40.181444 Lon: -82.911694), Type: Ltower, Structure height: 60.6 m, Call Sign: WQDN330, Assigned Frequencies: 6845.00 MHz, 6815.00 MHz, 6845.00 MHz, 6815.00 MHz, 6845.00 MHz, 6815.00 MHz, 6845.00 MHz, 6815.00 MHz, 6745.00 MHz, 6785.00 MHz, Grant Date: 08/07/2015, Expiration Date: 10/06/2025, Certifier: John J Tracy, Registrant: County Of Delaware, 10 Court Street, Delaware, OH 43015, Phone: (740) 833-2160, Fax: (740) 833-2159, Email:
CB03XC105, 5690 Jaycox Road (Lat: 40.190889 Lon: -82.940028), Type: Mtower, Structure height: 53.3 m, Call Sign: WQTC867, Licensee ID: L01744207, Assigned Frequencies: 21925.0 MHz, Grant Date: 01/08/2014, Expiration Date: 01/08/2024, Cancellation Date: 05/09/2023, Certifier: Jenny Knopf, Registrant: Sprintcom LLC CHESHIRE AND AFRICA, 2467 Africa Road (Lat: 40.237361 Lon: -82.961389), Type: Mtower, Structure height: 57.9 m, Overall height: 60.7 m, Call Sign: WREQ292, Assigned Frequencies: 19540.0 MHz, 19540.0 MHz, 19540.0 MHz, 19540.0 MHz, 19540.0 MHz, 19540.0 MHz, 19540.0 MHz, 19540.0 MHz, 19540.0 MHz, Grant Date: 11/26/2019, Expiration Date: 11/26/2029, Certifier: Laurie Gebhardt, Registrant: Cellco Partnership, 5055 North Point Pkwy Np2ne Network Engineering, Alpharetta, GA 30022, Phone: (770) 797-1070, Email:
ALUM CREEK, 3600 Hollenback Rd (Lat: 40.216167 Lon: -82.981833), Overall height: 61 m, Call Sign: WLR385, Assigned Frequencies: 10553.7 MHz, Grant Date: 01/03/2001, Expiration Date: 02/01/2011, Cancellation Date: 08/03/2010, Registrant: Verizon Wireless, 1120 Sanctuary Pkwy, #150 Gasa5reg, Alpharetta, GA 30009-7630, Phone: (770) 797-1070, Fax: (770) 797-1036, Email:
FCC Registered Amateur Radio Licenses: 70 (
See the full list of FCC Registered Amateur Radio Licenses in Galena )
FAA Registered Aircraft Manufacturers and Dealers: 3 (
See the full list of FAA Registered Manufacturers and Dealers in Galena )
FAA Registered Aircraft: 18 (
See the full list of FAA Registered Aircraft )
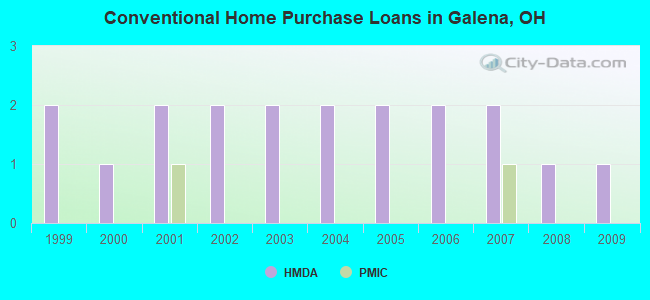
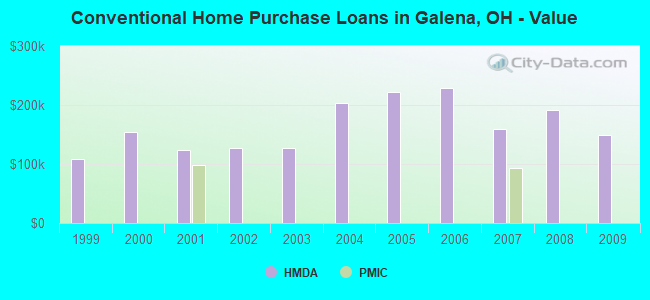
Home Mortgage Disclosure Act Aggregated Statistics For Year 2009(Based on 1 partial tract) A) FHA, FSA/RHS & VA B) Conventional C) Refinancings Number Average Value Number Average Value Number Average Value
LOANS ORIGINATED 1 $153,910 1 $149,210 4 $176,365 APPLICATIONS APPROVED, NOT ACCEPTED 0 $0 0 $0 0 $0 APPLICATIONS DENIED 0 $0 0 $0 1 $209,320 APPLICATIONS WITHDRAWN 0 $0 0 $0 1 $158,620 FILES CLOSED FOR INCOMPLETENESS 0 $0 0 $0 0 $0
Aggregated Statistics For Year 2008(Based on 1 partial tract) A) FHA, FSA/RHS & VA B) Conventional C) Refinancings Number Average Value Number Average Value Number Average Value
LOANS ORIGINATED 1 $106,630 1 $191,340 1 $275,760 APPLICATIONS APPROVED, NOT ACCEPTED 0 $0 0 $0 0 $0 APPLICATIONS DENIED 0 $0 0 $0 1 $139,380 APPLICATIONS WITHDRAWN 0 $0 0 $0 0 $0 FILES CLOSED FOR INCOMPLETENESS 0 $0 0 $0 0 $0
Aggregated Statistics For Year 2007(Based on 1 partial tract) B) Conventional C) Refinancings Number Average Value Number Average Value
LOANS ORIGINATED 2 $159,890 2 $129,385 APPLICATIONS APPROVED, NOT ACCEPTED 0 $0 0 $0 APPLICATIONS DENIED 0 $0 1 $195,590 APPLICATIONS WITHDRAWN 0 $0 1 $118,190 FILES CLOSED FOR INCOMPLETENESS 0 $0 0 $0
Aggregated Statistics For Year 2006(Based on 1 partial tract) B) Conventional C) Refinancings Number Average Value Number Average Value
LOANS ORIGINATED 2 $229,155 2 $189,220 APPLICATIONS APPROVED, NOT ACCEPTED 0 $0 0 $0 APPLICATIONS DENIED 0 $0 1 $214,310 APPLICATIONS WITHDRAWN 0 $0 1 $97,350 FILES CLOSED FOR INCOMPLETENESS 0 $0 0 $0
Aggregated Statistics For Year 2005(Based on 1 partial tract) B) Conventional C) Refinancings Number Average Value Number Average Value
LOANS ORIGINATED 2 $222,495 3 $160,953 APPLICATIONS APPROVED, NOT ACCEPTED 0 $0 1 $76,410 APPLICATIONS DENIED 0 $0 1 $224,960 APPLICATIONS WITHDRAWN 0 $0 1 $204,600 FILES CLOSED FOR INCOMPLETENESS 0 $0 0 $0
Aggregated Statistics For Year 2004(Based on 1 partial tract) B) Conventional C) Refinancings D) Home Improvement Loans Number Average Value Number Average Value Number Average Value
LOANS ORIGINATED 2 $202,600 4 $143,432 1 $24,050 APPLICATIONS APPROVED, NOT ACCEPTED 0 $0 1 $91,500 0 $0 APPLICATIONS DENIED 0 $0 2 $124,625 0 $0 APPLICATIONS WITHDRAWN 0 $0 1 $167,030 0 $0 FILES CLOSED FOR INCOMPLETENESS 0 $0 0 $0 0 $0
Aggregated Statistics For Year 2003(Based on 1 partial tract) A) FHA, FSA/RHS & VA B) Conventional C) Refinancings Number Average Value Number Average Value Number Average Value
LOANS ORIGINATED 1 $162,480 2 $127,600 8 $142,672 APPLICATIONS APPROVED, NOT ACCEPTED 0 $0 0 $0 1 $130,450 APPLICATIONS DENIED 0 $0 0 $0 2 $120,765 APPLICATIONS WITHDRAWN 0 $0 0 $0 1 $136,890 FILES CLOSED FOR INCOMPLETENESS 0 $0 0 $0 0 $0
Aggregated Statistics For Year 2002(Based on 1 partial tract) A) FHA, FSA/RHS & VA B) Conventional C) Refinancings Number Average Value Number Average Value Number Average Value
LOANS ORIGINATED 2 $119,200 2 $126,440 5 $155,416 APPLICATIONS APPROVED, NOT ACCEPTED 0 $0 0 $0 1 $114,470 APPLICATIONS DENIED 0 $0 0 $0 1 $115,870 APPLICATIONS WITHDRAWN 0 $0 0 $0 1 $103,180 FILES CLOSED FOR INCOMPLETENESS 0 $0 0 $0 0 $0
Aggregated Statistics For Year 2001(Based on 1 partial tract) A) FHA, FSA/RHS & VA B) Conventional C) Refinancings Number Average Value Number Average Value Number Average Value
LOANS ORIGINATED 1 $120,050 2 $123,145 4 $142,865 APPLICATIONS APPROVED, NOT ACCEPTED 0 $0 0 $0 1 $70,560 APPLICATIONS DENIED 0 $0 0 $0 1 $133,650 APPLICATIONS WITHDRAWN 0 $0 0 $0 1 $108,690 FILES CLOSED FOR INCOMPLETENESS 0 $0 0 $0 0 $0
Aggregated Statistics For Year 2000(Based on 1 partial tract) B) Conventional C) Refinancings Number Average Value Number Average Value
LOANS ORIGINATED 1 $153,750 1 $146,630 APPLICATIONS APPROVED, NOT ACCEPTED 0 $0 0 $0 APPLICATIONS DENIED 0 $0 1 $68,560 APPLICATIONS WITHDRAWN 0 $0 0 $0 FILES CLOSED FOR INCOMPLETENESS 0 $0 0 $0
Aggregated Statistics For Year 1999(Based on 1 partial tract) B) Conventional C) Refinancings Number Average Value Number Average Value
LOANS ORIGINATED 2 $108,525 3 $105,043 APPLICATIONS APPROVED, NOT ACCEPTED 0 $0 1 $60,590 APPLICATIONS DENIED 0 $0 1 $82,790 APPLICATIONS WITHDRAWN 0 $0 1 $59,060 FILES CLOSED FOR INCOMPLETENESS 0 $0 0 $0
Detailed HMDA statistics for the following Tracts:
0116.00
Private Mortgage Insurance Companies Aggregated Statistics For Year 2007(Based on 1 partial tract) A) Conventional Number Average Value
LOANS ORIGINATED 1 $93,110 APPLICATIONS APPROVED, NOT ACCEPTED 0 $0 APPLICATIONS DENIED 0 $0 APPLICATIONS WITHDRAWN 0 $0 FILES CLOSED FOR INCOMPLETENESS 0 $0
Aggregated Statistics For Year 2003(Based on 1 partial tract) B) Refinancings Number Average Value
LOANS ORIGINATED 1 $128,070 APPLICATIONS APPROVED, NOT ACCEPTED 0 $0 APPLICATIONS DENIED 0 $0 APPLICATIONS WITHDRAWN 0 $0 FILES CLOSED FOR INCOMPLETENESS 0 $0
Aggregated Statistics For Year 2002(Based on 1 partial tract) B) Refinancings Number Average Value
LOANS ORIGINATED 1 $79,410 APPLICATIONS APPROVED, NOT ACCEPTED 0 $0 APPLICATIONS DENIED 0 $0 APPLICATIONS WITHDRAWN 0 $0 FILES CLOSED FOR INCOMPLETENESS 0 $0
Aggregated Statistics For Year 2001(Based on 1 partial tract) A) Conventional Number Average Value
LOANS ORIGINATED 1 $98,190 APPLICATIONS APPROVED, NOT ACCEPTED 0 $0 APPLICATIONS DENIED 0 $0 APPLICATIONS WITHDRAWN 0 $0 FILES CLOSED FOR INCOMPLETENESS 0 $0
Detailed PMIC statistics for the following Tracts:
0116.00
Most common first names in Galena, OH among deceased individuals Name Count Lived (average)
Mary 39 81.7 years John 30 73.6 years James 26 75.1 years Robert 23 72.3 years Charles 18 72.5 years Donald 16 68.1 years William 14 68.7 years George 13 74.1 years Harry 10 75.3 years Walter 10 71.9 years
Most common last names in Galena, OH among deceased individuals Last name Count Lived (average)
Miller 18 75.5 years Brown 9 79.6 years Johnson 8 74.6 years Griffith 8 83.5 years Clark 7 80.1 years White 7 78.0 years Jones 6 81.2 years Sherman 6 75.1 years Potts 6 71.9 years Hale 6 77.2 years
Galena compared to Ohio state average:
Median household income above state average. Median house value above state average. Unemployed percentage significantly below state average. Hispanic race population percentage above state average. Median age below state average. Foreign-born population percentage significantly above state average. Renting percentage below state average. Length of stay since moving in below state average. Number of rooms per house above state average. House age below state average. Number of college students above state average. Percentage of population with a bachelor's degree or higher above state average.
Top Patent Applicants
John F. Judge (13)
Matthew J. Huddleston (8)
Frank S. Walczak (5)
Steven Davis (5)
William Combs (5)
Brian Richard Seemann (4)
Vikkie A. Mustad (4)
William J. Hook (4)
James K. Martin (3)
Patrick J. Riley (3)
Total of 122 patent applications in 2008-2024.


 Recent articles from our blog. Our writers, many of them Ph.D. graduates or candidates, create easy-to-read articles on a wide variety of topics.

 (16.6 miles

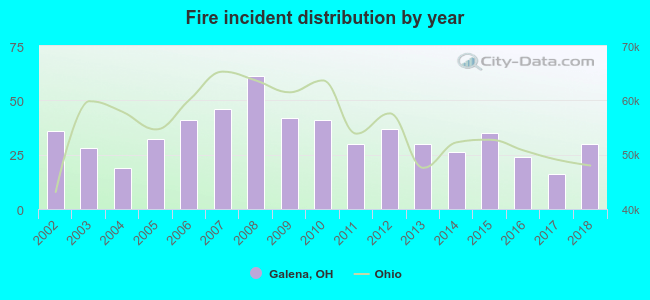 Based on the data from the years 2002 - 2018 the average number of fires per year is 34. The highest number of reported fires - 61 took place in 2008, and the least - 16 in 2017. The data has a declining trend.
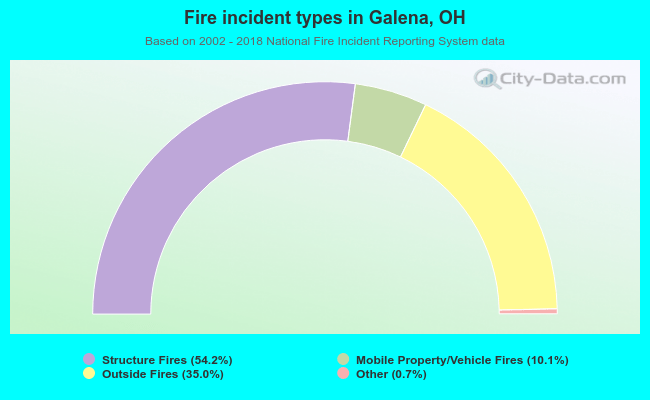 When looking into fire subcategories, the most incidents belonged to: Structure Fires (54.2%), and Outside Fires (35.0%).