Grove City, Pennsylvania Submit your own pictures of this borough and show them to the world
OSM Map
General Map
Google Map
MSN Map
OSM Map
General Map
Google Map
MSN Map
OSM Map
General Map
Google Map
MSN Map
OSM Map
General Map
Google Map
MSN Map
Please wait while loading the map...
Population in 2022: 7,856 (100% urban, 0% rural). Population change since 2000: -2.1%Males: 3,850 Females: 4,006
March 2022 cost of living index in Grove City: 93.7 (less than average, U.S. average is 100) Percentage of residents living in poverty in 2022: 11.1%for White Non-Hispanic residents , 16.1% for Black residents , 17.5% for Hispanic or Latino residents , 33.0% for other race residents , 0.5% for two or more races residents )
Profiles of local businesses
Business Search - 14 Million verified businesses
Data:
Median household income ($)
Median household income (% change since 2000)
Household income diversity
Ratio of average income to average house value (%)
Ratio of average income to average rent
Median household income ($) - White
Median household income ($) - Black or African American
Median household income ($) - Asian
Median household income ($) - Hispanic or Latino
Median household income ($) - American Indian and Alaska Native
Median household income ($) - Multirace
Median household income ($) - Other Race
Median household income for houses/condos with a mortgage ($)
Median household income for apartments without a mortgage ($)
Races - White alone (%)
Races - White alone (% change since 2000)
Races - Black alone (%)
Races - Black alone (% change since 2000)
Races - American Indian alone (%)
Races - American Indian alone (% change since 2000)
Races - Asian alone (%)
Races - Asian alone (% change since 2000)
Races - Hispanic (%)
Races - Hispanic (% change since 2000)
Races - Native Hawaiian and Other Pacific Islander alone (%)
Races - Native Hawaiian and Other Pacific Islander alone (% change since 2000)
Races - Two or more races (%)
Races - Two or more races (% change since 2000)
Races - Other race alone (%)
Races - Other race alone (% change since 2000)
Racial diversity
Unemployment (%)
Unemployment (% change since 2000)
Unemployment (%) - White
Unemployment (%) - Black or African American
Unemployment (%) - Asian
Unemployment (%) - Hispanic or Latino
Unemployment (%) - American Indian and Alaska Native
Unemployment (%) - Multirace
Unemployment (%) - Other Race
Population density (people per square mile)
Population - Males (%)
Population - Females (%)
Population - Males (%) - White
Population - Males (%) - Black or African American
Population - Males (%) - Asian
Population - Males (%) - Hispanic or Latino
Population - Males (%) - American Indian and Alaska Native
Population - Males (%) - Multirace
Population - Males (%) - Other Race
Population - Females (%) - White
Population - Females (%) - Black or African American
Population - Females (%) - Asian
Population - Females (%) - Hispanic or Latino
Population - Females (%) - American Indian and Alaska Native
Population - Females (%) - Multirace
Population - Females (%) - Other Race
Coronavirus confirmed cases (Apr 27, 2024)
Deaths caused by coronavirus (Apr 27, 2024)
Coronavirus confirmed cases (per 100k population) (Apr 27, 2024)
Deaths caused by coronavirus (per 100k population) (Apr 27, 2024)
Daily increase in number of cases (Apr 27, 2024)
Weekly increase in number of cases (Apr 27, 2024)
Cases doubled (in days) (Apr 27, 2024)
Hospitalized patients (Apr 18, 2022)
Negative test results (Apr 18, 2022)
Total test results (Apr 18, 2022)
COVID Vaccine doses distributed (per 100k population) (Sep 19, 2023)
COVID Vaccine doses administered (per 100k population) (Sep 19, 2023)
COVID Vaccine doses distributed (Sep 19, 2023)
COVID Vaccine doses administered (Sep 19, 2023)
Likely homosexual households (%)
Likely homosexual households (% change since 2000)
Likely homosexual households - Lesbian couples (%)
Likely homosexual households - Lesbian couples (% change since 2000)
Likely homosexual households - Gay men (%)
Likely homosexual households - Gay men (% change since 2000)
Cost of living index
Median gross rent ($)
Median contract rent ($)
Median monthly housing costs ($)
Median house or condo value ($)
Median house or condo value ($ change since 2000)
Mean house or condo value by units in structure - 1, detached ($)
Mean house or condo value by units in structure - 1, attached ($)
Mean house or condo value by units in structure - 2 ($)
Mean house or condo value by units in structure by units in structure - 3 or 4 ($)
Mean house or condo value by units in structure - 5 or more ($)
Mean house or condo value by units in structure - Boat, RV, van, etc. ($)
Mean house or condo value by units in structure - Mobile home ($)
Median house or condo value ($) - White
Median house or condo value ($) - Black or African American
Median house or condo value ($) - Asian
Median house or condo value ($) - Hispanic or Latino
Median house or condo value ($) - American Indian and Alaska Native
Median house or condo value ($) - Multirace
Median house or condo value ($) - Other Race
Median resident age
Resident age diversity
Median resident age - Males
Median resident age - Females
Median resident age - White
Median resident age - Black or African American
Median resident age - Asian
Median resident age - Hispanic or Latino
Median resident age - American Indian and Alaska Native
Median resident age - Multirace
Median resident age - Other Race
Median resident age - Males - White
Median resident age - Males - Black or African American
Median resident age - Males - Asian
Median resident age - Males - Hispanic or Latino
Median resident age - Males - American Indian and Alaska Native
Median resident age - Males - Multirace
Median resident age - Males - Other Race
Median resident age - Females - White
Median resident age - Females - Black or African American
Median resident age - Females - Asian
Median resident age - Females - Hispanic or Latino
Median resident age - Females - American Indian and Alaska Native
Median resident age - Females - Multirace
Median resident age - Females - Other Race
Commute - mean travel time to work (minutes)
Travel time to work - Less than 5 minutes (%)
Travel time to work - Less than 5 minutes (% change since 2000)
Travel time to work - 5 to 9 minutes (%)
Travel time to work - 5 to 9 minutes (% change since 2000)
Travel time to work - 10 to 19 minutes (%)
Travel time to work - 10 to 19 minutes (% change since 2000)
Travel time to work - 20 to 29 minutes (%)
Travel time to work - 20 to 29 minutes (% change since 2000)
Travel time to work - 30 to 39 minutes (%)
Travel time to work - 30 to 39 minutes (% change since 2000)
Travel time to work - 40 to 59 minutes (%)
Travel time to work - 40 to 59 minutes (% change since 2000)
Travel time to work - 60 to 89 minutes (%)
Travel time to work - 60 to 89 minutes (% change since 2000)
Travel time to work - 90 or more minutes (%)
Travel time to work - 90 or more minutes (% change since 2000)
Marital status - Never married (%)
Marital status - Now married (%)
Marital status - Separated (%)
Marital status - Widowed (%)
Marital status - Divorced (%)
Median family income ($)
Median family income (% change since 2000)
Median non-family income ($)
Median non-family income (% change since 2000)
Median per capita income ($)
Median per capita income (% change since 2000)
Median family income ($) - White
Median family income ($) - Black or African American
Median family income ($) - Asian
Median family income ($) - Hispanic or Latino
Median family income ($) - American Indian and Alaska Native
Median family income ($) - Multirace
Median family income ($) - Other Race
Median year house/condo built
Median year apartment built
Year house built - Built 2005 or later (%)
Year house built - Built 2000 to 2004 (%)
Year house built - Built 1990 to 1999 (%)
Year house built - Built 1980 to 1989 (%)
Year house built - Built 1970 to 1979 (%)
Year house built - Built 1960 to 1969 (%)
Year house built - Built 1950 to 1959 (%)
Year house built - Built 1940 to 1949 (%)
Year house built - Built 1939 or earlier (%)
Average household size
Household density (households per square mile)
Average household size - White
Average household size - Black or African American
Average household size - Asian
Average household size - Hispanic or Latino
Average household size - American Indian and Alaska Native
Average household size - Multirace
Average household size - Other Race
Occupied housing units (%)
Vacant housing units (%)
Owner occupied housing units (%)
Renter occupied housing units (%)
Vacancy status - For rent (%)
Vacancy status - For sale only (%)
Vacancy status - Rented or sold, not occupied (%)
Vacancy status - For seasonal, recreational, or occasional use (%)
Vacancy status - For migrant workers (%)
Vacancy status - Other vacant (%)
Residents with income below the poverty level (%)
Residents with income below 50% of the poverty level (%)
Children below poverty level (%)
Poor families by family type - Married-couple family (%)
Poor families by family type - Male, no wife present (%)
Poor families by family type - Female, no husband present (%)
Poverty status for native-born residents (%)
Poverty status for foreign-born residents (%)
Poverty among high school graduates not in families (%)
Poverty among people who did not graduate high school not in families (%)
Residents with income below the poverty level (%) - White
Residents with income below the poverty level (%) - Black or African American
Residents with income below the poverty level (%) - Asian
Residents with income below the poverty level (%) - Hispanic or Latino
Residents with income below the poverty level (%) - American Indian and Alaska Native
Residents with income below the poverty level (%) - Multirace
Residents with income below the poverty level (%) - Other Race
Air pollution - Air Quality Index (AQI)
Air pollution - CO
Air pollution - NO2
Air pollution - SO2
Air pollution - Ozone
Air pollution - PM10
Air pollution - PM25
Air pollution - Pb
Crime - Murders per 100,000 population
Crime - Rapes per 100,000 population
Crime - Robberies per 100,000 population
Crime - Assaults per 100,000 population
Crime - Burglaries per 100,000 population
Crime - Thefts per 100,000 population
Crime - Auto thefts per 100,000 population
Crime - Arson per 100,000 population
Crime - City-data.com crime index
Crime - Violent crime index
Crime - Property crime index
Crime - Murders per 100,000 population (5 year average)
Crime - Rapes per 100,000 population (5 year average)
Crime - Robberies per 100,000 population (5 year average)
Crime - Assaults per 100,000 population (5 year average)
Crime - Burglaries per 100,000 population (5 year average)
Crime - Thefts per 100,000 population (5 year average)
Crime - Auto thefts per 100,000 population (5 year average)
Crime - Arson per 100,000 population (5 year average)
Crime - City-data.com crime index (5 year average)
Crime - Violent crime index (5 year average)
Crime - Property crime index (5 year average)
1996 Presidential Elections Results (%) - Democratic Party (Clinton)
1996 Presidential Elections Results (%) - Republican Party (Dole)
1996 Presidential Elections Results (%) - Other
2000 Presidential Elections Results (%) - Democratic Party (Gore)
2000 Presidential Elections Results (%) - Republican Party (Bush)
2000 Presidential Elections Results (%) - Other
2004 Presidential Elections Results (%) - Democratic Party (Kerry)
2004 Presidential Elections Results (%) - Republican Party (Bush)
2004 Presidential Elections Results (%) - Other
2008 Presidential Elections Results (%) - Democratic Party (Obama)
2008 Presidential Elections Results (%) - Republican Party (McCain)
2008 Presidential Elections Results (%) - Other
2012 Presidential Elections Results (%) - Democratic Party (Obama)
2012 Presidential Elections Results (%) - Republican Party (Romney)
2012 Presidential Elections Results (%) - Other
2016 Presidential Elections Results (%) - Democratic Party (Clinton)
2016 Presidential Elections Results (%) - Republican Party (Trump)
2016 Presidential Elections Results (%) - Other
2020 Presidential Elections Results (%) - Democratic Party (Biden)
2020 Presidential Elections Results (%) - Republican Party (Trump)
2020 Presidential Elections Results (%) - Other
Ancestries Reported - Arab (%)
Ancestries Reported - Czech (%)
Ancestries Reported - Danish (%)
Ancestries Reported - Dutch (%)
Ancestries Reported - English (%)
Ancestries Reported - French (%)
Ancestries Reported - French Canadian (%)
Ancestries Reported - German (%)
Ancestries Reported - Greek (%)
Ancestries Reported - Hungarian (%)
Ancestries Reported - Irish (%)
Ancestries Reported - Italian (%)
Ancestries Reported - Lithuanian (%)
Ancestries Reported - Norwegian (%)
Ancestries Reported - Polish (%)
Ancestries Reported - Portuguese (%)
Ancestries Reported - Russian (%)
Ancestries Reported - Scotch-Irish (%)
Ancestries Reported - Scottish (%)
Ancestries Reported - Slovak (%)
Ancestries Reported - Subsaharan African (%)
Ancestries Reported - Swedish (%)
Ancestries Reported - Swiss (%)
Ancestries Reported - Ukrainian (%)
Ancestries Reported - United States (%)
Ancestries Reported - Welsh (%)
Ancestries Reported - West Indian (%)
Ancestries Reported - Other (%)
Educational Attainment - No schooling completed (%)
Educational Attainment - Less than high school (%)
Educational Attainment - High school or equivalent (%)
Educational Attainment - Less than 1 year of college (%)
Educational Attainment - 1 or more years of college (%)
Educational Attainment - Associate degree (%)
Educational Attainment - Bachelor's degree (%)
Educational Attainment - Master's degree (%)
Educational Attainment - Professional school degree (%)
Educational Attainment - Doctorate degree (%)
School Enrollment - Nursery, preschool (%)
School Enrollment - Kindergarten (%)
School Enrollment - Grade 1 to 4 (%)
School Enrollment - Grade 5 to 8 (%)
School Enrollment - Grade 9 to 12 (%)
School Enrollment - College undergrad (%)
School Enrollment - Graduate or professional (%)
School Enrollment - Not enrolled in school (%)
School enrollment - Public schools (%)
School enrollment - Private schools (%)
School enrollment - Not enrolled (%)
Median number of rooms in houses and condos
Median number of rooms in apartments
Housing units lacking complete plumbing facilities (%)
Housing units lacking complete kitchen facilities (%)
Density of houses
Urban houses (%)
Rural houses (%)
Households with people 60 years and over (%)
Households with people 65 years and over (%)
Households with people 75 years and over (%)
Households with one or more nonrelatives (%)
Households with no nonrelatives (%)
Population in households (%)
Family households (%)
Nonfamily households (%)
Population in families (%)
Family households with own children (%)
Median number of bedrooms in owner occupied houses
Mean number of bedrooms in owner occupied houses
Median number of bedrooms in renter occupied houses
Mean number of bedrooms in renter occupied houses
Median number of vehichles in owner occupied houses
Mean number of vehichles in owner occupied houses
Median number of vehichles in renter occupied houses
Mean number of vehichles in renter occupied houses
Mortgage status - with mortgage (%)
Mortgage status - with second mortgage (%)
Mortgage status - with home equity loan (%)
Mortgage status - with both second mortgage and home equity loan (%)
Mortgage status - without a mortgage (%)
Average family size
Average family size - White
Average family size - Black or African American
Average family size - Asian
Average family size - Hispanic or Latino
Average family size - American Indian and Alaska Native
Average family size - Multirace
Average family size - Other Race
Geographical mobility - Same house 1 year ago (%)
Geographical mobility - Moved within same county (%)
Geographical mobility - Moved from different county within same state (%)
Geographical mobility - Moved from different state (%)
Geographical mobility - Moved from abroad (%)
Place of birth - Born in state of residence (%)
Place of birth - Born in other state (%)
Place of birth - Native, outside of US (%)
Place of birth - Foreign born (%)
Housing units in structures - 1, detached (%)
Housing units in structures - 1, attached (%)
Housing units in structures - 2 (%)
Housing units in structures - 3 or 4 (%)
Housing units in structures - 5 to 9 (%)
Housing units in structures - 10 to 19 (%)
Housing units in structures - 20 to 49 (%)
Housing units in structures - 50 or more (%)
Housing units in structures - Mobile home (%)
Housing units in structures - Boat, RV, van, etc. (%)
House/condo owner moved in on average (years ago)
Renter moved in on average (years ago)
Year householder moved into unit - Moved in 1999 to March 2000 (%)
Year householder moved into unit - Moved in 1995 to 1998 (%)
Year householder moved into unit - Moved in 1990 to 1994 (%)
Year householder moved into unit - Moved in 1980 to 1989 (%)
Year householder moved into unit - Moved in 1970 to 1979 (%)
Year householder moved into unit - Moved in 1969 or earlier (%)
Means of transportation to work - Drove car alone (%)
Means of transportation to work - Carpooled (%)
Means of transportation to work - Public transportation (%)
Means of transportation to work - Bus or trolley bus (%)
Means of transportation to work - Streetcar or trolley car (%)
Means of transportation to work - Subway or elevated (%)
Means of transportation to work - Railroad (%)
Means of transportation to work - Ferryboat (%)
Means of transportation to work - Taxicab (%)
Means of transportation to work - Motorcycle (%)
Means of transportation to work - Bicycle (%)
Means of transportation to work - Walked (%)
Means of transportation to work - Other means (%)
Working at home (%)
Industry diversity
Most Common Industries - Agriculture, forestry, fishing and hunting, and mining (%)
Most Common Industries - Agriculture, forestry, fishing and hunting (%)
Most Common Industries - Mining, quarrying, and oil and gas extraction (%)
Most Common Industries - Construction (%)
Most Common Industries - Manufacturing (%)
Most Common Industries - Wholesale trade (%)
Most Common Industries - Retail trade (%)
Most Common Industries - Transportation and warehousing, and utilities (%)
Most Common Industries - Transportation and warehousing (%)
Most Common Industries - Utilities (%)
Most Common Industries - Information (%)
Most Common Industries - Finance and insurance, and real estate and rental and leasing (%)
Most Common Industries - Finance and insurance (%)
Most Common Industries - Real estate and rental and leasing (%)
Most Common Industries - Professional, scientific, and management, and administrative and waste management services (%)
Most Common Industries - Professional, scientific, and technical services (%)
Most Common Industries - Management of companies and enterprises (%)
Most Common Industries - Administrative and support and waste management services (%)
Most Common Industries - Educational services, and health care and social assistance (%)
Most Common Industries - Educational services (%)
Most Common Industries - Health care and social assistance (%)
Most Common Industries - Arts, entertainment, and recreation, and accommodation and food services (%)
Most Common Industries - Arts, entertainment, and recreation (%)
Most Common Industries - Accommodation and food services (%)
Most Common Industries - Other services, except public administration (%)
Most Common Industries - Public administration (%)
Occupation diversity
Most Common Occupations - Management, business, science, and arts occupations (%)
Most Common Occupations - Management, business, and financial occupations (%)
Most Common Occupations - Management occupations (%)
Most Common Occupations - Business and financial operations occupations (%)
Most Common Occupations - Computer, engineering, and science occupations (%)
Most Common Occupations - Computer and mathematical occupations (%)
Most Common Occupations - Architecture and engineering occupations (%)
Most Common Occupations - Life, physical, and social science occupations (%)
Most Common Occupations - Education, legal, community service, arts, and media occupations (%)
Most Common Occupations - Community and social service occupations (%)
Most Common Occupations - Legal occupations (%)
Most Common Occupations - Education, training, and library occupations (%)
Most Common Occupations - Arts, design, entertainment, sports, and media occupations (%)
Most Common Occupations - Healthcare practitioners and technical occupations (%)
Most Common Occupations - Health diagnosing and treating practitioners and other technical occupations (%)
Most Common Occupations - Health technologists and technicians (%)
Most Common Occupations - Service occupations (%)
Most Common Occupations - Healthcare support occupations (%)
Most Common Occupations - Protective service occupations (%)
Most Common Occupations - Fire fighting and prevention, and other protective service workers including supervisors (%)
Most Common Occupations - Law enforcement workers including supervisors (%)
Most Common Occupations - Food preparation and serving related occupations (%)
Most Common Occupations - Building and grounds cleaning and maintenance occupations (%)
Most Common Occupations - Personal care and service occupations (%)
Most Common Occupations - Sales and office occupations (%)
Most Common Occupations - Sales and related occupations (%)
Most Common Occupations - Office and administrative support occupations (%)
Most Common Occupations - Natural resources, construction, and maintenance occupations (%)
Most Common Occupations - Farming, fishing, and forestry occupations (%)
Most Common Occupations - Construction and extraction occupations (%)
Most Common Occupations - Installation, maintenance, and repair occupations (%)
Most Common Occupations - Production, transportation, and material moving occupations (%)
Most Common Occupations - Production occupations (%)
Most Common Occupations - Transportation occupations (%)
Most Common Occupations - Material moving occupations (%)
People in Group quarters - Institutionalized population (%)
People in Group quarters - Correctional institutions (%)
People in Group quarters - Federal prisons and detention centers (%)
People in Group quarters - Halfway houses (%)
People in Group quarters - Local jails and other confinement facilities (including police lockups) (%)
People in Group quarters - Military disciplinary barracks (%)
People in Group quarters - State prisons (%)
People in Group quarters - Other types of correctional institutions (%)
People in Group quarters - Nursing homes (%)
People in Group quarters - Hospitals/wards, hospices, and schools for the handicapped (%)
People in Group quarters - Hospitals/wards and hospices for chronically ill (%)
People in Group quarters - Hospices or homes for chronically ill (%)
People in Group quarters - Military hospitals or wards for chronically ill (%)
People in Group quarters - Other hospitals or wards for chronically ill (%)
People in Group quarters - Hospitals or wards for drug/alcohol abuse (%)
People in Group quarters - Mental (Psychiatric) hospitals or wards (%)
People in Group quarters - Schools, hospitals, or wards for the mentally retarded (%)
People in Group quarters - Schools, hospitals, or wards for the physically handicapped (%)
People in Group quarters - Institutions for the deaf (%)
People in Group quarters - Institutions for the blind (%)
People in Group quarters - Orthopedic wards and institutions for the physically handicapped (%)
People in Group quarters - Wards in general hospitals for patients who have no usual home elsewhere (%)
People in Group quarters - Wards in military hospitals for patients who have no usual home elsewhere (%)
People in Group quarters - Juvenile institutions (%)
People in Group quarters - Long-term care (%)
People in Group quarters - Homes for abused, dependent, and neglected children (%)
People in Group quarters - Residential treatment centers for emotionally disturbed children (%)
People in Group quarters - Training schools for juvenile delinquents (%)
People in Group quarters - Short-term care, detention or diagnostic centers for delinquent children (%)
People in Group quarters - Type of juvenile institution unknown (%)
People in Group quarters - Noninstitutionalized population (%)
People in Group quarters - College dormitories (includes college quarters off campus) (%)
People in Group quarters - Military quarters (%)
People in Group quarters - On base (%)
People in Group quarters - Barracks, unaccompanied personnel housing (UPH), (Enlisted/Officer), ;and similar group living quarters for military personnel (%)
People in Group quarters - Transient quarters for temporary residents (%)
People in Group quarters - Military ships (%)
People in Group quarters - Group homes (%)
People in Group quarters - Homes or halfway houses for drug/alcohol abuse (%)
People in Group quarters - Homes for the mentally ill (%)
People in Group quarters - Homes for the mentally retarded (%)
People in Group quarters - Homes for the physically handicapped (%)
People in Group quarters - Other group homes (%)
People in Group quarters - Religious group quarters (%)
People in Group quarters - Dormitories (%)
People in Group quarters - Agriculture workers' dormitories on farms (%)
People in Group quarters - Job Corps and vocational training facilities (%)
People in Group quarters - Other workers' dormitories (%)
People in Group quarters - Crews of maritime vessels (%)
People in Group quarters - Other nonhousehold living situations (%)
People in Group quarters - Other noninstitutional group quarters (%)
Residents speaking English at home (%)
Residents speaking English at home - Born in the United States (%)
Residents speaking English at home - Native, born elsewhere (%)
Residents speaking English at home - Foreign born (%)
Residents speaking Spanish at home (%)
Residents speaking Spanish at home - Born in the United States (%)
Residents speaking Spanish at home - Native, born elsewhere (%)
Residents speaking Spanish at home - Foreign born (%)
Residents speaking other language at home (%)
Residents speaking other language at home - Born in the United States (%)
Residents speaking other language at home - Native, born elsewhere (%)
Residents speaking other language at home - Foreign born (%)
Class of Workers - Employee of private company (%)
Class of Workers - Self-employed in own incorporated business (%)
Class of Workers - Private not-for-profit wage and salary workers (%)
Class of Workers - Local government workers (%)
Class of Workers - State government workers (%)
Class of Workers - Federal government workers (%)
Class of Workers - Self-employed workers in own not incorporated business and Unpaid family workers (%)
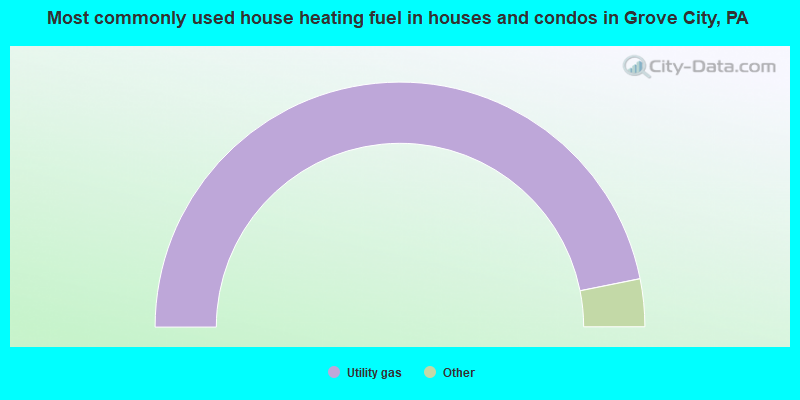
House heating fuel used in houses and condos - Utility gas (%)
House heating fuel used in houses and condos - Bottled, tank, or LP gas (%)
House heating fuel used in houses and condos - Electricity (%)
House heating fuel used in houses and condos - Fuel oil, kerosene, etc. (%)
House heating fuel used in houses and condos - Coal or coke (%)
House heating fuel used in houses and condos - Wood (%)
House heating fuel used in houses and condos - Solar energy (%)
House heating fuel used in houses and condos - Other fuel (%)
House heating fuel used in houses and condos - No fuel used (%)
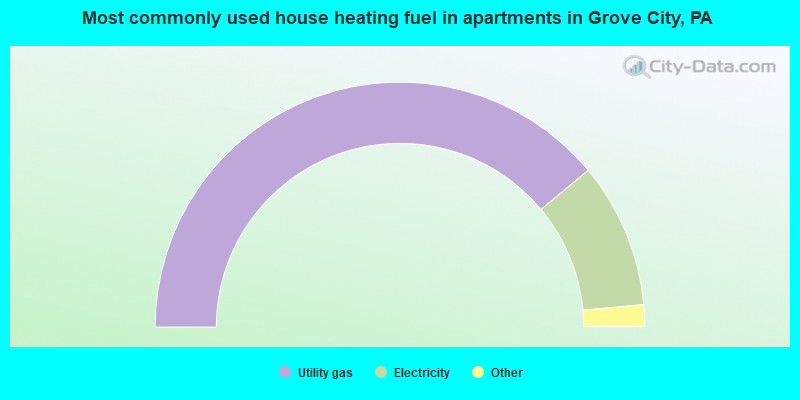
House heating fuel used in apartments - Utility gas (%)
House heating fuel used in apartments - Bottled, tank, or LP gas (%)
House heating fuel used in apartments - Electricity (%)
House heating fuel used in apartments - Fuel oil, kerosene, etc. (%)
House heating fuel used in apartments - Coal or coke (%)
House heating fuel used in apartments - Wood (%)
House heating fuel used in apartments - Solar energy (%)
House heating fuel used in apartments - Other fuel (%)
House heating fuel used in apartments - No fuel used (%)
Armed forces status - In Armed Forces (%)
Armed forces status - Civilian (%)
Armed forces status - Civilian - Veteran (%)
Armed forces status - Civilian - Nonveteran (%)
Fatal accidents locations in years 2005-2021
Fatal accidents locations in 2005
Fatal accidents locations in 2006
Fatal accidents locations in 2007
Fatal accidents locations in 2008
Fatal accidents locations in 2009
Fatal accidents locations in 2010
Fatal accidents locations in 2011
Fatal accidents locations in 2012
Fatal accidents locations in 2013
Fatal accidents locations in 2014
Fatal accidents locations in 2015
Fatal accidents locations in 2016
Fatal accidents locations in 2017
Fatal accidents locations in 2018
Fatal accidents locations in 2019
Fatal accidents locations in 2020
Fatal accidents locations in 2021
Alcohol use - People drinking some alcohol every month (%)
Alcohol use - People not drinking at all (%)
Alcohol use - Average days/month drinking alcohol
Alcohol use - Average drinks/week
Alcohol use - Average days/year people drink much
Audiometry - Average condition of hearing (%)
Audiometry - People that can hear a whisper from across a quiet room (%)
Audiometry - People that can hear normal voice from across a quiet room (%)
Audiometry - Ears ringing, roaring, buzzing (%)
Audiometry - Had a job exposure to loud noise (%)
Audiometry - Had off-work exposure to loud noise (%)
Blood Pressure & Cholesterol - Has high blood pressure (%)
Blood Pressure & Cholesterol - Checking blood pressure at home (%)
Blood Pressure & Cholesterol - Frequently checking blood cholesterol (%)
Blood Pressure & Cholesterol - Has high cholesterol level (%)
Consumer Behavior - Money monthly spent on food at supermarket/grocery store
Consumer Behavior - Money monthly spent on food at other stores
Consumer Behavior - Money monthly spent on eating out
Consumer Behavior - Money monthly spent on carryout/delivered foods
Consumer Behavior - Income spent on food at supermarket/grocery store (%)
Consumer Behavior - Income spent on food at other stores (%)
Consumer Behavior - Income spent on eating out (%)
Consumer Behavior - Income spent on carryout/delivered foods (%)
Current Health Status - General health condition (%)
Current Health Status - Blood donors (%)
Current Health Status - Has blood ever tested for HIV virus (%)
Current Health Status - Left-handed people (%)
Dermatology - People using sunscreen (%)
Diabetes - Diabetics (%)
Diabetes - Had a blood test for high blood sugar (%)
Diabetes - People taking insulin (%)
Diet Behavior & Nutrition - Diet health (%)
Diet Behavior & Nutrition - Milk product consumption (# of products/month)
Diet Behavior & Nutrition - Meals not home prepared (#/week)
Diet Behavior & Nutrition - Meals from fast food or pizza place (#/week)
Diet Behavior & Nutrition - Ready-to-eat foods (#/month)
Diet Behavior & Nutrition - Frozen meals/pizza (#/month)
Drug Use - People that ever used marijuana or hashish (%)
Drug Use - Ever used hard drugs (%)
Drug Use - Ever used any form of cocaine (%)
Drug Use - Ever used heroin (%)
Drug Use - Ever used methamphetamine (%)
Health Insurance - People covered by health insurance (%)
Kidney Conditions-Urology - Avg. # of times urinating at night
Medical Conditions - People with asthma (%)
Medical Conditions - People with anemia (%)
Medical Conditions - People with psoriasis (%)
Medical Conditions - People with overweight (%)
Medical Conditions - Elderly people having difficulties in thinking or remembering (%)
Medical Conditions - People who ever received blood transfusion (%)
Medical Conditions - People having trouble seeing even with glass/contacts (%)
Medical Conditions - People with arthritis (%)
Medical Conditions - People with gout (%)
Medical Conditions - People with congestive heart failure (%)
Medical Conditions - People with coronary heart disease (%)
Medical Conditions - People with angina pectoris (%)
Medical Conditions - People who ever had heart attack (%)
Medical Conditions - People who ever had stroke (%)
Medical Conditions - People with emphysema (%)
Medical Conditions - People with thyroid problem (%)
Medical Conditions - People with chronic bronchitis (%)
Medical Conditions - People with any liver condition (%)
Medical Conditions - People who ever had cancer or malignancy (%)
Mental Health - People who have little interest in doing things (%)
Mental Health - People feeling down, depressed, or hopeless (%)
Mental Health - People who have trouble sleeping or sleeping too much (%)
Mental Health - People feeling tired or having little energy (%)
Mental Health - People with poor appetite or overeating (%)
Mental Health - People feeling bad about themself (%)
Mental Health - People who have trouble concentrating on things (%)
Mental Health - People moving or speaking slowly or too fast (%)
Mental Health - People having thoughts they would be better off dead (%)
Oral Health - Average years since last visit a dentist
Oral Health - People embarrassed because of mouth (%)
Oral Health - People with gum disease (%)
Oral Health - General health of teeth and gums (%)
Oral Health - Average days a week using dental floss/device
Oral Health - Average days a week using mouthwash for dental problem
Oral Health - Average number of teeth
Pesticide Use - Households using pesticides to control insects (%)
Pesticide Use - Households using pesticides to kill weeds (%)
Physical Activity - People doing vigorous-intensity work activities (%)
Physical Activity - People doing moderate-intensity work activities (%)
Physical Activity - People walking or bicycling (%)
Physical Activity - People doing vigorous-intensity recreational activities (%)
Physical Activity - People doing moderate-intensity recreational activities (%)
Physical Activity - Average hours a day doing sedentary activities
Physical Activity - Average hours a day watching TV or videos
Physical Activity - Average hours a day using computer
Physical Functioning - People having limitations keeping them from working (%)
Physical Functioning - People limited in amount of work they can do (%)
Physical Functioning - People that need special equipment to walk (%)
Physical Functioning - People experiencing confusion/memory problems (%)
Physical Functioning - People requiring special healthcare equipment (%)
Prescription Medications - Average number of prescription medicines taking
Preventive Aspirin Use - Adults 40+ taking low-dose aspirin (%)
Reproductive Health - Vaginal deliveries (%)
Reproductive Health - Cesarean deliveries (%)
Reproductive Health - Deliveries resulted in a live birth (%)
Reproductive Health - Pregnancies resulted in a delivery (%)
Reproductive Health - Women breastfeeding newborns (%)
Reproductive Health - Women that had a hysterectomy (%)
Reproductive Health - Women that had both ovaries removed (%)
Reproductive Health - Women that have ever taken birth control pills (%)
Reproductive Health - Women taking birth control pills (%)
Reproductive Health - Women that have ever used Depo-Provera or injectables (%)
Reproductive Health - Women that have ever used female hormones (%)
Sexual Behavior - People 18+ that ever had sex (vaginal, anal, or oral) (%)
Sexual Behavior - Males 18+ that ever had vaginal sex with a woman (%)
Sexual Behavior - Males 18+ that ever performed oral sex on a woman (%)
Sexual Behavior - Males 18+ that ever had anal sex with a woman (%)
Sexual Behavior - Males 18+ that ever had any sex with a man (%)
Sexual Behavior - Females 18+ that ever had vaginal sex with a man (%)
Sexual Behavior - Females 18+ that ever performed oral sex on a man (%)
Sexual Behavior - Females 18+ that ever had anal sex with a man (%)
Sexual Behavior - Females 18+ that ever had any kind of sex with a woman (%)
Sexual Behavior - Average age people first had sex
Sexual Behavior - Average number of female sex partners in lifetime (males 18+)
Sexual Behavior - Average number of female vaginal sex partners in lifetime (males 18+)
Sexual Behavior - Average age people first performed oral sex on a woman (18+)
Sexual Behavior - Average number of woman performed oral sex on in lifetime (18+)
Sexual Behavior - Average number of male sex partners in lifetime (males 18+)
Sexual Behavior - Average number of male anal sex partners in lifetime (males 18+)
Sexual Behavior - Average age people first performed oral sex on a man (18+)
Sexual Behavior - Average number of male oral sex partners in lifetime (18+)
Sexual Behavior - People using protection when performing oral sex (%)
Sexual Behavior - Average number of times people have vaginal or anal sex a year
Sexual Behavior - People having sex without condom (%)
Sexual Behavior - Average number of male sex partners in lifetime (females 18+)
Sexual Behavior - Average number of male vaginal sex partners in lifetime (females 18+)
Sexual Behavior - Average number of female sex partners in lifetime (females 18+)
Sexual Behavior - Circumcised males 18+ (%)
Sleep Disorders - Average hours sleeping at night
Sleep Disorders - People that has trouble sleeping (%)
Smoking-Cigarette Use - People smoking cigarettes (%)
Taste & Smell - People 40+ having problems with smell (%)
Taste & Smell - People 40+ having problems with taste (%)
Taste & Smell - People 40+ that ever had wisdom teeth removed (%)
Taste & Smell - People 40+ that ever had tonsils teeth removed (%)
Taste & Smell - People 40+ that ever had a loss of consciousness because of a head injury (%)
Taste & Smell - People 40+ that ever had a broken nose or other serious injury to face or skull (%)
Taste & Smell - People 40+ that ever had two or more sinus infections (%)
Weight - Average height (inches)
Weight - Average weight (pounds)
Weight - Average BMI
Weight - People that are obese (%)
Weight - People that ever were obese (%)
Weight - People trying to lose weight (%)
Officers per 1,000 residents here:
1.30Pennsylvania average:
2.70
Latest news from Grove City, PA collected exclusively by city-data.com from local newspapers, TV, and radio stations
Ancestries: German (22.4%), English (17.4%), Italian (8.0%), American (7.9%), Irish (7.0%), Polish (3.9%).
Current Local Time:
Incorporated on 01/04/1883
Land area: 2.65 square miles.
Population density: 2,962 people per square mile (average).
84 residents are foreign born
This borough:
1.1%Pennsylvania:
7.3%
Median real estate property taxes paid for housing units with mortgages in 2022: $1,291 (0.8%)Median real estate property taxes paid for housing units with no mortgage in 2022: $1,326 (0.8%)
Nearest city with pop. 50,000+: Youngstown, OH
Nearest city with pop. 200,000+: Pittsburgh, PA
Nearest city with pop. 1,000,000+: Philadelphia, PA
Nearest cities:
Volant, PA (3.1 miles)
Latitude: 41.16 N, Longitude: 80.09 W
Daytime population change due to commuting: +1,496 (+19.2%)Workers who live and work in this borough: 2,269 (62.7%)
Unemployment in December 2023: Here:
3.3%Pennsylvania:
2.9%
Most common industries in Grove City, PA (%)
Both Males Females
Educational services (15.0%)
Health care (13.2%)
Accommodation & food services (7.6%)
Construction (3.6%)
Metal & metal products (3.3%)
Religious, grantmaking, civic, professional, similar organizations (3.3%)
Public administration (3.2%)
Educational services (9.4%)
Health care (8.0%)
Accommodation & food services (7.2%)
Construction (6.5%)
Metal & metal products (5.0%)
Public administration (3.5%)
Administrative & support & waste management services (3.3%)
Educational services (20.7%)
Health care (18.5%)
Accommodation & food services (8.0%)
Religious, grantmaking, civic, professional, similar organizations (4.2%)
Clothing & accessories, including shoe, stores (3.8%)
Social assistance (3.1%)
Administrative & support & waste management services (3.0%)
Most common occupations in Grove City, PA (%)
Both Males Females
Retail sales workers, except cashiers (6.1%)
Other management occupations, except farmers and farm managers (5.4%)
Other sales and related occupations, including supervisors (4.5%)
Other production occupations, including supervisors (3.3%)
Postsecondary teachers (3.3%)
Preschool, kindergarten, elementary, and middle school teachers (3.2%)
Laborers and material movers, hand (3.2%)
Other management occupations, except farmers and farm managers (6.9%)
Laborers and material movers, hand (5.6%)
Retail sales workers, except cashiers (4.9%)
Other production occupations, including supervisors (4.6%)
Computer specialists (4.6%)
Postsecondary teachers (4.0%)
Material recording, scheduling, dispatching, and distributing workers (3.7%)
Retail sales workers, except cashiers (7.3%)
Preschool, kindergarten, elementary, and middle school teachers (5.7%)
Other sales and related occupations, including supervisors (5.6%)
Secretaries and administrative assistants (5.5%)
Other office and administrative support workers, including supervisors (5.1%)
Nursing, psychiatric, and home health aides (4.6%)
Registered nurses (4.2%)
Tornado activity:
Grove City-area historical tornado activity is slightly above Pennsylvania state average. It is 2% smaller than the overall U.S. average.
On 5/31/1985, a category F5 (max. wind speeds 261-318 mph) tornado 10.4 miles away from the Grove City borough center killed 18 people and injured 310 people and caused between $50,000,000 and $500,000,000 in damages.
On 5/31/1985, a category F4 (max. wind speeds 207-260 mph) tornado 31.5 miles away from the borough center killed 16 people and injured 125 people and caused between $5,000,000 and $50,000,000 in damages.
Earthquake activity:
Grove City-area historical earthquake activity is significantly above Pennsylvania state average. It is 58% smaller than the overall U.S. average. On 9/25/1998 at 19:52:52, a magnitude 5.2 (4.8 MB, 4.3 MS, 5.2 LG, 4.5 MW, Depth: 3.1 mi, Class: Moderate, Intensity: VI - VII) earthquake occurred 27.9 miles away from the city center On 1/31/1986 at 16:46:43, a magnitude 5.0 (5.0 MB) earthquake occurred 63.5 miles away from the city center On 8/23/2011 at 17:51:04, a magnitude 5.8 (5.8 MW, Depth: 3.7 mi) earthquake occurred 252.4 miles away from Grove City center On 12/31/2011 at 20:05:01, a magnitude 4.0 (4.0 ML, Depth: 3.1 mi, Class: Light, Intensity: IV - V) earthquake occurred 31.2 miles away from the city center On 7/27/1980 at 18:52:21, a magnitude 5.2 (5.1 MB, 4.7 MS, 5.0 UK, 5.2 UK) earthquake occurred 289.6 miles away from Grove City center On 6/10/2019 at 14:50:45, a magnitude 4.0 (4.0 MB, Depth: 1.2 mi) earthquake occurred 79.6 miles away from the city center Magnitude types: regional Lg-wave magnitude (LG), body-wave magnitude (MB), local magnitude (ML), surface-wave magnitude (MS), moment magnitude (MW) Natural disasters: The number of natural disasters in Mercer County (10) is smaller than the US average (15).Major Disasters (Presidential) Declared: 6Emergencies Declared: 4Floods: 3, Storms: 3, Hurricanes: 2, Tornadoes: 2, Snowfall: 1, Snowstorm: 1, Tropical Storm: 1, Wind: 1, Winter Storm: 1, Other: 1 (Note: some incidents may be assigned to more than one category). Hospitals in Grove City: ALLEGHENY VALLEY SCHOOL (363 OREGON ROAD) ALLEGHENY VALLEY SCHOOL WILLOW (1026 SLIPPERY ROCK ROAD) GROVE CITY MEDICAL CENTER (Voluntary non-profit - Private, 631 NORTH BROAD STREET EXT.) Nursing Homes in Grove City: GROVE CITY MEDICAL CENTER TCC (631 NORTH BROAD ST) GROVE MANOR (435 NORTH BROAD STREET) HILLCREST NURSING CTR (400 HILLCREST AVE) ORCHARD MANOR INC (RD 3) ORCHARD MANOR, INC (20 ORCHARD DRIVE) TRINITY LIVING CENTER (400 HILLCREST AVENUE) Dialysis Facilities in Grove City: DCI OF GROVE CITY (631 NORTH BROAD STREET EXTENSION) Home Health Centers in Grove City: GROVE CITY MEDICAL CENTER HOME HEALTH SERVICES (631 NORTH BROAD ST EXT) HEARTFELT HOME HEALTHCARE SERVICES, INC (4 VILLAGE PARK DRIVE SUITE 100)
College/University in Grove City: Grove City College Full-time enrollment: 2,560; Location: 100 Campus Dr; Private, not-for-profit; Website: www.gcc.edu)
Other colleges/universities with over 2000 students near Grove City:
Slippery Rock University of Pennsylvania (about 8 miles; Slippery Rock, PA ; Full-time enrollment: 8,424)
Butler County Community College (about 25 miles; Butler, PA ; FT enrollment: 2,518)
Youngstown State University (about 30 miles; Youngstown, OH ; FT enrollment: 11,575)
Allegheny College (about 34 miles; Meadville, PA ; FT enrollment: 2,249)
Clarion University of Pennsylvania (about 38 miles; Clarion, PA ; FT enrollment: 5,771)
Robert Morris University (about 45 miles; Moon Township, PA ; FT enrollment: 4,823)
Edinboro University of Pennsylvania (about 50 miles; Edinboro, PA ; FT enrollment: 6,746)
Public high schools in Grove City:
Public elementary/middle schools in Grove City: GROVE CITY AREA MS Students: 813, Location: 100 MIDDLE SCHOOL DRIVE, Grades: 6-8)HILLVIEW EL SCH Students: 694, Location: 482 E MAIN STREET EXT, Grades: 2-5)GEORGE JR REPUBLIC MS Students: 356, Location: 233 GEORGE JUNIOR RD, Grades: 5-8)HIGHLAND EL SCH Location: 611 HIGHLAND AVE, Grades: KG-1)
Private elementary/middle school in Grove City: GROVE CITY CHRISTIAN ACADEMY Students: 119, Location: 301 N MADISON AVE, Grades: PK-8)
See full list of schools located in Grove City Library in Grove City: GROVE CITY COMMUNITY LIBRARY Operating income: $141,770; Location: 125 WEST MAIN ST; 31,317 books ; 1,122 audio materials ; 1,066 video materials ; 41 state licensed databases ; 60 print serial subscriptions )
User-submitted facts and corrections:
Station: Hot 101.1 out of Youngstown is a strong FM station that Grove City, Pa recieves.
Jubilee Christian School changed its name to Grove City Academy about 5 years ago. Also, as of Jan. 1, 2006, United Community Hospital will be called Grove City Hospital.
Notable locations in Grove City: (A) , Weir C Ketler Technology Learning Center (B) , Rockwell Hall of Science (C) , President's Residence - Grove City College (D) , Physical Learning Center (E) , Phillips Field House (F) , Mary Ethel Pew Dormitory (G) , Mary Anderson Pew Dormitory (H) , J Howard Pew Fine Arts Center (I) , Issac C Ketier Dormitory (J) , Hoyt Hall of Engineering (K) , Hopeman Hall (L) , Henry Buhl Library (M) , Helen Harker Hall (N) , Hall of Arts and Lecture (O) , Grove City Volunteer Fire Department Station 2 (P) , Grove City Volunteer Fire Department Station 1 Headquarters (Q) . Display/hide their locations on the map
Church in Grove City: (A) . Display/hide its location on the map
Streams, rivers, and creeks: (A) . Display/hide its location on the map
Park in Grove City: (1) . Display/hide its location on the map
Tourist attraction:
Hotels:
Birthplace of: Jimmy Del Ray - Professional wrestler, Mari K. Eder - Army officer, Dick Bestwick - Football player and coach, Kate Kretz - Artist, Scot Thompson (baseball) - Baseball player, Smokin' Joe Kubek - Electric blues guitarist..
Mercer County has a predicted average indoor radon screening level between 2 and 4 pCi/L (pico curies per liter) - Moderate Potential Drinking water stations with addresses in Grove City and their reported violations in the past:
BARKEYVILLE MUN AUTHORITY (Population served: 1,600, Groundwater):
Past monitoring violations:
Monitoring of Treatment (SWTR-Unfilt/GWR) - In SEP-2012, Contaminant: GROUNDWATER RULE. Follow-up actions: St Violation/Reminder Notice (NOV-14-2012), St Compliance achieved (NOV-14-2012)
Monitoring and Reporting (DBP) - Between JAN-2005 and MAR-2005, Contaminant: Chlorine. Follow-up actions: St Violation/Reminder Notice (MAR-17-2005), St Compliance achieved (MAR-17-2005)
Follow-up Or Routine LCR Tap M/R - In JAN-01-2005, Contaminant: Lead and Copper Rule. Follow-up actions: St Public Notif requested (APR-19-2005), St Formal NOV issued (APR-19-2005), St Compliance achieved (JUN-29-2005), St Public Notif received (JUN-29-2005)
2 regular monitoring violations
Population served: 300, Groundwater):
Past monitoring violations:
One routine major monitoring violation
Population served: 75, Groundwater):
Past health violations:
MCL, Monthly (TCR) - In OCT-2010, Contaminant: Coliform. Follow-up actions: St Public Notif requested (NOV-23-2010), St Compliance achieved (NOV-23-2010), St Violation/Reminder Notice (NOV-23-2010)
Past monitoring violations:
One routine major monitoring violation
Population served: 70, Groundwater):
Past health violations:
MCL, Monthly (TCR) - Between JUL-2013 and SEP-2013, Contaminant: Coliform. Follow-up actions: St Boil Water Order (SEP-04-2013), St Formal NOV issued (SEP-04-2013), St Public Notif requested (SEP-04-2013), St Compliance achieved (SEP-02-2014)
Past monitoring violations:
Monitoring, Repeat Major (TCR) - Between OCT-2013 and DEC-2013, Contaminant: Coliform (TCR). Follow-up actions: St Public Notif requested (FEB-04-2014), St Compliance achieved (FEB-04-2014), St Violation/Reminder Notice (FEB-04-2014)
Monitoring, Source Water (GWR) - Between AUG-06-2013 and SEP-06-2013, Contaminant: E. COLI. Follow-up actions: St Public Notif requested (OCT-03-2013), St Compliance achieved (OCT-03-2013), St Violation/Reminder Notice (OCT-03-2013)
One routine major monitoring violation
One minor monitoring violation
Population served: 30, Groundwater):
Past monitoring violations:
One routine major monitoring violation
Population served: 25, Groundwater):
Past health violations:
MCL, Monthly (TCR) - In JUN-2014, Contaminant: Coliform. Follow-up actions: St Public Notif requested (JUL-29-2014), St Formal NOV issued (JUL-29-2014), St Compliance achieved (JUL-29-2014), St Public Notif received (SEP-02-2014)
MCL, Monthly (TCR) - Between APR-2014 and JUN-2014, Contaminant: Coliform. Follow-up actions: St Public Notif requested (JUN-27-2014), St Formal NOV issued (JUN-27-2014), St Compliance achieved (JUN-27-2014), St Public Notif received (AUG-19-2014)
Past monitoring violations:
Monitoring, Source Water (GWR) - Between JUN-15-2014 and JUL-15-2014, Contaminant: E. COLI. Follow-up actions: St Public Notif requested (JUL-29-2014), St Formal NOV issued (JUL-29-2014), St Compliance achieved (JUL-29-2014), St Public Notif received (SEP-02-2014)
Population served: 25, Groundwater):
Past monitoring violations:
2 routine major monitoring violations
Average household size: This borough:
2.2 peoplePennsylvania:
2.5 people
Percentage of family households: This borough:
58.9%Whole state:
65.0%
Percentage of households with unmarried partners: This borough:
5.4%Whole state:
6.6%
Likely homosexual households (counted as self-reported same-sex unmarried-partner households)
Lesbian couples: 0.2% of all households Gay men: 0.3% of all households
People in group quarters in Grove City in 2010:
2,303 people in college/university student housing
174 people in nursing facilities/skilled-nursing facilities
11 people in group homes for juveniles (non-correctional)
10 people in correctional facilities intended for juveniles
7 people in workers' group living quarters and job corps centers
People in group quarters in Grove City in 2000:
2,063 people in college dormitories (includes college quarters off campus)
174 people in nursing homes
2 people in religious group quarters
Banks with branches in Grove City (2011 data):
Citizens Bank of Pennsylvania: Grove City Drive-In Branch at 141 South Center Street, branch established on 1955/01/03; Grove City Branch at 165 South Broad Street, branch established on 1968/01/08. Info updated 2010/09/24: Bank assets: $32,316.9 mil, Deposits: $25,297.1 mil, headquarters in Philadelphia, PA, positive income , 396 total offices , Holding Company: Uk Financial Investments Limited
PNC Bank, National Association: Grove City Branch at 201 South Broad Street, branch established on 1957/12/23; Grove City Drive Up at 802 West Main Street, branch established on 1958/01/31. Info updated 2012/03/20: Bank assets: $263,309.6 mil, Deposits: $197,343.0 mil, headquarters in Wilmington, DE, positive income , Commercial Lending Specialization, 3085 total offices , Holding Company: Pnc Financial Services Group, Inc., The
First National Bank of Pennsylvania: Grove City Broad Street Branch at 160 South Broad Street, branch established on 1989/12/26; Pine Grove Square Branch at Republic Drive, Pine Grove Square, branch established on 1988/08/08. Info updated 2012/01/10: Bank assets: $9,581.0 mil, Deposits: $7,462.2 mil, headquarters in Greenville, PA, positive income , Commercial Lending Specialization, 291 total offices , Holding Company: F.N.b. Corporation
The Farmers National Bank of Emlenton: Grove City Office Branch at 1319 West Main Street, branch established on 2008/04/01. Info updated 2008/11/05: Bank assets: $490.2 mil, Deposits: $416.5 mil, headquarters in Emlenton, PA, positive income , Commercial Lending Specialization, 13 total offices , Holding Company: Emclaire Financial Corp
Mercer County State Bank: Grove City Branch at 712 West Main Street, branch established on 2007/10/01. Info updated 2006/11/03: Bank assets: $312.6 mil, Deposits: $267.5 mil, headquarters in Sandy Lake, PA, positive income , 10 total offices , Holding Company: Mercer County State Bancorp, Inc.
The Huntington National Bank: Grove City Ii at 1506 W Main Street, branch established on 1973/06/04. Info updated 2012/04/02: Bank assets: $54,183.4 mil, Deposits: $44,300.3 mil, headquarters in Columbus, OH, positive income , Commercial Lending Specialization, 878 total offices , Holding Company: Huntington Bancshares Incorporated
Northwest Savings Bank: 200 South Center Street Branch at 200 South Center Street, branch established on 2001/05/17. Info updated 2009/11/23: Bank assets: $7,975.9 mil, Deposits: $5,985.6 mil, headquarters in Warren, PA, positive income , Mortgage Lending Specialization, 172 total offices
For population 15 years and over in Grove City:
Never married: 52.6%Now married: 32.5%Separated: 0.6%Widowed: 4.8%Divorced: 9.5% For population 25 years and over in Grove City:
High school or higher: 93.7%Bachelor's degree or higher: 43.8%Graduate or professional degree: 18.1%Unemployed: 5.4%Mean travel time to work (commute): 15.2 minutes
Education Gini index (Inequality in education) Here:
11.4Pennsylvania average:
11.4
Religion statistics for Grove City, PA (based on Mercer County data)
Religion Adherents Congregations Catholic 28,244 15 Mainline Protestant 21,831 78 Evangelical Protestant 13,739 94 Black Protestant 1,147 7 Orthodox 929 6 Other 612 9 None 50,136 -
Source: Clifford Grammich, Kirk Hadaway, Richard Houseal, Dale E.Jones, Alexei Krindatch, Richie Stanley and Richard H.Taylor. 2012. 2010 U.S.Religion Census: Religious Congregations & Membership Study. Association of Statisticians of American Religious Bodies. Jones, Dale E., et al. 2002. Congregations and Membership in the United States 2000. Nashville, TN: Glenmary Research Center. Graphs represent county-level data
Food Environment Statistics: Number of grocery stores : 23Mercer County :
1.97 / 10,000 pop.Pennsylvania :
2.04 / 10,000 pop.
Number of supercenters and club stores : 1Mercer County :
0.09 / 10,000 pop.State :
0.09 / 10,000 pop.
Number of convenience stores (no gas) : 7This county :
0.60 / 10,000 pop.State :
0.88 / 10,000 pop.
Number of convenience stores (with gas) : 32Mercer County :
2.74 / 10,000 pop.Pennsylvania :
2.52 / 10,000 pop.
Number of full-service restaurants : 81Here :
6.93 / 10,000 pop.Pennsylvania :
7.12 / 10,000 pop.
Adult diabetes rate : This county :
10.5%Pennsylvania :
9.1%
Adult obesity rate : Here :
29.4%Pennsylvania :
27.2%
Low-income preschool obesity rate : Here :
13.9%Pennsylvania :
11.5%
Health and Nutrition: Healthy diet rate : This city:
52.9%Pennsylvania:
50.2%
Average overall health of teeth and gums : This city:
54.3%Pennsylvania:
47.1%
Average BMI : Here:
26.6Pennsylvania:
28.7
People feeling badly about themselves : This city:
17.1%State:
20.8%
People not drinking alcohol at all : Grove City:
7.6%State:
10.9%
Average hours sleeping at night : Overweight people : This city:
26.0%Pennsylvania:
34.3%
General health condition : This city:
61.2%State:
56.2%
Average condition of hearing : Grove City:
80.4%Pennsylvania:
78.3%
More about Health and Nutrition of Grove City, PA Residents
Local government employment and payroll (March 2022)
Function
Full-time employees
Monthly full-time payroll
Average yearly full-time wage
Part-time employees
Monthly part-time payroll
Police Protection - Officers
10 $83,551 $100,261 0 $0 Sewerage
9 $58,776 $78,368 0 $0 Electric Power
8 $54,336 $81,504 0 $0 Streets and Highways
6 $39,222 $78,444 0 $0 Financial Administration
4 $35,313 $105,939 0 $0 Water Supply
3 $18,154 $72,616 0 $0 Other Government Administration
3 $22,128 $88,512 0 $0 Parks and Recreation
2 $11,559 $69,354 0 $0 Police - Other
1 $2,912 $34,944 4 $1,950 Other and Unallocable
1 $6,300 $75,600 1 $1,251
Totals for Government
47 $332,251 $84,830 5 $3,201
Grove City government finances - Expenditure in 2017 (per resident):
Construction - General - Other: $338,000 ($43.02)
Sewerage: $201,000 ($25.59)Parks and Recreation: $162,000 ($20.62)Water Utilities: $20,000 ($2.55)Regular Highways: $11,000 ($1.40)Current Operations - Electric Utilities: $6,320,000 ($804.48)
Sewerage: $1,692,000 ($215.38)Water Utilities: $998,000 ($127.04)General - Other: $967,000 ($123.09)Police Protection: $939,000 ($119.53)Regular Highways: $622,000 ($79.18)Solid Waste Management: $447,000 ($56.90)Parks and Recreation: $390,000 ($49.64)Air Transportation: $347,000 ($44.17)Local Fire Protection: $69,000 ($8.78)Central Staff Services: $54,000 ($6.87)Financial Administration: $51,000 ($6.49)General Public Buildings: $37,000 ($4.71)Libraries: $35,000 ($4.46)Judicial and Legal Services: $15,000 ($1.91)Protective Inspection and Regulation - Other: $14,000 ($1.78)Housing and Community Development: $10,000 ($1.27)General - Interest on Debt: $709,000 ($90.25)
Other Capital Outlay - Regular Highways: $155,000 ($19.73)
Sewerage: $40,000 ($5.09)Police Protection: $29,000 ($3.69)Total Salaries and Wages: $2,842,000 ($361.76)
Grove City government finances - Revenue in 2017 (per resident):
Charges - Sewerage: $2,500,000 ($318.23)
Solid Waste Management: $478,000 ($60.85)Other: $28,000 ($3.56)Parks and Recreation: $6,000 ($0.76)Federal Intergovernmental - Other: $266,000 ($33.86)
Housing and Community Development: $111,000 ($14.13)Local Intergovernmental - Other: $6,000 ($0.76)
Miscellaneous - Rents: $65,000 ($8.27)
Donations From Private Sources: $62,000 ($7.89)Fines and Forfeits: $43,000 ($5.47)General Revenue - Other: $35,000 ($4.46)Interest Earnings: $26,000 ($3.31)Revenue - Electric Utilities: $7,852,000 ($999.49)
Water Utilities: $1,166,000 ($148.42)State Intergovernmental - Other: $400,000 ($50.92)
Highways: $226,000 ($28.77)General Local Government Support: $2,000 ($0.25)Tax - Individual Income: $630,000 ($80.19)
Property: $288,000 ($36.66)Public Utility License: $86,000 ($10.95)Documentary and Stock Transfer: $75,000 ($9.55)Occupation and Business License - Other: $71,000 ($9.04)
Grove City government finances - Debt in 2017 (per resident):
Long Term Debt - Beginning Outstanding - Unspecified Public Purpose: $16,320,000 ($2077.39)
Outstanding Unspecified Public Purpose: $15,786,000 ($2009.42)Retired Unspecified Public Purpose: $617,000 ($78.54)Issue, Unspecified Public Purpose: $83,000 ($10.57)
Grove City government finances - Cash and Securities in 2017 (per resident):
Other Funds - Cash and Securities: $9,782,000 ($1245.16)
Businesses in Grove City, PA
Name Count Name Count
ALDO 2 Journeys 1 Advance Auto Parts 1 Juicy Couture 1 Aeropostale 1 La-Z-Boy 1 American Eagle Outfitters 2 Lane Bryant 1 Ann Taylor 2 Levi Strauss & Co. 1 Arby's 2 Little Caesars Pizza 1 AutoZone 1 MasterBrand Cabinets 1 Banana Republic 1 McDonald's 2 Bath & Body Works 1 Microtel 1 Best Western 1 Motherhood Maternity 1 Brooks Brothers 1 New York & Co 1 Burger King 1 Nike 2 Casual Male XL 1 Old Navy 1 Charlotte Russe 1 Pac Sun 1 Chico's 1 Payless 1 Clarks 1 Pizza Hut 1 Coldwater Creek 1 Rite Aid 2 Comfort Inn 1 Rue21 1 Dairy Queen 2 SAS Shoes 1 DressBarn 1 Sears 1 Dressbarn 1 Skechers USA 1 Eddie Bauer 1 Subway 4 Famous Footwear 1 Super 8 1 FedEx 2 Taco Bell 1 Gap 2 Toys"R"Us 1 Gymboree 1 U-Haul 2 H&R Block 1 Vans 1 IZOD 1 Walmart 1 J.Crew 1 Wendy's 1 JoS. A. Bank 1 YMCA 1 Jones New York 1
Strongest AM radio stations in Grove City:
KDKA (1020 AM; 50 kW; PITTSBURGH, PA; Owner: INFINITY BROADCASTING OPERATIONS, INC.)
WBZY (1280 AM; 5 kW; NEW CASTLE, PA; Owner: CITICASTERS LICENSES, L.P.)
WKBN (570 AM; 5 kW; YOUNGSTOWN, OH; Owner: CITICASTERS LICENSES, L.P.)
WKST (1200 AM; 5 kW; NEW CASTLE, PA; Owner: CITICASTERS LICENSES, L.P.)
WKNR (850 AM; 50 kW; CLEVELAND, OH; Owner: CARON BROADCASTING, INC.)
WTAM (1100 AM; 50 kW; CLEVELAND, OH; Owner: JACOR BROADCASTING CORPORATION)
WNIO (1390 AM; 10 kW; YOUNGSTOWN, OH; Owner: YOUNGSTOWN RADIO LICENSE, L.L.C.)
WWVA (1170 AM; 53 kW; WHEELING, WV; Owner: CAPSTAR TX LIMITED PARTNERSHIP)
WHK (1220 AM; 50 kW; CLEVELAND, OH; Owner: CARON BROADCASTING, INC.)
WPIT (730 AM; 5 kW; PITTSBURGH, PA; Owner: PENNSYLVANIA MEDIA ASSOCIATES, INC.)
WPIC (790 AM; 1 kW; SHARON, PA; Owner: CUMULUS LICENSING CORP.)
WSAJ (1340 AM; 0 kW; GROVE CITY, PA; Owner: GROVE CITY COLLEGE)
WBGG (970 AM; 5 kW; PITTSBURGH, PA; Owner: AMFM RADIO LICENSES, L.L.C.)
Strongest FM radio stations in Grove City:
WSAJ-FM (91.1 FM; GROVE CITY, PA; Owner: GROVE CITY COLLEGE)
WICT (95.1 FM; GROVE CITY, PA; Owner: YOUNGSTOWN RADIO LICENSE, L.L.C.)
WMXY (98.9 FM; YOUNGSTOWN, OH; Owner: CITICASTERS LICENSES, L.P.)
WLLF (96.7 FM; MERCER, PA; Owner: CUMULUS LICENSING CORP.)
WOXX (99.3 FM; FRANKLIN, PA; Owner: FOREVER BROADCASTING, LLC)
WWIZ (103.9 FM; MERCER, PA; Owner: CUMULUS LICENSING CORP.)
WHOT-FM (101.1 FM; YOUNGSTOWN, OH; Owner: CUMULUS LICENSING CORP.)
WZPT (100.7 FM; NEW KENSINGTON, PA; Owner: INFINITY RADIO SUBSIDIARY OPERATIONS INC.)
WYTN (91.7 FM; YOUNGSTOWN, OH; Owner: FAMILY STATIONS, INC.)
WYFM (102.9 FM; SHARON, PA; Owner: CUMULUS LICENSING CORP.)
WLER-FM (97.7 FM; BUTLER, PA; Owner: WBUT, INC.)
WVMN (90.1 FM; NEW CASTLE, PA; Owner: THE MOODY BIBLE INSTITUTE OF CHICAGO)
W248AD (97.5 FM; NEW WILMINGTON, PA; Owner: YOUNGSTOWN STATE UNIVERSITY)
WAMO-FM (106.7 FM; BEAVER FALLS, PA; Owner: MCL/MCM-INC)
WRSK (88.1 FM; SLIPPERY ROCK, PA; Owner: SLIPPERY ROCK U BD TRUSTEES AND SG)
WGYY (100.3 FM; MEADVILLE, PA; Owner: FOREVER BROADCASTING, LLC)
WRBP (101.9 FM; HUBBARD, OH; Owner: STOP 26-RIVERBEND, INC.)
WHUZ (94.3 FM; SAEGERTOWN, PA; Owner: FOREVER BROADCASTING, LLC)
WAWN (89.5 FM; FRANKLIN, PA; Owner: AMERICAN FAMILY ASSOCIATION)
WUUZ (107.7 FM; COOPERSTOWN, PA; Owner: FOREVER BROADCASTING, LLC)
TV broadcast stations around Grove City:
WFXI-CA (Channel 17; MERCER, PA; Owner: PIEDMONT TELEVISION OF YOUNGSTOWN LICENSE LLC)
WKBN-TV (Channel 27; YOUNGSTOWN, OH; Owner: PIEDMONT TELEVISION OF YOUNGSTOWN LICENSE LLC)
WFMJ-TV (Channel 21; YOUNGSTOWN, OH; Owner: WFMJ TELEVISION, INC.)
W56CL (Channel 56; NEW CASTLE, PA; Owner: BRUNO-GOODWORTH NETWORK, INC.)
WYFX-LP (Channel 62; YOUNGSTOWN, OH; Owner: PIEDMONT TELEVISION OF YOUNGSTOWN LICENSE LLC)
WYTV (Channel 33; YOUNGSTOWN, OH; Owner: CHELSEY BROADCASTING COMPANY OF YOUNGSTOWN, LLC)
W50BF (Channel 50; SHARON, PA; Owner: CORNERSTONE TELEVISION, INC.)
National Bridge Inventory (NBI) Statistics 68 Number of bridges525ft / 160m Total length $10,347,000 Total costs393,187 Total average daily traffic114,281 Total average daily truck traffic
New bridges - historical statistics
1 Before 1900 1 1910-1919 2 1920-1929 1 1930-1939 6 1950-1959 31 1960-1969 2 1970-1979 6 1980-1989 6 1990-1999 8 2000-2009 4 2010-2019
See full National Bridge Inventory statistics for Grove City, PA
Home Mortgage Disclosure Act Aggregated Statistics For Year 2009(Based on 2 full tracts) A) FHA, FSA/RHS & VA B) Conventional C) Refinancings D) Home Improvement Loans E) Loans on Dwellings For 5+ Families F) Non-occupant Loans on G) Loans On Manufactured Number Average Value Number Average Value Number Average Value Number Average Value Number Average Value Number Average Value Number Average Value
LOANS ORIGINATED 31 $101,806 45 $83,267 79 $96,848 19 $23,105 0 $0 12 $61,417 1 $92,000 APPLICATIONS APPROVED, NOT ACCEPTED 0 $0 2 $69,000 8 $130,250 0 $0 0 $0 2 $37,000 0 $0 APPLICATIONS DENIED 4 $142,500 4 $52,000 39 $103,308 8 $38,625 0 $0 5 $56,800 0 $0 APPLICATIONS WITHDRAWN 2 $127,500 4 $145,000 19 $118,211 4 $27,500 1 $348,000 0 $0 0 $0 FILES CLOSED FOR INCOMPLETENESS 0 $0 1 $35,000 1 $106,000 0 $0 0 $0 1 $35,000 0 $0
Aggregated Statistics For Year 2008(Based on 2 full tracts) A) FHA, FSA/RHS & VA B) Conventional C) Refinancings D) Home Improvement Loans F) Non-occupant Loans on G) Loans On Manufactured Number Average Value Number Average Value Number Average Value Number Average Value Number Average Value Number Average Value
LOANS ORIGINATED 26 $116,000 37 $101,838 51 $83,843 21 $21,905 15 $79,200 4 $65,750 APPLICATIONS APPROVED, NOT ACCEPTED 2 $109,500 2 $67,500 3 $57,000 4 $10,250 0 $0 0 $0 APPLICATIONS DENIED 2 $115,000 4 $61,500 83 $105,892 17 $32,588 2 $96,500 1 $35,000 APPLICATIONS WITHDRAWN 5 $135,400 4 $37,750 14 $107,357 3 $35,333 2 $69,500 0 $0 FILES CLOSED FOR INCOMPLETENESS 1 $95,000 4 $74,750 3 $62,000 2 $65,500 0 $0 0 $0
Aggregated Statistics For Year 2007(Based on 2 full tracts) A) FHA, FSA/RHS & VA B) Conventional C) Refinancings D) Home Improvement Loans F) Non-occupant Loans on G) Loans On Manufactured Number Average Value Number Average Value Number Average Value Number Average Value Number Average Value Number Average Value
LOANS ORIGINATED 16 $94,312 66 $107,561 63 $90,381 35 $48,714 12 $93,750 2 $67,000 APPLICATIONS APPROVED, NOT ACCEPTED 0 $0 7 $84,714 16 $100,312 6 $11,667 2 $85,000 2 $46,500 APPLICATIONS DENIED 3 $84,667 9 $74,889 84 $97,655 26 $46,231 2 $37,500 2 $33,000 APPLICATIONS WITHDRAWN 2 $82,500 9 $98,889 22 $120,773 2 $15,000 1 $80,000 0 $0 FILES CLOSED FOR INCOMPLETENESS 0 $0 1 $74,000 7 $98,714 0 $0 0 $0 0 $0
Aggregated Statistics For Year 2006(Based on 2 full tracts) A) FHA, FSA/RHS & VA B) Conventional C) Refinancings D) Home Improvement Loans E) Loans on Dwellings For 5+ Families F) Non-occupant Loans on G) Loans On Manufactured Number Average Value Number Average Value Number Average Value Number Average Value Number Average Value Number Average Value Number Average Value
LOANS ORIGINATED 14 $110,143 81 $82,765 91 $79,549 46 $33,543 1 $155,000 19 $92,158 0 $0 APPLICATIONS APPROVED, NOT ACCEPTED 0 $0 12 $65,417 18 $95,944 6 $21,667 0 $0 1 $104,000 2 $51,500 APPLICATIONS DENIED 0 $0 18 $87,167 76 $83,618 28 $23,143 0 $0 0 $0 0 $0 APPLICATIONS WITHDRAWN 0 $0 12 $100,917 51 $86,843 2 $161,000 0 $0 5 $75,600 1 $91,000 FILES CLOSED FOR INCOMPLETENESS 0 $0 1 $76,000 16 $78,625 0 $0 0 $0 0 $0 0 $0
Aggregated Statistics For Year 2005(Based on 2 full tracts) A) FHA, FSA/RHS & VA B) Conventional C) Refinancings D) Home Improvement Loans E) Loans on Dwellings For 5+ Families F) Non-occupant Loans on G) Loans On Manufactured Number Average Value Number Average Value Number Average Value Number Average Value Number Average Value Number Average Value Number Average Value
LOANS ORIGINATED 10 $84,000 100 $75,700 102 $81,255 42 $29,548 1 $120,000 24 $52,417 3 $77,000 APPLICATIONS APPROVED, NOT ACCEPTED 0 $0 8 $61,625 21 $85,190 10 $43,900 0 $0 4 $45,500 2 $61,500 APPLICATIONS DENIED 2 $58,000 12 $72,583 92 $78,761 27 $20,778 0 $0 16 $24,312 3 $49,000 APPLICATIONS WITHDRAWN 3 $96,667 7 $103,571 50 $91,040 4 $155,000 0 $0 3 $98,667 0 $0 FILES CLOSED FOR INCOMPLETENESS 0 $0 0 $0 12 $112,917 1 $60,000 0 $0 0 $0 0 $0
Aggregated Statistics For Year 2004(Based on 2 full tracts) A) FHA, FSA/RHS & VA B) Conventional C) Refinancings D) Home Improvement Loans F) Non-occupant Loans on G) Loans On Manufactured Number Average Value Number Average Value Number Average Value Number Average Value Number Average Value Number Average Value
LOANS ORIGINATED 15 $106,600 75 $95,840 107 $83,822 39 $36,513 13 $56,385 2 $62,500 APPLICATIONS APPROVED, NOT ACCEPTED 0 $0 10 $60,900 21 $74,714 3 $10,000 3 $56,333 0 $0 APPLICATIONS DENIED 0 $0 6 $78,833 88 $72,250 31 $18,161 16 $20,500 3 $36,667 APPLICATIONS WITHDRAWN 4 $102,250 15 $73,867 58 $79,948 12 $57,000 3 $79,667 1 $55,000 FILES CLOSED FOR INCOMPLETENESS 0 $0 1 $131,000 30 $96,933 0 $0 0 $0 0 $0
Aggregated Statistics For Year 2003(Based on 2 full tracts) A) FHA, FSA/RHS & VA B) Conventional C) Refinancings D) Home Improvement Loans F) Non-occupant Loans on Number Average Value Number Average Value Number Average Value Number Average Value Number Average Value
LOANS ORIGINATED 16 $111,750 84 $79,774 209 $71,541 37 $31,757 20 $57,000 APPLICATIONS APPROVED, NOT ACCEPTED 0 $0 7 $63,000 34 $93,735 4 $69,500 4 $69,500 APPLICATIONS DENIED 1 $64,000 5 $64,600 113 $73,938 12 $19,500 6 $35,333 APPLICATIONS WITHDRAWN 2 $85,000 9 $134,111 55 $72,945 1 $5,000 3 $54,000 FILES CLOSED FOR INCOMPLETENESS 0 $0 8 $63,500 6 $105,167 0 $0 1 $55,000
Aggregated Statistics For Year 2002(Based on 2 full tracts) A) FHA, FSA/RHS & VA B) Conventional C) Refinancings D) Home Improvement Loans F) Non-occupant Loans on Number Average Value Number Average Value Number Average Value Number Average Value Number Average Value
LOANS ORIGINATED 8 $80,750 56 $68,464 141 $73,333 22 $25,818 19 $45,368 APPLICATIONS APPROVED, NOT ACCEPTED 0 $0 3 $74,000 39 $80,128 4 $66,250 0 $0 APPLICATIONS DENIED 4 $73,750 18 $47,278 98 $70,031 14 $22,714 4 $57,750 APPLICATIONS WITHDRAWN 1 $89,000 7 $58,000 48 $80,750 2 $35,000 1 $52,000 FILES CLOSED FOR INCOMPLETENESS 0 $0 1 $75,000 7 $63,286 0 $0 0 $0
Aggregated Statistics For Year 2001(Based on 2 full tracts) A) FHA, FSA/RHS & VA B) Conventional C) Refinancings D) Home Improvement Loans E) Loans on Dwellings For 5+ Families F) Non-occupant Loans on Number Average Value Number Average Value Number Average Value Number Average Value Number Average Value Number Average Value
LOANS ORIGINATED 20 $72,600 58 $67,155 107 $66,570 24 $20,250 1 $300,000 5 $49,000 APPLICATIONS APPROVED, NOT ACCEPTED 1 $80,000 9 $36,000 35 $67,914 16 $22,312 0 $0 2 $51,500 APPLICATIONS DENIED 0 $0 13 $39,538 64 $52,438 18 $18,111 0 $0 1 $15,000 APPLICATIONS WITHDRAWN 1 $65,000 5 $81,200 32 $69,156 5 $28,800 0 $0 1 $36,000 FILES CLOSED FOR INCOMPLETENESS 0 $0 1 $38,000 8 $77,375 2 $25,000 0 $0 0 $0
Aggregated Statistics For Year 2000(Based on 2 full tracts) A) FHA, FSA/RHS & VA B) Conventional C) Refinancings D) Home Improvement Loans E) Loans on Dwellings For 5+ Families F) Non-occupant Loans on Number Average Value Number Average Value Number Average Value Number Average Value Number Average Value Number Average Value
LOANS ORIGINATED 21 $70,571 60 $66,883 52 $59,635 21 $17,143 1 $52,000 9 $63,000 APPLICATIONS APPROVED, NOT ACCEPTED 1 $63,000 6 $49,333 24 $67,292 9 $20,444 0 $0 0 $0 APPLICATIONS DENIED 2 $56,500 33 $40,030 54 $54,556 13 $19,692 0 $0 1 $75,000 APPLICATIONS WITHDRAWN 0 $0 10 $74,100 25 $43,160 3 $13,667 0 $0 1 $63,000 FILES CLOSED FOR INCOMPLETENESS 0 $0 2 $29,000 6 $47,167 0 $0 0 $0 0 $0
Aggregated Statistics For Year 1999(Based on 2 full tracts) A) FHA, FSA/RHS & VA B) Conventional C) Refinancings D) Home Improvement Loans E) Loans on Dwellings For 5+ Families F) Non-occupant Loans on Number Average Value Number Average Value Number Average Value Number Average Value Number Average Value Number Average Value
LOANS ORIGINATED 11 $73,163 66 $63,874 75 $53,977 41 $18,946 1 $47,830 21 $46,773 APPLICATIONS APPROVED, NOT ACCEPTED 0 $0 11 $51,375 22 $47,352 7 $27,709 0 $0 0 $0 APPLICATIONS DENIED 1 $57,390 13 $44,019 55 $66,009 23 $21,519 0 $0 1 $47,830 APPLICATIONS WITHDRAWN 1 $67,910 10 $49,177 21 $52,092 6 $48,078 0 $0 1 $42,960 FILES CLOSED FOR INCOMPLETENESS 0 $0 0 $0 3 $69,050 0 $0 0 $0 0 $0
Detailed HMDA statistics for the following Tracts:
0329.00
, 0330.00
Private Mortgage Insurance Companies Aggregated Statistics For Year 2009(Based on 2 full tracts) A) Conventional B) Refinancings Number Average Value Number Average Value
LOANS ORIGINATED 9 $96,000 4 $116,500 APPLICATIONS APPROVED, NOT ACCEPTED 1 $86,000 1 $145,000 APPLICATIONS DENIED 0 $0 3 $82,333 APPLICATIONS WITHDRAWN 0 $0 0 $0 FILES CLOSED FOR INCOMPLETENESS 0 $0 0 $0
Aggregated Statistics For Year 2007(Based on 2 full tracts) A) Conventional B) Refinancings C) Non-occupant Loans on Number Average Value Number Average Value Number Average Value
LOANS ORIGINATED 24 $102,708 5 $143,800 1 $74,000 APPLICATIONS APPROVED, NOT ACCEPTED 1 $95,000 0 $0 0 $0 APPLICATIONS DENIED 0 $0 1 $82,000 0 $0 APPLICATIONS WITHDRAWN 0 $0 0 $0 0 $0 FILES CLOSED FOR INCOMPLETENESS 0 $0 0 $0 0 $0
Aggregated Statistics For Year 2006(Based on 2 full tracts) A) Conventional B) Refinancings C) Non-occupant Loans on Number Average Value Number Average Value Number Average Value
LOANS ORIGINATED 22 $93,227 4 $93,000 3 $46,000 APPLICATIONS APPROVED, NOT ACCEPTED 2 $66,500 4 $100,750 1 $90,000 APPLICATIONS DENIED 0 $0 0 $0 0 $0 APPLICATIONS WITHDRAWN 0 $0 1 $75,000 0 $0 FILES CLOSED FOR INCOMPLETENESS 0 $0 0 $0 0 $0
Aggregated Statistics For Year 2005(Based on 2 full tracts) A) Conventional B) Refinancings C) Non-occupant Loans on D) Loans On Manufactured Number Average Value Number Average Value Number Average Value Number Average Value
LOANS ORIGINATED 22 $95,364 6 $91,667 3 $75,333 1 $105,000 APPLICATIONS APPROVED, NOT ACCEPTED 1 $84,000 4 $136,500 1 $84,000 0 $0 APPLICATIONS DENIED 0 $0 0 $0 0 $0 0 $0 APPLICATIONS WITHDRAWN 2 $102,000 0 $0 1 $53,000 0 $0 FILES CLOSED FOR INCOMPLETENESS 0 $0 0 $0 0 $0 0 $0
Aggregated Statistics For Year 2004(Based on 2 full tracts) A) Conventional B) Refinancings C) Non-occupant Loans on Number Average Value Number Average Value Number Average Value
LOANS ORIGINATED 25 $89,680 8 $107,500 1 $65,000 APPLICATIONS APPROVED, NOT ACCEPTED 4 $116,500 1 $120,000 1 $55,000 APPLICATIONS DENIED 0 $0 0 $0 0 $0 APPLICATIONS WITHDRAWN 0 $0 0 $0 0 $0 FILES CLOSED FOR INCOMPLETENESS 0 $0 0 $0 0 $0
Aggregated Statistics For Year 2003(Based on 2 full tracts) A) Conventional B) Refinancings C) Non-occupant Loans on Number Average Value Number Average Value Number Average Value
LOANS ORIGINATED 24 $91,708 16 $105,438 2 $68,000 APPLICATIONS APPROVED, NOT ACCEPTED 2 $96,500 5 $88,800 0 $0 APPLICATIONS DENIED 0 $0 1 $77,000 1 $77,000 APPLICATIONS WITHDRAWN 1 $76,000 0 $0 0 $0 FILES CLOSED FOR INCOMPLETENESS 0 $0 0 $0 0 $0
Aggregated Statistics For Year 2002(Based on 2 full tracts) A) Conventional B) Refinancings C) Non-occupant Loans on Number Average Value Number Average Value Number Average Value
LOANS ORIGINATED 19 $87,368 11 $92,545 2 $66,000 APPLICATIONS APPROVED, NOT ACCEPTED 2 $60,500 1 $129,000 0 $0 APPLICATIONS DENIED 0 $0 0 $0 0 $0 APPLICATIONS WITHDRAWN 0 $0 0 $0 0 $0 FILES CLOSED FOR INCOMPLETENESS 0 $0 0 $0 0 $0
Aggregated Statistics For Year 2001(Based on 2 full tracts) A) Conventional B) Refinancings C) Non-occupant Loans on Number Average Value Number Average Value Number Average Value
LOANS ORIGINATED 16 $91,375 10 $83,700 1 $36,000 APPLICATIONS APPROVED, NOT ACCEPTED 4 $61,500 1 $81,000 0 $0 APPLICATIONS DENIED 0 $0 0 $0 0 $0 APPLICATIONS WITHDRAWN 0 $0 0 $0 0 $0 FILES CLOSED FOR INCOMPLETENESS 0 $0 0 $0 0 $0
Aggregated Statistics For Year 2000(Based on 2 full tracts) A) Conventional B) Refinancings C) Non-occupant Loans on Number Average Value Number Average Value Number Average Value
LOANS ORIGINATED 17 $81,235 2 $132,500 1 $45,000 APPLICATIONS APPROVED, NOT ACCEPTED 2 $84,000 1 $60,000 0 $0 APPLICATIONS DENIED 1 $67,000 0 $0 0 $0 APPLICATIONS WITHDRAWN 1 $59,000 0 $0 0 $0 FILES CLOSED FOR INCOMPLETENESS 0 $0 0 $0 0 $0
Aggregated Statistics For Year 1999(Based on 2 full tracts) A) Conventional B) Refinancings C) Non-occupant Loans on Number Average Value Number Average Value Number Average Value
LOANS ORIGINATED 18 $78,273 7 $59,243 1 $105,010 APPLICATIONS APPROVED, NOT ACCEPTED 2 $72,595 0 $0 0 $0 APPLICATIONS DENIED 0 $0 0 $0 0 $0 APPLICATIONS WITHDRAWN 1 $106,920 1 $50,690 0 $0 FILES CLOSED FOR INCOMPLETENESS 0 $0 0 $0 0 $0
Detailed PMIC statistics for the following Tracts:
0329.00
, 0330.00 Fire-safe hotels and motels in Grove City, Pennsylvania:
Best Western Grove City Inn, 1924 Leesburg Grv City Rd, Grove City, Pennsylvania 16127 Phone: (724) 748-5836, Fax: (724) 748-5486
Comfort Inn Grove City, 118 Garrett Dr, Grove City, Pennsylvania 16127 Phone: (724) 748-1005, Fax: (724) 748-1006
All 2 fire-safe hotels and motels in Grove City, Pennsylvania
Most common first names in Grove City, PA among deceased individuals Name Count Lived (average)
John 173 77.7 years William 155 77.5 years Mary 148 82.2 years James 121 74.6 years Robert 98 71.4 years Charles 94 78.4 years Helen 86 81.2 years George 78 78.7 years Margaret 64 83.6 years Ruth 63 81.6 years
Most common last names in Grove City, PA among deceased individuals Last name Count Lived (average)
Miller 44 81.0 years Smith 42 80.3 years Thompson 40 78.1 years Brown 34 80.2 years Hoffman 32 76.9 years Montgomery 27 82.0 years Uber 27 78.5 years Young 24 74.5 years Jones 24 80.2 years Campbell 21 76.6 years
Grove City compared to Pennsylvania state average:
Unemployed percentage below state average. Black race population percentage significantly below state average. Hispanic race population percentage significantly below state average. Median age significantly below state average. Foreign-born population percentage significantly below state average. Length of stay since moving in above state average. Number of college students significantly above state average. Percentage of population with a bachelor's degree or higher above state average. Grove City on our top lists :
#5 on the list of "Top 101 cities with the lowest number of assaults per 100,000 residents (population 5,000+)"
#67 on the list of "Top 101 cities with largest percentage of males in occupations: education, training, and library occupations (population 5,000+)"
#67 on the list of "Top 101 cities with largest percentage of males in occupations: fire fighting and prevention workers including supervisors (population 5,000+)"
#79 on the list of "Top 100 cities with highest percentage of college students (pop. 5,000+)"
#86 on the list of "Top 100 cities with old houses but young residents"
#101 on the list of "Top 101 cities with the largest percentage of people in college dormitories (includes college quarters off campus) (population 1,000+)"
#15 on the list of "Top 101 counties with the highest Particulate Matter (PM2.5 ) Annual air pollution readings in 2012 (µg/m3 )"
#35 on the list of "Top 101 counties with the lowest percentage of residents relocating from other counties between 2010 and 2011 (pop. 50,000+)"
#47 on the list of "Top 101 counties with the lowest number of births per 1000 residents 2007-2013"
#48 on the list of "Top 101 counties with the highest number of deaths per 1000 residents 2007-2013 (pop. 50,000+)"
#50 on the list of "Top 101 counties with the lowest percentage of residents relocating to other counties in 2011 (pop. 50,000+)"
Top Patent Applicants
Richard C. Peoples (7)
John Dowell (6)
Daniel T. Biddle (5)
Todd Smith (5)
John Patrick Dowell (5)
Barry Record (3)
John P. Dowell (2)
Ronald K. Dickey (2)
Richard L. Hitchcock (2)
Michael Schleigh (2)
Total of 65 patent applications in 2008-2024.

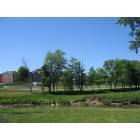
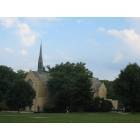
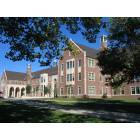
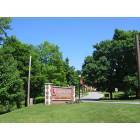
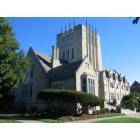

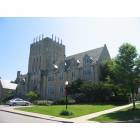
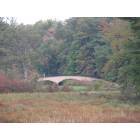
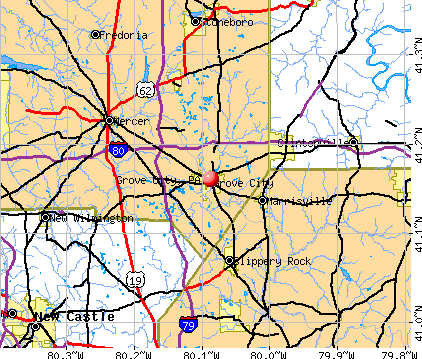


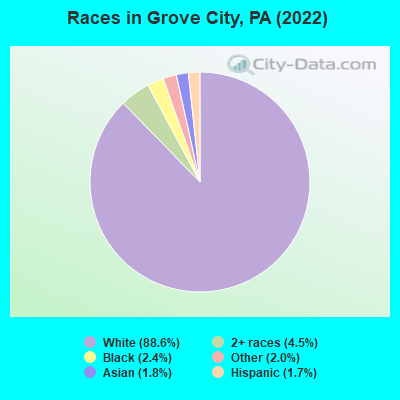
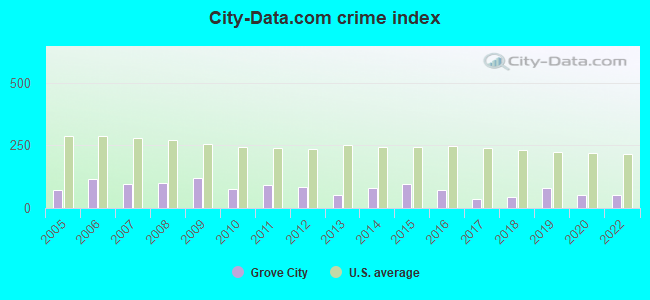
 Recent articles from our blog. Our writers, many of them Ph.D. graduates or candidates, create easy-to-read articles on a wide variety of topics.

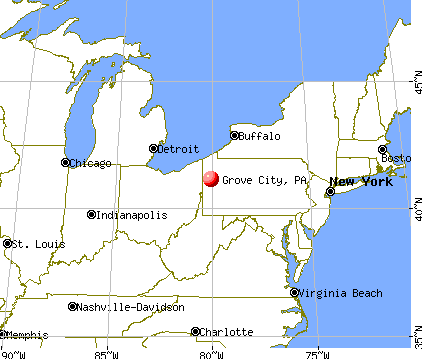
 (29.6 miles
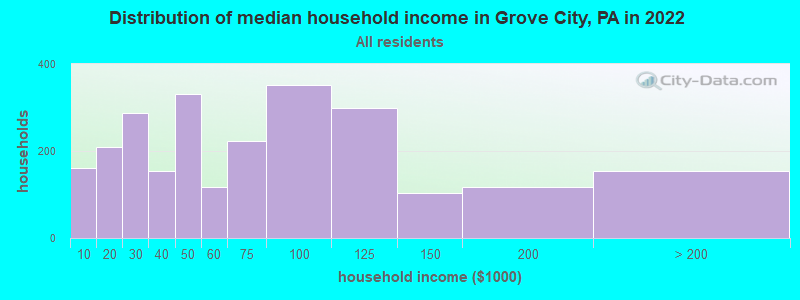
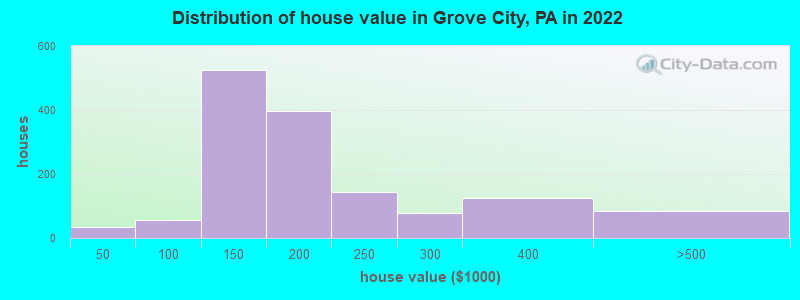
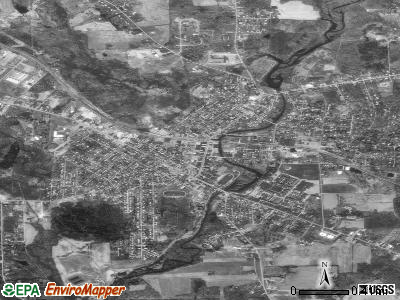
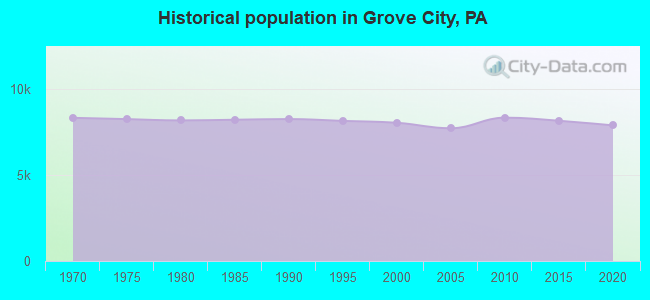
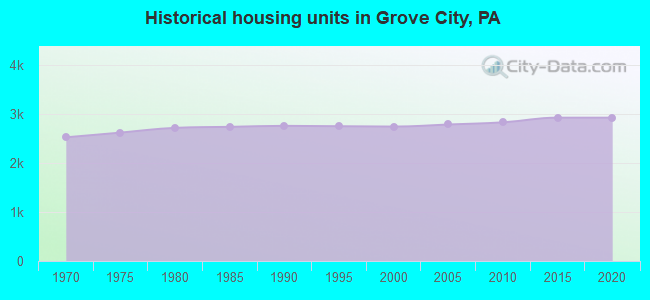
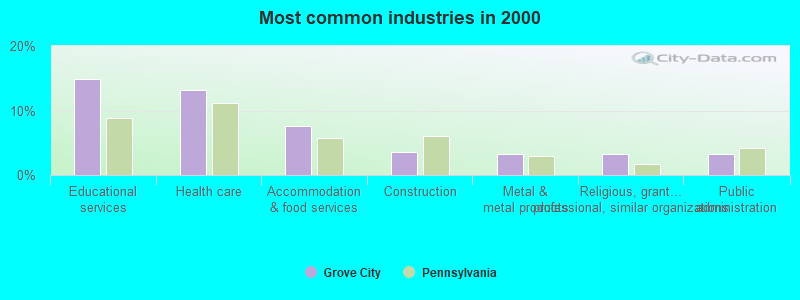
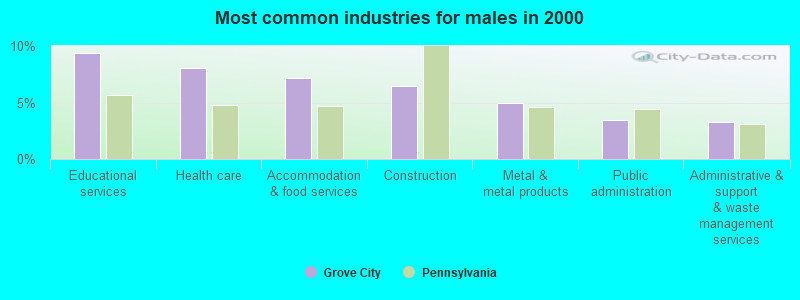
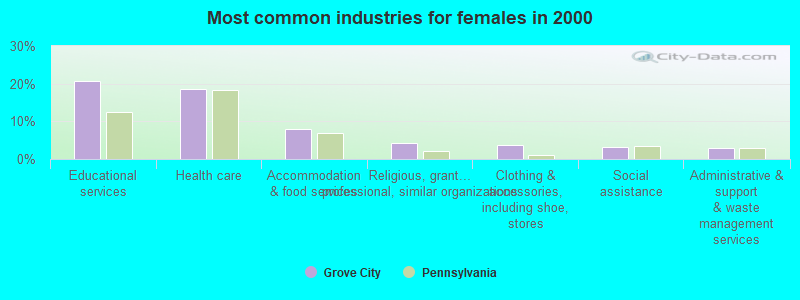
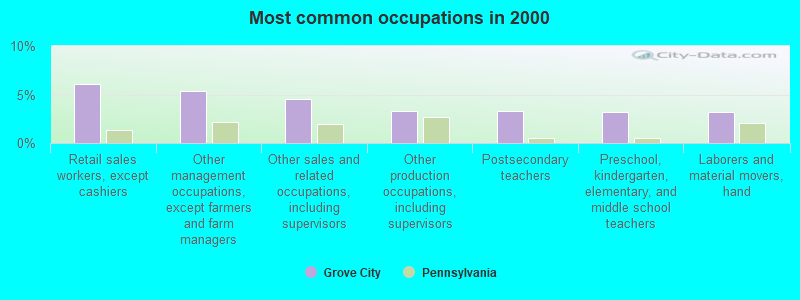
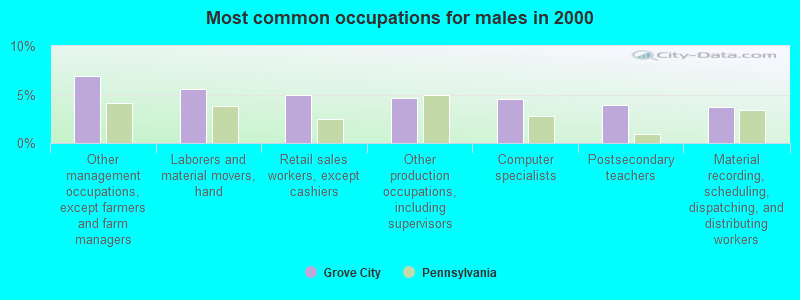
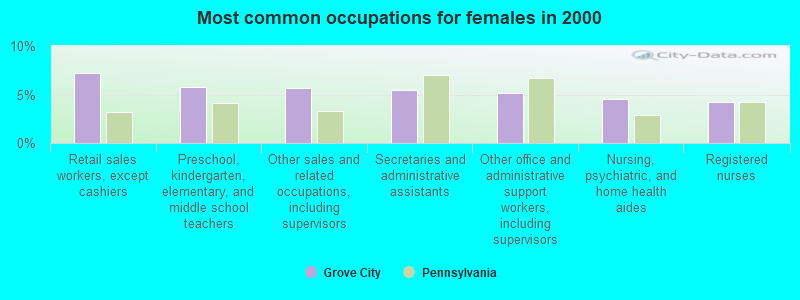
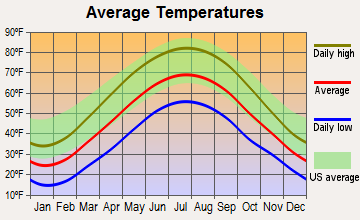
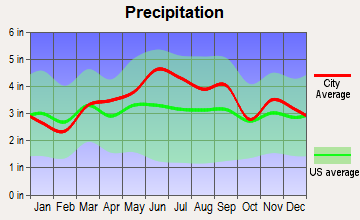
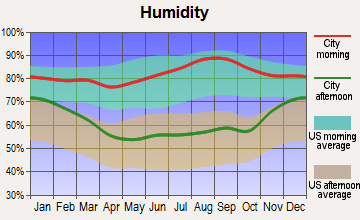
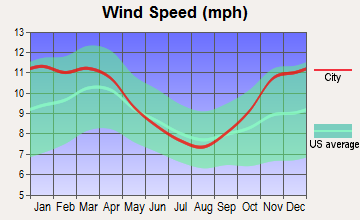
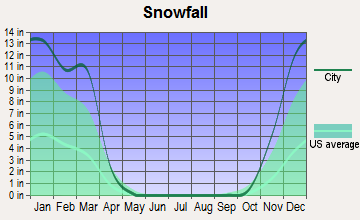
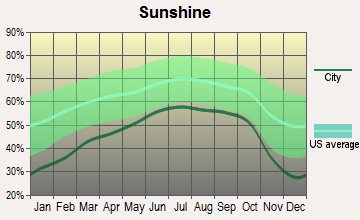
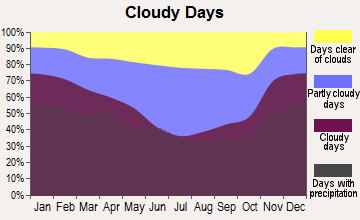
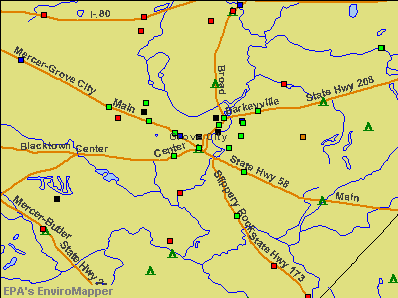

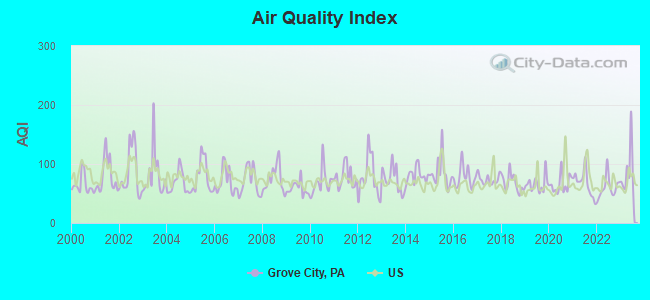
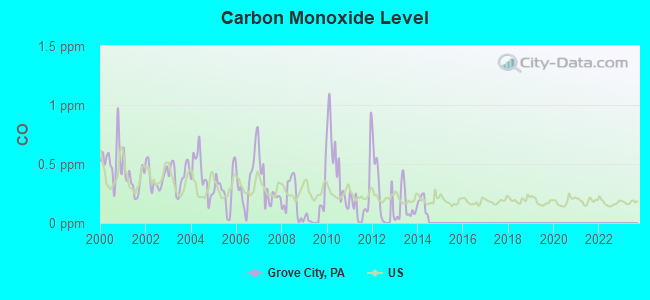
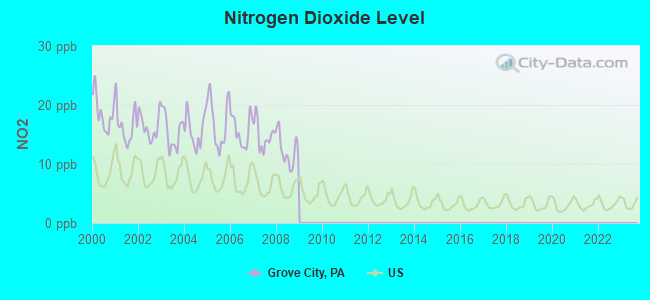
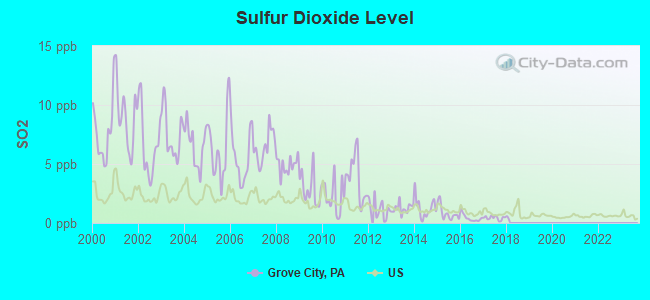
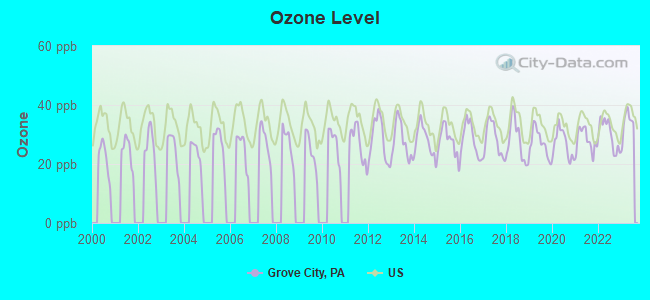
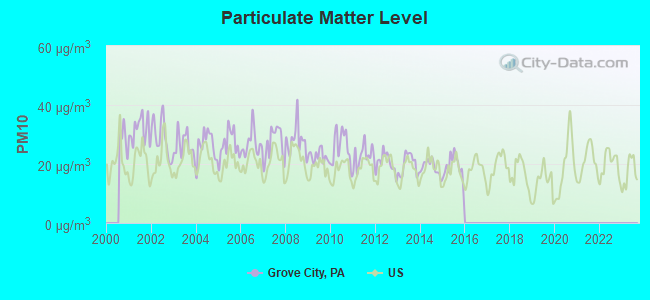
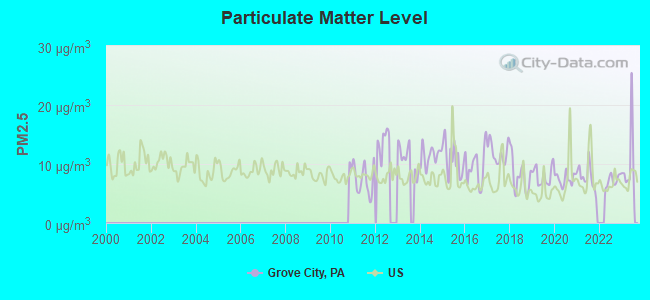
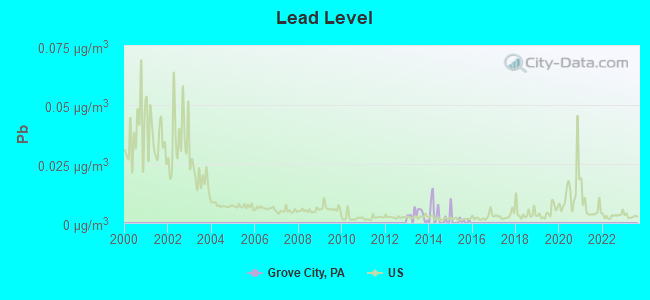
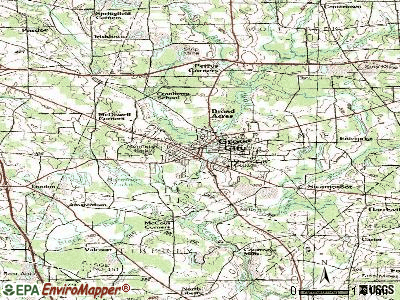
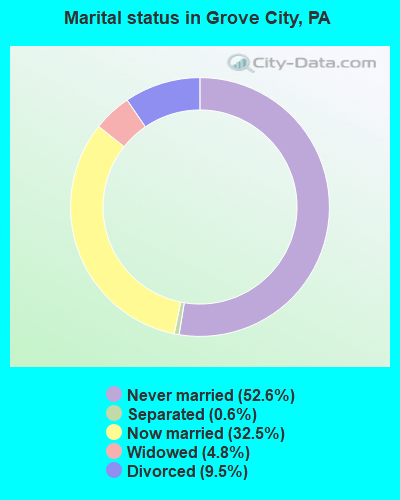
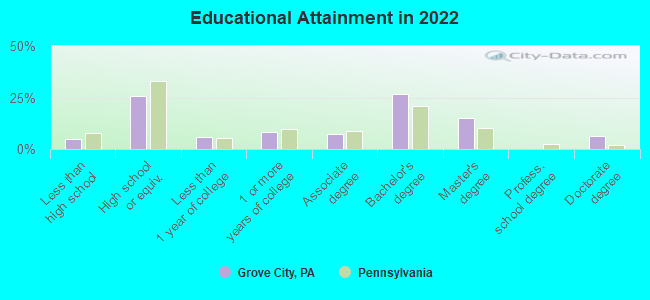
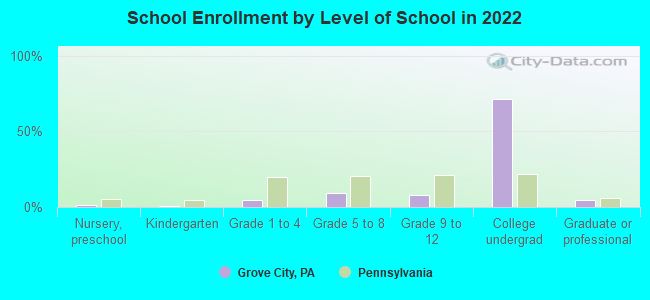
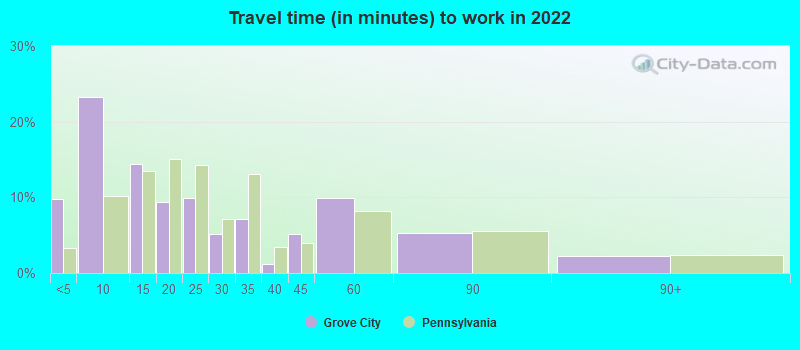
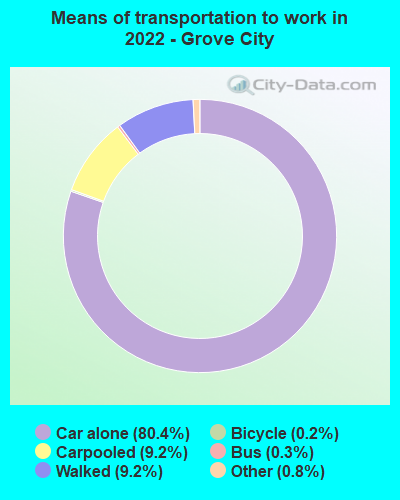
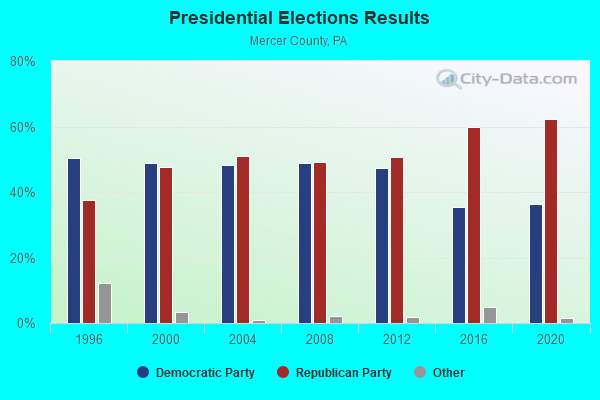
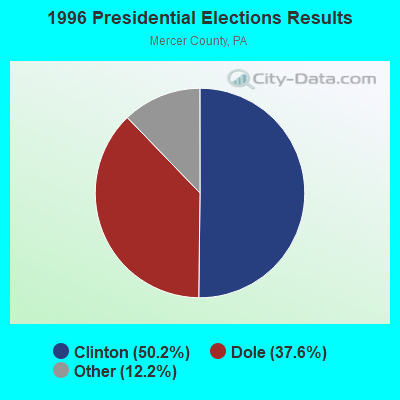
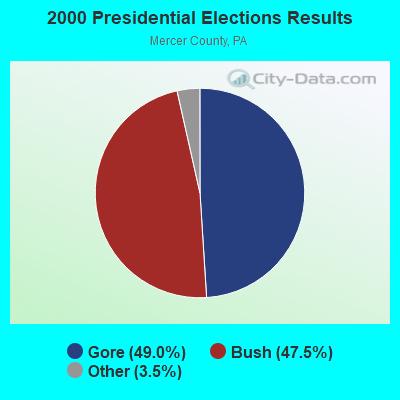
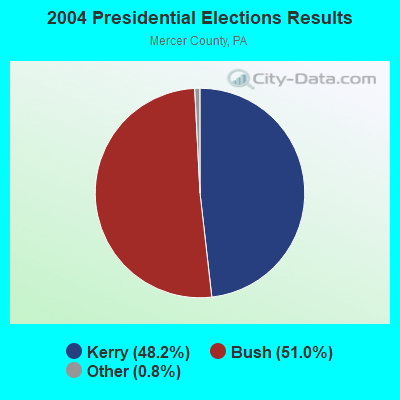
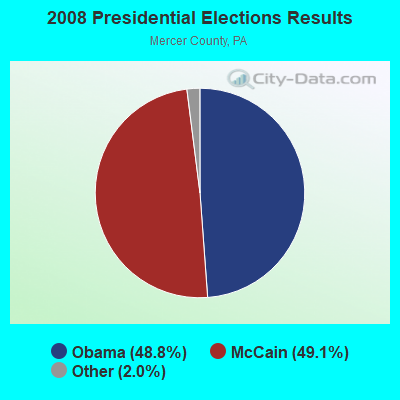
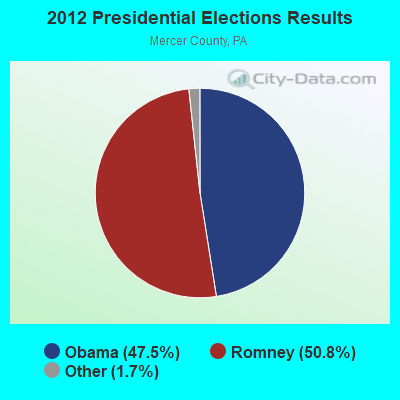
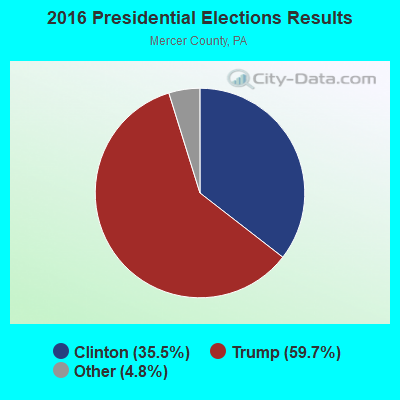
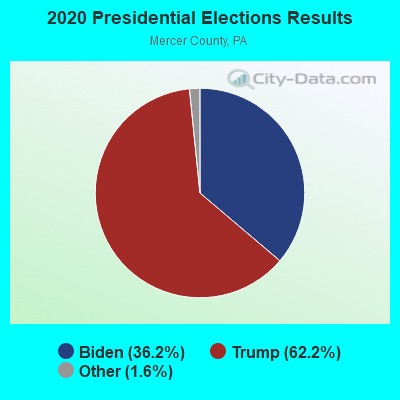
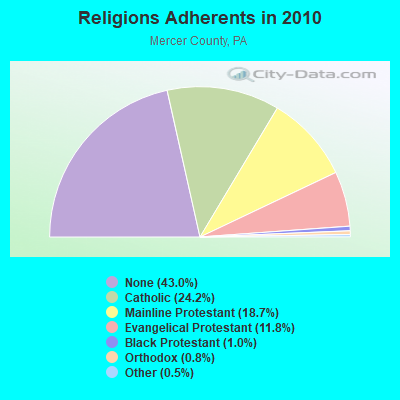
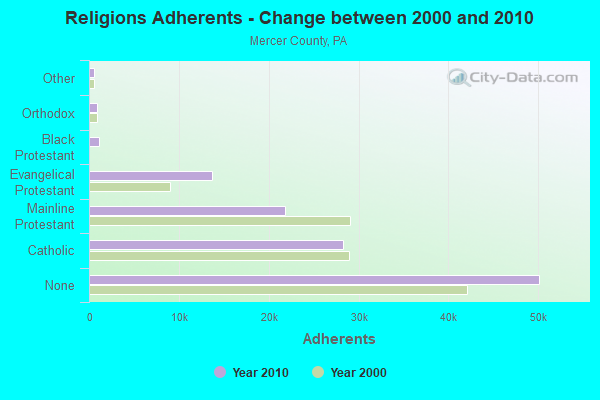
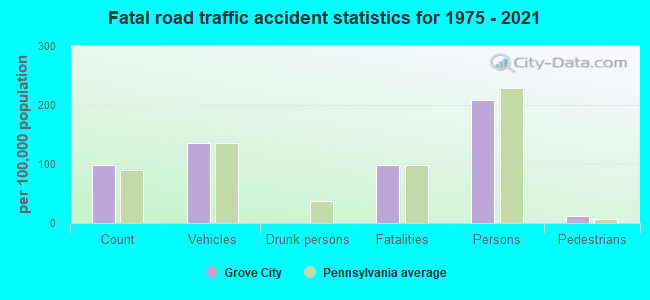
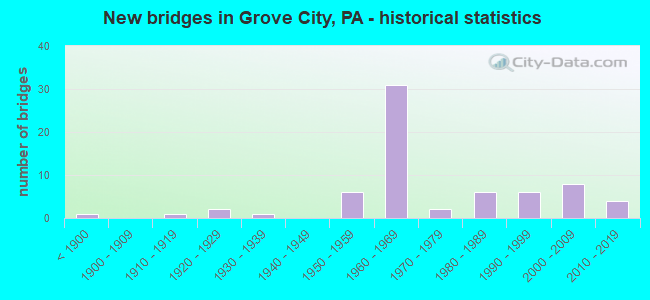
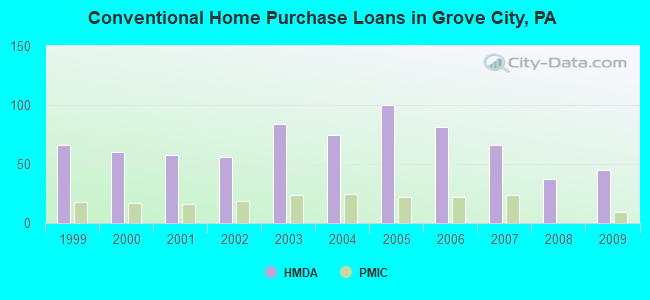
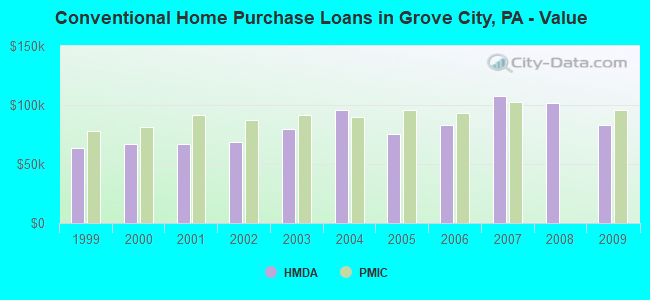
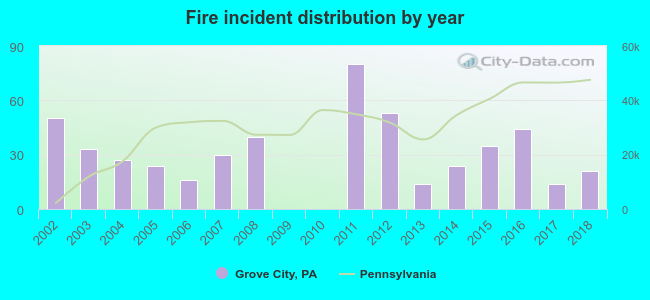 According to the data from the years 2002 - 2018 the average number of fire incidents per year is 30. The highest number of fires - 80 took place in 2011, and the least - 0 in 2009. The data has a decreasing trend.
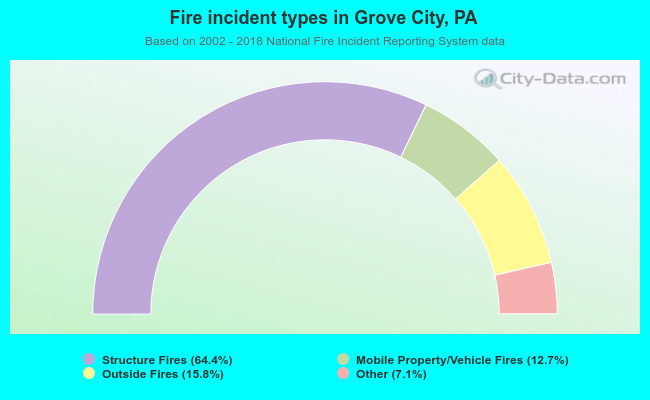 When looking into fire subcategories, the most incidents belonged to: Structure Fires (64.4%), and Outside Fires (15.8%).