Grover Beach, California Submit your own pictures of this city and show them to the world
OSM Map
General Map
Google Map
MSN Map
OSM Map
General Map
Google Map
MSN Map
OSM Map
General Map
Google Map
MSN Map
OSM Map
General Map
Google Map
MSN Map
Please wait while loading the map...
Population in 2022: 12,619 (100% urban, 0% rural). Population change since 2000: -3.4%Males: 6,444 Females: 6,175
March 2022 cost of living index in Grover Beach: 109.3 (more than average, U.S. average is 100) Percentage of residents living in poverty in 2022: 10.6%for White Non-Hispanic residents , 13.6% for Hispanic or Latino residents , 47.6% for American Indian residents , 34.6% for other race residents )
Profiles of local businesses
Business Search - 14 Million verified businesses
Data:
Median household income ($)
Median household income (% change since 2000)
Household income diversity
Ratio of average income to average house value (%)
Ratio of average income to average rent
Median household income ($) - White
Median household income ($) - Black or African American
Median household income ($) - Asian
Median household income ($) - Hispanic or Latino
Median household income ($) - American Indian and Alaska Native
Median household income ($) - Multirace
Median household income ($) - Other Race
Median household income for houses/condos with a mortgage ($)
Median household income for apartments without a mortgage ($)
Races - White alone (%)
Races - White alone (% change since 2000)
Races - Black alone (%)
Races - Black alone (% change since 2000)
Races - American Indian alone (%)
Races - American Indian alone (% change since 2000)
Races - Asian alone (%)
Races - Asian alone (% change since 2000)
Races - Hispanic (%)
Races - Hispanic (% change since 2000)
Races - Native Hawaiian and Other Pacific Islander alone (%)
Races - Native Hawaiian and Other Pacific Islander alone (% change since 2000)
Races - Two or more races (%)
Races - Two or more races (% change since 2000)
Races - Other race alone (%)
Races - Other race alone (% change since 2000)
Racial diversity
Unemployment (%)
Unemployment (% change since 2000)
Unemployment (%) - White
Unemployment (%) - Black or African American
Unemployment (%) - Asian
Unemployment (%) - Hispanic or Latino
Unemployment (%) - American Indian and Alaska Native
Unemployment (%) - Multirace
Unemployment (%) - Other Race
Population density (people per square mile)
Population - Males (%)
Population - Females (%)
Population - Males (%) - White
Population - Males (%) - Black or African American
Population - Males (%) - Asian
Population - Males (%) - Hispanic or Latino
Population - Males (%) - American Indian and Alaska Native
Population - Males (%) - Multirace
Population - Males (%) - Other Race
Population - Females (%) - White
Population - Females (%) - Black or African American
Population - Females (%) - Asian
Population - Females (%) - Hispanic or Latino
Population - Females (%) - American Indian and Alaska Native
Population - Females (%) - Multirace
Population - Females (%) - Other Race
Coronavirus confirmed cases (Apr 27, 2024)
Deaths caused by coronavirus (Apr 27, 2024)
Coronavirus confirmed cases (per 100k population) (Apr 27, 2024)
Deaths caused by coronavirus (per 100k population) (Apr 27, 2024)
Daily increase in number of cases (Apr 27, 2024)
Weekly increase in number of cases (Apr 27, 2024)
Cases doubled (in days) (Apr 27, 2024)
Hospitalized patients (Apr 18, 2022)
Negative test results (Apr 18, 2022)
Total test results (Apr 18, 2022)
COVID Vaccine doses distributed (per 100k population) (Sep 19, 2023)
COVID Vaccine doses administered (per 100k population) (Sep 19, 2023)
COVID Vaccine doses distributed (Sep 19, 2023)
COVID Vaccine doses administered (Sep 19, 2023)
Likely homosexual households (%)
Likely homosexual households (% change since 2000)
Likely homosexual households - Lesbian couples (%)
Likely homosexual households - Lesbian couples (% change since 2000)
Likely homosexual households - Gay men (%)
Likely homosexual households - Gay men (% change since 2000)
Cost of living index
Median gross rent ($)
Median contract rent ($)
Median monthly housing costs ($)
Median house or condo value ($)
Median house or condo value ($ change since 2000)
Mean house or condo value by units in structure - 1, detached ($)
Mean house or condo value by units in structure - 1, attached ($)
Mean house or condo value by units in structure - 2 ($)
Mean house or condo value by units in structure by units in structure - 3 or 4 ($)
Mean house or condo value by units in structure - 5 or more ($)
Mean house or condo value by units in structure - Boat, RV, van, etc. ($)
Mean house or condo value by units in structure - Mobile home ($)
Median house or condo value ($) - White
Median house or condo value ($) - Black or African American
Median house or condo value ($) - Asian
Median house or condo value ($) - Hispanic or Latino
Median house or condo value ($) - American Indian and Alaska Native
Median house or condo value ($) - Multirace
Median house or condo value ($) - Other Race
Median resident age
Resident age diversity
Median resident age - Males
Median resident age - Females
Median resident age - White
Median resident age - Black or African American
Median resident age - Asian
Median resident age - Hispanic or Latino
Median resident age - American Indian and Alaska Native
Median resident age - Multirace
Median resident age - Other Race
Median resident age - Males - White
Median resident age - Males - Black or African American
Median resident age - Males - Asian
Median resident age - Males - Hispanic or Latino
Median resident age - Males - American Indian and Alaska Native
Median resident age - Males - Multirace
Median resident age - Males - Other Race
Median resident age - Females - White
Median resident age - Females - Black or African American
Median resident age - Females - Asian
Median resident age - Females - Hispanic or Latino
Median resident age - Females - American Indian and Alaska Native
Median resident age - Females - Multirace
Median resident age - Females - Other Race
Commute - mean travel time to work (minutes)
Travel time to work - Less than 5 minutes (%)
Travel time to work - Less than 5 minutes (% change since 2000)
Travel time to work - 5 to 9 minutes (%)
Travel time to work - 5 to 9 minutes (% change since 2000)
Travel time to work - 10 to 19 minutes (%)
Travel time to work - 10 to 19 minutes (% change since 2000)
Travel time to work - 20 to 29 minutes (%)
Travel time to work - 20 to 29 minutes (% change since 2000)
Travel time to work - 30 to 39 minutes (%)
Travel time to work - 30 to 39 minutes (% change since 2000)
Travel time to work - 40 to 59 minutes (%)
Travel time to work - 40 to 59 minutes (% change since 2000)
Travel time to work - 60 to 89 minutes (%)
Travel time to work - 60 to 89 minutes (% change since 2000)
Travel time to work - 90 or more minutes (%)
Travel time to work - 90 or more minutes (% change since 2000)
Marital status - Never married (%)
Marital status - Now married (%)
Marital status - Separated (%)
Marital status - Widowed (%)
Marital status - Divorced (%)
Median family income ($)
Median family income (% change since 2000)
Median non-family income ($)
Median non-family income (% change since 2000)
Median per capita income ($)
Median per capita income (% change since 2000)
Median family income ($) - White
Median family income ($) - Black or African American
Median family income ($) - Asian
Median family income ($) - Hispanic or Latino
Median family income ($) - American Indian and Alaska Native
Median family income ($) - Multirace
Median family income ($) - Other Race
Median year house/condo built
Median year apartment built
Year house built - Built 2005 or later (%)
Year house built - Built 2000 to 2004 (%)
Year house built - Built 1990 to 1999 (%)
Year house built - Built 1980 to 1989 (%)
Year house built - Built 1970 to 1979 (%)
Year house built - Built 1960 to 1969 (%)
Year house built - Built 1950 to 1959 (%)
Year house built - Built 1940 to 1949 (%)
Year house built - Built 1939 or earlier (%)
Average household size
Household density (households per square mile)
Average household size - White
Average household size - Black or African American
Average household size - Asian
Average household size - Hispanic or Latino
Average household size - American Indian and Alaska Native
Average household size - Multirace
Average household size - Other Race
Occupied housing units (%)
Vacant housing units (%)
Owner occupied housing units (%)
Renter occupied housing units (%)
Vacancy status - For rent (%)
Vacancy status - For sale only (%)
Vacancy status - Rented or sold, not occupied (%)
Vacancy status - For seasonal, recreational, or occasional use (%)
Vacancy status - For migrant workers (%)
Vacancy status - Other vacant (%)
Residents with income below the poverty level (%)
Residents with income below 50% of the poverty level (%)
Children below poverty level (%)
Poor families by family type - Married-couple family (%)
Poor families by family type - Male, no wife present (%)
Poor families by family type - Female, no husband present (%)
Poverty status for native-born residents (%)
Poverty status for foreign-born residents (%)
Poverty among high school graduates not in families (%)
Poverty among people who did not graduate high school not in families (%)
Residents with income below the poverty level (%) - White
Residents with income below the poverty level (%) - Black or African American
Residents with income below the poverty level (%) - Asian
Residents with income below the poverty level (%) - Hispanic or Latino
Residents with income below the poverty level (%) - American Indian and Alaska Native
Residents with income below the poverty level (%) - Multirace
Residents with income below the poverty level (%) - Other Race
Air pollution - Air Quality Index (AQI)
Air pollution - CO
Air pollution - NO2
Air pollution - SO2
Air pollution - Ozone
Air pollution - PM10
Air pollution - PM25
Air pollution - Pb
Crime - Murders per 100,000 population
Crime - Rapes per 100,000 population
Crime - Robberies per 100,000 population
Crime - Assaults per 100,000 population
Crime - Burglaries per 100,000 population
Crime - Thefts per 100,000 population
Crime - Auto thefts per 100,000 population
Crime - Arson per 100,000 population
Crime - City-data.com crime index
Crime - Violent crime index
Crime - Property crime index
Crime - Murders per 100,000 population (5 year average)
Crime - Rapes per 100,000 population (5 year average)
Crime - Robberies per 100,000 population (5 year average)
Crime - Assaults per 100,000 population (5 year average)
Crime - Burglaries per 100,000 population (5 year average)
Crime - Thefts per 100,000 population (5 year average)
Crime - Auto thefts per 100,000 population (5 year average)
Crime - Arson per 100,000 population (5 year average)
Crime - City-data.com crime index (5 year average)
Crime - Violent crime index (5 year average)
Crime - Property crime index (5 year average)
1996 Presidential Elections Results (%) - Democratic Party (Clinton)
1996 Presidential Elections Results (%) - Republican Party (Dole)
1996 Presidential Elections Results (%) - Other
2000 Presidential Elections Results (%) - Democratic Party (Gore)
2000 Presidential Elections Results (%) - Republican Party (Bush)
2000 Presidential Elections Results (%) - Other
2004 Presidential Elections Results (%) - Democratic Party (Kerry)
2004 Presidential Elections Results (%) - Republican Party (Bush)
2004 Presidential Elections Results (%) - Other
2008 Presidential Elections Results (%) - Democratic Party (Obama)
2008 Presidential Elections Results (%) - Republican Party (McCain)
2008 Presidential Elections Results (%) - Other
2012 Presidential Elections Results (%) - Democratic Party (Obama)
2012 Presidential Elections Results (%) - Republican Party (Romney)
2012 Presidential Elections Results (%) - Other
2016 Presidential Elections Results (%) - Democratic Party (Clinton)
2016 Presidential Elections Results (%) - Republican Party (Trump)
2016 Presidential Elections Results (%) - Other
2020 Presidential Elections Results (%) - Democratic Party (Biden)
2020 Presidential Elections Results (%) - Republican Party (Trump)
2020 Presidential Elections Results (%) - Other
Ancestries Reported - Arab (%)
Ancestries Reported - Czech (%)
Ancestries Reported - Danish (%)
Ancestries Reported - Dutch (%)
Ancestries Reported - English (%)
Ancestries Reported - French (%)
Ancestries Reported - French Canadian (%)
Ancestries Reported - German (%)
Ancestries Reported - Greek (%)
Ancestries Reported - Hungarian (%)
Ancestries Reported - Irish (%)
Ancestries Reported - Italian (%)
Ancestries Reported - Lithuanian (%)
Ancestries Reported - Norwegian (%)
Ancestries Reported - Polish (%)
Ancestries Reported - Portuguese (%)
Ancestries Reported - Russian (%)
Ancestries Reported - Scotch-Irish (%)
Ancestries Reported - Scottish (%)
Ancestries Reported - Slovak (%)
Ancestries Reported - Subsaharan African (%)
Ancestries Reported - Swedish (%)
Ancestries Reported - Swiss (%)
Ancestries Reported - Ukrainian (%)
Ancestries Reported - United States (%)
Ancestries Reported - Welsh (%)
Ancestries Reported - West Indian (%)
Ancestries Reported - Other (%)
Educational Attainment - No schooling completed (%)
Educational Attainment - Less than high school (%)
Educational Attainment - High school or equivalent (%)
Educational Attainment - Less than 1 year of college (%)
Educational Attainment - 1 or more years of college (%)
Educational Attainment - Associate degree (%)
Educational Attainment - Bachelor's degree (%)
Educational Attainment - Master's degree (%)
Educational Attainment - Professional school degree (%)
Educational Attainment - Doctorate degree (%)
School Enrollment - Nursery, preschool (%)
School Enrollment - Kindergarten (%)
School Enrollment - Grade 1 to 4 (%)
School Enrollment - Grade 5 to 8 (%)
School Enrollment - Grade 9 to 12 (%)
School Enrollment - College undergrad (%)
School Enrollment - Graduate or professional (%)
School Enrollment - Not enrolled in school (%)
School enrollment - Public schools (%)
School enrollment - Private schools (%)
School enrollment - Not enrolled (%)
Median number of rooms in houses and condos
Median number of rooms in apartments
Housing units lacking complete plumbing facilities (%)
Housing units lacking complete kitchen facilities (%)
Density of houses
Urban houses (%)
Rural houses (%)
Households with people 60 years and over (%)
Households with people 65 years and over (%)
Households with people 75 years and over (%)
Households with one or more nonrelatives (%)
Households with no nonrelatives (%)
Population in households (%)
Family households (%)
Nonfamily households (%)
Population in families (%)
Family households with own children (%)
Median number of bedrooms in owner occupied houses
Mean number of bedrooms in owner occupied houses
Median number of bedrooms in renter occupied houses
Mean number of bedrooms in renter occupied houses
Median number of vehichles in owner occupied houses
Mean number of vehichles in owner occupied houses
Median number of vehichles in renter occupied houses
Mean number of vehichles in renter occupied houses
Mortgage status - with mortgage (%)
Mortgage status - with second mortgage (%)
Mortgage status - with home equity loan (%)
Mortgage status - with both second mortgage and home equity loan (%)
Mortgage status - without a mortgage (%)
Average family size
Average family size - White
Average family size - Black or African American
Average family size - Asian
Average family size - Hispanic or Latino
Average family size - American Indian and Alaska Native
Average family size - Multirace
Average family size - Other Race
Geographical mobility - Same house 1 year ago (%)
Geographical mobility - Moved within same county (%)
Geographical mobility - Moved from different county within same state (%)
Geographical mobility - Moved from different state (%)
Geographical mobility - Moved from abroad (%)
Place of birth - Born in state of residence (%)
Place of birth - Born in other state (%)
Place of birth - Native, outside of US (%)
Place of birth - Foreign born (%)
Housing units in structures - 1, detached (%)
Housing units in structures - 1, attached (%)
Housing units in structures - 2 (%)
Housing units in structures - 3 or 4 (%)
Housing units in structures - 5 to 9 (%)
Housing units in structures - 10 to 19 (%)
Housing units in structures - 20 to 49 (%)
Housing units in structures - 50 or more (%)
Housing units in structures - Mobile home (%)
Housing units in structures - Boat, RV, van, etc. (%)
House/condo owner moved in on average (years ago)
Renter moved in on average (years ago)
Year householder moved into unit - Moved in 1999 to March 2000 (%)
Year householder moved into unit - Moved in 1995 to 1998 (%)
Year householder moved into unit - Moved in 1990 to 1994 (%)
Year householder moved into unit - Moved in 1980 to 1989 (%)
Year householder moved into unit - Moved in 1970 to 1979 (%)
Year householder moved into unit - Moved in 1969 or earlier (%)
Means of transportation to work - Drove car alone (%)
Means of transportation to work - Carpooled (%)
Means of transportation to work - Public transportation (%)
Means of transportation to work - Bus or trolley bus (%)
Means of transportation to work - Streetcar or trolley car (%)
Means of transportation to work - Subway or elevated (%)
Means of transportation to work - Railroad (%)
Means of transportation to work - Ferryboat (%)
Means of transportation to work - Taxicab (%)
Means of transportation to work - Motorcycle (%)
Means of transportation to work - Bicycle (%)
Means of transportation to work - Walked (%)
Means of transportation to work - Other means (%)
Working at home (%)
Industry diversity
Most Common Industries - Agriculture, forestry, fishing and hunting, and mining (%)
Most Common Industries - Agriculture, forestry, fishing and hunting (%)
Most Common Industries - Mining, quarrying, and oil and gas extraction (%)
Most Common Industries - Construction (%)
Most Common Industries - Manufacturing (%)
Most Common Industries - Wholesale trade (%)
Most Common Industries - Retail trade (%)
Most Common Industries - Transportation and warehousing, and utilities (%)
Most Common Industries - Transportation and warehousing (%)
Most Common Industries - Utilities (%)
Most Common Industries - Information (%)
Most Common Industries - Finance and insurance, and real estate and rental and leasing (%)
Most Common Industries - Finance and insurance (%)
Most Common Industries - Real estate and rental and leasing (%)
Most Common Industries - Professional, scientific, and management, and administrative and waste management services (%)
Most Common Industries - Professional, scientific, and technical services (%)
Most Common Industries - Management of companies and enterprises (%)
Most Common Industries - Administrative and support and waste management services (%)
Most Common Industries - Educational services, and health care and social assistance (%)
Most Common Industries - Educational services (%)
Most Common Industries - Health care and social assistance (%)
Most Common Industries - Arts, entertainment, and recreation, and accommodation and food services (%)
Most Common Industries - Arts, entertainment, and recreation (%)
Most Common Industries - Accommodation and food services (%)
Most Common Industries - Other services, except public administration (%)
Most Common Industries - Public administration (%)
Occupation diversity
Most Common Occupations - Management, business, science, and arts occupations (%)
Most Common Occupations - Management, business, and financial occupations (%)
Most Common Occupations - Management occupations (%)
Most Common Occupations - Business and financial operations occupations (%)
Most Common Occupations - Computer, engineering, and science occupations (%)
Most Common Occupations - Computer and mathematical occupations (%)
Most Common Occupations - Architecture and engineering occupations (%)
Most Common Occupations - Life, physical, and social science occupations (%)
Most Common Occupations - Education, legal, community service, arts, and media occupations (%)
Most Common Occupations - Community and social service occupations (%)
Most Common Occupations - Legal occupations (%)
Most Common Occupations - Education, training, and library occupations (%)
Most Common Occupations - Arts, design, entertainment, sports, and media occupations (%)
Most Common Occupations - Healthcare practitioners and technical occupations (%)
Most Common Occupations - Health diagnosing and treating practitioners and other technical occupations (%)
Most Common Occupations - Health technologists and technicians (%)
Most Common Occupations - Service occupations (%)
Most Common Occupations - Healthcare support occupations (%)
Most Common Occupations - Protective service occupations (%)
Most Common Occupations - Fire fighting and prevention, and other protective service workers including supervisors (%)
Most Common Occupations - Law enforcement workers including supervisors (%)
Most Common Occupations - Food preparation and serving related occupations (%)
Most Common Occupations - Building and grounds cleaning and maintenance occupations (%)
Most Common Occupations - Personal care and service occupations (%)
Most Common Occupations - Sales and office occupations (%)
Most Common Occupations - Sales and related occupations (%)
Most Common Occupations - Office and administrative support occupations (%)
Most Common Occupations - Natural resources, construction, and maintenance occupations (%)
Most Common Occupations - Farming, fishing, and forestry occupations (%)
Most Common Occupations - Construction and extraction occupations (%)
Most Common Occupations - Installation, maintenance, and repair occupations (%)
Most Common Occupations - Production, transportation, and material moving occupations (%)
Most Common Occupations - Production occupations (%)
Most Common Occupations - Transportation occupations (%)
Most Common Occupations - Material moving occupations (%)
People in Group quarters - Institutionalized population (%)
People in Group quarters - Correctional institutions (%)
People in Group quarters - Federal prisons and detention centers (%)
People in Group quarters - Halfway houses (%)
People in Group quarters - Local jails and other confinement facilities (including police lockups) (%)
People in Group quarters - Military disciplinary barracks (%)
People in Group quarters - State prisons (%)
People in Group quarters - Other types of correctional institutions (%)
People in Group quarters - Nursing homes (%)
People in Group quarters - Hospitals/wards, hospices, and schools for the handicapped (%)
People in Group quarters - Hospitals/wards and hospices for chronically ill (%)
People in Group quarters - Hospices or homes for chronically ill (%)
People in Group quarters - Military hospitals or wards for chronically ill (%)
People in Group quarters - Other hospitals or wards for chronically ill (%)
People in Group quarters - Hospitals or wards for drug/alcohol abuse (%)
People in Group quarters - Mental (Psychiatric) hospitals or wards (%)
People in Group quarters - Schools, hospitals, or wards for the mentally retarded (%)
People in Group quarters - Schools, hospitals, or wards for the physically handicapped (%)
People in Group quarters - Institutions for the deaf (%)
People in Group quarters - Institutions for the blind (%)
People in Group quarters - Orthopedic wards and institutions for the physically handicapped (%)
People in Group quarters - Wards in general hospitals for patients who have no usual home elsewhere (%)
People in Group quarters - Wards in military hospitals for patients who have no usual home elsewhere (%)
People in Group quarters - Juvenile institutions (%)
People in Group quarters - Long-term care (%)
People in Group quarters - Homes for abused, dependent, and neglected children (%)
People in Group quarters - Residential treatment centers for emotionally disturbed children (%)
People in Group quarters - Training schools for juvenile delinquents (%)
People in Group quarters - Short-term care, detention or diagnostic centers for delinquent children (%)
People in Group quarters - Type of juvenile institution unknown (%)
People in Group quarters - Noninstitutionalized population (%)
People in Group quarters - College dormitories (includes college quarters off campus) (%)
People in Group quarters - Military quarters (%)
People in Group quarters - On base (%)
People in Group quarters - Barracks, unaccompanied personnel housing (UPH), (Enlisted/Officer), ;and similar group living quarters for military personnel (%)
People in Group quarters - Transient quarters for temporary residents (%)
People in Group quarters - Military ships (%)
People in Group quarters - Group homes (%)
People in Group quarters - Homes or halfway houses for drug/alcohol abuse (%)
People in Group quarters - Homes for the mentally ill (%)
People in Group quarters - Homes for the mentally retarded (%)
People in Group quarters - Homes for the physically handicapped (%)
People in Group quarters - Other group homes (%)
People in Group quarters - Religious group quarters (%)
People in Group quarters - Dormitories (%)
People in Group quarters - Agriculture workers' dormitories on farms (%)
People in Group quarters - Job Corps and vocational training facilities (%)
People in Group quarters - Other workers' dormitories (%)
People in Group quarters - Crews of maritime vessels (%)
People in Group quarters - Other nonhousehold living situations (%)
People in Group quarters - Other noninstitutional group quarters (%)
Residents speaking English at home (%)
Residents speaking English at home - Born in the United States (%)
Residents speaking English at home - Native, born elsewhere (%)
Residents speaking English at home - Foreign born (%)
Residents speaking Spanish at home (%)
Residents speaking Spanish at home - Born in the United States (%)
Residents speaking Spanish at home - Native, born elsewhere (%)
Residents speaking Spanish at home - Foreign born (%)
Residents speaking other language at home (%)
Residents speaking other language at home - Born in the United States (%)
Residents speaking other language at home - Native, born elsewhere (%)
Residents speaking other language at home - Foreign born (%)
Class of Workers - Employee of private company (%)
Class of Workers - Self-employed in own incorporated business (%)
Class of Workers - Private not-for-profit wage and salary workers (%)
Class of Workers - Local government workers (%)
Class of Workers - State government workers (%)
Class of Workers - Federal government workers (%)
Class of Workers - Self-employed workers in own not incorporated business and Unpaid family workers (%)
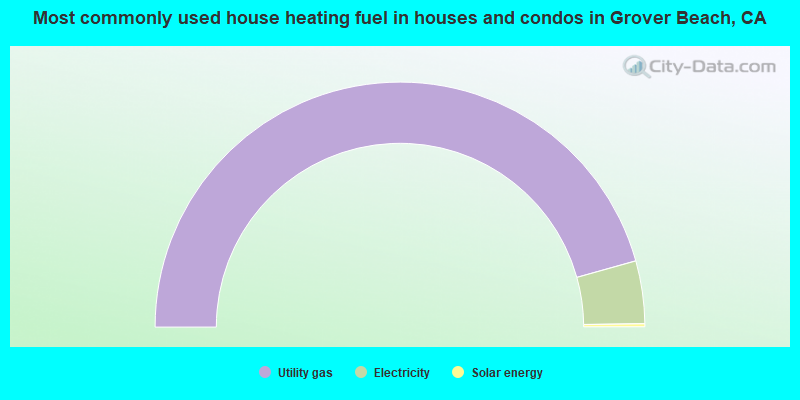
House heating fuel used in houses and condos - Utility gas (%)
House heating fuel used in houses and condos - Bottled, tank, or LP gas (%)
House heating fuel used in houses and condos - Electricity (%)
House heating fuel used in houses and condos - Fuel oil, kerosene, etc. (%)
House heating fuel used in houses and condos - Coal or coke (%)
House heating fuel used in houses and condos - Wood (%)
House heating fuel used in houses and condos - Solar energy (%)
House heating fuel used in houses and condos - Other fuel (%)
House heating fuel used in houses and condos - No fuel used (%)
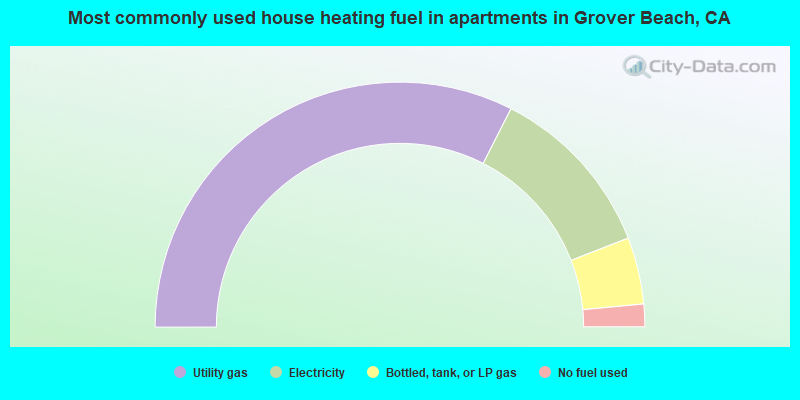
House heating fuel used in apartments - Utility gas (%)
House heating fuel used in apartments - Bottled, tank, or LP gas (%)
House heating fuel used in apartments - Electricity (%)
House heating fuel used in apartments - Fuel oil, kerosene, etc. (%)
House heating fuel used in apartments - Coal or coke (%)
House heating fuel used in apartments - Wood (%)
House heating fuel used in apartments - Solar energy (%)
House heating fuel used in apartments - Other fuel (%)
House heating fuel used in apartments - No fuel used (%)
Armed forces status - In Armed Forces (%)
Armed forces status - Civilian (%)
Armed forces status - Civilian - Veteran (%)
Armed forces status - Civilian - Nonveteran (%)
Fatal accidents locations in years 2005-2021
Fatal accidents locations in 2005
Fatal accidents locations in 2006
Fatal accidents locations in 2007
Fatal accidents locations in 2008
Fatal accidents locations in 2009
Fatal accidents locations in 2010
Fatal accidents locations in 2011
Fatal accidents locations in 2012
Fatal accidents locations in 2013
Fatal accidents locations in 2014
Fatal accidents locations in 2015
Fatal accidents locations in 2016
Fatal accidents locations in 2017
Fatal accidents locations in 2018
Fatal accidents locations in 2019
Fatal accidents locations in 2020
Fatal accidents locations in 2021
Alcohol use - People drinking some alcohol every month (%)
Alcohol use - People not drinking at all (%)
Alcohol use - Average days/month drinking alcohol
Alcohol use - Average drinks/week
Alcohol use - Average days/year people drink much
Audiometry - Average condition of hearing (%)
Audiometry - People that can hear a whisper from across a quiet room (%)
Audiometry - People that can hear normal voice from across a quiet room (%)
Audiometry - Ears ringing, roaring, buzzing (%)
Audiometry - Had a job exposure to loud noise (%)
Audiometry - Had off-work exposure to loud noise (%)
Blood Pressure & Cholesterol - Has high blood pressure (%)
Blood Pressure & Cholesterol - Checking blood pressure at home (%)
Blood Pressure & Cholesterol - Frequently checking blood cholesterol (%)
Blood Pressure & Cholesterol - Has high cholesterol level (%)
Consumer Behavior - Money monthly spent on food at supermarket/grocery store
Consumer Behavior - Money monthly spent on food at other stores
Consumer Behavior - Money monthly spent on eating out
Consumer Behavior - Money monthly spent on carryout/delivered foods
Consumer Behavior - Income spent on food at supermarket/grocery store (%)
Consumer Behavior - Income spent on food at other stores (%)
Consumer Behavior - Income spent on eating out (%)
Consumer Behavior - Income spent on carryout/delivered foods (%)
Current Health Status - General health condition (%)
Current Health Status - Blood donors (%)
Current Health Status - Has blood ever tested for HIV virus (%)
Current Health Status - Left-handed people (%)
Dermatology - People using sunscreen (%)
Diabetes - Diabetics (%)
Diabetes - Had a blood test for high blood sugar (%)
Diabetes - People taking insulin (%)
Diet Behavior & Nutrition - Diet health (%)
Diet Behavior & Nutrition - Milk product consumption (# of products/month)
Diet Behavior & Nutrition - Meals not home prepared (#/week)
Diet Behavior & Nutrition - Meals from fast food or pizza place (#/week)
Diet Behavior & Nutrition - Ready-to-eat foods (#/month)
Diet Behavior & Nutrition - Frozen meals/pizza (#/month)
Drug Use - People that ever used marijuana or hashish (%)
Drug Use - Ever used hard drugs (%)
Drug Use - Ever used any form of cocaine (%)
Drug Use - Ever used heroin (%)
Drug Use - Ever used methamphetamine (%)
Health Insurance - People covered by health insurance (%)
Kidney Conditions-Urology - Avg. # of times urinating at night
Medical Conditions - People with asthma (%)
Medical Conditions - People with anemia (%)
Medical Conditions - People with psoriasis (%)
Medical Conditions - People with overweight (%)
Medical Conditions - Elderly people having difficulties in thinking or remembering (%)
Medical Conditions - People who ever received blood transfusion (%)
Medical Conditions - People having trouble seeing even with glass/contacts (%)
Medical Conditions - People with arthritis (%)
Medical Conditions - People with gout (%)
Medical Conditions - People with congestive heart failure (%)
Medical Conditions - People with coronary heart disease (%)
Medical Conditions - People with angina pectoris (%)
Medical Conditions - People who ever had heart attack (%)
Medical Conditions - People who ever had stroke (%)
Medical Conditions - People with emphysema (%)
Medical Conditions - People with thyroid problem (%)
Medical Conditions - People with chronic bronchitis (%)
Medical Conditions - People with any liver condition (%)
Medical Conditions - People who ever had cancer or malignancy (%)
Mental Health - People who have little interest in doing things (%)
Mental Health - People feeling down, depressed, or hopeless (%)
Mental Health - People who have trouble sleeping or sleeping too much (%)
Mental Health - People feeling tired or having little energy (%)
Mental Health - People with poor appetite or overeating (%)
Mental Health - People feeling bad about themself (%)
Mental Health - People who have trouble concentrating on things (%)
Mental Health - People moving or speaking slowly or too fast (%)
Mental Health - People having thoughts they would be better off dead (%)
Oral Health - Average years since last visit a dentist
Oral Health - People embarrassed because of mouth (%)
Oral Health - People with gum disease (%)
Oral Health - General health of teeth and gums (%)
Oral Health - Average days a week using dental floss/device
Oral Health - Average days a week using mouthwash for dental problem
Oral Health - Average number of teeth
Pesticide Use - Households using pesticides to control insects (%)
Pesticide Use - Households using pesticides to kill weeds (%)
Physical Activity - People doing vigorous-intensity work activities (%)
Physical Activity - People doing moderate-intensity work activities (%)
Physical Activity - People walking or bicycling (%)
Physical Activity - People doing vigorous-intensity recreational activities (%)
Physical Activity - People doing moderate-intensity recreational activities (%)
Physical Activity - Average hours a day doing sedentary activities
Physical Activity - Average hours a day watching TV or videos
Physical Activity - Average hours a day using computer
Physical Functioning - People having limitations keeping them from working (%)
Physical Functioning - People limited in amount of work they can do (%)
Physical Functioning - People that need special equipment to walk (%)
Physical Functioning - People experiencing confusion/memory problems (%)
Physical Functioning - People requiring special healthcare equipment (%)
Prescription Medications - Average number of prescription medicines taking
Preventive Aspirin Use - Adults 40+ taking low-dose aspirin (%)
Reproductive Health - Vaginal deliveries (%)
Reproductive Health - Cesarean deliveries (%)
Reproductive Health - Deliveries resulted in a live birth (%)
Reproductive Health - Pregnancies resulted in a delivery (%)
Reproductive Health - Women breastfeeding newborns (%)
Reproductive Health - Women that had a hysterectomy (%)
Reproductive Health - Women that had both ovaries removed (%)
Reproductive Health - Women that have ever taken birth control pills (%)
Reproductive Health - Women taking birth control pills (%)
Reproductive Health - Women that have ever used Depo-Provera or injectables (%)
Reproductive Health - Women that have ever used female hormones (%)
Sexual Behavior - People 18+ that ever had sex (vaginal, anal, or oral) (%)
Sexual Behavior - Males 18+ that ever had vaginal sex with a woman (%)
Sexual Behavior - Males 18+ that ever performed oral sex on a woman (%)
Sexual Behavior - Males 18+ that ever had anal sex with a woman (%)
Sexual Behavior - Males 18+ that ever had any sex with a man (%)
Sexual Behavior - Females 18+ that ever had vaginal sex with a man (%)
Sexual Behavior - Females 18+ that ever performed oral sex on a man (%)
Sexual Behavior - Females 18+ that ever had anal sex with a man (%)
Sexual Behavior - Females 18+ that ever had any kind of sex with a woman (%)
Sexual Behavior - Average age people first had sex
Sexual Behavior - Average number of female sex partners in lifetime (males 18+)
Sexual Behavior - Average number of female vaginal sex partners in lifetime (males 18+)
Sexual Behavior - Average age people first performed oral sex on a woman (18+)
Sexual Behavior - Average number of woman performed oral sex on in lifetime (18+)
Sexual Behavior - Average number of male sex partners in lifetime (males 18+)
Sexual Behavior - Average number of male anal sex partners in lifetime (males 18+)
Sexual Behavior - Average age people first performed oral sex on a man (18+)
Sexual Behavior - Average number of male oral sex partners in lifetime (18+)
Sexual Behavior - People using protection when performing oral sex (%)
Sexual Behavior - Average number of times people have vaginal or anal sex a year
Sexual Behavior - People having sex without condom (%)
Sexual Behavior - Average number of male sex partners in lifetime (females 18+)
Sexual Behavior - Average number of male vaginal sex partners in lifetime (females 18+)
Sexual Behavior - Average number of female sex partners in lifetime (females 18+)
Sexual Behavior - Circumcised males 18+ (%)
Sleep Disorders - Average hours sleeping at night
Sleep Disorders - People that has trouble sleeping (%)
Smoking-Cigarette Use - People smoking cigarettes (%)
Taste & Smell - People 40+ having problems with smell (%)
Taste & Smell - People 40+ having problems with taste (%)
Taste & Smell - People 40+ that ever had wisdom teeth removed (%)
Taste & Smell - People 40+ that ever had tonsils teeth removed (%)
Taste & Smell - People 40+ that ever had a loss of consciousness because of a head injury (%)
Taste & Smell - People 40+ that ever had a broken nose or other serious injury to face or skull (%)
Taste & Smell - People 40+ that ever had two or more sinus infections (%)
Weight - Average height (inches)
Weight - Average weight (pounds)
Weight - Average BMI
Weight - People that are obese (%)
Weight - People that ever were obese (%)
Weight - People trying to lose weight (%)
7,455 58.4% White alone 4,325 33.9% Hispanic 427 3.3% Two or more races 302 2.4% Asian alone 155 1.2% Black alone 81 0.6% Native Hawaiian and Other 22 0.2% Other race alone 13 0.1% American Indian alone
Officers per 1,000 residents here:
1.57California average:
2.30
Latest news from Grover Beach, CA collected exclusively by city-data.com from local newspapers, TV, and radio stations
Ancestries: German (6.4%), American (5.3%), English (5.0%), Irish (3.4%), Italian (3.0%), European (2.8%).
Current Local Time:
Land area: 2.32 square miles.
Population density: 5,444 people per square mile (average).
1,319 residents are foreign born (7.5% Latin America , 1.2% Asia ).
This city:
10.3%California:
26.5%
Median real estate property taxes paid for housing units with mortgages in 2022: $4,333 (0.6%)Median real estate property taxes paid for housing units with no mortgage in 2022: $3,529 (0.6%)
Nearest city with pop. 50,000+: Santa Maria, CA
Nearest city with pop. 200,000+: Bakersfield, CA
Nearest city with pop. 1,000,000+: Los Angeles, CA
Nearest cities:
Edna, CA (2.4 miles),
Latitude: 35.12 N, Longitude: 120.62 W
Daytime population change due to commuting: -1,875 (-14.7%)Workers who live and work in this city: 1,535 (23.4%)
Area code commonly used in this area: 805
Single-family new house construction building permits:
2022: 10 buildings , average cost: $230,1002021: 20 buildings , average cost: $241,2002020: 9 buildings , average cost: $220,3002019: 31 buildings , average cost: $223,0002018: 14 buildings , average cost: $203,4002017: 11 buildings , average cost: $241,5002016: 24 buildings , average cost: $208,1002015: 28 buildings , average cost: $230,5002014: 13 buildings , average cost: $214,6002013: 6 buildings , average cost: $179,4002012: 2 buildings , average cost: $162,7002011: 2 buildings , average cost: $402,5002010: 6 buildings , average cost: $205,7002009: 10 buildings , average cost: $141,2002008: 17 buildings , average cost: $174,2002007: 36 buildings , average cost: $158,5002006: 54 buildings , average cost: $158,5002005: 42 buildings , average cost: $162,9002004: 31 buildings , average cost: $217,7002003: 94 buildings , average cost: $173,7002002: 68 buildings , average cost: $168,7002001: 10 buildings , average cost: $182,5002000: 30 buildings , average cost: $167,1001999: 33 buildings , average cost: $157,1001998: 98 buildings , average cost: $144,3001997: 75 buildings , average cost: $142,400Unemployment in December 2023: Population change in the 1990s: +1,415 (+12.1%).
Most common occupations in Grover Beach, CA (%)
Both Males Females
Other management occupations, except farmers and farm managers (5.9%)
Building and grounds cleaning and maintenance occupations (4.4%)
Other office and administrative support workers, including supervisors (3.9%)
Retail sales workers, except cashiers (3.3%)
Electrical equipment mechanics and other installation, maintenance, and repair workers, including supervisors (3.2%)
Waiters and waitresses (3.2%)
Other sales and related occupations, including supervisors (3.1%)
Other management occupations, except farmers and farm managers (7.1%)
Electrical equipment mechanics and other installation, maintenance, and repair workers, including supervisors (5.3%)
Building and grounds cleaning and maintenance occupations (4.5%)
Driver/sales workers and truck drivers (4.5%)
Cooks and food preparation workers (3.7%)
Vehicle and mobile equipment mechanics, installers, and repairers (3.6%)
Construction traders workers except carpenters, electricians, painters, plumbers, and construction laborers (3.3%)
Other office and administrative support workers, including supervisors (7.5%)
Information and record clerks, except customer service representatives (5.9%)
Waiters and waitresses (5.7%)
Other management occupations, except farmers and farm managers (4.7%)
Secretaries and administrative assistants (4.6%)
Preschool, kindergarten, elementary, and middle school teachers (4.3%)
Building and grounds cleaning and maintenance occupations (4.3%)
Earthquake activity:
Grover Beach-area historical earthquake activity is significantly above California state average. It is 6696% greater than the overall U.S. average. On 11/4/1927 at 13:51:53, a magnitude 7.5 (7.5 UK, Class: Major, Intensity: VIII - XII) earthquake occurred 27.3 miles away from the city center On 7/21/1952 at 11:52:14, a magnitude 7.7 (7.7 UK) earthquake occurred 92.1 miles away from the city center, causing $50,000,000 total damage On 4/18/1906 at 13:12:21, a magnitude 7.9 (7.9 UK) earthquake occurred 239.0 miles away from Grover Beach center, causing $524,000,000 total damage On 6/28/1992 at 11:57:34, a magnitude 7.6 (6.2 MB, 7.6 MS, 7.3 MW, Depth: 0.7 mi) earthquake occurred 241.4 miles away from the city center, causing 3 deaths ( 1 shaking deaths, 2 other deaths) and 400 injuries, causing $100,000,000 total damage and $40,000,000 insured lossesOn 10/18/1989 at 00:04:15, a magnitude 7.1 (6.5 MB, 7.1 MS, 6.9 MW, 7.0 ML) earthquake occurred 151.9 miles away from the city center, causing 62 deaths ( 62 shaking deaths) and 3757 injuries, causing $1,305,032,704 total damage On 12/22/2003 at 19:15:56, a magnitude 6.6 (6.1 MB, 6.4 MS, 6.6 MW, 6.4 MW, Class: Strong, Intensity: VII - IX) earthquake occurred 42.9 miles away from the city center, causing 2 deaths ( 2 shaking deaths) and 40 injuries, causing $200,000,000 total damage Magnitude types: body-wave magnitude (MB), local magnitude (ML), surface-wave magnitude (MS), moment magnitude (MW) Natural disasters: The number of natural disasters in San Luis Obispo County (20) is greater than the US average (15).Major Disasters (Presidential) Declared: 14Emergencies Declared: 2Floods: 14, Storms: 7, Winter Storms: 7, Mudslides: 5, Landslides: 3, Drought: 1, Earthquake: 1, Fire: 1, Freeze: 1, Hurricane: 1, Tornado: 1, Other: 1 (Note: some incidents may be assigned to more than one category). Hospitals and medical centers in Grover Beach: BRIGHTON AVENUE HOME (1757 BRIGHTON AVE) Other hospitals and medical centers near Grover Beach: PISMO BEACH DIALYSIS (Dialysis Facility, about 2 miles away; PISMO BEACH, CA)
ARROYO GRANDE CARE CENTER (Nursing Home, about 2 miles away; ARROYO GRANDE, CA)
MARIAN REGIONAL MEDICAL CENTER, ARROYO GRANDE (about 2 miles away; ARROYO GRANDE, CA)
PIKE, THE (Hospital, about 2 miles away; ARROYO GRANDE, CA)
TAYLOR COMMUNITY HOME (Hospital, about 2 miles away; ARROYO GRANDE, CA)
CHUPARROSA STREET HOME (Hospital, about 10 miles away; SAN LUIS OBISPO, CA)
CENTRAL COAST HOME HEALTH INC (Home Health Center, about 10 miles away; SAN LUIS OBISPO, CA)
Amtrak station: GROVER BEACH (180 GRAND AVE.)
.
Services: fully wheelchair accessible, enclosed waiting area, public payphones, free short-term parking, free long-term parking, call for car rental service, call for taxi service.
Operable nuclear power plants near Grover Beach:
8 miles: Diablo Canyon 1 and 2 in Avila Beach, CA.
Colleges/universities with over 2000 students nearest to Grover Beach:
California Polytechnic State University-San Luis Obispo (about 13 miles; San Luis Obispo, CA ; Full-time enrollment: 17,345)
Cuesta College (about 17 miles; San Luis Obispo, CA ; FT enrollment: 6,518)
Allan Hancock College (about 17 miles; Santa Maria, CA ; FT enrollment: 6,639)
University of California-Santa Barbara (about 66 miles; Santa Barbara, CA ; FT enrollment: 22,806)
Taft College (about 66 miles; Taft, CA ; FT enrollment: 2,121)
Santa Barbara City College (about 72 miles; Santa Barbara, CA ; FT enrollment: 12,568)
California State University-Bakersfield (about 88 miles; Bakersfield, CA ; FT enrollment: 7,564)
Public elementary/middle schools in Grover Beach:
See full list of schools located in Grover Beach User-submitted facts and corrections:
Elementry Schools In Grover Beach Grover Heights Elementry k thru 6 located on Richie Road . 805-474-3700 added by A1doll
Notable locations in Grover Beach: (A) , Le Sage Riviera Golf Course (B) , Grover Beach City Hall (C) , Grover Beach Chamber of Commerce (D) , Grover Beach Fire Department (E) . Display/hide their locations on the map
Shopping Center: (1) . Display/hide its location on the map
Churches in Grover Beach include: (A) , Central Coast Baptist Church (B) , Church of Christ (C) , Grover Beach Assembly of God Church (D) , Kingdom Hall of Jehovahs Witnesses (E) , Landmark Missionary Baptist Church (F) , Mount Zion Baptist Church (G) , Pentecostal Church of God (H) , Saint Johns Lutheran Church (I) . Display/hide their locations on the map
Parks in Grover Beach include: (1) , Grover Heights Park (2) , Mentone Drainage Basin Park (3) , Ramona Gardens Park (4) , Sixteenth Street Park (5) . Display/hide their locations on the map
Tourist attraction:
Hotel:
Courts:
San Luis Obispo County has a predicted average indoor radon screening level between 2 and 4 pCi/L (pico curies per liter) - Moderate Potential Average household size: This city:
2.5 peopleCalifornia:
2.9 people
Percentage of family households: This city:
63.5%Whole state:
68.7%
Percentage of households with unmarried partners: This city:
9.4%Whole state:
7.2%
Likely homosexual households (counted as self-reported same-sex unmarried-partner households)
Lesbian couples: 0.6% of all households Gay men: 0.4% of all households
People in group quarters in Grover Beach in 2010:
166 people in other noninstitutional facilities
11 people in group homes intended for adults
8 people in workers' group living quarters and job corps centers
4 people in nursing facilities/skilled-nursing facilities
People in group quarters in Grover Beach in 2000:
106 people in other noninstitutional group quarters
18 people in homes for the mentally retarded
2 people in nursing homes
Banks with branches in Grover Beach (2011 data):
JPMorgan Chase Bank, National Association: South Oak Park Blvd & West Grand Ave at 1758 West Grand Avenue, branch established on 2011/10/18. Info updated 2011/11/10: Bank assets: $1,811,678.0 mil, Deposits: $1,190,738.0 mil, headquarters in Columbus, OH, positive income , International Specialization, 5577 total offices , Holding Company: Jpmorgan Chase & Co.
Wells Fargo Bank, National Association: Grover Beach Branch at 1580 W Grand Avenue, branch established on 2000/12/04. Info updated 2011/04/05: Bank assets: $1,161,490.0 mil, Deposits: $905,653.0 mil, headquarters in Sioux Falls, SD, positive income , 6395 total offices , Holding Company: Wells Fargo & Company
Rabobank, National Association: Grover Beach Branch at 899 Grand Avenue, branch established on 1964/01/02. Info updated 2011/01/27: Bank assets: $11,745.0 mil, Deposits: $8,446.0 mil, headquarters in Roseville, CA, positive income , Agricultural Specialization, 124 total offices , Holding Company: Cooperatieve Centrale Raiffeisen-Boerenleenbank B.A., "rabobank Nederland
For population 15 years and over in Grover Beach:
Never married: 33.0%Now married: 44.3%Separated: 1.0%Widowed: 5.6%Divorced: 16.1% For population 25 years and over in Grover Beach:
High school or higher: 86.1%Bachelor's degree or higher: 30.9%Graduate or professional degree: 11.9%Unemployed: 5.6%Mean travel time to work (commute): 16.3 minutes
Education Gini index (Inequality in education) Here:
16.5California average:
15.5
Religion statistics for Grover Beach, CA (based on San Luis Obispo County data)
Religion Adherents Congregations Catholic 89,075 17 Evangelical Protestant 27,483 138 Mainline Protestant 16,099 56 Other 11,530 47 Black Protestant 1,078 3 Orthodox 205 2 None 124,167 -
Source: Clifford Grammich, Kirk Hadaway, Richard Houseal, Dale E.Jones, Alexei Krindatch, Richie Stanley and Richard H.Taylor. 2012. 2010 U.S.Religion Census: Religious Congregations & Membership Study. Association of Statisticians of American Religious Bodies. Jones, Dale E., et al. 2002. Congregations and Membership in the United States 2000. Nashville, TN: Glenmary Research Center. Graphs represent county-level data
Food Environment Statistics: Number of grocery stores : 60San Luis Obispo County :
2.29 / 10,000 pop.California :
2.14 / 10,000 pop.
Number of supercenters and club stores : 1Here :
0.04 / 10,000 pop.State :
0.04 / 10,000 pop.
Number of convenience stores (no gas) : 18San Luis Obispo County :
0.69 / 10,000 pop.California :
0.62 / 10,000 pop.
Number of convenience stores (with gas) : 58Here :
2.22 / 10,000 pop.State :
1.49 / 10,000 pop.
Number of full-service restaurants : 288San Luis Obispo County :
11.00 / 10,000 pop.California :
7.42 / 10,000 pop.
Adult diabetes rate : This county :
6.1%California :
7.3%
Adult obesity rate : This county :
21.5%California :
21.3%
Low-income preschool obesity rate : This county :
14.5%California :
17.9%
Health and Nutrition: Healthy diet rate : Grover Beach:
49.8%California:
49.4%
Average overall health of teeth and gums : Grover Beach:
48.4%State:
48.0%
Average BMI : Grover Beach:
28.4State:
28.1
People feeling badly about themselves : This city:
20.0%California:
20.2%
People not drinking alcohol at all : This city:
10.2%California:
11.2%
Average hours sleeping at night : This city:
6.8California:
6.8
Overweight people : This city:
33.8%California:
31.5%
General health condition : Grover Beach:
57.4%State:
56.4%
Average condition of hearing : This city:
80.4%State:
80.9%
More about Health and Nutrition of Grover Beach, CA Residents
Local government employment and payroll (March 2022)
Function
Full-time employees
Monthly full-time payroll
Average yearly full-time wage
Part-time employees
Monthly part-time payroll
Police Protection - Officers
21 $215,176 $122,958 0 $0 Streets and Highways
12 $85,984 $85,984 0 $0 Financial Administration
8 $58,191 $87,287 0 $0 Police - Other
7 $39,875 $68,357 0 $0 Other Government Administration
5 $39,255 $94,212 0 $0 Other and Unallocable
3 $19,602 $78,408 0 $0 Parks and Recreation
2 $14,973 $89,838 1 $869 Natural Resources
1 $5,122 $61,464 0 $0
Totals for Government
59 $478,178 $97,257 1 $869
Grover Beach government finances - Expenditure in 2017 (per resident):
Construction - Regular Highways: $378,000 ($29.95)
Housing and Community Development: $263,000 ($20.84)Police Protection: $139,000 ($11.02)Current Operations - Police Protection: $3,936,000 ($311.91)
Water Utilities: $2,707,000 ($214.52)Sewerage: $2,485,000 ($196.93)Central Staff Services: $2,023,000 ($160.31)Regular Highways: $1,858,000 ($147.24)Local Fire Protection: $1,401,000 ($111.02)Housing and Community Development: $487,000 ($38.59)Parks and Recreation: $439,000 ($34.79)Protective Inspection and Regulation - Other: $381,000 ($30.19)Financial Administration: $355,000 ($28.13)General - Interest on Debt: $451,000 ($35.74)
Intergovernmental to Local - Other - Water Utilities: $1,127,000 ($89.31)
Other Capital Outlay - Local Fire Protection: $60,000 ($4.75)
Housing and Community Development: $14,000 ($1.11)
Grover Beach government finances - Revenue in 2017 (per resident):
Charges - Sewerage: $2,598,000 ($205.88)
Regular Highways: $661,000 ($52.38)Other: $558,000 ($44.22)Parks and Recreation: $144,000 ($11.41)Federal Intergovernmental - Housing and Community Development: $1,029,000 ($81.54)
Other: $419,000 ($33.20)Local Intergovernmental - Other: $16,000 ($1.27)
Miscellaneous - Interest Earnings: $351,000 ($27.82)
Rents: $212,000 ($16.80)Fines and Forfeits: $100,000 ($7.92)Revenue - Water Utilities: $2,892,000 ($229.18)
State Intergovernmental - Other: $1,222,000 ($96.84)
Highways: $270,000 ($21.40)General Local Government Support: $16,000 ($1.27)Tax - Property: $3,937,000 ($311.99)
General Sales and Gross Receipts: $2,517,000 ($199.46)Public Utilities Sales: $706,000 ($55.95)Other Selective Sales: $369,000 ($29.24)Other License: $166,000 ($13.15)Other: $139,000 ($11.02)Occupation and Business License - Other: $93,000 ($7.37)Documentary and Stock Transfer: $82,000 ($6.50)
Grover Beach government finances - Debt in 2017 (per resident):
Long Term Debt - Beginning Outstanding - Unspecified Public Purpose: $13,255,000 ($1050.40)
Outstanding Unspecified Public Purpose: $13,122,000 ($1039.86)Retired Unspecified Public Purpose: $133,000 ($10.54)
Grover Beach government finances - Cash and Securities in 2017 (per resident):
Bond Funds - Cash and Securities: $7,878,000 ($624.30)
Other Funds - Cash and Securities: $11,572,000 ($917.03)
Sinking Funds - Cash and Securities: $654,000 ($51.83)
6.17% of this county's 2020 resident taxpayers moved to other counties in 2021 ($68,140 average adjusted gross income )
Here:
6.17%California average:
6.14%
0.02% of residents moved to foreign countries ($212 average AGI )San Luis Obispo County:
0.02%California average:
0.02%
Top counties to which taxpayers relocated from this county between 2020 and 2021:
Businesses in Grover Beach, CA
Name Count Name Count
7-Eleven 1 Papa John's Pizza 1 Ace Hardware 1 RadioShack 1 AutoZone 1 Safeway 1 Burger King 1 Starbucks 1 FedEx 2 T-Mobile 1 H&R Block 1 Taco Bell 1 Holiday Inn 1 U-Haul 1 Jamba Juice 1 Vons 1 MasterBrand Cabinets 5
Strongest AM radio stations in Grover Beach:
KXTK (1280 AM; 10 kW; ARROYO GRANDE, CA; Owner: PAMPLIN BROADCASTING, INC.)
KLFF (890 AM; 5 kW; ARROYO GRANDE, CA; Owner: JERRY J. COLLINS)
KGDP (660 AM; 50 kW; ORCUTT, CA; Owner: RADIO REPRESENTATIVES, INC.)
KUHL (1440 AM; 5 kW; SANTA MARIA, CA; Owner: MAPLETON COMMUNICATIONS, LLC)
KJDJ (1030 AM; 2 kW; SAN LUIS OBISPO, CA; Owner: PADRE SERRA COMMUNICATIONS, INC)
KYNS (1340 AM; 1 kW; SAN LUIS OBISPO, CA; Owner: MAPLETON COMMUNICATIONS, LLC)
KKJL (1400 AM; 1 kW; SAN LUIS OBISPO, CA; Owner: SAN LUIS OBISPO BROADCASTING, INC)
KERI (1180 AM; 50 kW; WASCO-GREENACRES, CA; Owner: KWSO, INC.)
KVEC (920 AM; 1 kW; SAN LUIS OBISPO, CA; Owner: CLEVELAND RADIO LICENSES, LLC)
KMJ (580 AM; 50 kW; FRESNO, CA; Owner: INFINITY RADIO OPERATIONS INC.)
KSMA (1240 AM; 1 kW; SANTA MARIA, CA; Owner: CLEAR CHANNEL BROADCASTING LICENSES, INC.)
KWRU (940 AM; 50 kW; FRESNO, CA)
KSBQ (1480 AM; 1 kW; SANTA MARIA, CA; Owner: LAZER BROADCASTING CORP.)
Strongest FM radio stations in Grover Beach:
K244DE (96.7 FM; ARROYO GRANDE, ETC., CA; Owner: CALVARY CHAPEL OF TWIN FALLS, INC.)
KXTZ (95.3 FM; PISMO BEACH, CA; Owner: MAPLETON COMMUNICATIONS, LLC)
KURQ (107.3 FM; GROVER BEACH, CA; Owner: CLEAR CHANNEL BROADCASTING LICENSES, INC.)
KSTT-FM (101.3 FM; LOS OSOS-BAYWOOD PAR, CA; Owner: CLEAR CHANNEL BROADCASTING LICENSES, INC.)
KSLY-FM (96.1 FM; SAN LUIS OBISPO, CA; Owner: CLEAR CHANNEL BROADCASTING LICENSES, INC.)
KKAL (99.7 FM; MORRO BAY, CA; Owner: SALISBURY BROADCASTING CORP.)
KZOZ (93.3 FM; SAN LUIS OBISPO, CA; Owner: AMERICAN GENERAL MEDIA-TEXAS, INC.)
KWSR (92.5 FM; PASO ROBLES, CA; Owner: LAGNIAPPE BROADCASTING, INC)
KKJG (98.1 FM; SAN LUIS OBISPO, CA; Owner: AGM SAN LUIS OBISPO, L.P.)
KIDI-FM (105.5 FM; GUADALUPE, CA; Owner: EMERALD WAVE MEDIA)
KWWV (106.1 FM; SANTA MARGARITA, CA; Owner: SALISBURY RADIO LLC)
K209CE (89.7 FM; SAN LUIS OBISPO, CA; Owner: FAMILY STATIONS, INC.)
KLRM (97.1 FM; SAN LUIS OBISPO, CA; Owner: GTM SAN LUIS OBISPO)
KIQO (104.5 FM; ATASCADERO, CA; Owner: AMERICAN GENERAL MEDIA OF TEXAS, INC)
KCBX (90.1 FM; SAN LUIS OBISPO, CA; Owner: KCBX, INC.)
KLVH (88.5 FM; SAN LUIS OBISPO, CA; Owner: EDUCATIONAL MEDIA FOUNDATION)
K213CO (90.5 FM; SAN LUIS OBISPO, CA; Owner: PENSACOLA CHRISTIAN COLLEGE, INC.)
KXFM (99.1 FM; SANTA MARIA, CA; Owner: CLEAR CHANNEL BROADCASTING LICENSES, INC.)
KLMM (94.1 FM; MORRO BAY, CA; Owner: LAZER BROADCASTING CORPORATION)
KRAZ (105.9 FM; SANTA YNEZ, CA; Owner: KNIGHT BROADCASTING, INC.)
TV broadcast stations around Grover Beach:
KAGP-LP (Channel 8; ARROYO GRANDE, CA; Owner: GARY M. COCOLA FAMILY TRUST, GARY M. COCOLA TRUSTEE)
KSSY-LP (Channel 66; ARROYO GRANDE, CA; Owner: CHERIE ERWIN)
KSBY (Channel 6; SAN LUIS OBISPO, CA; Owner: NVG-SANTA BARBARA II, LLC)
KPXA-LP (Channel 42; SAN LUIS OBISPO, CA; Owner: CAMINO REAL COMMUNICATIONS LLC)
K28FK (Channel 28; SAN LUIS OBISPO, CA; Owner: ENTRAVISION HOLDINGS, LLC)
KFUL-LP (Channel 44; SAN LUIS OBISPO, CA; Owner: KJLA, LLC)
KCCE-LP (Channel 50; SAN LUIS OBISPO, CA; Owner: ANET COMMUNICATIONS, INC.)
Grover Beach fatal accident list:
Jul 13, 2021 02:36 PM, N 4th St, Newport Ave, Lat: 35.125639, Lon: -120.626164, Vehicles: 2, Persons: 2, Fatalities: 1Lat: 35.123411, Lon: -120.608975, Vehicles: 1, Persons: 5, Pedestrians: 1, Fatalities: 1Lat: 35.124231, Lon: -120.626233, Vehicles: 1, Persons: 1, Pedestrians: 1, Fatalities: 1Lat: 35.121614, Lon: -120.622731, Vehicles: 1, Persons: 1, Pedestrians: 2, Fatalities: 1Lat: 35.118940, Lon: -120.621660, Vehicles: 1, Persons: 1, Fatalities: 1, Drunk persons involved: 1
FCC Registered Antenna Towers: 42 (
See the full list of FCC Registered Antenna Towers in Grover Beach )
FCC Registered Broadcast Land Mobile Towers: 3
1550 Grand Ave (Lat: 35.118611 Lon: -120.589722), Call Sign: WPVS422, Assigned Frequencies: 468.762 MHz, 468.837 MHz, 469.137 MHz, 469.462 MHz, 469.637 MHz, 457.512 MHz, 457.537 MHz, 457.562 MHz, 457.587 MHz, 457.612 MHz, Grant Date: 08/09/2002, Expiration Date: 08/09/2012, Cancellation Date: 10/13/2012, Certifier: Keith Handley, Registrant: Hm Electronics, Inc., 6675 Mesa Ridge Rd, San Diego, CA 92121, Phone: (858) 535-6015, Fax: (858) 452-7207, Email:
Lat: 35.126639 Lon: -120.630722, Call Sign: WQBI378, Assigned Frequencies: 151.835 MHz, 153.500 MHz, 158.235 MHz, Grant Date: 10/07/2014, Expiration Date: 10/13/2024, Certifier: Bruce Rizzoli, Registrant: Business Radio Licensing, 30251 Golden Lantern Ste E #501, Laguna Niguel, CA 92677, Phone: (949) 348-8510, Fax: (949) 348-8514, Email:
Lat: 35.114000 Lon: -120.625222, Call Sign: WQNN565, Assigned Frequencies: 451.737 MHz, 456.737 MHz, Grant Date: 03/31/2011, Expiration Date: 03/31/2021, Cancellation Date: 06/05/2021, Certifier: Rob Gillespie, Registrant: Cara Enterprises Inc, Las Vegas, NV 89140-0124, Phone: (702) 838-9728, Fax: (702) 363-4607, Email:
FCC Registered Microwave Towers: 3
SF9031, 1081 Highland Way (Lat: 35.109111 Lon: -120.620000), Type: Building, Structure height: 7.9 m, Call Sign: WQLN575, Assigned Frequencies: 21885.0 MHz, Grant Date: 03/16/2010, Expiration Date: 03/16/2020, Cancellation Date: 09/28/2018, Certifier: Dan Menser, Registrant: T-Mobile License LLC, 12920 Se 38th Street, Bellevue, WA 98006, Phone: (425) 383-5178, Fax: (425) 383-4840, Email:
SV00522A, 1541 Hillcrest Drive (Lat: 35.126417 Lon: -120.607083), Type: Pole, Structure height: 18.9 m, Overall height: 20.4 m, Call Sign: WRXZ413, Assigned Frequencies: 23025.0 MHz, 23025.0 MHz, 23025.0 MHz, 23025.0 MHz, 23025.0 MHz, 23025.0 MHz, 23025.0 MHz, 23025.0 MHz, 23025.0 MHz, 23025.0 MHz... (+12 more), Grant Date: 07/13/2023, Expiration Date: 07/13/2033, Certifier: Jenny Knopf, Registrant: T-Mobile Usa, Inc., 12920 Se 38th Street, Bellevue, WA 98006, Phone: (425) 383-8401, Fax: (425) 383-4040, Email:
SV14228B, 202 S 3rd St (Lat: 35.120000 Lon: -120.627944), Type: Mtower, Structure height: 18.6 m, Overall height: 21.6 m, Call Sign: WRXZ416, Assigned Frequencies: 21825.0 MHz, 21825.0 MHz, 21825.0 MHz, 21825.0 MHz, 21825.0 MHz, 21825.0 MHz, 21825.0 MHz, 21825.0 MHz, 21825.0 MHz, 21825.0 MHz... (+12 more), Grant Date: 07/13/2023, Expiration Date: 07/13/2033, Certifier: Jenny Knopf, Registrant: T-Mobile Usa, Inc., 12920 Se 38th Street, Bellevue, WA 98006, Phone: (425) 383-8401, Fax: (425) 383-4040, Email:
FCC Registered Amateur Radio Licenses: 93 (
See the full list of FCC Registered Amateur Radio Licenses in Grover Beach )
FAA Registered Aircraft Manufacturers and Dealers: 1 (
See the full list of FAA Registered Manufacturers and Dealers in Grover Beach )
FAA Registered Aircraft: 16 (
See the full list of FAA Registered Aircraft )
Home Mortgage Disclosure Act Aggregated Statistics For Year 2009(Based on 2 full tracts) A) FHA, FSA/RHS & VA B) Conventional C) Refinancings D) Home Improvement Loans E) Loans on Dwellings For 5+ Families F) Non-occupant Loans on G) Loans On Manufactured Number Average Value Number Average Value Number Average Value Number Average Value Number Average Value Number Average Value Number Average Value
LOANS ORIGINATED 28 $313,861 80 $250,397 280 $256,003 16 $222,982 1 $459,870 91 $252,417 1 $105,510 APPLICATIONS APPROVED, NOT ACCEPTED 3 $275,393 11 $189,951 36 $260,252 2 $118,960 0 $0 15 $195,767 2 $145,330 APPLICATIONS DENIED 4 $256,828 9 $235,918 86 $288,736 3 $180,503 1 $348,390 27 $234,071 1 $179,170 APPLICATIONS WITHDRAWN 4 $302,618 9 $193,670 71 $293,055 4 $249,615 0 $0 11 $200,904 0 $0 FILES CLOSED FOR INCOMPLETENESS 0 $0 2 $189,645 11 $283,061 0 $0 0 $0 2 $226,475 0 $0
Aggregated Statistics For Year 2008(Based on 2 full tracts) A) FHA, FSA/RHS & VA B) Conventional C) Refinancings D) Home Improvement Loans E) Loans on Dwellings For 5+ Families F) Non-occupant Loans on G) Loans On Manufactured Number Average Value Number Average Value Number Average Value Number Average Value Number Average Value Number Average Value Number Average Value
LOANS ORIGINATED 8 $343,430 99 $308,139 152 $275,373 9 $161,376 4 $736,632 93 $288,080 1 $48,780 APPLICATIONS APPROVED, NOT ACCEPTED 2 $386,730 13 $293,502 28 $298,846 1 $27,870 0 $0 13 $246,407 0 $0 APPLICATIONS DENIED 3 $316,550 16 $298,389 98 $316,655 9 $163,921 1 $453,950 22 $278,449 1 $185,140 APPLICATIONS WITHDRAWN 7 $355,527 20 $258,526 46 $301,169 3 $123,440 1 $726,640 11 $306,425 2 $203,560 FILES CLOSED FOR INCOMPLETENESS 0 $0 3 $346,093 7 $323,236 1 $199,100 0 $0 4 $349,405 0 $0
Aggregated Statistics For Year 2007(Based on 2 full tracts) A) FHA, FSA/RHS & VA B) Conventional C) Refinancings D) Home Improvement Loans E) Loans on Dwellings For 5+ Families F) Non-occupant Loans on G) Loans On Manufactured Number Average Value Number Average Value Number Average Value Number Average Value Number Average Value Number Average Value Number Average Value
LOANS ORIGINATED 0 $0 121 $337,461 230 $294,708 22 $220,992 3 $829,583 96 $348,916 4 $243,128 APPLICATIONS APPROVED, NOT ACCEPTED 0 $0 32 $315,156 44 $316,331 6 $338,775 0 $0 13 $386,235 4 $142,352 APPLICATIONS DENIED 0 $0 37 $344,607 134 $369,908 18 $182,997 2 $539,010 30 $362,206 2 $143,845 APPLICATIONS WITHDRAWN 2 $321,545 19 $315,141 81 $325,074 9 $177,191 0 $0 16 $355,571 1 $20,900 FILES CLOSED FOR INCOMPLETENESS 0 $0 4 $366,058 22 $328,458 2 $248,875 0 $0 7 $350,960 0 $0
Aggregated Statistics For Year 2006(Based on 2 full tracts) A) FHA, FSA/RHS & VA B) Conventional C) Refinancings D) Home Improvement Loans E) Loans on Dwellings For 5+ Families F) Non-occupant Loans on G) Loans On Manufactured Number Average Value Number Average Value Number Average Value Number Average Value Number Average Value Number Average Value Number Average Value
LOANS ORIGINATED 0 $0 180 $310,717 315 $312,705 45 $230,189 8 $521,631 116 $310,768 3 $108,167 APPLICATIONS APPROVED, NOT ACCEPTED 0 $0 43 $307,021 82 $329,151 3 $266,120 2 $199,090 30 $354,208 2 $247,360 APPLICATIONS DENIED 0 $0 51 $288,294 141 $329,474 13 $287,756 2 $448,955 25 $326,428 4 $123,932 APPLICATIONS WITHDRAWN 1 $316,570 38 $340,711 102 $299,709 12 $124,013 0 $0 18 $314,173 2 $222,470 FILES CLOSED FOR INCOMPLETENESS 0 $0 10 $495,634 22 $327,640 3 $309,250 0 $0 5 $760,306 0 $0
Aggregated Statistics For Year 2005(Based on 2 full tracts) A) FHA, FSA/RHS & VA B) Conventional C) Refinancings D) Home Improvement Loans E) Loans on Dwellings For 5+ Families F) Non-occupant Loans on G) Loans On Manufactured Number Average Value Number Average Value Number Average Value Number Average Value Number Average Value Number Average Value Number Average Value
LOANS ORIGINATED 0 $0 308 $326,164 460 $299,342 49 $221,864 4 $937,190 188 $332,809 3 $149,310 APPLICATIONS APPROVED, NOT ACCEPTED 0 $0 39 $309,276 67 $265,148 5 $154,500 0 $0 24 $307,794 1 $159,280 APPLICATIONS DENIED 1 $353,400 83 $292,029 126 $336,977 26 $240,099 0 $0 45 $340,865 2 $206,555 APPLICATIONS WITHDRAWN 1 $348,420 58 $332,964 110 $318,823 23 $238,348 1 $622,190 26 $351,052 0 $0 FILES CLOSED FOR INCOMPLETENESS 0 $0 9 $301,073 53 $289,435 2 $395,690 0 $0 3 $216,333 0 $0
Aggregated Statistics For Year 2004(Based on 2 full tracts) A) FHA, FSA/RHS & VA B) Conventional C) Refinancings D) Home Improvement Loans E) Loans on Dwellings For 5+ Families F) Non-occupant Loans on G) Loans On Manufactured Number Average Value Number Average Value Number Average Value Number Average Value Number Average Value Number Average Value Number Average Value
LOANS ORIGINATED 1 $242,900 327 $280,724 448 $241,275 50 $172,313 4 $818,515 221 $261,978 6 $106,342 APPLICATIONS APPROVED, NOT ACCEPTED 1 $235,930 60 $243,190 73 $231,654 2 $22,895 0 $0 21 $245,354 3 $122,110 APPLICATIONS DENIED 0 $0 71 $260,229 138 $258,695 18 $123,600 0 $0 42 $306,475 3 $149,647 APPLICATIONS WITHDRAWN 0 $0 47 $259,516 151 $258,982 6 $140,028 1 $462,860 22 $282,251 0 $0 FILES CLOSED FOR INCOMPLETENESS 0 $0 16 $227,332 27 $269,026 1 $24,890 0 $0 8 $322,515 1 $179,170
Aggregated Statistics For Year 2003(Based on 2 full tracts) A) FHA, FSA/RHS & VA B) Conventional C) Refinancings D) Home Improvement Loans E) Loans on Dwellings For 5+ Families F) Non-occupant Loans on Number Average Value Number Average Value Number Average Value Number Average Value Number Average Value Number Average Value
LOANS ORIGINATED 4 $275,490 306 $250,104 981 $183,849 12 $96,477 4 $896,928 289 $200,372 APPLICATIONS APPROVED, NOT ACCEPTED 0 $0 51 $208,502 112 $194,593 2 $49,775 1 $585,300 29 $164,180 APPLICATIONS DENIED 1 $92,580 32 $217,783 126 $199,057 5 $31,656 1 $413,090 24 $209,125 APPLICATIONS WITHDRAWN 0 $0 35 $243,313 171 $202,188 3 $70,017 0 $0 20 $212,678 FILES CLOSED FOR INCOMPLETENESS 1 $92,580 8 $197,850 30 $203,737 1 $38,820 0 $0 7 $163,107
Aggregated Statistics For Year 2002(Based on 2 full tracts) A) FHA, FSA/RHS & VA B) Conventional C) Refinancings D) Home Improvement Loans E) Loans on Dwellings For 5+ Families F) Non-occupant Loans on Number Average Value Number Average Value Number Average Value Number Average Value Number Average Value Number Average Value
LOANS ORIGINATED 17 $226,024 267 $204,330 648 $172,693 20 $49,274 3 $264,460 203 $180,838 APPLICATIONS APPROVED, NOT ACCEPTED 0 $0 24 $258,117 94 $183,131 3 $40,813 0 $0 18 $166,631 APPLICATIONS DENIED 0 $0 30 $199,459 120 $165,386 11 $68,051 0 $0 22 $164,069 APPLICATIONS WITHDRAWN 2 $204,565 38 $189,375 119 $185,055 4 $66,198 0 $0 18 $205,232 FILES CLOSED FOR INCOMPLETENESS 1 $176,190 9 $242,669 30 $171,449 0 $0 0 $0 15 $161,198
Aggregated Statistics For Year 2001(Based on 2 full tracts) A) FHA, FSA/RHS & VA B) Conventional C) Refinancings D) Home Improvement Loans E) Loans on Dwellings For 5+ Families F) Non-occupant Loans on Number Average Value Number Average Value Number Average Value Number Average Value Number Average Value Number Average Value
LOANS ORIGINATED 29 $185,674 225 $178,483 613 $166,943 19 $48,357 2 $280,205 164 $165,008 APPLICATIONS APPROVED, NOT ACCEPTED 4 $170,475 27 $186,337 67 $151,249 3 $30,857 0 $0 17 $187,493 APPLICATIONS DENIED 1 $147,330 28 $146,046 94 $147,050 15 $30,261 0 $0 11 $142,078 APPLICATIONS WITHDRAWN 1 $66,700 32 $182,949 104 $157,272 7 $34,983 1 $258,800 10 $177,887 FILES CLOSED FOR INCOMPLETENESS 0 $0 6 $101,702 22 $175,790 1 $9,950 2 $821,285 4 $153,550
Aggregated Statistics For Year 2000(Based on 2 full tracts) A) FHA, FSA/RHS & VA B) Conventional C) Refinancings D) Home Improvement Loans E) Loans on Dwellings For 5+ Families F) Non-occupant Loans on Number Average Value Number Average Value Number Average Value Number Average Value Number Average Value Number Average Value
LOANS ORIGINATED 42 $165,034 251 $143,334 148 $121,049 16 $22,521 2 $480,825 90 $138,932 APPLICATIONS APPROVED, NOT ACCEPTED 1 $126,430 38 $131,742 33 $97,884 5 $25,484 0 $0 13 $128,106 APPLICATIONS DENIED 3 $156,287 50 $134,427 75 $121,419 14 $37,259 1 $244,870 16 $120,699 APPLICATIONS WITHDRAWN 2 $114,475 22 $144,931 40 $123,833 2 $40,315 0 $0 7 $148,181 FILES CLOSED FOR INCOMPLETENESS 1 $208,040 10 $122,140 13 $135,305 0 $0 0 $0 1 $175,190
Aggregated Statistics For Year 1999(Based on 1 full and 2 partial tracts) A) FHA, FSA/RHS & VA B) Conventional C) Refinancings D) Home Improvement Loans E) Loans on Dwellings For 5+ Families F) Non-occupant Loans on Number Average Value Number Average Value Number Average Value Number Average Value Number Average Value Number Average Value
LOANS ORIGINATED 42 $140,539 204 $127,640 203 $113,783 8 $26,899 1 $192,320 80 $120,232 APPLICATIONS APPROVED, NOT ACCEPTED 2 $140,215 15 $113,972 31 $123,668 9 $24,562 0 $0 8 $126,374 APPLICATIONS DENIED 4 $132,190 35 $116,278 80 $98,192 16 $31,143 2 $569,360 16 $135,089 APPLICATIONS WITHDRAWN 6 $103,512 29 $114,052 74 $123,454 1 $25,910 1 $558,270 17 $115,982 FILES CLOSED FOR INCOMPLETENESS 1 $99,530 6 $141,662 13 $149,055 0 $0 0 $0 4 $155,848
Detailed HMDA statistics for the following Tracts:
0120.00
, 0121.00
Private Mortgage Insurance Companies Aggregated Statistics For Year 2009(Based on 2 full tracts) A) Conventional B) Refinancings C) Non-occupant Loans on Number Average Value Number Average Value Number Average Value
LOANS ORIGINATED 7 $322,964 2 $238,905 2 $230,955 APPLICATIONS APPROVED, NOT ACCEPTED 2 $246,385 2 $436,485 0 $0 APPLICATIONS DENIED 2 $421,575 0 $0 0 $0 APPLICATIONS WITHDRAWN 0 $0 0 $0 0 $0 FILES CLOSED FOR INCOMPLETENESS 0 $0 0 $0 0 $0
Aggregated Statistics For Year 2008(Based on 2 full tracts) A) Conventional B) Refinancings C) Non-occupant Loans on Number Average Value Number Average Value Number Average Value
LOANS ORIGINATED 13 $312,041 8 $327,262 5 $338,072 APPLICATIONS APPROVED, NOT ACCEPTED 1 $340,460 2 $363,355 0 $0 APPLICATIONS DENIED 4 $300,382 1 $338,470 2 $361,845 APPLICATIONS WITHDRAWN 0 $0 2 $432,045 0 $0 FILES CLOSED FOR INCOMPLETENESS 0 $0 1 $385,220 0 $0
Aggregated Statistics For Year 2007(Based on 2 full tracts) A) Conventional B) Refinancings Number Average Value Number Average Value
LOANS ORIGINATED 1 $463,900 2 $451,440 APPLICATIONS APPROVED, NOT ACCEPTED 3 $421,747 2 $399,195 APPLICATIONS DENIED 0 $0 0 $0 APPLICATIONS WITHDRAWN 1 $373,310 2 $460,420 FILES CLOSED FOR INCOMPLETENESS 0 $0 0 $0
Aggregated Statistics For Year 2006(Based on 2 full tracts) A) Conventional B) Refinancings C) Non-occupant Loans on Number Average Value Number Average Value Number Average Value
LOANS ORIGINATED 4 $431,018 1 $647,070 1 $374,270 APPLICATIONS APPROVED, NOT ACCEPTED 0 $0 1 $398,200 0 $0 APPLICATIONS DENIED 0 $0 4 $434,535 0 $0 APPLICATIONS WITHDRAWN 0 $0 1 $434,040 0 $0 FILES CLOSED FOR INCOMPLETENESS 0 $0 0 $0 0 $0
Aggregated Statistics For Year 2005(Based on 2 full tracts) A) Conventional B) Refinancings C) Non-occupant Loans on Number Average Value Number Average Value Number Average Value
LOANS ORIGINATED 4 $377,035 5 $425,650 2 $348,405 APPLICATIONS APPROVED, NOT ACCEPTED 1 $451,910 1 $313,580 1 $451,910 APPLICATIONS DENIED 0 $0 0 $0 0 $0 APPLICATIONS WITHDRAWN 1 $349,420 0 $0 0 $0 FILES CLOSED FOR INCOMPLETENESS 0 $0 0 $0 0 $0
Aggregated Statistics For Year 2004(Based on 2 full tracts) A) Conventional B) Refinancings C) Non-occupant Loans on Number Average Value Number Average Value Number Average Value
LOANS ORIGINATED 12 $326,181 6 $295,975 4 $306,852 APPLICATIONS APPROVED, NOT ACCEPTED 0 $0 4 $304,872 0 $0 APPLICATIONS DENIED 0 $0 0 $0 0 $0 APPLICATIONS WITHDRAWN 1 $318,560 0 $0 0 $0 FILES CLOSED FOR INCOMPLETENESS 1 $321,550 0 $0 0 $0
Aggregated Statistics For Year 2003(Based on 2 full tracts) A) Conventional B) Refinancings C) Non-occupant Loans on Number Average Value Number Average Value Number Average Value
LOANS ORIGINATED 27 $295,393 11 $201,169 4 $324,510 APPLICATIONS APPROVED, NOT ACCEPTED 5 $253,238 6 $246,535 1 $194,100 APPLICATIONS DENIED 0 $0 1 $320,550 0 $0 APPLICATIONS WITHDRAWN 2 $258,320 0 $0 0 $0 FILES CLOSED FOR INCOMPLETENESS 0 $0 0 $0 0 $0
Aggregated Statistics For Year 2002(Based on 2 full tracts) A) Conventional B) Refinancings C) Non-occupant Loans on Number Average Value Number Average Value Number Average Value
LOANS ORIGINATED 32 $228,518 14 $234,009 9 $211,922 APPLICATIONS APPROVED, NOT ACCEPTED 10 $208,642 7 $214,449 4 $226,958 APPLICATIONS DENIED 1 $223,970 0 $0 1 $223,970 APPLICATIONS WITHDRAWN 2 $268,760 0 $0 0 $0 FILES CLOSED FOR INCOMPLETENESS 0 $0 0 $0 0 $0
Aggregated Statistics For Year 2001(Based on 2 full tracts) A) Conventional B) Refinancings C) Non-occupant Loans on Number Average Value Number Average Value Number Average Value
LOANS ORIGINATED 48 $200,294 15 $198,695 7 $202,644 APPLICATIONS APPROVED, NOT ACCEPTED 10 $177,793 4 $233,675 4 $159,775 APPLICATIONS DENIED 1 $237,920 3 $236,913 0 $0 APPLICATIONS WITHDRAWN 0 $0 1 $157,270 0 $0 FILES CLOSED FOR INCOMPLETENESS 1 $246,860 0 $0 1 $246,860
Aggregated Statistics For Year 2000(Based on 2 full tracts) A) Conventional B) Refinancings C) Non-occupant Loans on Number Average Value Number Average Value Number Average Value
LOANS ORIGINATED 51 $159,821 12 $170,712 10 $171,116 APPLICATIONS APPROVED, NOT ACCEPTED 8 $191,875 1 $127,420 1 $125,420 APPLICATIONS DENIED 8 $152,058 1 $234,940 2 $124,935 APPLICATIONS WITHDRAWN 0 $0 0 $0 0 $0 FILES CLOSED FOR INCOMPLETENESS 2 $186,160 4 $161,255 0 $0
Aggregated Statistics For Year 1999(Based on 1 full and 2 partial tracts) A) Conventional B) Refinancings C) Non-occupant Loans on Number Average Value Number Average Value Number Average Value
LOANS ORIGINATED 52 $159,013 17 $145,372 8 $126,416 APPLICATIONS APPROVED, NOT ACCEPTED 11 $159,289 5 $127,748 3 $111,060 APPLICATIONS DENIED 8 $113,335 2 $133,885 0 $0 APPLICATIONS WITHDRAWN 3 $128,717 2 $151,285 2 $113,365 FILES CLOSED FOR INCOMPLETENESS 0 $0 0 $0 0 $0
Detailed PMIC statistics for the following Tracts:
0120.00
, 0121.00 Fire-safe hotels and motels in Grover Beach, California:
Holiday Inn Express, 775 N Oak Park Blvd, Grover Beach, California 93433 Phone: (805) 481-4448, Fax: (805) 473-3609
AMERICAN INN, 135 S 5th St, Grover beach, California 93433 Phone: (805) 668-2022
All 2 fire-safe hotels and motels in Grover Beach, California
Most common first names in Grover Beach, CA among deceased individuals Name Count Lived (average)
John 90 74.8 years William 75 77.5 years Mary 61 77.8 years Robert 59 69.0 years James 57 74.1 years Frank 42 75.1 years Charles 40 76.5 years Dorothy 30 77.2 years George 29 77.0 years Thomas 26 74.4 years
Most common last names in Grover Beach, CA among deceased individuals Last name Count Lived (average)
Smith 29 73.7 years Williams 22 78.8 years Johnson 21 81.0 years Wilson 16 76.9 years White 16 80.3 years Jones 15 74.0 years Miller 14 79.4 years Brown 14 72.5 years Baker 14 70.3 years Thompson 13 77.5 years
Grover Beach compared to California state average:
Unemployed percentage below state average. Black race population percentage significantly below state average. Median age above state average. Foreign-born population percentage significantly below state average. Length of stay since moving in significantly above state average. Grover Beach on our top lists :
#15 on the list of "Top 101 cities with the most people taking a bicycle to work (population 5,000+)"
#30 on the list of "Top 101 cities with largest percentage of females in industries: utilities (population 5,000+)"
#4 on the list of "Top 101 counties with the lowest Sulfur Oxides Annual air pollution readings in 2012 (µg/m3 )"
#39 on the list of "Top 101 counties with highest percentage of residents voting for 3rd party candidates in the 2012 Presidential Election (pop. 50,000+)"
#50 on the list of "Top 101 counties with the lowest number of births per 1000 residents 2007-2013"
#60 on the list of "Top 101 counties with the lowest Particulate Matter (PM2.5 ) Annual air pollution readings in 2012 (µg/m3 )"
#74 on the list of "Top 101 counties with the largest increase in the number of births per 1000 residents 2000-2006 to 2007-2013 (pop 50,000+)"
Top Patent Applicants
Carolyn W. Hitko (7)
Timothy R. Ohm (7)
Donald A. Hitko (6)
Carolyn Woodroofe Hitko (4)
Thomas C. Baker (3)
Chet Brandenburg (3)
Craig D. Machado (2)
Adrian K. Hongo (2)
Sarah Vogt (2)
William Hoskins (1)
Total of 49 patent applications in 2008-2024.

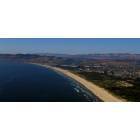
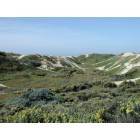


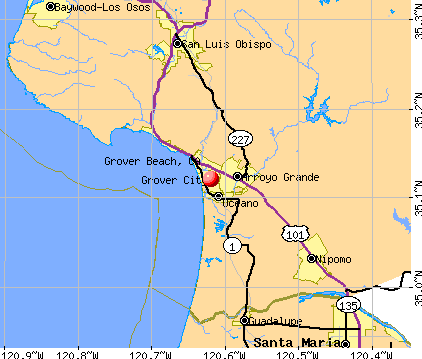


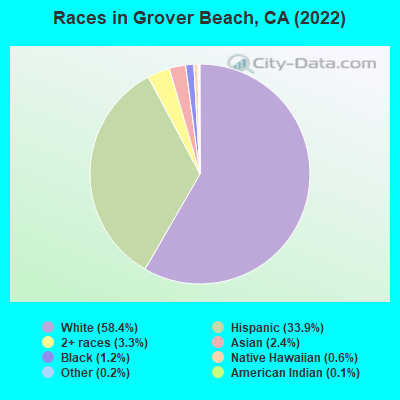
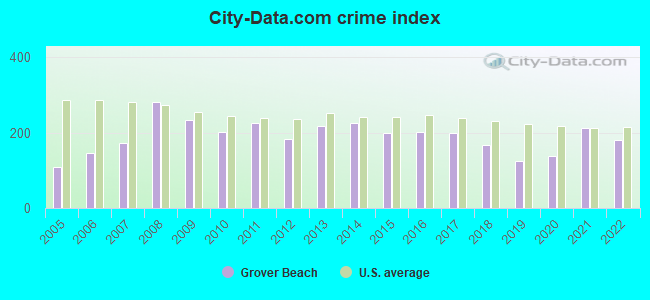
 Recent articles from our blog. Our writers, many of them Ph.D. graduates or candidates, create easy-to-read articles on a wide variety of topics.

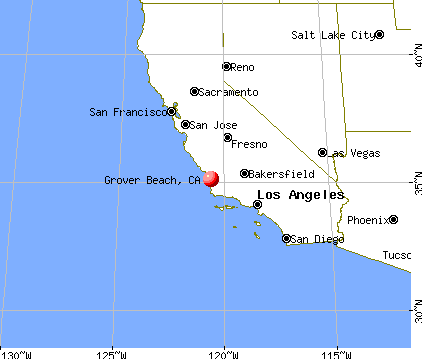
 (15.8 miles
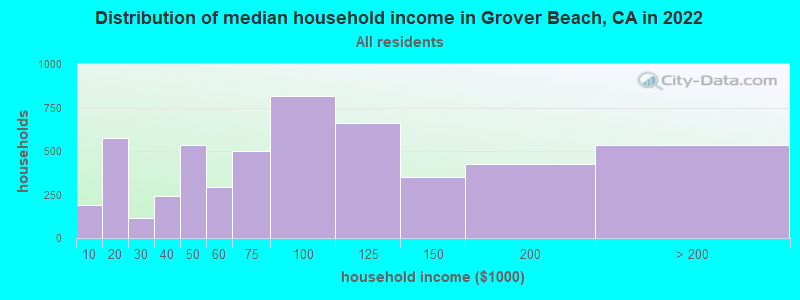
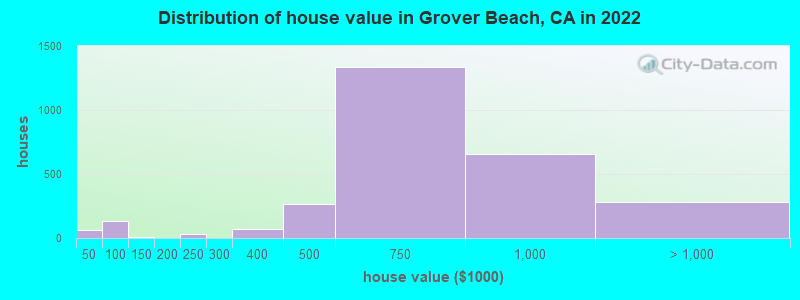
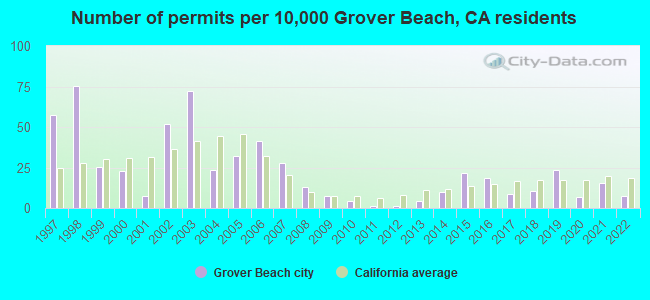
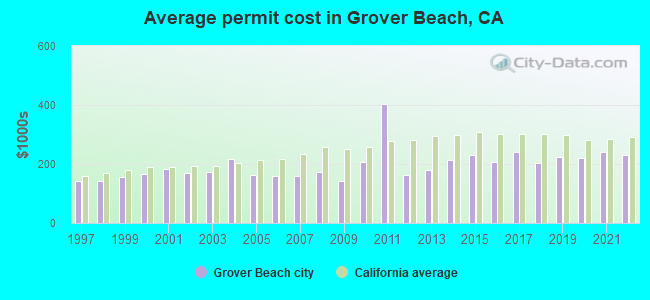
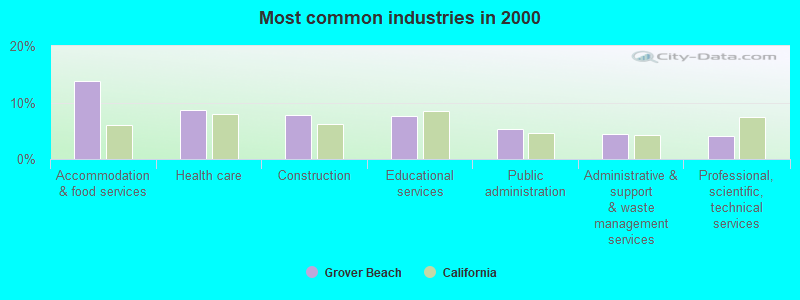
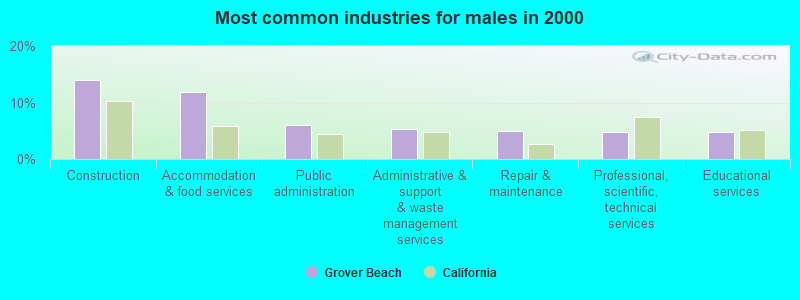
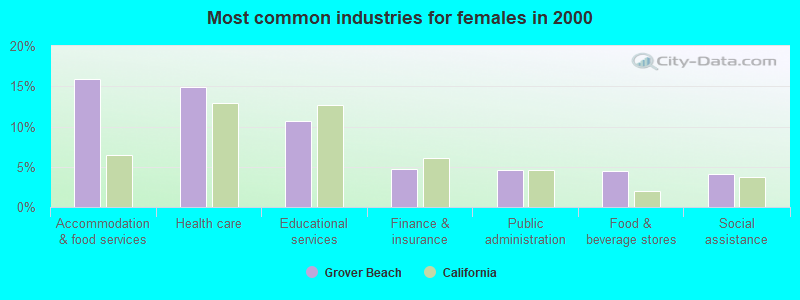
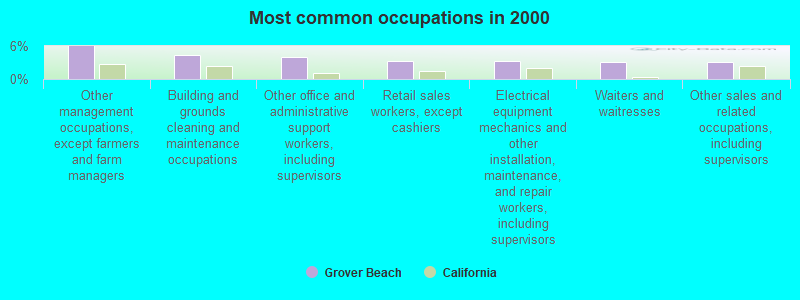
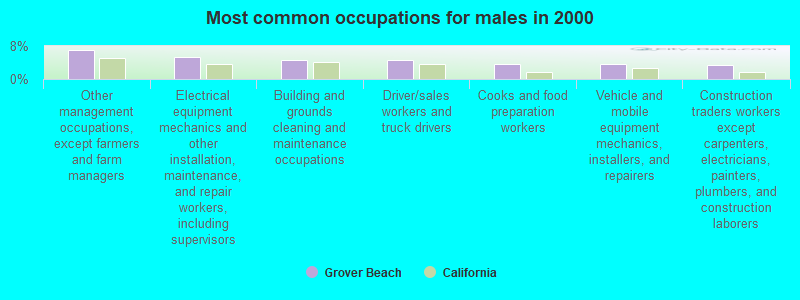
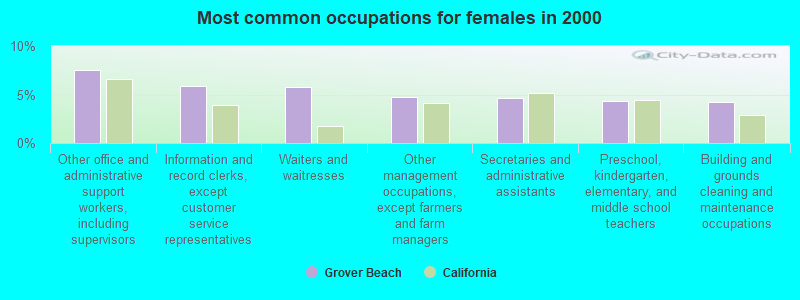
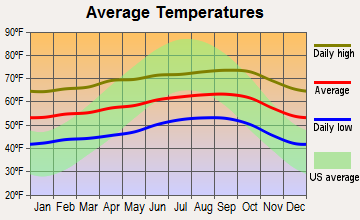
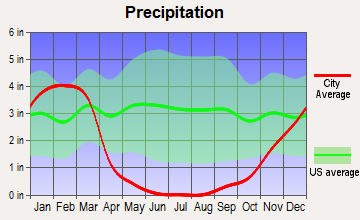
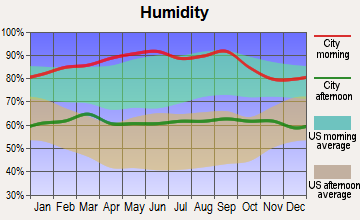
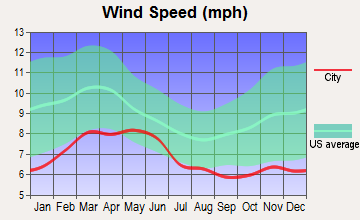
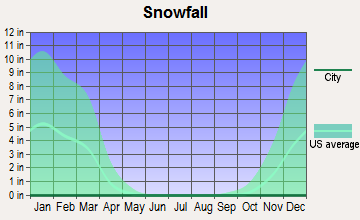
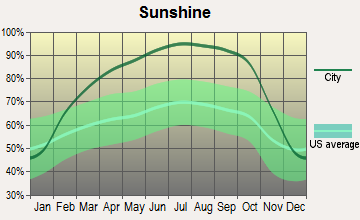
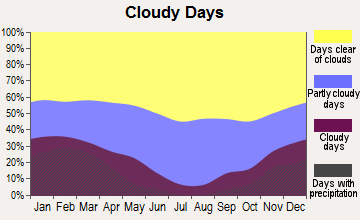
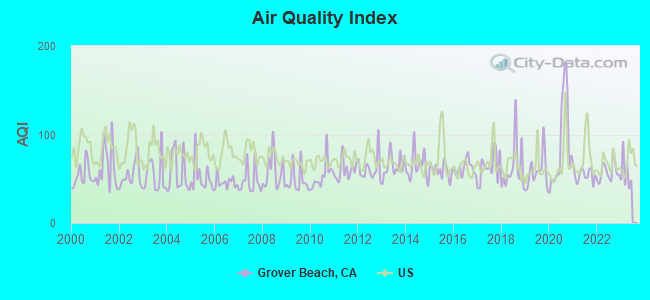
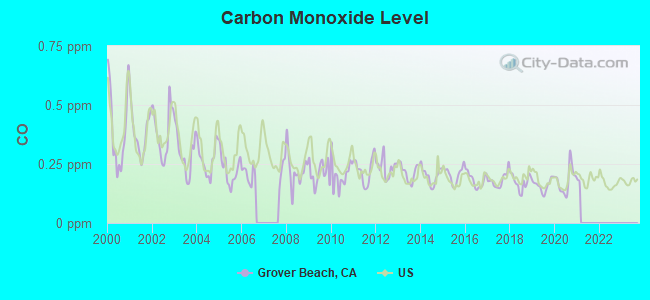
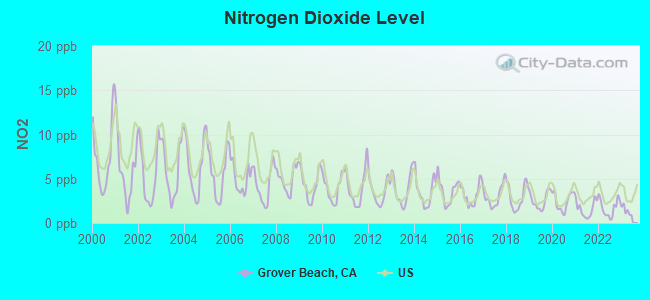
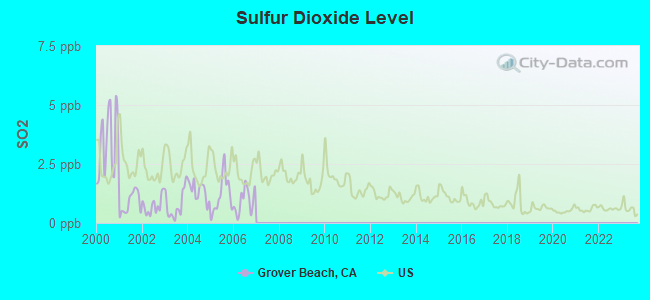
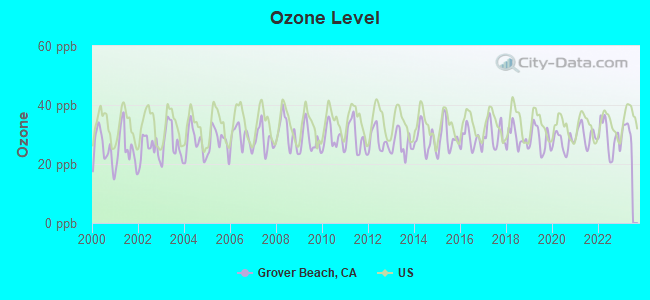
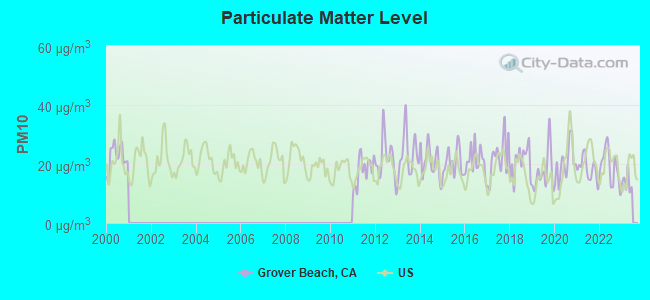
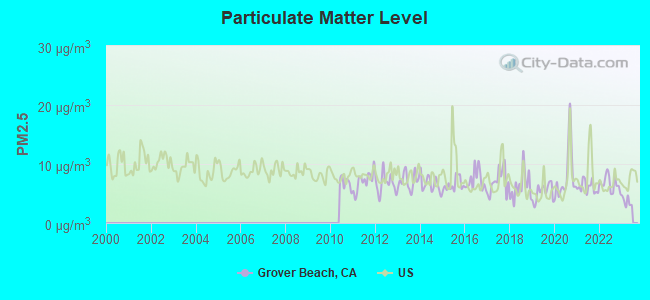

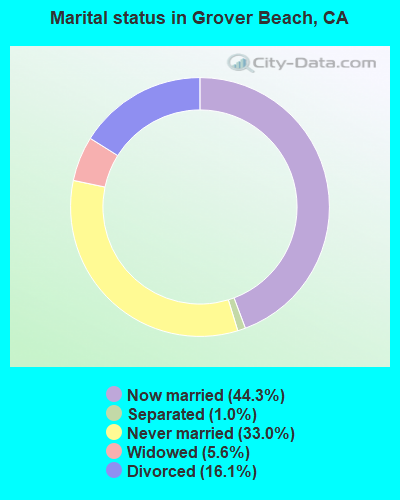
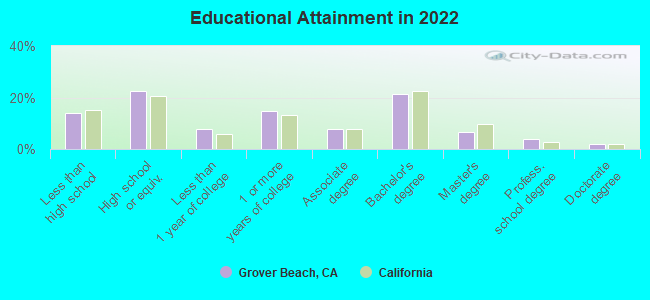
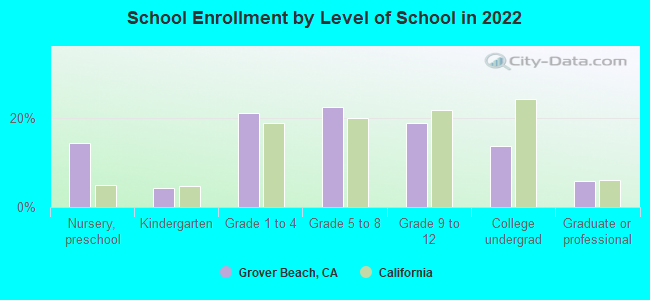
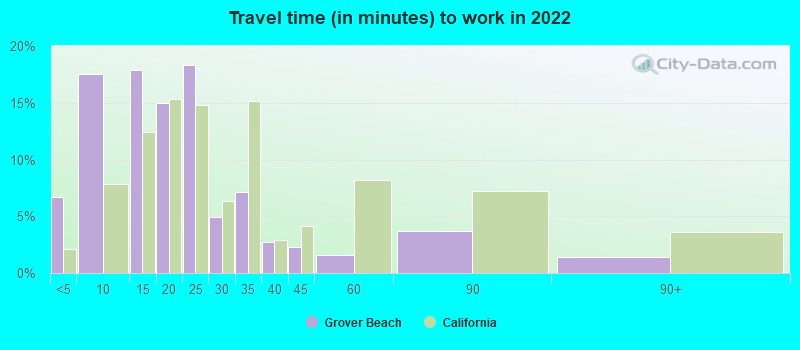
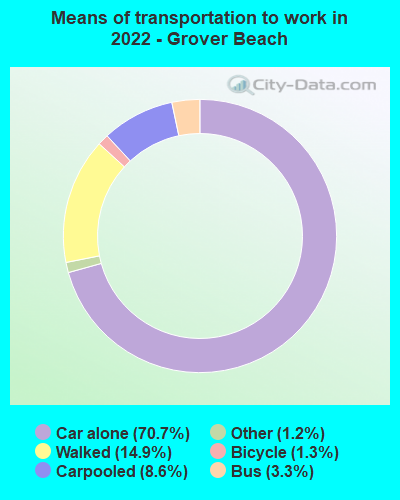
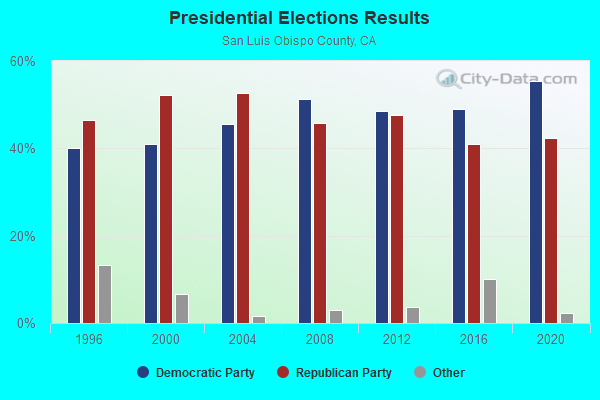
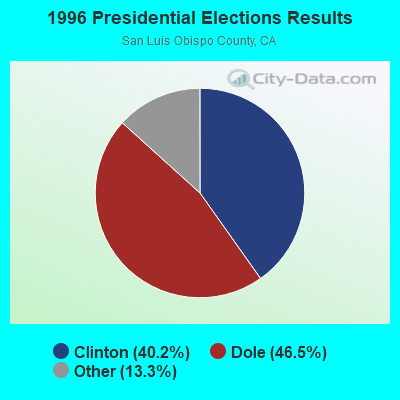
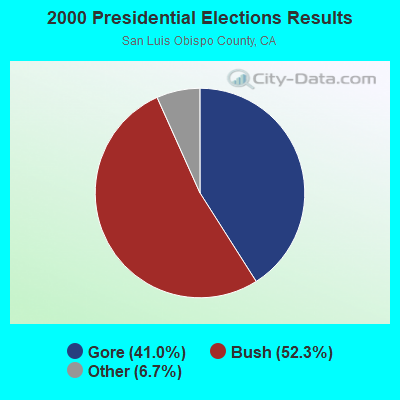
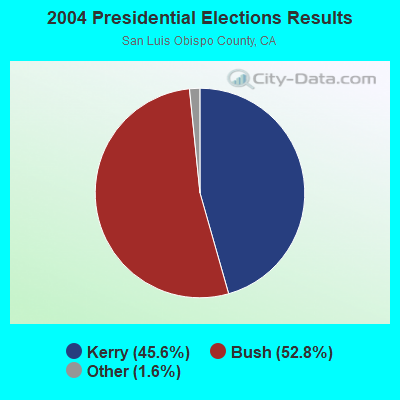
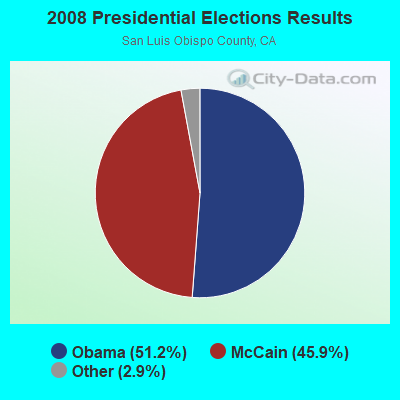
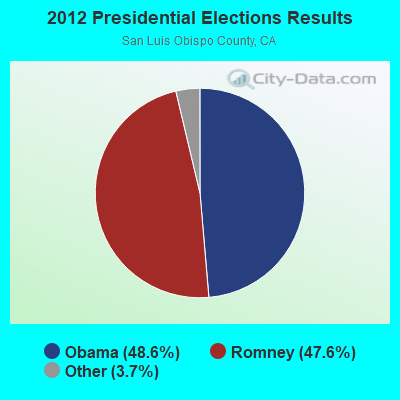
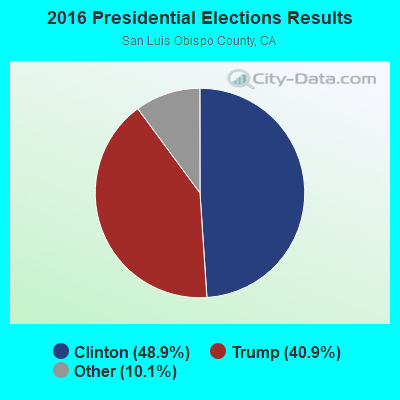
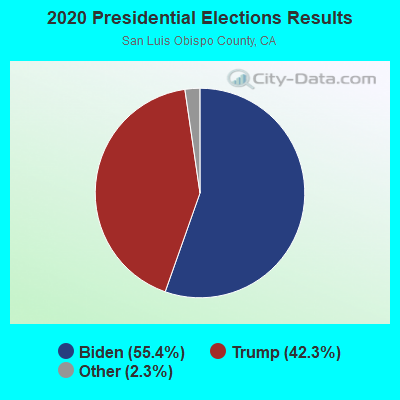
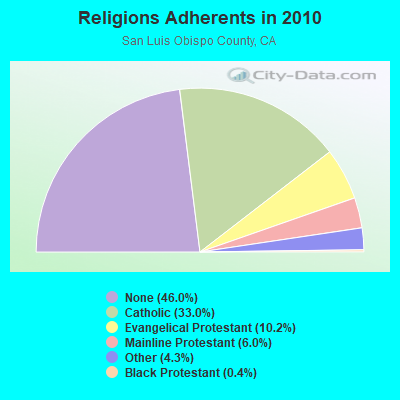
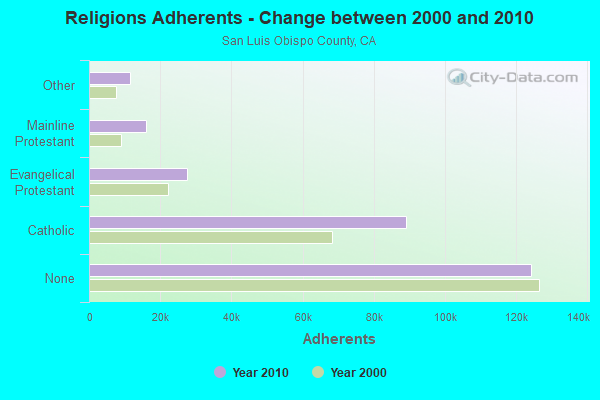

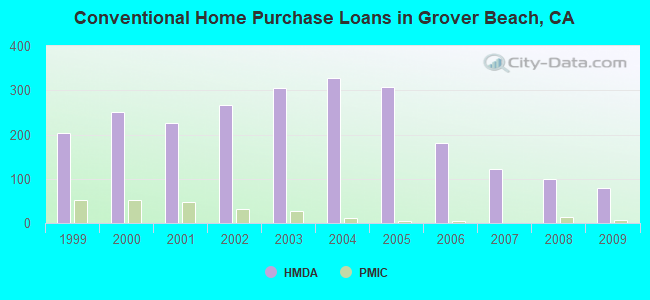
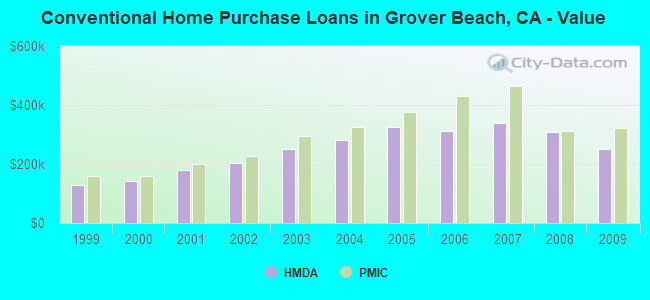
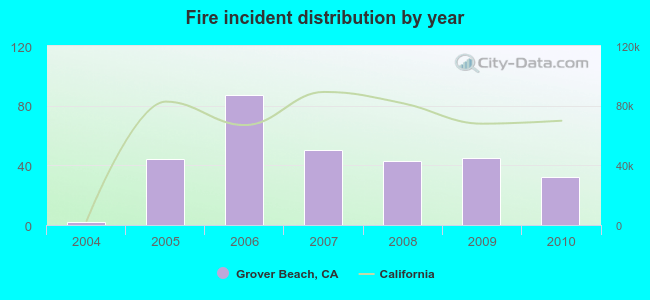 According to the data from the years 2004 - 2010 the average number of fires per year is 43. The highest number of reported fire incidents - 87 took place in 2006, and the least - 2 in 2004. The data has a growing trend.
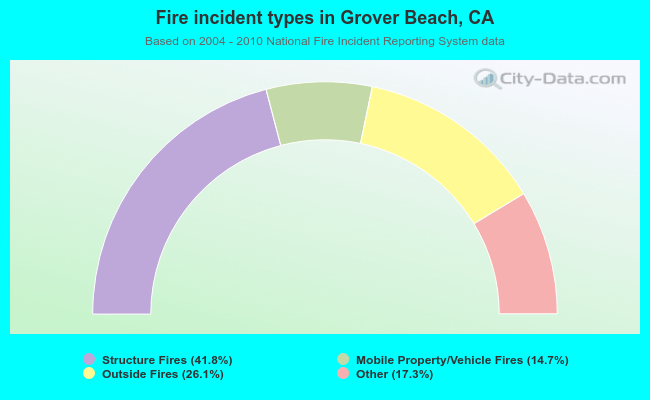 When looking into fire subcategories, the most incidents belonged to: Structure Fires (41.8%), and Outside Fires (26.1%).