Hidden Hills, California Submit your own pictures of this city and show them to the world
OSM Map
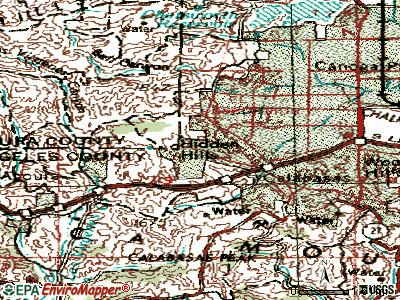
General Map
Google Map
MSN Map
OSM Map
General Map
Google Map
MSN Map
OSM Map
General Map
Google Map
MSN Map
OSM Map
General Map
Google Map
MSN Map
Please wait while loading the map...
Population in 2022: 1,694 (100% urban, 0% rural). Population change since 2000: -9.7%Males: 747 Females: 947
March 2022 cost of living index in Hidden Hills: 140.2 (very high, U.S. average is 100) Percentage of residents living in poverty in 2022: 9.6%for White Non-Hispanic residents , 25.2% for Hispanic or Latino residents , 14.7% for other race residents , 18.2% for two or more races residents )Business Search - 14 Million verified businesses
Data:
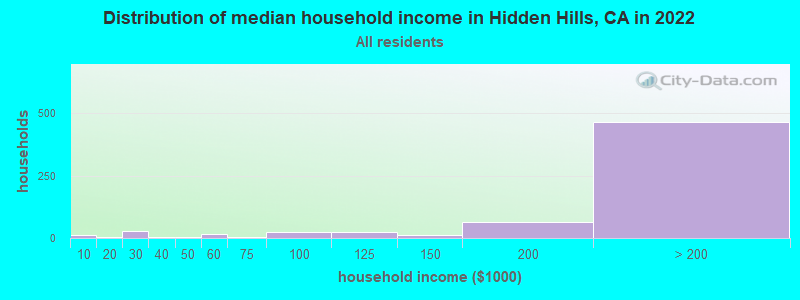
Median household income ($)
Median household income (% change since 2000)
Household income diversity
Ratio of average income to average house value (%)
Ratio of average income to average rent
Median household income ($) - White
Median household income ($) - Black or African American
Median household income ($) - Asian
Median household income ($) - Hispanic or Latino
Median household income ($) - American Indian and Alaska Native
Median household income ($) - Multirace
Median household income ($) - Other Race
Median household income for houses/condos with a mortgage ($)
Median household income for apartments without a mortgage ($)
Races - White alone (%)
Races - White alone (% change since 2000)
Races - Black alone (%)
Races - Black alone (% change since 2000)
Races - American Indian alone (%)
Races - American Indian alone (% change since 2000)
Races - Asian alone (%)
Races - Asian alone (% change since 2000)
Races - Hispanic (%)
Races - Hispanic (% change since 2000)
Races - Native Hawaiian and Other Pacific Islander alone (%)
Races - Native Hawaiian and Other Pacific Islander alone (% change since 2000)
Races - Two or more races (%)
Races - Two or more races (% change since 2000)
Races - Other race alone (%)
Races - Other race alone (% change since 2000)
Racial diversity
Unemployment (%)
Unemployment (% change since 2000)
Unemployment (%) - White
Unemployment (%) - Black or African American
Unemployment (%) - Asian
Unemployment (%) - Hispanic or Latino
Unemployment (%) - American Indian and Alaska Native
Unemployment (%) - Multirace
Unemployment (%) - Other Race
Population density (people per square mile)
Population - Males (%)
Population - Females (%)
Population - Males (%) - White
Population - Males (%) - Black or African American
Population - Males (%) - Asian
Population - Males (%) - Hispanic or Latino
Population - Males (%) - American Indian and Alaska Native
Population - Males (%) - Multirace
Population - Males (%) - Other Race
Population - Females (%) - White
Population - Females (%) - Black or African American
Population - Females (%) - Asian
Population - Females (%) - Hispanic or Latino
Population - Females (%) - American Indian and Alaska Native
Population - Females (%) - Multirace
Population - Females (%) - Other Race
Coronavirus confirmed cases (Apr 28, 2024)
Deaths caused by coronavirus (Apr 28, 2024)
Coronavirus confirmed cases (per 100k population) (Apr 28, 2024)
Deaths caused by coronavirus (per 100k population) (Apr 28, 2024)
Daily increase in number of cases (Apr 28, 2024)
Weekly increase in number of cases (Apr 28, 2024)
Cases doubled (in days) (Apr 28, 2024)
Hospitalized patients (Apr 18, 2022)
Negative test results (Apr 18, 2022)
Total test results (Apr 18, 2022)
COVID Vaccine doses distributed (per 100k population) (Sep 19, 2023)
COVID Vaccine doses administered (per 100k population) (Sep 19, 2023)
COVID Vaccine doses distributed (Sep 19, 2023)
COVID Vaccine doses administered (Sep 19, 2023)
Likely homosexual households (%)
Likely homosexual households (% change since 2000)
Likely homosexual households - Lesbian couples (%)
Likely homosexual households - Lesbian couples (% change since 2000)
Likely homosexual households - Gay men (%)
Likely homosexual households - Gay men (% change since 2000)
Cost of living index
Median gross rent ($)
Median contract rent ($)
Median monthly housing costs ($)
Median house or condo value ($)
Median house or condo value ($ change since 2000)
Mean house or condo value by units in structure - 1, detached ($)
Mean house or condo value by units in structure - 1, attached ($)
Mean house or condo value by units in structure - 2 ($)
Mean house or condo value by units in structure by units in structure - 3 or 4 ($)
Mean house or condo value by units in structure - 5 or more ($)
Mean house or condo value by units in structure - Boat, RV, van, etc. ($)
Mean house or condo value by units in structure - Mobile home ($)
Median house or condo value ($) - White
Median house or condo value ($) - Black or African American
Median house or condo value ($) - Asian
Median house or condo value ($) - Hispanic or Latino
Median house or condo value ($) - American Indian and Alaska Native
Median house or condo value ($) - Multirace
Median house or condo value ($) - Other Race
Median resident age
Resident age diversity
Median resident age - Males
Median resident age - Females
Median resident age - White
Median resident age - Black or African American
Median resident age - Asian
Median resident age - Hispanic or Latino
Median resident age - American Indian and Alaska Native
Median resident age - Multirace
Median resident age - Other Race
Median resident age - Males - White
Median resident age - Males - Black or African American
Median resident age - Males - Asian
Median resident age - Males - Hispanic or Latino
Median resident age - Males - American Indian and Alaska Native
Median resident age - Males - Multirace
Median resident age - Males - Other Race
Median resident age - Females - White
Median resident age - Females - Black or African American
Median resident age - Females - Asian
Median resident age - Females - Hispanic or Latino
Median resident age - Females - American Indian and Alaska Native
Median resident age - Females - Multirace
Median resident age - Females - Other Race
Commute - mean travel time to work (minutes)
Travel time to work - Less than 5 minutes (%)
Travel time to work - Less than 5 minutes (% change since 2000)
Travel time to work - 5 to 9 minutes (%)
Travel time to work - 5 to 9 minutes (% change since 2000)
Travel time to work - 10 to 19 minutes (%)
Travel time to work - 10 to 19 minutes (% change since 2000)
Travel time to work - 20 to 29 minutes (%)
Travel time to work - 20 to 29 minutes (% change since 2000)
Travel time to work - 30 to 39 minutes (%)
Travel time to work - 30 to 39 minutes (% change since 2000)
Travel time to work - 40 to 59 minutes (%)
Travel time to work - 40 to 59 minutes (% change since 2000)
Travel time to work - 60 to 89 minutes (%)
Travel time to work - 60 to 89 minutes (% change since 2000)
Travel time to work - 90 or more minutes (%)
Travel time to work - 90 or more minutes (% change since 2000)
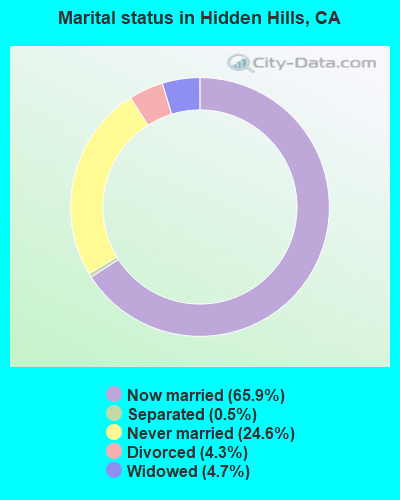
Marital status - Never married (%)
Marital status - Now married (%)
Marital status - Separated (%)
Marital status - Widowed (%)
Marital status - Divorced (%)
Median family income ($)
Median family income (% change since 2000)
Median non-family income ($)
Median non-family income (% change since 2000)
Median per capita income ($)
Median per capita income (% change since 2000)
Median family income ($) - White
Median family income ($) - Black or African American
Median family income ($) - Asian
Median family income ($) - Hispanic or Latino
Median family income ($) - American Indian and Alaska Native
Median family income ($) - Multirace
Median family income ($) - Other Race
Median year house/condo built
Median year apartment built
Year house built - Built 2005 or later (%)
Year house built - Built 2000 to 2004 (%)
Year house built - Built 1990 to 1999 (%)
Year house built - Built 1980 to 1989 (%)
Year house built - Built 1970 to 1979 (%)
Year house built - Built 1960 to 1969 (%)
Year house built - Built 1950 to 1959 (%)
Year house built - Built 1940 to 1949 (%)
Year house built - Built 1939 or earlier (%)
Average household size
Household density (households per square mile)
Average household size - White
Average household size - Black or African American
Average household size - Asian
Average household size - Hispanic or Latino
Average household size - American Indian and Alaska Native
Average household size - Multirace
Average household size - Other Race
Occupied housing units (%)
Vacant housing units (%)
Owner occupied housing units (%)
Renter occupied housing units (%)
Vacancy status - For rent (%)
Vacancy status - For sale only (%)
Vacancy status - Rented or sold, not occupied (%)
Vacancy status - For seasonal, recreational, or occasional use (%)
Vacancy status - For migrant workers (%)
Vacancy status - Other vacant (%)
Residents with income below the poverty level (%)
Residents with income below 50% of the poverty level (%)
Children below poverty level (%)
Poor families by family type - Married-couple family (%)
Poor families by family type - Male, no wife present (%)
Poor families by family type - Female, no husband present (%)
Poverty status for native-born residents (%)
Poverty status for foreign-born residents (%)
Poverty among high school graduates not in families (%)
Poverty among people who did not graduate high school not in families (%)
Residents with income below the poverty level (%) - White
Residents with income below the poverty level (%) - Black or African American
Residents with income below the poverty level (%) - Asian
Residents with income below the poverty level (%) - Hispanic or Latino
Residents with income below the poverty level (%) - American Indian and Alaska Native
Residents with income below the poverty level (%) - Multirace
Residents with income below the poverty level (%) - Other Race
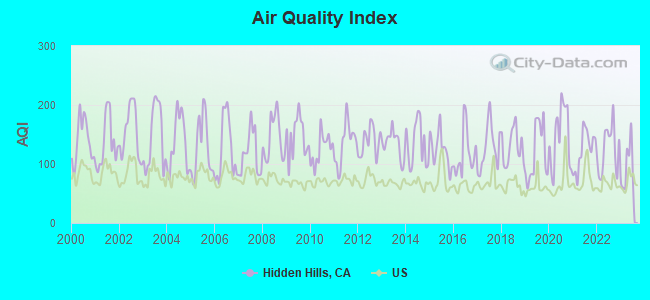
Air pollution - Air Quality Index (AQI)
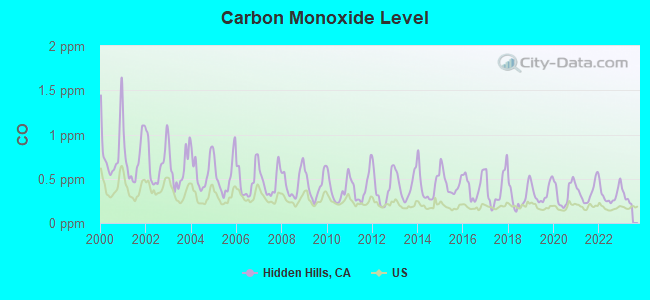
Air pollution - CO
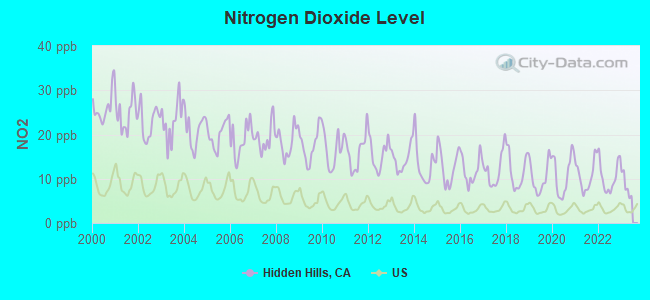
Air pollution - NO2
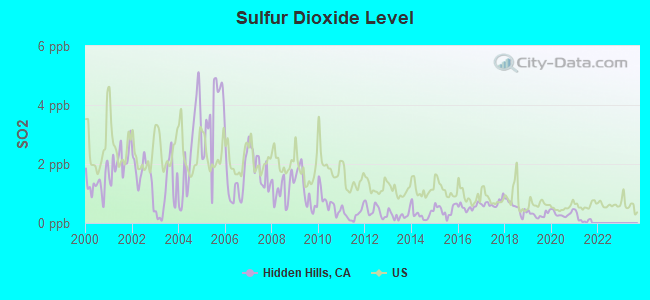
Air pollution - SO2
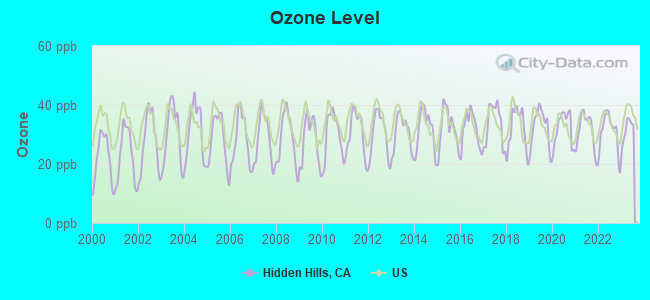
Air pollution - Ozone
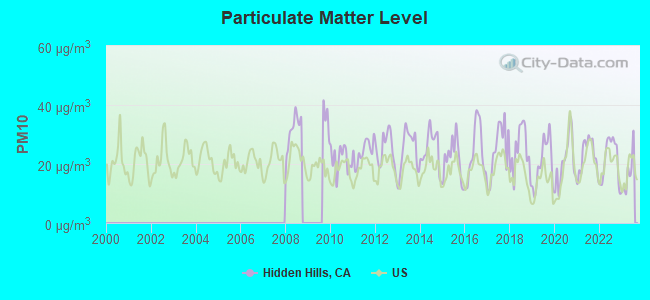
Air pollution - PM10
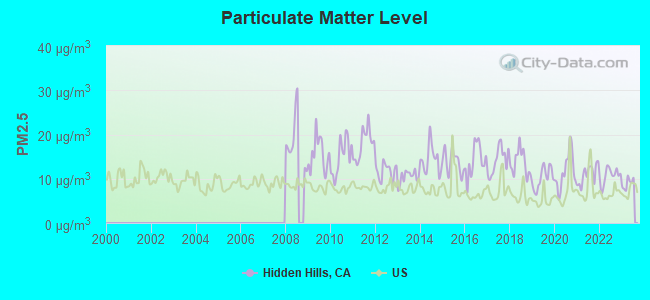
Air pollution - PM25
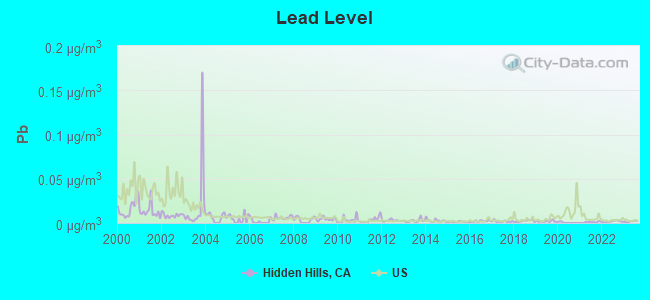
Air pollution - Pb
Crime - Murders per 100,000 population
Crime - Rapes per 100,000 population
Crime - Robberies per 100,000 population
Crime - Assaults per 100,000 population
Crime - Burglaries per 100,000 population
Crime - Thefts per 100,000 population
Crime - Auto thefts per 100,000 population
Crime - Arson per 100,000 population
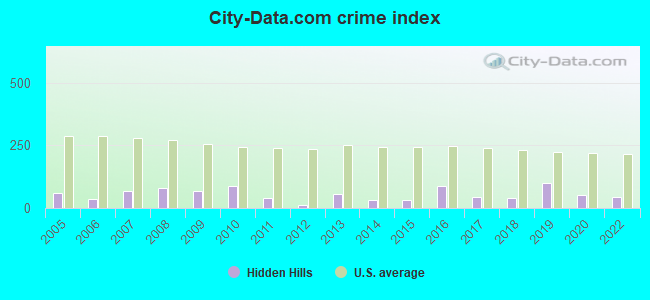
Crime - City-data.com crime index
Crime - Violent crime index
Crime - Property crime index
Crime - Murders per 100,000 population (5 year average)
Crime - Rapes per 100,000 population (5 year average)
Crime - Robberies per 100,000 population (5 year average)
Crime - Assaults per 100,000 population (5 year average)
Crime - Burglaries per 100,000 population (5 year average)
Crime - Thefts per 100,000 population (5 year average)
Crime - Auto thefts per 100,000 population (5 year average)
Crime - Arson per 100,000 population (5 year average)
Crime - City-data.com crime index (5 year average)
Crime - Violent crime index (5 year average)
Crime - Property crime index (5 year average)
1996 Presidential Elections Results (%) - Democratic Party (Clinton)
1996 Presidential Elections Results (%) - Republican Party (Dole)
1996 Presidential Elections Results (%) - Other
2000 Presidential Elections Results (%) - Democratic Party (Gore)
2000 Presidential Elections Results (%) - Republican Party (Bush)
2000 Presidential Elections Results (%) - Other
2004 Presidential Elections Results (%) - Democratic Party (Kerry)
2004 Presidential Elections Results (%) - Republican Party (Bush)
2004 Presidential Elections Results (%) - Other
2008 Presidential Elections Results (%) - Democratic Party (Obama)
2008 Presidential Elections Results (%) - Republican Party (McCain)
2008 Presidential Elections Results (%) - Other
2012 Presidential Elections Results (%) - Democratic Party (Obama)
2012 Presidential Elections Results (%) - Republican Party (Romney)
2012 Presidential Elections Results (%) - Other
2016 Presidential Elections Results (%) - Democratic Party (Clinton)
2016 Presidential Elections Results (%) - Republican Party (Trump)
2016 Presidential Elections Results (%) - Other
2020 Presidential Elections Results (%) - Democratic Party (Biden)
2020 Presidential Elections Results (%) - Republican Party (Trump)
2020 Presidential Elections Results (%) - Other
Ancestries Reported - Arab (%)
Ancestries Reported - Czech (%)
Ancestries Reported - Danish (%)
Ancestries Reported - Dutch (%)
Ancestries Reported - English (%)
Ancestries Reported - French (%)
Ancestries Reported - French Canadian (%)
Ancestries Reported - German (%)
Ancestries Reported - Greek (%)
Ancestries Reported - Hungarian (%)
Ancestries Reported - Irish (%)
Ancestries Reported - Italian (%)
Ancestries Reported - Lithuanian (%)
Ancestries Reported - Norwegian (%)
Ancestries Reported - Polish (%)
Ancestries Reported - Portuguese (%)
Ancestries Reported - Russian (%)
Ancestries Reported - Scotch-Irish (%)
Ancestries Reported - Scottish (%)
Ancestries Reported - Slovak (%)
Ancestries Reported - Subsaharan African (%)
Ancestries Reported - Swedish (%)
Ancestries Reported - Swiss (%)
Ancestries Reported - Ukrainian (%)
Ancestries Reported - United States (%)
Ancestries Reported - Welsh (%)
Ancestries Reported - West Indian (%)
Ancestries Reported - Other (%)
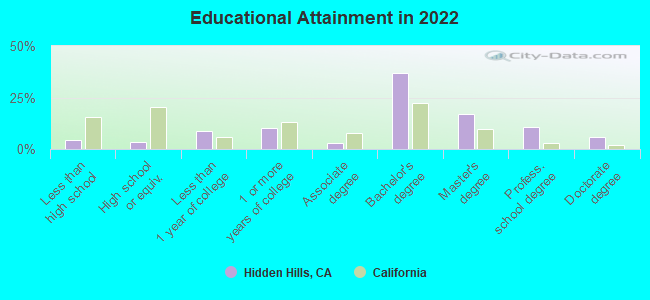
Educational Attainment - No schooling completed (%)
Educational Attainment - Less than high school (%)
Educational Attainment - High school or equivalent (%)
Educational Attainment - Less than 1 year of college (%)
Educational Attainment - 1 or more years of college (%)
Educational Attainment - Associate degree (%)
Educational Attainment - Bachelor's degree (%)
Educational Attainment - Master's degree (%)
Educational Attainment - Professional school degree (%)
Educational Attainment - Doctorate degree (%)
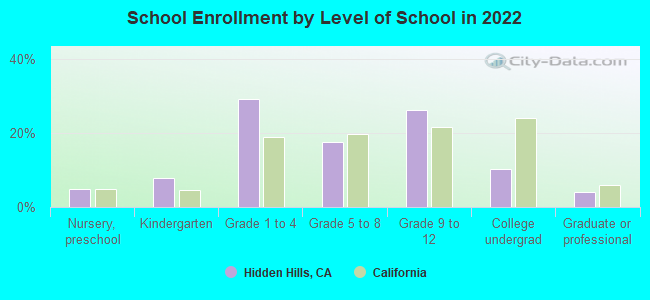
School Enrollment - Nursery, preschool (%)
School Enrollment - Kindergarten (%)
School Enrollment - Grade 1 to 4 (%)
School Enrollment - Grade 5 to 8 (%)
School Enrollment - Grade 9 to 12 (%)
School Enrollment - College undergrad (%)
School Enrollment - Graduate or professional (%)
School Enrollment - Not enrolled in school (%)
School enrollment - Public schools (%)
School enrollment - Private schools (%)
School enrollment - Not enrolled (%)
Median number of rooms in houses and condos
Median number of rooms in apartments
Housing units lacking complete plumbing facilities (%)
Housing units lacking complete kitchen facilities (%)
Density of houses
Urban houses (%)
Rural houses (%)
Households with people 60 years and over (%)
Households with people 65 years and over (%)
Households with people 75 years and over (%)
Households with one or more nonrelatives (%)
Households with no nonrelatives (%)
Population in households (%)
Family households (%)
Nonfamily households (%)
Population in families (%)
Family households with own children (%)
Median number of bedrooms in owner occupied houses
Mean number of bedrooms in owner occupied houses
Median number of bedrooms in renter occupied houses
Mean number of bedrooms in renter occupied houses
Median number of vehichles in owner occupied houses
Mean number of vehichles in owner occupied houses
Median number of vehichles in renter occupied houses
Mean number of vehichles in renter occupied houses
Mortgage status - with mortgage (%)
Mortgage status - with second mortgage (%)
Mortgage status - with home equity loan (%)
Mortgage status - with both second mortgage and home equity loan (%)
Mortgage status - without a mortgage (%)
Average family size
Average family size - White
Average family size - Black or African American
Average family size - Asian
Average family size - Hispanic or Latino
Average family size - American Indian and Alaska Native
Average family size - Multirace
Average family size - Other Race
Geographical mobility - Same house 1 year ago (%)
Geographical mobility - Moved within same county (%)
Geographical mobility - Moved from different county within same state (%)
Geographical mobility - Moved from different state (%)
Geographical mobility - Moved from abroad (%)
Place of birth - Born in state of residence (%)
Place of birth - Born in other state (%)
Place of birth - Native, outside of US (%)
Place of birth - Foreign born (%)
Housing units in structures - 1, detached (%)
Housing units in structures - 1, attached (%)
Housing units in structures - 2 (%)
Housing units in structures - 3 or 4 (%)
Housing units in structures - 5 to 9 (%)
Housing units in structures - 10 to 19 (%)
Housing units in structures - 20 to 49 (%)
Housing units in structures - 50 or more (%)
Housing units in structures - Mobile home (%)
Housing units in structures - Boat, RV, van, etc. (%)
House/condo owner moved in on average (years ago)
Renter moved in on average (years ago)
Year householder moved into unit - Moved in 1999 to March 2000 (%)
Year householder moved into unit - Moved in 1995 to 1998 (%)
Year householder moved into unit - Moved in 1990 to 1994 (%)
Year householder moved into unit - Moved in 1980 to 1989 (%)
Year householder moved into unit - Moved in 1970 to 1979 (%)
Year householder moved into unit - Moved in 1969 or earlier (%)
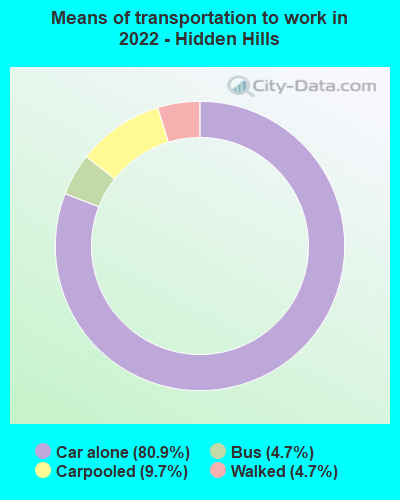
Means of transportation to work - Drove car alone (%)
Means of transportation to work - Carpooled (%)
Means of transportation to work - Public transportation (%)
Means of transportation to work - Bus or trolley bus (%)
Means of transportation to work - Streetcar or trolley car (%)
Means of transportation to work - Subway or elevated (%)
Means of transportation to work - Railroad (%)
Means of transportation to work - Ferryboat (%)
Means of transportation to work - Taxicab (%)
Means of transportation to work - Motorcycle (%)
Means of transportation to work - Bicycle (%)
Means of transportation to work - Walked (%)
Means of transportation to work - Other means (%)
Working at home (%)
Industry diversity
Most Common Industries - Agriculture, forestry, fishing and hunting, and mining (%)
Most Common Industries - Agriculture, forestry, fishing and hunting (%)
Most Common Industries - Mining, quarrying, and oil and gas extraction (%)
Most Common Industries - Construction (%)
Most Common Industries - Manufacturing (%)
Most Common Industries - Wholesale trade (%)
Most Common Industries - Retail trade (%)
Most Common Industries - Transportation and warehousing, and utilities (%)
Most Common Industries - Transportation and warehousing (%)
Most Common Industries - Utilities (%)
Most Common Industries - Information (%)
Most Common Industries - Finance and insurance, and real estate and rental and leasing (%)
Most Common Industries - Finance and insurance (%)
Most Common Industries - Real estate and rental and leasing (%)
Most Common Industries - Professional, scientific, and management, and administrative and waste management services (%)
Most Common Industries - Professional, scientific, and technical services (%)
Most Common Industries - Management of companies and enterprises (%)
Most Common Industries - Administrative and support and waste management services (%)
Most Common Industries - Educational services, and health care and social assistance (%)
Most Common Industries - Educational services (%)
Most Common Industries - Health care and social assistance (%)
Most Common Industries - Arts, entertainment, and recreation, and accommodation and food services (%)
Most Common Industries - Arts, entertainment, and recreation (%)
Most Common Industries - Accommodation and food services (%)
Most Common Industries - Other services, except public administration (%)
Most Common Industries - Public administration (%)
Occupation diversity
Most Common Occupations - Management, business, science, and arts occupations (%)
Most Common Occupations - Management, business, and financial occupations (%)
Most Common Occupations - Management occupations (%)
Most Common Occupations - Business and financial operations occupations (%)
Most Common Occupations - Computer, engineering, and science occupations (%)
Most Common Occupations - Computer and mathematical occupations (%)
Most Common Occupations - Architecture and engineering occupations (%)
Most Common Occupations - Life, physical, and social science occupations (%)
Most Common Occupations - Education, legal, community service, arts, and media occupations (%)
Most Common Occupations - Community and social service occupations (%)
Most Common Occupations - Legal occupations (%)
Most Common Occupations - Education, training, and library occupations (%)
Most Common Occupations - Arts, design, entertainment, sports, and media occupations (%)
Most Common Occupations - Healthcare practitioners and technical occupations (%)
Most Common Occupations - Health diagnosing and treating practitioners and other technical occupations (%)
Most Common Occupations - Health technologists and technicians (%)
Most Common Occupations - Service occupations (%)
Most Common Occupations - Healthcare support occupations (%)
Most Common Occupations - Protective service occupations (%)
Most Common Occupations - Fire fighting and prevention, and other protective service workers including supervisors (%)
Most Common Occupations - Law enforcement workers including supervisors (%)
Most Common Occupations - Food preparation and serving related occupations (%)
Most Common Occupations - Building and grounds cleaning and maintenance occupations (%)
Most Common Occupations - Personal care and service occupations (%)
Most Common Occupations - Sales and office occupations (%)
Most Common Occupations - Sales and related occupations (%)
Most Common Occupations - Office and administrative support occupations (%)
Most Common Occupations - Natural resources, construction, and maintenance occupations (%)
Most Common Occupations - Farming, fishing, and forestry occupations (%)
Most Common Occupations - Construction and extraction occupations (%)
Most Common Occupations - Installation, maintenance, and repair occupations (%)
Most Common Occupations - Production, transportation, and material moving occupations (%)
Most Common Occupations - Production occupations (%)
Most Common Occupations - Transportation occupations (%)
Most Common Occupations - Material moving occupations (%)
People in Group quarters - Institutionalized population (%)
People in Group quarters - Correctional institutions (%)
People in Group quarters - Federal prisons and detention centers (%)
People in Group quarters - Halfway houses (%)
People in Group quarters - Local jails and other confinement facilities (including police lockups) (%)
People in Group quarters - Military disciplinary barracks (%)
People in Group quarters - State prisons (%)
People in Group quarters - Other types of correctional institutions (%)
People in Group quarters - Nursing homes (%)
People in Group quarters - Hospitals/wards, hospices, and schools for the handicapped (%)
People in Group quarters - Hospitals/wards and hospices for chronically ill (%)
People in Group quarters - Hospices or homes for chronically ill (%)
People in Group quarters - Military hospitals or wards for chronically ill (%)
People in Group quarters - Other hospitals or wards for chronically ill (%)
People in Group quarters - Hospitals or wards for drug/alcohol abuse (%)
People in Group quarters - Mental (Psychiatric) hospitals or wards (%)
People in Group quarters - Schools, hospitals, or wards for the mentally retarded (%)
People in Group quarters - Schools, hospitals, or wards for the physically handicapped (%)
People in Group quarters - Institutions for the deaf (%)
People in Group quarters - Institutions for the blind (%)
People in Group quarters - Orthopedic wards and institutions for the physically handicapped (%)
People in Group quarters - Wards in general hospitals for patients who have no usual home elsewhere (%)
People in Group quarters - Wards in military hospitals for patients who have no usual home elsewhere (%)
People in Group quarters - Juvenile institutions (%)
People in Group quarters - Long-term care (%)
People in Group quarters - Homes for abused, dependent, and neglected children (%)
People in Group quarters - Residential treatment centers for emotionally disturbed children (%)
People in Group quarters - Training schools for juvenile delinquents (%)
People in Group quarters - Short-term care, detention or diagnostic centers for delinquent children (%)
People in Group quarters - Type of juvenile institution unknown (%)
People in Group quarters - Noninstitutionalized population (%)
People in Group quarters - College dormitories (includes college quarters off campus) (%)
People in Group quarters - Military quarters (%)
People in Group quarters - On base (%)
People in Group quarters - Barracks, unaccompanied personnel housing (UPH), (Enlisted/Officer), ;and similar group living quarters for military personnel (%)
People in Group quarters - Transient quarters for temporary residents (%)
People in Group quarters - Military ships (%)
People in Group quarters - Group homes (%)
People in Group quarters - Homes or halfway houses for drug/alcohol abuse (%)
People in Group quarters - Homes for the mentally ill (%)
People in Group quarters - Homes for the mentally retarded (%)
People in Group quarters - Homes for the physically handicapped (%)
People in Group quarters - Other group homes (%)
People in Group quarters - Religious group quarters (%)
People in Group quarters - Dormitories (%)
People in Group quarters - Agriculture workers' dormitories on farms (%)
People in Group quarters - Job Corps and vocational training facilities (%)
People in Group quarters - Other workers' dormitories (%)
People in Group quarters - Crews of maritime vessels (%)
People in Group quarters - Other nonhousehold living situations (%)
People in Group quarters - Other noninstitutional group quarters (%)
Residents speaking English at home (%)
Residents speaking English at home - Born in the United States (%)
Residents speaking English at home - Native, born elsewhere (%)
Residents speaking English at home - Foreign born (%)
Residents speaking Spanish at home (%)
Residents speaking Spanish at home - Born in the United States (%)
Residents speaking Spanish at home - Native, born elsewhere (%)
Residents speaking Spanish at home - Foreign born (%)
Residents speaking other language at home (%)
Residents speaking other language at home - Born in the United States (%)
Residents speaking other language at home - Native, born elsewhere (%)
Residents speaking other language at home - Foreign born (%)
Class of Workers - Employee of private company (%)
Class of Workers - Self-employed in own incorporated business (%)
Class of Workers - Private not-for-profit wage and salary workers (%)
Class of Workers - Local government workers (%)
Class of Workers - State government workers (%)
Class of Workers - Federal government workers (%)
Class of Workers - Self-employed workers in own not incorporated business and Unpaid family workers (%)
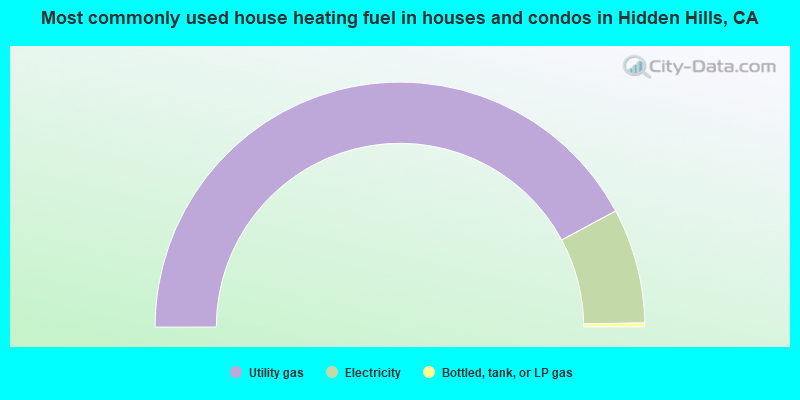
House heating fuel used in houses and condos - Utility gas (%)
House heating fuel used in houses and condos - Bottled, tank, or LP gas (%)
House heating fuel used in houses and condos - Electricity (%)
House heating fuel used in houses and condos - Fuel oil, kerosene, etc. (%)
House heating fuel used in houses and condos - Coal or coke (%)
House heating fuel used in houses and condos - Wood (%)
House heating fuel used in houses and condos - Solar energy (%)
House heating fuel used in houses and condos - Other fuel (%)
House heating fuel used in houses and condos - No fuel used (%)
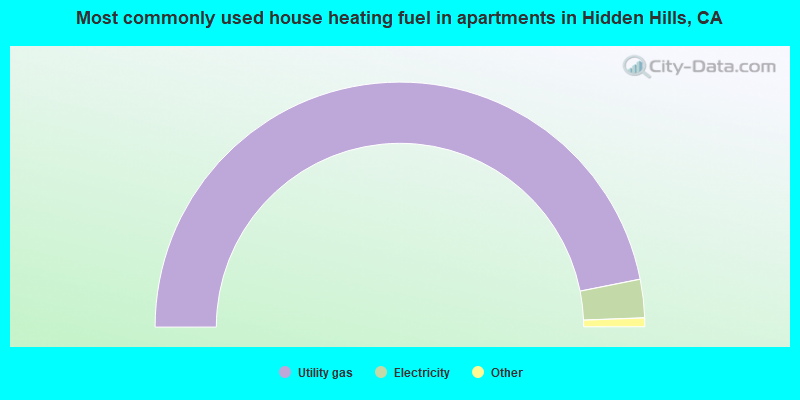
House heating fuel used in apartments - Utility gas (%)
House heating fuel used in apartments - Bottled, tank, or LP gas (%)
House heating fuel used in apartments - Electricity (%)
House heating fuel used in apartments - Fuel oil, kerosene, etc. (%)
House heating fuel used in apartments - Coal or coke (%)
House heating fuel used in apartments - Wood (%)
House heating fuel used in apartments - Solar energy (%)
House heating fuel used in apartments - Other fuel (%)
House heating fuel used in apartments - No fuel used (%)
Armed forces status - In Armed Forces (%)
Armed forces status - Civilian (%)
Armed forces status - Civilian - Veteran (%)
Armed forces status - Civilian - Nonveteran (%)
Fatal accidents locations in years 2005-2021
Fatal accidents locations in 2005
Fatal accidents locations in 2006
Fatal accidents locations in 2007
Fatal accidents locations in 2008
Fatal accidents locations in 2009
Fatal accidents locations in 2010
Fatal accidents locations in 2011
Fatal accidents locations in 2012
Fatal accidents locations in 2013
Fatal accidents locations in 2014
Fatal accidents locations in 2015
Fatal accidents locations in 2016
Fatal accidents locations in 2017
Fatal accidents locations in 2018
Fatal accidents locations in 2019
Fatal accidents locations in 2020
Fatal accidents locations in 2021
Alcohol use - People drinking some alcohol every month (%)
Alcohol use - People not drinking at all (%)
Alcohol use - Average days/month drinking alcohol
Alcohol use - Average drinks/week
Alcohol use - Average days/year people drink much
Audiometry - Average condition of hearing (%)
Audiometry - People that can hear a whisper from across a quiet room (%)
Audiometry - People that can hear normal voice from across a quiet room (%)
Audiometry - Ears ringing, roaring, buzzing (%)
Audiometry - Had a job exposure to loud noise (%)
Audiometry - Had off-work exposure to loud noise (%)
Blood Pressure & Cholesterol - Has high blood pressure (%)
Blood Pressure & Cholesterol - Checking blood pressure at home (%)
Blood Pressure & Cholesterol - Frequently checking blood cholesterol (%)
Blood Pressure & Cholesterol - Has high cholesterol level (%)
Consumer Behavior - Money monthly spent on food at supermarket/grocery store
Consumer Behavior - Money monthly spent on food at other stores
Consumer Behavior - Money monthly spent on eating out
Consumer Behavior - Money monthly spent on carryout/delivered foods
Consumer Behavior - Income spent on food at supermarket/grocery store (%)
Consumer Behavior - Income spent on food at other stores (%)
Consumer Behavior - Income spent on eating out (%)
Consumer Behavior - Income spent on carryout/delivered foods (%)
Current Health Status - General health condition (%)
Current Health Status - Blood donors (%)
Current Health Status - Has blood ever tested for HIV virus (%)
Current Health Status - Left-handed people (%)
Dermatology - People using sunscreen (%)
Diabetes - Diabetics (%)
Diabetes - Had a blood test for high blood sugar (%)
Diabetes - People taking insulin (%)
Diet Behavior & Nutrition - Diet health (%)
Diet Behavior & Nutrition - Milk product consumption (# of products/month)
Diet Behavior & Nutrition - Meals not home prepared (#/week)
Diet Behavior & Nutrition - Meals from fast food or pizza place (#/week)
Diet Behavior & Nutrition - Ready-to-eat foods (#/month)
Diet Behavior & Nutrition - Frozen meals/pizza (#/month)
Drug Use - People that ever used marijuana or hashish (%)
Drug Use - Ever used hard drugs (%)
Drug Use - Ever used any form of cocaine (%)
Drug Use - Ever used heroin (%)
Drug Use - Ever used methamphetamine (%)
Health Insurance - People covered by health insurance (%)
Kidney Conditions-Urology - Avg. # of times urinating at night
Medical Conditions - People with asthma (%)
Medical Conditions - People with anemia (%)
Medical Conditions - People with psoriasis (%)
Medical Conditions - People with overweight (%)
Medical Conditions - Elderly people having difficulties in thinking or remembering (%)
Medical Conditions - People who ever received blood transfusion (%)
Medical Conditions - People having trouble seeing even with glass/contacts (%)
Medical Conditions - People with arthritis (%)
Medical Conditions - People with gout (%)
Medical Conditions - People with congestive heart failure (%)
Medical Conditions - People with coronary heart disease (%)
Medical Conditions - People with angina pectoris (%)
Medical Conditions - People who ever had heart attack (%)
Medical Conditions - People who ever had stroke (%)
Medical Conditions - People with emphysema (%)
Medical Conditions - People with thyroid problem (%)
Medical Conditions - People with chronic bronchitis (%)
Medical Conditions - People with any liver condition (%)
Medical Conditions - People who ever had cancer or malignancy (%)
Mental Health - People who have little interest in doing things (%)
Mental Health - People feeling down, depressed, or hopeless (%)
Mental Health - People who have trouble sleeping or sleeping too much (%)
Mental Health - People feeling tired or having little energy (%)
Mental Health - People with poor appetite or overeating (%)
Mental Health - People feeling bad about themself (%)
Mental Health - People who have trouble concentrating on things (%)
Mental Health - People moving or speaking slowly or too fast (%)
Mental Health - People having thoughts they would be better off dead (%)
Oral Health - Average years since last visit a dentist
Oral Health - People embarrassed because of mouth (%)
Oral Health - People with gum disease (%)
Oral Health - General health of teeth and gums (%)
Oral Health - Average days a week using dental floss/device
Oral Health - Average days a week using mouthwash for dental problem
Oral Health - Average number of teeth
Pesticide Use - Households using pesticides to control insects (%)
Pesticide Use - Households using pesticides to kill weeds (%)
Physical Activity - People doing vigorous-intensity work activities (%)
Physical Activity - People doing moderate-intensity work activities (%)
Physical Activity - People walking or bicycling (%)
Physical Activity - People doing vigorous-intensity recreational activities (%)
Physical Activity - People doing moderate-intensity recreational activities (%)
Physical Activity - Average hours a day doing sedentary activities
Physical Activity - Average hours a day watching TV or videos
Physical Activity - Average hours a day using computer
Physical Functioning - People having limitations keeping them from working (%)
Physical Functioning - People limited in amount of work they can do (%)
Physical Functioning - People that need special equipment to walk (%)
Physical Functioning - People experiencing confusion/memory problems (%)
Physical Functioning - People requiring special healthcare equipment (%)
Prescription Medications - Average number of prescription medicines taking
Preventive Aspirin Use - Adults 40+ taking low-dose aspirin (%)
Reproductive Health - Vaginal deliveries (%)
Reproductive Health - Cesarean deliveries (%)
Reproductive Health - Deliveries resulted in a live birth (%)
Reproductive Health - Pregnancies resulted in a delivery (%)
Reproductive Health - Women breastfeeding newborns (%)
Reproductive Health - Women that had a hysterectomy (%)
Reproductive Health - Women that had both ovaries removed (%)
Reproductive Health - Women that have ever taken birth control pills (%)
Reproductive Health - Women taking birth control pills (%)
Reproductive Health - Women that have ever used Depo-Provera or injectables (%)
Reproductive Health - Women that have ever used female hormones (%)
Sexual Behavior - People 18+ that ever had sex (vaginal, anal, or oral) (%)
Sexual Behavior - Males 18+ that ever had vaginal sex with a woman (%)
Sexual Behavior - Males 18+ that ever performed oral sex on a woman (%)
Sexual Behavior - Males 18+ that ever had anal sex with a woman (%)
Sexual Behavior - Males 18+ that ever had any sex with a man (%)
Sexual Behavior - Females 18+ that ever had vaginal sex with a man (%)
Sexual Behavior - Females 18+ that ever performed oral sex on a man (%)
Sexual Behavior - Females 18+ that ever had anal sex with a man (%)
Sexual Behavior - Females 18+ that ever had any kind of sex with a woman (%)
Sexual Behavior - Average age people first had sex
Sexual Behavior - Average number of female sex partners in lifetime (males 18+)
Sexual Behavior - Average number of female vaginal sex partners in lifetime (males 18+)
Sexual Behavior - Average age people first performed oral sex on a woman (18+)
Sexual Behavior - Average number of woman performed oral sex on in lifetime (18+)
Sexual Behavior - Average number of male sex partners in lifetime (males 18+)
Sexual Behavior - Average number of male anal sex partners in lifetime (males 18+)
Sexual Behavior - Average age people first performed oral sex on a man (18+)
Sexual Behavior - Average number of male oral sex partners in lifetime (18+)
Sexual Behavior - People using protection when performing oral sex (%)
Sexual Behavior - Average number of times people have vaginal or anal sex a year
Sexual Behavior - People having sex without condom (%)
Sexual Behavior - Average number of male sex partners in lifetime (females 18+)
Sexual Behavior - Average number of male vaginal sex partners in lifetime (females 18+)
Sexual Behavior - Average number of female sex partners in lifetime (females 18+)
Sexual Behavior - Circumcised males 18+ (%)
Sleep Disorders - Average hours sleeping at night
Sleep Disorders - People that has trouble sleeping (%)
Smoking-Cigarette Use - People smoking cigarettes (%)
Taste & Smell - People 40+ having problems with smell (%)
Taste & Smell - People 40+ having problems with taste (%)
Taste & Smell - People 40+ that ever had wisdom teeth removed (%)
Taste & Smell - People 40+ that ever had tonsils teeth removed (%)
Taste & Smell - People 40+ that ever had a loss of consciousness because of a head injury (%)
Taste & Smell - People 40+ that ever had a broken nose or other serious injury to face or skull (%)
Taste & Smell - People 40+ that ever had two or more sinus infections (%)
Weight - Average height (inches)
Weight - Average weight (pounds)
Weight - Average BMI
Weight - People that are obese (%)
Weight - People that ever were obese (%)
Weight - People trying to lose weight (%)
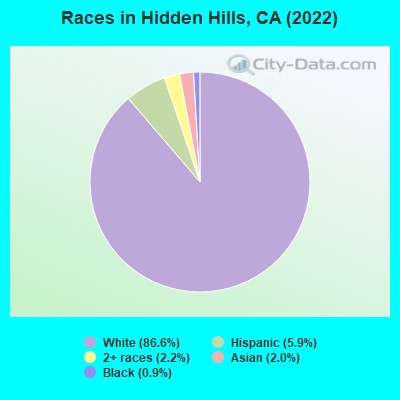
1,784 86.6% White alone 121 5.9% Hispanic 46 2.2% Two or more races 42 2.0% Asian alone 19 0.9% Black alone
Officers per 1,000 residents here:
0.52California average:
1.98
Latest news from Hidden Hills, CA collected exclusively by city-data.com from local newspapers, TV, and radio stations
Ancestries: American (17.2%), European (7.1%), British (5.9%), Canadian (5.1%), Italian (5.0%), Irish (4.4%).
Current Local Time:
Land area: 1.65 square miles.
Population density: 1,025 people per square mile (low).
299 residents are foreign born (4.9% Europe , 3.9% North America , 3.4% Latin America , 1.5% Asia ).
This city:
14.5%California:
26.5%
Median real estate property taxes paid for housing units with mortgages in 2022: $10,281 (0.5%)Median real estate property taxes paid for housing units with no mortgage in 2022: $10,472 (0.5%)
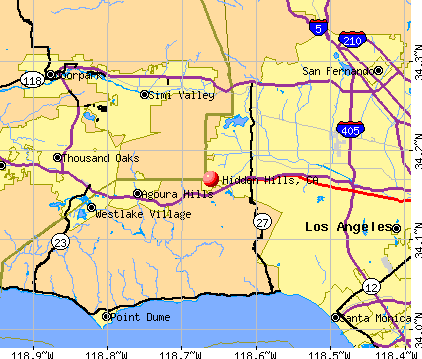
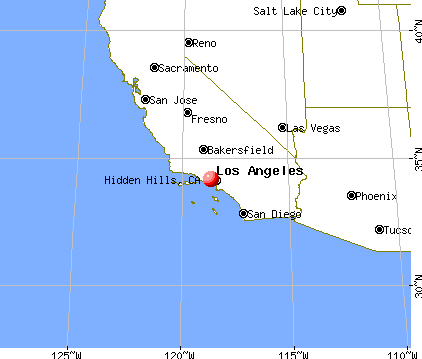
Nearest city with pop. 50,000+: Simi Valley, CA
Nearest city with pop. 200,000+: Los Angeles, CA
Nearest cities:
Latitude: 34.17 N, Longitude: 118.66 W
Area code commonly used in this area: 805
Property values in Hidden Hills, CA
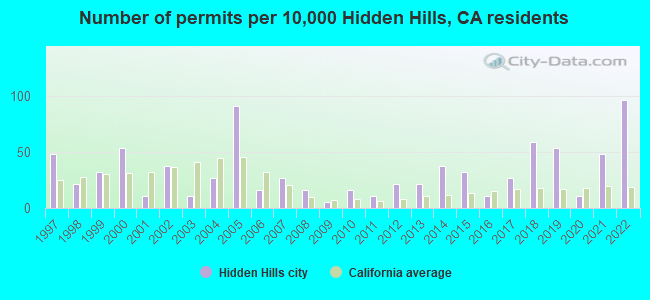
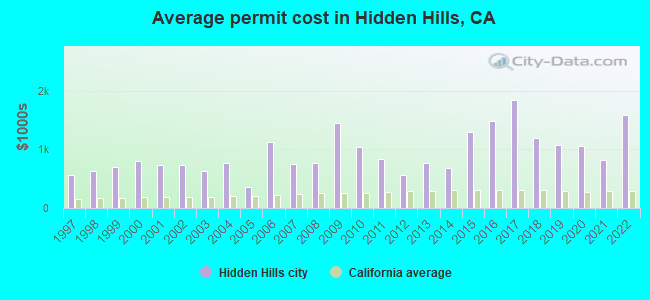
Single-family new house construction building permits:
2022: 18 buildings , average cost: $1,594,1002021: 9 buildings , average cost: $812,4002020: 2 buildings , average cost: $1,052,6002019: 10 buildings , average cost: $1,084,0002018: 11 buildings , average cost: $1,200,5002017: 5 buildings , average cost: $1,844,5002016: 2 buildings , average cost: $1,478,1002015: 6 buildings , average cost: $1,291,2002014: 7 buildings , average cost: $687,6002013: 4 buildings , average cost: $767,2002012: 4 buildings , average cost: $569,3002011: 2 buildings , average cost: $830,9002010: 3 buildings , average cost: $1,040,5002009: 1 building , cost: $1,445,4002008: 3 buildings , average cost: $761,8002007: 5 buildings , average cost: $749,9002006: 3 buildings , average cost: $1,120,2002005: 17 buildings , average cost: $361,4002004: 5 buildings , average cost: $765,0002003: 2 buildings , average cost: $631,6002002: 7 buildings , average cost: $739,5002001: 2 buildings , average cost: $735,2002000: 10 buildings , average cost: $797,6001999: 6 buildings , average cost: $705,3001998: 4 buildings , average cost: $636,0001997: 9 buildings , average cost: $570,800Unemployment in December 2023: Population change in the 1990s: +143 (+8.3%).
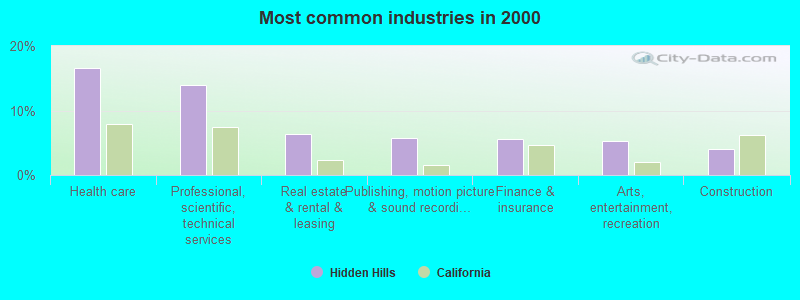
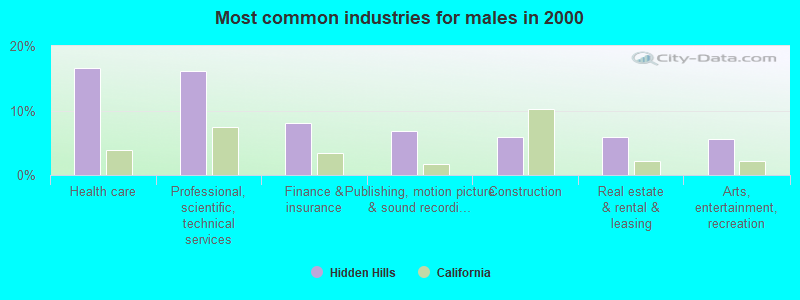
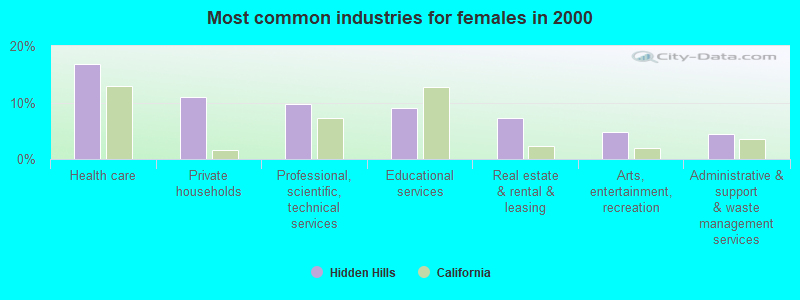
Most common industries in Hidden Hills, CA (%)
Both Males Females
Health care (16.6%)
Professional, scientific, technical services (13.9%)
Real estate & rental & leasing (6.4%)
Publishing, motion picture & sound recording industries (5.7%)
Finance & insurance (5.6%)
Arts, entertainment, recreation (5.2%)
Construction (4.1%)
Health care (16.5%)
Professional, scientific, technical services (16.1%)
Finance & insurance (8.1%)
Publishing, motion picture & sound recording industries (6.9%)
Construction (5.9%)
Real estate & rental & leasing (5.9%)
Arts, entertainment, recreation (5.5%)
Health care (16.7%)
Private households (10.9%)
Professional, scientific, technical services (9.8%)
Educational services (9.1%)
Real estate & rental & leasing (7.3%)
Arts, entertainment, recreation (4.7%)
Administrative & support & waste management services (4.4%)
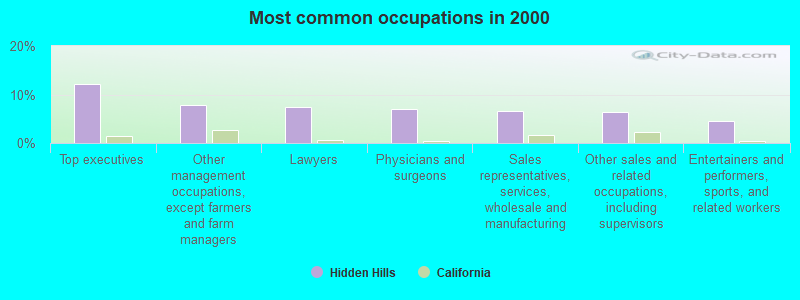
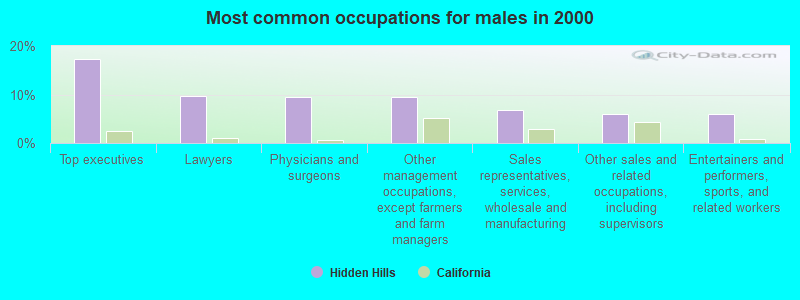
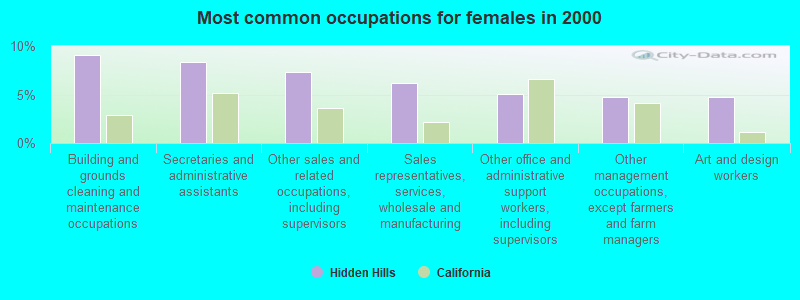
Most common occupations in Hidden Hills, CA (%)
Both Males Females
Top executives (12.3%)
Other management occupations, except farmers and farm managers (7.8%)
Lawyers (7.4%)
Physicians and surgeons (7.0%)
Sales representatives, services, wholesale and manufacturing (6.6%)
Other sales and related occupations, including supervisors (6.4%)
Entertainers and performers, sports, and related workers (4.6%)
Top executives (17.3%)
Lawyers (9.6%)
Physicians and surgeons (9.4%)
Other management occupations, except farmers and farm managers (9.4%)
Sales representatives, services, wholesale and manufacturing (6.9%)
Other sales and related occupations, including supervisors (5.9%)
Entertainers and performers, sports, and related workers (5.9%)
Building and grounds cleaning and maintenance occupations (9.1%)
Secretaries and administrative assistants (8.4%)
Other sales and related occupations, including supervisors (7.3%)
Sales representatives, services, wholesale and manufacturing (6.2%)
Other office and administrative support workers, including supervisors (5.1%)
Other management occupations, except farmers and farm managers (4.7%)
Art and design workers (4.7%)
Earthquake activity:
Hidden Hills-area historical earthquake activity is significantly above California state average. It is 6917% greater than the overall U.S. average. On 7/21/1952 at 11:52:14, a magnitude 7.7 (7.7 UK, Class: Major, Intensity: VIII - XII) earthquake occurred 60.7 miles away from the city center, causing $50,000,000 total damage On 6/28/1992 at 11:57:34, a magnitude 7.6 (6.2 MB, 7.6 MS, 7.3 MW, Depth: 0.7 mi) earthquake occurred 121.8 miles away from the city center, causing 3 deaths ( 1 shaking deaths, 2 other deaths) and 400 injuries, causing $100,000,000 total damage and $40,000,000 insured lossesOn 11/4/1927 at 13:51:53, a magnitude 7.5 (7.5 UK) earthquake occurred 144.6 miles away from the city center On 10/16/1999 at 09:46:44, a magnitude 7.4 (6.3 MB, 7.4 MS, 7.2 MW, 7.3 ML) earthquake occurred 129.4 miles away from the city center On 1/17/1994 at 12:30:55, a magnitude 6.8 (6.4 MB, 6.8 MS, 6.7 MW, Depth: 11.4 mi, Class: Strong, Intensity: VII - IX) earthquake occurred 5.0 miles away from the city center, causing 60 deaths ( 60 shaking deaths) and 7000 injuriesOn 4/21/1918 at 22:32:30, a magnitude 6.8 (6.8 UK) earthquake occurred 74.2 miles away from the city center Magnitude types: body-wave magnitude (MB), local magnitude (ML), surface-wave magnitude (MS), moment magnitude (MW) Natural disasters: The number of natural disasters in Los Angeles County (57) is a lot greater than the US average (15).Major Disasters (Presidential) Declared: 27Emergencies Declared: 3Fires: 37, Floods: 16, Storms: 9, Winter Storms: 6, Landslides: 5, Mudslides: 5, Earthquakes: 3, Freeze: 1, Heavy Rain: 1, Hurricane: 1, Snow: 1, Tornado: 1, Wind: 1, Other: 1 (Note: some incidents may be assigned to more than one category). Hospitals and medical centers near Hidden Hills: MOTION PICTURE AND T.V. HOSP D/P SNF (Nursing Home, about 2 miles away; WOODLAND HILLS, CA)
ABSOLUT HOME HEALTH CARE, INC. (Home Health Center, about 3 miles away; WEST HILLS, CA)
SAN FERNANDO WEST KIDNEY CENTER (Dialysis Facility, about 3 miles away; WEST HILLS, CA)
WEST HILLS HOSPITAL & MEDICAL CENTER (about 3 miles away; WEST HILLS, CA)
MEDSHARES H C SO CA (Home Health Center, about 3 miles away; WEST HILLS, CA)
VALLEY PARK MEDICAL CENTER (Hospital, about 4 miles away; CANOGA PARK, CA)
WEST VALLEY HEALTHCARE CENTER (Nursing Home, about 4 miles away; WEST HILLS, CA)
Amtrak stations near Hidden Hills: 8 miles: CHATSWORTH (21510 DEVONSHIRE ST.) Services: public payphones, free short-term parking, free long-term parking, taxi stand, public transit connection.
8 miles: SIMI VALLEY (5000 E. LOS ANGELES AVE.) Services: public payphones, free short-term parking, call for taxi service, public transit connection.
11 miles: VAN NUYS/FLYAWAY (VAN NUYS, 7610 WOODLEY AVE.) - Bus Station Services: fully wheelchair accessible, enclosed waiting area, public restrooms, public payphones, snack bar, paid short-term parking, paid long-term parking, call for taxi service.
Colleges/universities with over 2000 students nearest to Hidden Hills:
Los Angeles Pierce College (about 5 miles; Woodland Hills, CA ; Full-time enrollment: 10,996)
California State University-Northridge (about 10 miles; Northridge, CA ; FT enrollment: 28,060)
Pepperdine University (about 10 miles; Malibu, CA ; FT enrollment: 6,722)
Mount St Mary's College (about 12 miles; Los Angeles, CA ; FT enrollment: 2,431)
California Lutheran University (about 14 miles; Thousand Oaks, CA ; FT enrollment: 4,103)
Moorpark College (about 14 miles; Moorpark, CA ; FT enrollment: 9,338)
Los Angeles Valley College (about 14 miles; Valley Glen, CA ; FT enrollment: 9,459)
Private high school in Hidden Hills: MESIVTA OF GREATER LOS ANGELES Students: 55, Location: 25115 MUREAU RD, Grades: 9-12, Boys only )
Birthplace of: Josh Satin - Baseball player, Joey Ellis - College basketball player (UCLA Bruins).
Los Angeles County has a predicted average indoor radon screening level between 2 and 4 pCi/L (pico curies per liter) - Moderate Potential Average household size: This city:
3.1 peopleCalifornia:
2.9 people
Percentage of family households: This city:
87.2%Whole state:
68.7%
Percentage of households with unmarried partners: This city:
2.5%Whole state:
7.2%
Likely homosexual households (counted as self-reported same-sex unmarried-partner households)
Lesbian couples: 0.3% of all households Gay men: 0.7% of all households
For population 15 years and over in Hidden Hills:
Never married: 24.6%Now married: 65.9%Separated: 0.5%Widowed: 4.7%Divorced: 4.3% For population 25 years and over in Hidden Hills:
High school or higher: 95.6%Bachelor's degree or higher: 69.3%Graduate or professional degree: 32.5%Unemployed: 2.0%Mean travel time to work (commute): 19.2 minutes
Education Gini index (Inequality in education) Here:
9.5California average:
15.5
Religion statistics for Hidden Hills, CA (based on Los Angeles County data)
Religion Adherents Congregations Catholic 3,542,994 275 Evangelical Protestant 814,611 3,249 Other 451,594 1,023 Mainline Protestant 229,056 860 Black Protestant 112,338 290 Orthodox 63,517 76 None 4,604,495 -
Source: Clifford Grammich, Kirk Hadaway, Richard Houseal, Dale E.Jones, Alexei Krindatch, Richie Stanley and Richard H.Taylor. 2012. 2010 U.S.Religion Census: Religious Congregations & Membership Study. Association of Statisticians of American Religious Bodies. Jones, Dale E., et al. 2002. Congregations and Membership in the United States 2000. Nashville, TN: Glenmary Research Center. Graphs represent county-level data
Food Environment Statistics: Number of grocery stores : 2,084Here :
2.12 / 10,000 pop.California :
2.14 / 10,000 pop.
Number of supercenters and club stores : 32Los Angeles County :
0.03 / 10,000 pop.California :
0.04 / 10,000 pop.
Number of convenience stores (no gas) : 567Here :
0.58 / 10,000 pop.California :
0.62 / 10,000 pop.
Number of convenience stores (with gas) : 1,206This county :
1.23 / 10,000 pop.California :
1.49 / 10,000 pop.
Number of full-service restaurants : 7,008Los Angeles County :
7.15 / 10,000 pop.California :
7.42 / 10,000 pop.
Adult diabetes rate : Los Angeles County :
7.5%California :
7.3%
Adult obesity rate : Los Angeles County :
20.4%California :
21.3%
Low-income preschool obesity rate : Here :
18.6%California :
17.9%
Health and Nutrition: Healthy diet rate : This city:
53.9%California:
49.4%
Average overall health of teeth and gums : Here:
55.4%California:
48.0%
Average BMI : Hidden Hills:
28.3State:
28.1
People feeling badly about themselves : Hidden Hills:
22.4%California:
20.2%
People not drinking alcohol at all : Here:
10.6%California:
11.2%
Average hours sleeping at night : Hidden Hills:
7.0California:
6.8
Overweight people : Here:
40.4%California:
31.5%
General health condition : Here:
59.9%California:
56.4%
Average condition of hearing : This city:
82.7%California:
80.9%
More about Health and Nutrition of Hidden Hills, CA Residents
Local government employment and payroll (March 2022)
Function
Full-time employees
Monthly full-time payroll
Average yearly full-time wage
Part-time employees
Monthly part-time payroll
Other Government Administration
3 $30,408 $121,632 0 $0 Financial Administration
1 $6,896 $82,752 0 $0
Totals for Government
4 $37,304 $111,912 0 $0
Hidden Hills government finances - Expenditure in 2017 (per resident):
Current Operations - Central Staff Services: $954,000 ($563.16)
Police Protection: $469,000 ($276.86)Protective Inspection and Regulation - Other: $377,000 ($222.55)Solid Waste Management: $247,000 ($145.81)Financial Administration: $102,000 ($60.21)General - Other: $44,000 ($25.97)Regular Highways: $41,000 ($24.20)Transit Utilities: $22,000 ($12.99)Parks and Recreation: $7,000 ($4.13)Health - Other: $3,000 ($1.77)Other Capital Outlay - Regular Highways: $19,000 ($11.22)
Hidden Hills government finances - Revenue in 2017 (per resident):
Charges - Other: $78,000 ($46.04)
Parks and Recreation: $32,000 ($18.89)Solid Waste Management: $13,000 ($7.67)Federal Intergovernmental - Other: $35,000 ($20.66)
Miscellaneous - Interest Earnings: $27,000 ($15.94)
Donations From Private Sources: $1,000 ($0.59)State Intergovernmental - Other: $155,000 ($91.50)
Highways: $45,000 ($26.56)General Local Government Support: $2,000 ($1.18)Tax - Property: $1,149,000 ($678.28)
Other License: $611,000 ($360.68)General Sales and Gross Receipts: $195,000 ($115.11)Documentary and Stock Transfer: $93,000 ($54.90)Public Utilities Sales: $70,000 ($41.32)Occupation and Business License - Other: $59,000 ($34.83)
Hidden Hills government finances - Cash and Securities in 2017 (per resident):
Other Funds - Cash and Securities: $8,734,000 ($5155.84)
2.98% of this county's 2021 resident taxpayers lived in other counties in 2020 ($81,235 average adjusted gross income )
Here:
2.98%California average:
5.19%
0.01% of residents moved from foreign countries ($155 average AGI )Los Angeles County:
0.01%California average:
0.03%
Top counties from which taxpayers relocated into this county between 2020 and 2021:
4.68% of this county's 2020 resident taxpayers moved to other counties in 2021 ($97,324 average adjusted gross income )
Here:
4.68%California average:
6.14%
0.01% of residents moved to foreign countries ($196 average AGI )Los Angeles County:
0.01%California average:
0.02%
Top counties to which taxpayers relocated from this county between 2020 and 2021: Strongest AM radio stations in Hidden Hills:
KSPN (710 AM; 50 kW; LOS ANGELES, CA; Owner: KABC-AM RADIO, INC.)
KACD (850 AM; 25 kW; THOUSAND OAKS, CA; Owner: CITICASTERS LICENSES, L.P.)
KSUR (1260 AM; 25 kW; BEVERLY HILLS, CA)
KFWB (980 AM; 50 kW; LOS ANGELES, CA; Owner: INFINITY BROADCASTING OPERATIONS, INC.)
KNX (1070 AM; 50 kW; LOS ANGELES, CA; Owner: INFINITY BROADCASTING OPERATIONS, INC.)
KBLA (1580 AM; 50 kW; SANTA MONICA, CA)
KLAC (570 AM; 50 kW; LOS ANGELES, CA; Owner: AMFM RADIO LICENSES, L.L.C.)
KMPC (1540 AM; 50 kW; LOS ANGELES, CA; Owner: ROSE CITY RADIO CORPORATION)
KFI (640 AM; 50 kW; LOS ANGELES, CA; Owner: CAPSTAR TX LIMITED PARTNERSHIP)
KRLA (870 AM; 20 kW; GLENDALE, CA; Owner: NEW INSPIRATION BROADCASTING COMPANY)
KDIS (1110 AM; 50 kW; PASADENA, CA; Owner: ABC,INC.)
KTNQ (1020 AM; 50 kW; LOS ANGELES, CA; Owner: KTNQ-AM LICENSE CORP.)
KXMX (1190 AM; 25 kW; ANAHEIM, CA; Owner: NEW INSPIRATION BROADCASTING COMPANY)
Strongest FM radio stations in Hidden Hills:
KMRO-FM1 (90.3 FM; CAMARILLO, CA; Owner: THE ASSOCIATION FOR COMMUNITY EDUCATION, INC.)
KKBT (100.3 FM; LOS ANGELES, CA; Owner: RADIO ONE LICENSES, LLC)
KCSN (88.5 FM; NORTHRIDGE, CA; Owner: CALIFORNIA STATE UNIVERSITY, NORTHRIDGE)
K220FR (91.9 FM; SIMI VALLEY, CA; Owner: LIFE ON THE WAY COMMUNICATIONS, INC.)
KRTH-FM (101.1 FM; LOS ANGELES, CA; Owner: INFINITY BROADCASTING OPERATIONS, INC.)
KZLA-FM (93.9 FM; LOS ANGELES, CA; Owner: EMMIS RADIO LICENSE CORPORATION)
KPWR (105.9 FM; LOS ANGELES, CA; Owner: EMMIS RADIO LICENSE CORPORATION)
K261AB (100.1 FM; NEWHALL, ETC., CA; Owner: RADIO ONE LICENSES, LLC)
KLSX (97.1 FM; LOS ANGELES, CA; Owner: INFINITY BROADCASTING OPERATIONS, INC.)
KUSC (91.5 FM; LOS ANGELES, CA; Owner: UNIVERSITY OF SOUTHERN CALIFORNIA)
KKLA-FM (99.5 FM; LOS ANGELES, CA; Owner: NEW INSPIRATION BROADCASTING CO., INC.)
KCBS-FM (93.1 FM; LOS ANGELES, CA; Owner: INFINITY BROADCASTING OPERATIONS, INC.)
KYSR (98.7 FM; LOS ANGELES, CA; Owner: AMFM RADIO LICENSES, L.L.C.)
KSCA (101.9 FM; GLENDALE, CA; Owner: HBC LICENSE CORPORATION)
K212FA (90.3 FM; TEMPLE CITY, CA; Owner: EDUCATIONAL MEDIA FOUNDATION)
KLOS (95.5 FM; LOS ANGELES, CA; Owner: KLOS-FM RADIO, INC.)
KCRW (89.9 FM; SANTA MONICA, CA; Owner: SANTA MONICA COMM. COLLEGE DISTRICT)
KOST (103.5 FM; LOS ANGELES, CA; Owner: CAPSTAR TX LIMITED PARTNERSHIP)
KLVE (107.5 FM; LOS ANGELES, CA; Owner: KLVE-FM LICENSE CORP.)
KIIS-FM (102.7 FM; LOS ANGELES, CA; Owner: CITICASTERS LICENSES, L.P.)
TV broadcast stations around Hidden Hills:
KTRO-LP (Channel 50; LANCASTER, CA; Owner: ROBERT D. ADELMAN)
KSMV-LP (Channel 33; LOS ANGELES, CA; Owner: KJLA, LLC)
KCBS-TV (Channel 2; LOS ANGELES, CA; Owner: CBS BROADCASTING INC.)
K38CY (Channel 38; VAN NUYS, CA; Owner: CAPITAL BROADCASTING CORPORATION)
KADY-TV (Channel 63; OXNARD, CA; Owner: BILTMORE BROADCASTING, L.L.C.)
KWJD-LP (Channel 25; VAN NUYS, CA; Owner: FRIENDLY BROADCASTING COMPANY)
KSCI1 (Channel 18; SIMI VALLEY/NEWHALL, CA; Owner: KSLS, INC.)
Hidden Hills fatal accident list:
Jan 1, 1986 01:50 AM, Jimbridger, Vehicles: 1, Persons: 2, Fatalities: 1, Drunk persons involved: 1
FCC Registered Antenna Towers: 17 (
See the full list of FCC Registered Antenna Towers in Hidden Hills )
FCC Registered Broadcast Land Mobile Towers: 3
ROUND MEADOW GATE, Round Meadow Rd., 1000 Feet South Of John Coulter Rd. (Lat: 34.154167 Lon: -118.664722), Type: Pole, Structure height: 4 m, Overall height: 4.8 m, Call Sign: WPFM463, Assigned Frequencies: 453.200 MHz, 458.200 MHz, Grant Date: 10/01/2014, Expiration Date: 08/11/2024, Registrant: 6165 Spring Valley Road, Hidden Hills, CA 91302, Phone: (818) 888-9281, Email:
Lat: 34.168000 Lon: -118.659750, Call Sign: WREK370, Assigned Frequencies: 464.187 MHz, 469.187 MHz, 464.100 MHz, 469.100 MHz, 464.262 MHz, Grant Date: 10/19/2019, Expiration Date: 10/19/2029, Certifier: Shannon Moore, Registrant: Business Radio Licensing, 30251 Golden Lantern Ste E, Laguna Niguel, CA 92677, Phone: (949) 348-8510, Fax: (949) 348-8514, Email:
Lat: 34.159639 Lon: -118.652472, Call Sign: WREP965, Assigned Frequencies: 464.112 MHz, 469.112 MHz, 469.162 MHz, 464.162 MHz, 464.337 MHz, Grant Date: 11/23/2019, Expiration Date: 11/23/2029, Certifier: Jose G Ibarra, Registrant: Business Radio Licensing, 30251 Golden Lantern, Suite E, Laguna Niguel, CA 92677, Phone: (949) 348-8510, Fax: (949) 348-8514, Email:
FCC Registered Microwave Towers: 8 (
See the full list of FCC Registered Microwave Towers in this town )
FCC Registered Amateur Radio Licenses: 17 (
See the full list of FCC Registered Amateur Radio Licenses in Hidden Hills )
FAA Registered Aircraft: 4
Aircraft: EMBRAER EXECUTIVE AIRCRAFT INC EMB-500 (Category: Land, Engines: 2, Seats: 6, Weight: Up to 12,499 Pounds), Engine: P&W CANADA PW617F-E (1820 Pounds of Thrust) (Turbo-fan)N-Number: 285GC, N285GC, N-285GC, Serial Number: 50000285, Year manufactured: 2012, Airworthiness Date: 09/19/2012, Certificate Issue Date: 01/23/2013Registrant (Corporation): Ashley Construction Inc, 5300 Whitman Rd, Hidden Hills, CA 91302Aircraft: PILATUS AIRCRAFT LTD PC-12/47 (Category: Land, Seats: 12, Weight: Up to 12,499 Pounds), Engine: P&W CANADA PT6A-67B (1200 HP) (Turbo-prop)N-Number: 739S, N739S, N-739S, Serial Number: 844, Year manufactured: 2007, Airworthiness Date: 09/06/2007, Certificate Issue Date: 08/26/2019Registrant (Co-Owned): Management Inc Bag, 24501 Wingfield Rd, Hidden Hills, CA 91302, Other Owners: Aircraft Solutions Inc Trustee TvpxAircraft: PIPER PA-32R-301T (Category: Land, Seats: 7, Weight: Up to 12,499 Pounds), Engine: LYCOMING TI0-540 SER (310 HP) (Reciprocating)N-Number: 82173, N82173, N-82173, Serial Number: 32R-8229055, Year manufactured: 1982, Airworthiness Date: 05/28/1982, Certificate Issue Date: 04/01/1996Registrant (Co-Owned): Hugh K Gagnier, 5395 Round Meadow Rd, Hidden Hills, CA 91302, Other Owners: Kimberly GagnierAircraft: CESSNA 650 (Category: Land, Engines: 2, Seats: 12, Weight: 12,500 - 19,999 Pounds), Engine: GARRETT TFE731 SERIES (3500 Pounds of Thrust) (Turbo-fan)N-Number: 993LC, N993LC, N-993LC, Serial Number: 650-0027, Year manufactured: 1984, Airworthiness Date: 02/24/1984, Certificate Issue Date: 08/30/2007Registrant (LLC): D & R Ventures LLC, 6074 John Muir Rd, Hidden Hills, CA 91302Deregistered: Cancel Date: 09/09/2019, Exported to: Mexico
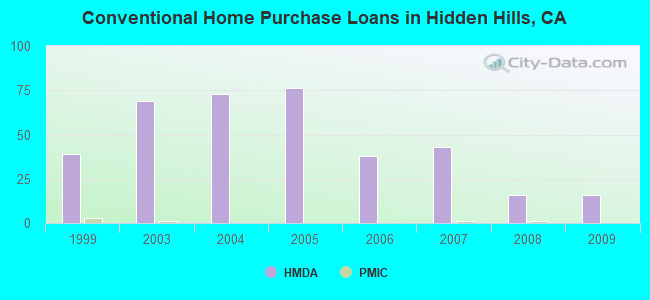
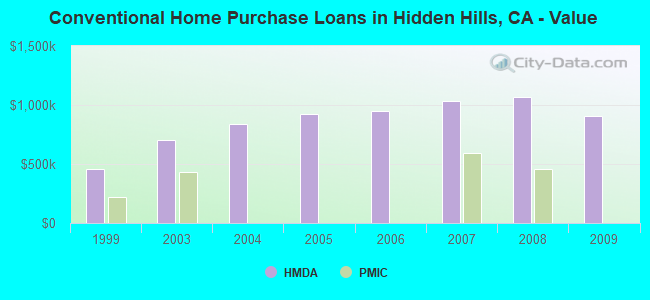
Home Mortgage Disclosure Act Aggregated Statistics For Year 2009(Based on 1 partial tract) A) FHA, FSA/RHS & VA B) Conventional C) Refinancings D) Home Improvement Loans F) Non-occupant Loans on Number Average Value Number Average Value Number Average Value Number Average Value Number Average Value
LOANS ORIGINATED 1 $354,930 16 $907,654 80 $627,955 1 $526,660 4 $568,805 APPLICATIONS APPROVED, NOT ACCEPTED 0 $0 3 $1,051,540 7 $698,540 0 $0 1 $217,290 APPLICATIONS DENIED 0 $0 7 $808,891 29 $1,002,389 0 $0 4 $821,968 APPLICATIONS WITHDRAWN 0 $0 6 $765,067 18 $867,554 0 $0 2 $456,140 FILES CLOSED FOR INCOMPLETENESS 0 $0 1 $1,148,330 4 $771,542 0 $0 1 $448,220
Aggregated Statistics For Year 2008(Based on 1 partial tract) B) Conventional C) Refinancings D) Home Improvement Loans F) Non-occupant Loans on Number Average Value Number Average Value Number Average Value Number Average Value
LOANS ORIGINATED 16 $1,068,597 29 $764,593 1 $312,300 5 $495,044 APPLICATIONS APPROVED, NOT ACCEPTED 4 $640,608 7 $734,941 0 $0 0 $0 APPLICATIONS DENIED 6 $979,150 16 $939,276 2 $998,150 1 $782,930 APPLICATIONS WITHDRAWN 6 $976,023 8 $1,161,271 1 $597,310 0 $0 FILES CLOSED FOR INCOMPLETENESS 1 $1,761,470 2 $683,175 0 $0 0 $0
Aggregated Statistics For Year 2007(Based on 1 partial tract) B) Conventional C) Refinancings D) Home Improvement Loans F) Non-occupant Loans on Number Average Value Number Average Value Number Average Value Number Average Value
LOANS ORIGINATED 43 $1,032,433 59 $954,272 6 $647,285 7 $589,581 APPLICATIONS APPROVED, NOT ACCEPTED 9 $1,251,481 12 $1,012,788 0 $0 3 $942,490 APPLICATIONS DENIED 12 $1,196,665 29 $916,104 3 $536,977 3 $482,733 APPLICATIONS WITHDRAWN 7 $1,220,506 10 $953,597 0 $0 1 $1,621,650 FILES CLOSED FOR INCOMPLETENESS 3 $499,460 4 $734,392 0 $0 0 $0
Aggregated Statistics For Year 2006(Based on 1 partial tract) B) Conventional C) Refinancings D) Home Improvement Loans F) Non-occupant Loans on Number Average Value Number Average Value Number Average Value Number Average Value
LOANS ORIGINATED 38 $947,771 74 $842,286 10 $603,032 11 $555,939 APPLICATIONS APPROVED, NOT ACCEPTED 10 $932,160 14 $822,794 1 $292,320 1 $466,740 APPLICATIONS DENIED 17 $1,119,471 32 $1,053,654 4 $620,692 1 $613,630 APPLICATIONS WITHDRAWN 11 $1,157,765 16 $852,737 1 $432,390 2 $309,250 FILES CLOSED FOR INCOMPLETENESS 2 $909,845 4 $951,135 0 $0 0 $0
Aggregated Statistics For Year 2005(Based on 1 partial tract) B) Conventional C) Refinancings D) Home Improvement Loans F) Non-occupant Loans on Number Average Value Number Average Value Number Average Value Number Average Value
LOANS ORIGINATED 76 $921,238 102 $786,964 10 $608,172 12 $625,971 APPLICATIONS APPROVED, NOT ACCEPTED 13 $874,449 14 $906,488 1 $574,900 1 $157,610 APPLICATIONS DENIED 19 $962,925 31 $999,656 4 $640,362 4 $501,268 APPLICATIONS WITHDRAWN 16 $903,573 24 $679,025 2 $678,060 1 $838,230 FILES CLOSED FOR INCOMPLETENESS 4 $1,180,425 8 $769,198 1 $584,640 0 $0
Aggregated Statistics For Year 2004(Based on 1 partial tract) B) Conventional C) Refinancings D) Home Improvement Loans F) Non-occupant Loans on Number Average Value Number Average Value Number Average Value Number Average Value
LOANS ORIGINATED 73 $841,928 155 $659,252 7 $659,913 12 $371,855 APPLICATIONS APPROVED, NOT ACCEPTED 13 $906,342 26 $655,003 0 $0 1 $254,810 APPLICATIONS DENIED 18 $870,883 37 $583,192 4 $561,925 4 $411,440 APPLICATIONS WITHDRAWN 16 $793,908 24 $617,719 1 $216,560 2 $496,580 FILES CLOSED FOR INCOMPLETENESS 2 $792,185 8 $692,981 0 $0 0 $0
Aggregated Statistics For Year 2003(Based on 1 partial tract) B) Conventional C) Refinancings D) Home Improvement Loans F) Non-occupant Loans on Number Average Value Number Average Value Number Average Value Number Average Value
LOANS ORIGINATED 69 $703,894 345 $541,656 2 $291,465 14 $254,701 APPLICATIONS APPROVED, NOT ACCEPTED 12 $482,897 43 $555,516 0 $0 3 $276,243 APPLICATIONS DENIED 14 $623,546 46 $581,044 1 $76,000 4 $475,508 APPLICATIONS WITHDRAWN 14 $797,668 48 $455,456 0 $0 1 $551,750 FILES CLOSED FOR INCOMPLETENESS 3 $1,096,363 16 $598,982 1 $133,980 0 $0
Aggregated Statistics For Year 1999(Based on 1 partial tract) B) Conventional C) Refinancings D) Home Improvement Loans F) Non-occupant Loans on Number Average Value Number Average Value Number Average Value Number Average Value
LOANS ORIGINATED 39 $460,690 60 $449,844 3 $61,363 3 $235,067 APPLICATIONS APPROVED, NOT ACCEPTED 8 $485,211 11 $429,309 1 $53,790 1 $105,600 APPLICATIONS DENIED 10 $507,514 17 $439,851 1 $44,810 1 $272,000 APPLICATIONS WITHDRAWN 11 $363,837 9 $337,439 0 $0 0 $0 FILES CLOSED FOR INCOMPLETENESS 4 $309,832 4 $335,785 0 $0 0 $0
Detailed HMDA statistics for the following Tracts:
8002.01
Private Mortgage Insurance Companies Aggregated Statistics For Year 2008(Based on 1 partial tract) A) Conventional B) Refinancings Number Average Value Number Average Value
LOANS ORIGINATED 1 $454,800 1 $293,540 APPLICATIONS APPROVED, NOT ACCEPTED 0 $0 0 $0 APPLICATIONS DENIED 0 $0 0 $0 APPLICATIONS WITHDRAWN 0 $0 0 $0 FILES CLOSED FOR INCOMPLETENESS 0 $0 0 $0
Aggregated Statistics For Year 2007(Based on 1 partial tract) A) Conventional Number Average Value
LOANS ORIGINATED 1 $590,240 APPLICATIONS APPROVED, NOT ACCEPTED 0 $0 APPLICATIONS DENIED 0 $0 APPLICATIONS WITHDRAWN 0 $0 FILES CLOSED FOR INCOMPLETENESS 0 $0
Aggregated Statistics For Year 2003(Based on 1 partial tract) A) Conventional Number Average Value
LOANS ORIGINATED 1 $436,040 APPLICATIONS APPROVED, NOT ACCEPTED 0 $0 APPLICATIONS DENIED 0 $0 APPLICATIONS WITHDRAWN 0 $0 FILES CLOSED FOR INCOMPLETENESS 0 $0
Aggregated Statistics For Year 1999(Based on 1 partial tract) A) Conventional B) Refinancings Number Average Value Number Average Value
LOANS ORIGINATED 3 $218,453 1 $249,370 APPLICATIONS APPROVED, NOT ACCEPTED 0 $0 0 $0 APPLICATIONS DENIED 0 $0 0 $0 APPLICATIONS WITHDRAWN 0 $0 0 $0 FILES CLOSED FOR INCOMPLETENESS 0 $0 0 $0
Detailed PMIC statistics for the following Tracts:
8002.01
Hidden Hills compared to California state average:
Median household income above state average. Median house value significantly above state average. Unemployed percentage significantly below state average. Black race population percentage significantly below state average. Hispanic race population percentage significantly below state average. Median age significantly above state average. Foreign-born population percentage below state average. Renting percentage significantly below state average. Length of stay since moving in significantly above state average. Number of rooms per house significantly above state average. Percentage of population with a bachelor's degree or higher significantly above state average. Hidden Hills on our top lists :
#51 on the list of "Top 100 cities with highest median household income"
#70 on the list of "Top 100 cities with biggest houses"
#78 on the list of "Top 100 cities with highest median house value"
#84 (91302) on the list of "Top 101 zip codes with the largest percentage of Russian first ancestries"
#1 on the list of "Top 101 counties with the most Evangelical Protestant congregations"
#1 on the list of "Top 101 counties with the most Mainline Protestant congregations"
#1 on the list of "Top 101 counties with the most Orthodox adherents"
#1 on the list of "Top 101 counties with the highest ground withdrawal of fresh water for public supply (pop. 50,000+)"
#1 on the list of "Top 101 counties with the most Catholic adherents (pop. 50,000+)"
There are 7 pilots and no other airmen in this city.
Top Patent Applicants
James Kirk Mathews (6)
James M. Gallien (5)
Aaron B. Stibel (3)
Lance James Lortscher (2)
Bob Steven Berns (1)
Roberta Beatrice Koehi (1)
Steven Brian Weber (1)
Michael Siegel (1)
Roberta B. Koehl (1)
Ryan Michael Goldstein (1)
Total of 35 patent applications in 2008-2024.


 Recent articles from our blog. Our writers, many of them Ph.D. graduates or candidates, create easy-to-read articles on a wide variety of topics.

 (8.5 miles