Laredo, Texas Submit your own pictures of this city and show them to the world
OSM Map
General Map
Google Map
MSN Map
OSM Map
General Map
Google Map
MSN Map
OSM Map
General Map
Google Map
MSN Map
OSM Map
General Map
Google Map
MSN Map
Please wait while loading the map...
Population in 2022: 256,187 (100% urban, 0% rural). Population change since 2000: +45.1%Males: 127,493 Females: 128,694
March 2022 cost of living index in Laredo: 82.4 (low, U.S. average is 100) Percentage of residents living in poverty in 2022: 20.1%for White Non-Hispanic residents , 11.7% for Black residents , 20.8% for Hispanic or Latino residents , 12.6% for American Indian residents , 19.5% for other race residents , 21.2% for two or more races residents )
Profiles of local businesses
Business Search - 14 Million verified businesses
Data:
Median household income ($)
Median household income (% change since 2000)
Household income diversity
Ratio of average income to average house value (%)
Ratio of average income to average rent
Median household income ($) - White
Median household income ($) - Black or African American
Median household income ($) - Asian
Median household income ($) - Hispanic or Latino
Median household income ($) - American Indian and Alaska Native
Median household income ($) - Multirace
Median household income ($) - Other Race
Median household income for houses/condos with a mortgage ($)
Median household income for apartments without a mortgage ($)
Races - White alone (%)
Races - White alone (% change since 2000)
Races - Black alone (%)
Races - Black alone (% change since 2000)
Races - American Indian alone (%)
Races - American Indian alone (% change since 2000)
Races - Asian alone (%)
Races - Asian alone (% change since 2000)
Races - Hispanic (%)
Races - Hispanic (% change since 2000)
Races - Native Hawaiian and Other Pacific Islander alone (%)
Races - Native Hawaiian and Other Pacific Islander alone (% change since 2000)
Races - Two or more races (%)
Races - Two or more races (% change since 2000)
Races - Other race alone (%)
Races - Other race alone (% change since 2000)
Racial diversity
Unemployment (%)
Unemployment (% change since 2000)
Unemployment (%) - White
Unemployment (%) - Black or African American
Unemployment (%) - Asian
Unemployment (%) - Hispanic or Latino
Unemployment (%) - American Indian and Alaska Native
Unemployment (%) - Multirace
Unemployment (%) - Other Race
Population density (people per square mile)
Population - Males (%)
Population - Females (%)
Population - Males (%) - White
Population - Males (%) - Black or African American
Population - Males (%) - Asian
Population - Males (%) - Hispanic or Latino
Population - Males (%) - American Indian and Alaska Native
Population - Males (%) - Multirace
Population - Males (%) - Other Race
Population - Females (%) - White
Population - Females (%) - Black or African American
Population - Females (%) - Asian
Population - Females (%) - Hispanic or Latino
Population - Females (%) - American Indian and Alaska Native
Population - Females (%) - Multirace
Population - Females (%) - Other Race
Coronavirus confirmed cases (Apr 27, 2024)
Deaths caused by coronavirus (Apr 27, 2024)
Coronavirus confirmed cases (per 100k population) (Apr 27, 2024)
Deaths caused by coronavirus (per 100k population) (Apr 27, 2024)
Daily increase in number of cases (Apr 27, 2024)
Weekly increase in number of cases (Apr 27, 2024)
Cases doubled (in days) (Apr 27, 2024)
Hospitalized patients (Apr 18, 2022)
Negative test results (Apr 18, 2022)
Total test results (Apr 18, 2022)
COVID Vaccine doses distributed (per 100k population) (Sep 19, 2023)
COVID Vaccine doses administered (per 100k population) (Sep 19, 2023)
COVID Vaccine doses distributed (Sep 19, 2023)
COVID Vaccine doses administered (Sep 19, 2023)
Likely homosexual households (%)
Likely homosexual households (% change since 2000)
Likely homosexual households - Lesbian couples (%)
Likely homosexual households - Lesbian couples (% change since 2000)
Likely homosexual households - Gay men (%)
Likely homosexual households - Gay men (% change since 2000)
Cost of living index
Median gross rent ($)
Median contract rent ($)
Median monthly housing costs ($)
Median house or condo value ($)
Median house or condo value ($ change since 2000)
Mean house or condo value by units in structure - 1, detached ($)
Mean house or condo value by units in structure - 1, attached ($)
Mean house or condo value by units in structure - 2 ($)
Mean house or condo value by units in structure by units in structure - 3 or 4 ($)
Mean house or condo value by units in structure - 5 or more ($)
Mean house or condo value by units in structure - Boat, RV, van, etc. ($)
Mean house or condo value by units in structure - Mobile home ($)
Median house or condo value ($) - White
Median house or condo value ($) - Black or African American
Median house or condo value ($) - Asian
Median house or condo value ($) - Hispanic or Latino
Median house or condo value ($) - American Indian and Alaska Native
Median house or condo value ($) - Multirace
Median house or condo value ($) - Other Race
Median resident age
Resident age diversity
Median resident age - Males
Median resident age - Females
Median resident age - White
Median resident age - Black or African American
Median resident age - Asian
Median resident age - Hispanic or Latino
Median resident age - American Indian and Alaska Native
Median resident age - Multirace
Median resident age - Other Race
Median resident age - Males - White
Median resident age - Males - Black or African American
Median resident age - Males - Asian
Median resident age - Males - Hispanic or Latino
Median resident age - Males - American Indian and Alaska Native
Median resident age - Males - Multirace
Median resident age - Males - Other Race
Median resident age - Females - White
Median resident age - Females - Black or African American
Median resident age - Females - Asian
Median resident age - Females - Hispanic or Latino
Median resident age - Females - American Indian and Alaska Native
Median resident age - Females - Multirace
Median resident age - Females - Other Race
Commute - mean travel time to work (minutes)
Travel time to work - Less than 5 minutes (%)
Travel time to work - Less than 5 minutes (% change since 2000)
Travel time to work - 5 to 9 minutes (%)
Travel time to work - 5 to 9 minutes (% change since 2000)
Travel time to work - 10 to 19 minutes (%)
Travel time to work - 10 to 19 minutes (% change since 2000)
Travel time to work - 20 to 29 minutes (%)
Travel time to work - 20 to 29 minutes (% change since 2000)
Travel time to work - 30 to 39 minutes (%)
Travel time to work - 30 to 39 minutes (% change since 2000)
Travel time to work - 40 to 59 minutes (%)
Travel time to work - 40 to 59 minutes (% change since 2000)
Travel time to work - 60 to 89 minutes (%)
Travel time to work - 60 to 89 minutes (% change since 2000)
Travel time to work - 90 or more minutes (%)
Travel time to work - 90 or more minutes (% change since 2000)
Marital status - Never married (%)
Marital status - Now married (%)
Marital status - Separated (%)
Marital status - Widowed (%)
Marital status - Divorced (%)
Median family income ($)
Median family income (% change since 2000)
Median non-family income ($)
Median non-family income (% change since 2000)
Median per capita income ($)
Median per capita income (% change since 2000)
Median family income ($) - White
Median family income ($) - Black or African American
Median family income ($) - Asian
Median family income ($) - Hispanic or Latino
Median family income ($) - American Indian and Alaska Native
Median family income ($) - Multirace
Median family income ($) - Other Race
Median year house/condo built
Median year apartment built
Year house built - Built 2005 or later (%)
Year house built - Built 2000 to 2004 (%)
Year house built - Built 1990 to 1999 (%)
Year house built - Built 1980 to 1989 (%)
Year house built - Built 1970 to 1979 (%)
Year house built - Built 1960 to 1969 (%)
Year house built - Built 1950 to 1959 (%)
Year house built - Built 1940 to 1949 (%)
Year house built - Built 1939 or earlier (%)
Average household size
Household density (households per square mile)
Average household size - White
Average household size - Black or African American
Average household size - Asian
Average household size - Hispanic or Latino
Average household size - American Indian and Alaska Native
Average household size - Multirace
Average household size - Other Race
Occupied housing units (%)
Vacant housing units (%)
Owner occupied housing units (%)
Renter occupied housing units (%)
Vacancy status - For rent (%)
Vacancy status - For sale only (%)
Vacancy status - Rented or sold, not occupied (%)
Vacancy status - For seasonal, recreational, or occasional use (%)
Vacancy status - For migrant workers (%)
Vacancy status - Other vacant (%)
Residents with income below the poverty level (%)
Residents with income below 50% of the poverty level (%)
Children below poverty level (%)
Poor families by family type - Married-couple family (%)
Poor families by family type - Male, no wife present (%)
Poor families by family type - Female, no husband present (%)
Poverty status for native-born residents (%)
Poverty status for foreign-born residents (%)
Poverty among high school graduates not in families (%)
Poverty among people who did not graduate high school not in families (%)
Residents with income below the poverty level (%) - White
Residents with income below the poverty level (%) - Black or African American
Residents with income below the poverty level (%) - Asian
Residents with income below the poverty level (%) - Hispanic or Latino
Residents with income below the poverty level (%) - American Indian and Alaska Native
Residents with income below the poverty level (%) - Multirace
Residents with income below the poverty level (%) - Other Race
Air pollution - Air Quality Index (AQI)
Air pollution - CO
Air pollution - NO2
Air pollution - SO2
Air pollution - Ozone
Air pollution - PM10
Air pollution - PM25
Air pollution - Pb
Crime - Murders per 100,000 population
Crime - Rapes per 100,000 population
Crime - Robberies per 100,000 population
Crime - Assaults per 100,000 population
Crime - Burglaries per 100,000 population
Crime - Thefts per 100,000 population
Crime - Auto thefts per 100,000 population
Crime - Arson per 100,000 population
Crime - City-data.com crime index
Crime - Violent crime index
Crime - Property crime index
Crime - Murders per 100,000 population (5 year average)
Crime - Rapes per 100,000 population (5 year average)
Crime - Robberies per 100,000 population (5 year average)
Crime - Assaults per 100,000 population (5 year average)
Crime - Burglaries per 100,000 population (5 year average)
Crime - Thefts per 100,000 population (5 year average)
Crime - Auto thefts per 100,000 population (5 year average)
Crime - Arson per 100,000 population (5 year average)
Crime - City-data.com crime index (5 year average)
Crime - Violent crime index (5 year average)
Crime - Property crime index (5 year average)
1996 Presidential Elections Results (%) - Democratic Party (Clinton)
1996 Presidential Elections Results (%) - Republican Party (Dole)
1996 Presidential Elections Results (%) - Other
2000 Presidential Elections Results (%) - Democratic Party (Gore)
2000 Presidential Elections Results (%) - Republican Party (Bush)
2000 Presidential Elections Results (%) - Other
2004 Presidential Elections Results (%) - Democratic Party (Kerry)
2004 Presidential Elections Results (%) - Republican Party (Bush)
2004 Presidential Elections Results (%) - Other
2008 Presidential Elections Results (%) - Democratic Party (Obama)
2008 Presidential Elections Results (%) - Republican Party (McCain)
2008 Presidential Elections Results (%) - Other
2012 Presidential Elections Results (%) - Democratic Party (Obama)
2012 Presidential Elections Results (%) - Republican Party (Romney)
2012 Presidential Elections Results (%) - Other
2016 Presidential Elections Results (%) - Democratic Party (Clinton)
2016 Presidential Elections Results (%) - Republican Party (Trump)
2016 Presidential Elections Results (%) - Other
2020 Presidential Elections Results (%) - Democratic Party (Biden)
2020 Presidential Elections Results (%) - Republican Party (Trump)
2020 Presidential Elections Results (%) - Other
Ancestries Reported - Arab (%)
Ancestries Reported - Czech (%)
Ancestries Reported - Danish (%)
Ancestries Reported - Dutch (%)
Ancestries Reported - English (%)
Ancestries Reported - French (%)
Ancestries Reported - French Canadian (%)
Ancestries Reported - German (%)
Ancestries Reported - Greek (%)
Ancestries Reported - Hungarian (%)
Ancestries Reported - Irish (%)
Ancestries Reported - Italian (%)
Ancestries Reported - Lithuanian (%)
Ancestries Reported - Norwegian (%)
Ancestries Reported - Polish (%)
Ancestries Reported - Portuguese (%)
Ancestries Reported - Russian (%)
Ancestries Reported - Scotch-Irish (%)
Ancestries Reported - Scottish (%)
Ancestries Reported - Slovak (%)
Ancestries Reported - Subsaharan African (%)
Ancestries Reported - Swedish (%)
Ancestries Reported - Swiss (%)
Ancestries Reported - Ukrainian (%)
Ancestries Reported - United States (%)
Ancestries Reported - Welsh (%)
Ancestries Reported - West Indian (%)
Ancestries Reported - Other (%)
Educational Attainment - No schooling completed (%)
Educational Attainment - Less than high school (%)
Educational Attainment - High school or equivalent (%)
Educational Attainment - Less than 1 year of college (%)
Educational Attainment - 1 or more years of college (%)
Educational Attainment - Associate degree (%)
Educational Attainment - Bachelor's degree (%)
Educational Attainment - Master's degree (%)
Educational Attainment - Professional school degree (%)
Educational Attainment - Doctorate degree (%)
School Enrollment - Nursery, preschool (%)
School Enrollment - Kindergarten (%)
School Enrollment - Grade 1 to 4 (%)
School Enrollment - Grade 5 to 8 (%)
School Enrollment - Grade 9 to 12 (%)
School Enrollment - College undergrad (%)
School Enrollment - Graduate or professional (%)
School Enrollment - Not enrolled in school (%)
School enrollment - Public schools (%)
School enrollment - Private schools (%)
School enrollment - Not enrolled (%)
Median number of rooms in houses and condos
Median number of rooms in apartments
Housing units lacking complete plumbing facilities (%)
Housing units lacking complete kitchen facilities (%)
Density of houses
Urban houses (%)
Rural houses (%)
Households with people 60 years and over (%)
Households with people 65 years and over (%)
Households with people 75 years and over (%)
Households with one or more nonrelatives (%)
Households with no nonrelatives (%)
Population in households (%)
Family households (%)
Nonfamily households (%)
Population in families (%)
Family households with own children (%)
Median number of bedrooms in owner occupied houses
Mean number of bedrooms in owner occupied houses
Median number of bedrooms in renter occupied houses
Mean number of bedrooms in renter occupied houses
Median number of vehichles in owner occupied houses
Mean number of vehichles in owner occupied houses
Median number of vehichles in renter occupied houses
Mean number of vehichles in renter occupied houses
Mortgage status - with mortgage (%)
Mortgage status - with second mortgage (%)
Mortgage status - with home equity loan (%)
Mortgage status - with both second mortgage and home equity loan (%)
Mortgage status - without a mortgage (%)
Average family size
Average family size - White
Average family size - Black or African American
Average family size - Asian
Average family size - Hispanic or Latino
Average family size - American Indian and Alaska Native
Average family size - Multirace
Average family size - Other Race
Geographical mobility - Same house 1 year ago (%)
Geographical mobility - Moved within same county (%)
Geographical mobility - Moved from different county within same state (%)
Geographical mobility - Moved from different state (%)
Geographical mobility - Moved from abroad (%)
Place of birth - Born in state of residence (%)
Place of birth - Born in other state (%)
Place of birth - Native, outside of US (%)
Place of birth - Foreign born (%)
Housing units in structures - 1, detached (%)
Housing units in structures - 1, attached (%)
Housing units in structures - 2 (%)
Housing units in structures - 3 or 4 (%)
Housing units in structures - 5 to 9 (%)
Housing units in structures - 10 to 19 (%)
Housing units in structures - 20 to 49 (%)
Housing units in structures - 50 or more (%)
Housing units in structures - Mobile home (%)
Housing units in structures - Boat, RV, van, etc. (%)
House/condo owner moved in on average (years ago)
Renter moved in on average (years ago)
Year householder moved into unit - Moved in 1999 to March 2000 (%)
Year householder moved into unit - Moved in 1995 to 1998 (%)
Year householder moved into unit - Moved in 1990 to 1994 (%)
Year householder moved into unit - Moved in 1980 to 1989 (%)
Year householder moved into unit - Moved in 1970 to 1979 (%)
Year householder moved into unit - Moved in 1969 or earlier (%)
Means of transportation to work - Drove car alone (%)
Means of transportation to work - Carpooled (%)
Means of transportation to work - Public transportation (%)
Means of transportation to work - Bus or trolley bus (%)
Means of transportation to work - Streetcar or trolley car (%)
Means of transportation to work - Subway or elevated (%)
Means of transportation to work - Railroad (%)
Means of transportation to work - Ferryboat (%)
Means of transportation to work - Taxicab (%)
Means of transportation to work - Motorcycle (%)
Means of transportation to work - Bicycle (%)
Means of transportation to work - Walked (%)
Means of transportation to work - Other means (%)
Working at home (%)
Industry diversity
Most Common Industries - Agriculture, forestry, fishing and hunting, and mining (%)
Most Common Industries - Agriculture, forestry, fishing and hunting (%)
Most Common Industries - Mining, quarrying, and oil and gas extraction (%)
Most Common Industries - Construction (%)
Most Common Industries - Manufacturing (%)
Most Common Industries - Wholesale trade (%)
Most Common Industries - Retail trade (%)
Most Common Industries - Transportation and warehousing, and utilities (%)
Most Common Industries - Transportation and warehousing (%)
Most Common Industries - Utilities (%)
Most Common Industries - Information (%)
Most Common Industries - Finance and insurance, and real estate and rental and leasing (%)
Most Common Industries - Finance and insurance (%)
Most Common Industries - Real estate and rental and leasing (%)
Most Common Industries - Professional, scientific, and management, and administrative and waste management services (%)
Most Common Industries - Professional, scientific, and technical services (%)
Most Common Industries - Management of companies and enterprises (%)
Most Common Industries - Administrative and support and waste management services (%)
Most Common Industries - Educational services, and health care and social assistance (%)
Most Common Industries - Educational services (%)
Most Common Industries - Health care and social assistance (%)
Most Common Industries - Arts, entertainment, and recreation, and accommodation and food services (%)
Most Common Industries - Arts, entertainment, and recreation (%)
Most Common Industries - Accommodation and food services (%)
Most Common Industries - Other services, except public administration (%)
Most Common Industries - Public administration (%)
Occupation diversity
Most Common Occupations - Management, business, science, and arts occupations (%)
Most Common Occupations - Management, business, and financial occupations (%)
Most Common Occupations - Management occupations (%)
Most Common Occupations - Business and financial operations occupations (%)
Most Common Occupations - Computer, engineering, and science occupations (%)
Most Common Occupations - Computer and mathematical occupations (%)
Most Common Occupations - Architecture and engineering occupations (%)
Most Common Occupations - Life, physical, and social science occupations (%)
Most Common Occupations - Education, legal, community service, arts, and media occupations (%)
Most Common Occupations - Community and social service occupations (%)
Most Common Occupations - Legal occupations (%)
Most Common Occupations - Education, training, and library occupations (%)
Most Common Occupations - Arts, design, entertainment, sports, and media occupations (%)
Most Common Occupations - Healthcare practitioners and technical occupations (%)
Most Common Occupations - Health diagnosing and treating practitioners and other technical occupations (%)
Most Common Occupations - Health technologists and technicians (%)
Most Common Occupations - Service occupations (%)
Most Common Occupations - Healthcare support occupations (%)
Most Common Occupations - Protective service occupations (%)
Most Common Occupations - Fire fighting and prevention, and other protective service workers including supervisors (%)
Most Common Occupations - Law enforcement workers including supervisors (%)
Most Common Occupations - Food preparation and serving related occupations (%)
Most Common Occupations - Building and grounds cleaning and maintenance occupations (%)
Most Common Occupations - Personal care and service occupations (%)
Most Common Occupations - Sales and office occupations (%)
Most Common Occupations - Sales and related occupations (%)
Most Common Occupations - Office and administrative support occupations (%)
Most Common Occupations - Natural resources, construction, and maintenance occupations (%)
Most Common Occupations - Farming, fishing, and forestry occupations (%)
Most Common Occupations - Construction and extraction occupations (%)
Most Common Occupations - Installation, maintenance, and repair occupations (%)
Most Common Occupations - Production, transportation, and material moving occupations (%)
Most Common Occupations - Production occupations (%)
Most Common Occupations - Transportation occupations (%)
Most Common Occupations - Material moving occupations (%)
People in Group quarters - Institutionalized population (%)
People in Group quarters - Correctional institutions (%)
People in Group quarters - Federal prisons and detention centers (%)
People in Group quarters - Halfway houses (%)
People in Group quarters - Local jails and other confinement facilities (including police lockups) (%)
People in Group quarters - Military disciplinary barracks (%)
People in Group quarters - State prisons (%)
People in Group quarters - Other types of correctional institutions (%)
People in Group quarters - Nursing homes (%)
People in Group quarters - Hospitals/wards, hospices, and schools for the handicapped (%)
People in Group quarters - Hospitals/wards and hospices for chronically ill (%)
People in Group quarters - Hospices or homes for chronically ill (%)
People in Group quarters - Military hospitals or wards for chronically ill (%)
People in Group quarters - Other hospitals or wards for chronically ill (%)
People in Group quarters - Hospitals or wards for drug/alcohol abuse (%)
People in Group quarters - Mental (Psychiatric) hospitals or wards (%)
People in Group quarters - Schools, hospitals, or wards for the mentally retarded (%)
People in Group quarters - Schools, hospitals, or wards for the physically handicapped (%)
People in Group quarters - Institutions for the deaf (%)
People in Group quarters - Institutions for the blind (%)
People in Group quarters - Orthopedic wards and institutions for the physically handicapped (%)
People in Group quarters - Wards in general hospitals for patients who have no usual home elsewhere (%)
People in Group quarters - Wards in military hospitals for patients who have no usual home elsewhere (%)
People in Group quarters - Juvenile institutions (%)
People in Group quarters - Long-term care (%)
People in Group quarters - Homes for abused, dependent, and neglected children (%)
People in Group quarters - Residential treatment centers for emotionally disturbed children (%)
People in Group quarters - Training schools for juvenile delinquents (%)
People in Group quarters - Short-term care, detention or diagnostic centers for delinquent children (%)
People in Group quarters - Type of juvenile institution unknown (%)
People in Group quarters - Noninstitutionalized population (%)
People in Group quarters - College dormitories (includes college quarters off campus) (%)
People in Group quarters - Military quarters (%)
People in Group quarters - On base (%)
People in Group quarters - Barracks, unaccompanied personnel housing (UPH), (Enlisted/Officer), ;and similar group living quarters for military personnel (%)
People in Group quarters - Transient quarters for temporary residents (%)
People in Group quarters - Military ships (%)
People in Group quarters - Group homes (%)
People in Group quarters - Homes or halfway houses for drug/alcohol abuse (%)
People in Group quarters - Homes for the mentally ill (%)
People in Group quarters - Homes for the mentally retarded (%)
People in Group quarters - Homes for the physically handicapped (%)
People in Group quarters - Other group homes (%)
People in Group quarters - Religious group quarters (%)
People in Group quarters - Dormitories (%)
People in Group quarters - Agriculture workers' dormitories on farms (%)
People in Group quarters - Job Corps and vocational training facilities (%)
People in Group quarters - Other workers' dormitories (%)
People in Group quarters - Crews of maritime vessels (%)
People in Group quarters - Other nonhousehold living situations (%)
People in Group quarters - Other noninstitutional group quarters (%)
Residents speaking English at home (%)
Residents speaking English at home - Born in the United States (%)
Residents speaking English at home - Native, born elsewhere (%)
Residents speaking English at home - Foreign born (%)
Residents speaking Spanish at home (%)
Residents speaking Spanish at home - Born in the United States (%)
Residents speaking Spanish at home - Native, born elsewhere (%)
Residents speaking Spanish at home - Foreign born (%)
Residents speaking other language at home (%)
Residents speaking other language at home - Born in the United States (%)
Residents speaking other language at home - Native, born elsewhere (%)
Residents speaking other language at home - Foreign born (%)
Class of Workers - Employee of private company (%)
Class of Workers - Self-employed in own incorporated business (%)
Class of Workers - Private not-for-profit wage and salary workers (%)
Class of Workers - Local government workers (%)
Class of Workers - State government workers (%)
Class of Workers - Federal government workers (%)
Class of Workers - Self-employed workers in own not incorporated business and Unpaid family workers (%)
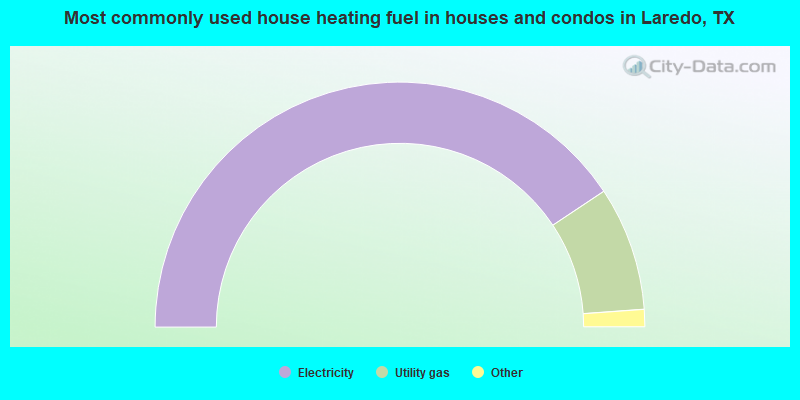
House heating fuel used in houses and condos - Utility gas (%)
House heating fuel used in houses and condos - Bottled, tank, or LP gas (%)
House heating fuel used in houses and condos - Electricity (%)
House heating fuel used in houses and condos - Fuel oil, kerosene, etc. (%)
House heating fuel used in houses and condos - Coal or coke (%)
House heating fuel used in houses and condos - Wood (%)
House heating fuel used in houses and condos - Solar energy (%)
House heating fuel used in houses and condos - Other fuel (%)
House heating fuel used in houses and condos - No fuel used (%)
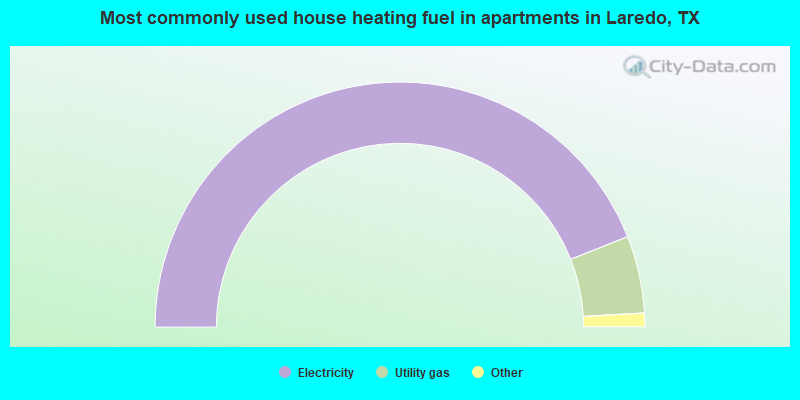
House heating fuel used in apartments - Utility gas (%)
House heating fuel used in apartments - Bottled, tank, or LP gas (%)
House heating fuel used in apartments - Electricity (%)
House heating fuel used in apartments - Fuel oil, kerosene, etc. (%)
House heating fuel used in apartments - Coal or coke (%)
House heating fuel used in apartments - Wood (%)
House heating fuel used in apartments - Solar energy (%)
House heating fuel used in apartments - Other fuel (%)
House heating fuel used in apartments - No fuel used (%)
Armed forces status - In Armed Forces (%)
Armed forces status - Civilian (%)
Armed forces status - Civilian - Veteran (%)
Armed forces status - Civilian - Nonveteran (%)
Fatal accidents locations in years 2005-2021
Fatal accidents locations in 2005
Fatal accidents locations in 2006
Fatal accidents locations in 2007
Fatal accidents locations in 2008
Fatal accidents locations in 2009
Fatal accidents locations in 2010
Fatal accidents locations in 2011
Fatal accidents locations in 2012
Fatal accidents locations in 2013
Fatal accidents locations in 2014
Fatal accidents locations in 2015
Fatal accidents locations in 2016
Fatal accidents locations in 2017
Fatal accidents locations in 2018
Fatal accidents locations in 2019
Fatal accidents locations in 2020
Fatal accidents locations in 2021
Alcohol use - People drinking some alcohol every month (%)
Alcohol use - People not drinking at all (%)
Alcohol use - Average days/month drinking alcohol
Alcohol use - Average drinks/week
Alcohol use - Average days/year people drink much
Audiometry - Average condition of hearing (%)
Audiometry - People that can hear a whisper from across a quiet room (%)
Audiometry - People that can hear normal voice from across a quiet room (%)
Audiometry - Ears ringing, roaring, buzzing (%)
Audiometry - Had a job exposure to loud noise (%)
Audiometry - Had off-work exposure to loud noise (%)
Blood Pressure & Cholesterol - Has high blood pressure (%)
Blood Pressure & Cholesterol - Checking blood pressure at home (%)
Blood Pressure & Cholesterol - Frequently checking blood cholesterol (%)
Blood Pressure & Cholesterol - Has high cholesterol level (%)
Consumer Behavior - Money monthly spent on food at supermarket/grocery store
Consumer Behavior - Money monthly spent on food at other stores
Consumer Behavior - Money monthly spent on eating out
Consumer Behavior - Money monthly spent on carryout/delivered foods
Consumer Behavior - Income spent on food at supermarket/grocery store (%)
Consumer Behavior - Income spent on food at other stores (%)
Consumer Behavior - Income spent on eating out (%)
Consumer Behavior - Income spent on carryout/delivered foods (%)
Current Health Status - General health condition (%)
Current Health Status - Blood donors (%)
Current Health Status - Has blood ever tested for HIV virus (%)
Current Health Status - Left-handed people (%)
Dermatology - People using sunscreen (%)
Diabetes - Diabetics (%)
Diabetes - Had a blood test for high blood sugar (%)
Diabetes - People taking insulin (%)
Diet Behavior & Nutrition - Diet health (%)
Diet Behavior & Nutrition - Milk product consumption (# of products/month)
Diet Behavior & Nutrition - Meals not home prepared (#/week)
Diet Behavior & Nutrition - Meals from fast food or pizza place (#/week)
Diet Behavior & Nutrition - Ready-to-eat foods (#/month)
Diet Behavior & Nutrition - Frozen meals/pizza (#/month)
Drug Use - People that ever used marijuana or hashish (%)
Drug Use - Ever used hard drugs (%)
Drug Use - Ever used any form of cocaine (%)
Drug Use - Ever used heroin (%)
Drug Use - Ever used methamphetamine (%)
Health Insurance - People covered by health insurance (%)
Kidney Conditions-Urology - Avg. # of times urinating at night
Medical Conditions - People with asthma (%)
Medical Conditions - People with anemia (%)
Medical Conditions - People with psoriasis (%)
Medical Conditions - People with overweight (%)
Medical Conditions - Elderly people having difficulties in thinking or remembering (%)
Medical Conditions - People who ever received blood transfusion (%)
Medical Conditions - People having trouble seeing even with glass/contacts (%)
Medical Conditions - People with arthritis (%)
Medical Conditions - People with gout (%)
Medical Conditions - People with congestive heart failure (%)
Medical Conditions - People with coronary heart disease (%)
Medical Conditions - People with angina pectoris (%)
Medical Conditions - People who ever had heart attack (%)
Medical Conditions - People who ever had stroke (%)
Medical Conditions - People with emphysema (%)
Medical Conditions - People with thyroid problem (%)
Medical Conditions - People with chronic bronchitis (%)
Medical Conditions - People with any liver condition (%)
Medical Conditions - People who ever had cancer or malignancy (%)
Mental Health - People who have little interest in doing things (%)
Mental Health - People feeling down, depressed, or hopeless (%)
Mental Health - People who have trouble sleeping or sleeping too much (%)
Mental Health - People feeling tired or having little energy (%)
Mental Health - People with poor appetite or overeating (%)
Mental Health - People feeling bad about themself (%)
Mental Health - People who have trouble concentrating on things (%)
Mental Health - People moving or speaking slowly or too fast (%)
Mental Health - People having thoughts they would be better off dead (%)
Oral Health - Average years since last visit a dentist
Oral Health - People embarrassed because of mouth (%)
Oral Health - People with gum disease (%)
Oral Health - General health of teeth and gums (%)
Oral Health - Average days a week using dental floss/device
Oral Health - Average days a week using mouthwash for dental problem
Oral Health - Average number of teeth
Pesticide Use - Households using pesticides to control insects (%)
Pesticide Use - Households using pesticides to kill weeds (%)
Physical Activity - People doing vigorous-intensity work activities (%)
Physical Activity - People doing moderate-intensity work activities (%)
Physical Activity - People walking or bicycling (%)
Physical Activity - People doing vigorous-intensity recreational activities (%)
Physical Activity - People doing moderate-intensity recreational activities (%)
Physical Activity - Average hours a day doing sedentary activities
Physical Activity - Average hours a day watching TV or videos
Physical Activity - Average hours a day using computer
Physical Functioning - People having limitations keeping them from working (%)
Physical Functioning - People limited in amount of work they can do (%)
Physical Functioning - People that need special equipment to walk (%)
Physical Functioning - People experiencing confusion/memory problems (%)
Physical Functioning - People requiring special healthcare equipment (%)
Prescription Medications - Average number of prescription medicines taking
Preventive Aspirin Use - Adults 40+ taking low-dose aspirin (%)
Reproductive Health - Vaginal deliveries (%)
Reproductive Health - Cesarean deliveries (%)
Reproductive Health - Deliveries resulted in a live birth (%)
Reproductive Health - Pregnancies resulted in a delivery (%)
Reproductive Health - Women breastfeeding newborns (%)
Reproductive Health - Women that had a hysterectomy (%)
Reproductive Health - Women that had both ovaries removed (%)
Reproductive Health - Women that have ever taken birth control pills (%)
Reproductive Health - Women taking birth control pills (%)
Reproductive Health - Women that have ever used Depo-Provera or injectables (%)
Reproductive Health - Women that have ever used female hormones (%)
Sexual Behavior - People 18+ that ever had sex (vaginal, anal, or oral) (%)
Sexual Behavior - Males 18+ that ever had vaginal sex with a woman (%)
Sexual Behavior - Males 18+ that ever performed oral sex on a woman (%)
Sexual Behavior - Males 18+ that ever had anal sex with a woman (%)
Sexual Behavior - Males 18+ that ever had any sex with a man (%)
Sexual Behavior - Females 18+ that ever had vaginal sex with a man (%)
Sexual Behavior - Females 18+ that ever performed oral sex on a man (%)
Sexual Behavior - Females 18+ that ever had anal sex with a man (%)
Sexual Behavior - Females 18+ that ever had any kind of sex with a woman (%)
Sexual Behavior - Average age people first had sex
Sexual Behavior - Average number of female sex partners in lifetime (males 18+)
Sexual Behavior - Average number of female vaginal sex partners in lifetime (males 18+)
Sexual Behavior - Average age people first performed oral sex on a woman (18+)
Sexual Behavior - Average number of woman performed oral sex on in lifetime (18+)
Sexual Behavior - Average number of male sex partners in lifetime (males 18+)
Sexual Behavior - Average number of male anal sex partners in lifetime (males 18+)
Sexual Behavior - Average age people first performed oral sex on a man (18+)
Sexual Behavior - Average number of male oral sex partners in lifetime (18+)
Sexual Behavior - People using protection when performing oral sex (%)
Sexual Behavior - Average number of times people have vaginal or anal sex a year
Sexual Behavior - People having sex without condom (%)
Sexual Behavior - Average number of male sex partners in lifetime (females 18+)
Sexual Behavior - Average number of male vaginal sex partners in lifetime (females 18+)
Sexual Behavior - Average number of female sex partners in lifetime (females 18+)
Sexual Behavior - Circumcised males 18+ (%)
Sleep Disorders - Average hours sleeping at night
Sleep Disorders - People that has trouble sleeping (%)
Smoking-Cigarette Use - People smoking cigarettes (%)
Taste & Smell - People 40+ having problems with smell (%)
Taste & Smell - People 40+ having problems with taste (%)
Taste & Smell - People 40+ that ever had wisdom teeth removed (%)
Taste & Smell - People 40+ that ever had tonsils teeth removed (%)
Taste & Smell - People 40+ that ever had a loss of consciousness because of a head injury (%)
Taste & Smell - People 40+ that ever had a broken nose or other serious injury to face or skull (%)
Taste & Smell - People 40+ that ever had two or more sinus infections (%)
Weight - Average height (inches)
Weight - Average weight (pounds)
Weight - Average BMI
Weight - People that are obese (%)
Weight - People that ever were obese (%)
Weight - People trying to lose weight (%)
According to our research of Texas and other state lists, there were 265 registered sex offenders living in Laredo, Texas as of April 27, 2024 . The ratio of all residents to sex offenders in Laredo is 982 to 1.The ratio of registered sex offenders to all residents in this city is lower than the state average.
The City-Data.com crime index weighs serious crimes and violent crimes more heavily. Higher means more crime, U.S. average is 246.1. It adjusts for the number of visitors and daily workers commuting into cities.
- means the value is smaller than the state average.
- means the value is about the same as the state average.
- means the value is bigger than the state average.
- means the value is much bigger than the state average.
Crime rate in Laredo detailed stats: murders, rapes, robberies, assaults, burglaries, thefts, arson Officers per 1,000 residents here:
1.91Texas average:
2.07
Latest news from Laredo, TX collected exclusively by city-data.com from local newspapers, TV, and radio stations
Ancestries: American (1.2%).
Current Local Time:
Land area: 78.5 square miles.
Population density: 3,265 people per square mile (average).
66,397 residents are foreign born (24.5% Latin America ).
This city:
26.0%Texas:
17.1%
Median real estate property taxes paid for housing units with mortgages in 2022: $4,027 (2.0%)Median real estate property taxes paid for housing units with no mortgage in 2022: $2,638 (1.7%)
Nearest city with pop. 200,000+: Corpus Christi, TX
Nearest city with pop. 1,000,000+: San Antonio, TX
Nearest cities:
Tanquecitos South Acres II, TX (2.6 miles),
Los Altos, TX (2.6 miles),
Laredo Ranchettes West, TX (2.8 miles),
Latitude: 27.52 N, Longitude: 99.49 W
Laredo nicknames or aliases (official or unofficial):
The Gateway To Mexico, Gateway City, The BorderplexDaytime population change due to commuting: -591 (-0.2%)Workers who live and work in this city: 102,721 (94.0%)
Laredo tourist attractions:
Single-family new house construction building permits:
2022: 1170 buildings , average cost: $256,2002021: 1462 buildings , average cost: $160,6002020: 1274 buildings , average cost: $148,5002019: 1302 buildings , average cost: $204,9002018: 1078 buildings , average cost: $139,3002017: 1061 buildings , average cost: $179,6002016: 945 buildings , average cost: $204,2002015: 1032 buildings , average cost: $146,1002014: 954 buildings , average cost: $146,1002013: 915 buildings , average cost: $146,1002012: 750 buildings , average cost: $146,0002011: 640 buildings , average cost: $146,7002010: 636 buildings , average cost: $144,7002009: 668 buildings , average cost: $132,9002008: 668 buildings , average cost: $137,0002007: 1257 buildings , average cost: $123,0002006: 1941 buildings , average cost: $108,8002005: 1886 buildings , average cost: $89,8002004: 1617 buildings , average cost: $92,6002003: 1580 buildings , average cost: $84,2002002: 1439 buildings , average cost: $81,6002001: 1477 buildings , average cost: $72,6002000: 1423 buildings , average cost: $68,3001999: 1336 buildings , average cost: $65,0001998: 1402 buildings , average cost: $51,7001997: 1198 buildings , average cost: $51,600Unemployment in December 2023:
Population change in the 1990s: +50,348 (+39.9%).
Most common occupations in Laredo, TX (%)
Both Males Females
Building and grounds cleaning and maintenance occupations (5.3%)
Other management occupations, except farmers and farm managers (5.1%)
Cooks and food preparation workers (4.6%)
Driver/sales workers and truck drivers (4.2%)
Material recording, scheduling, dispatching, and distributing workers (3.6%)
Cashiers (3.6%)
Other office and administrative support workers, including supervisors (3.1%)
Driver/sales workers and truck drivers (7.1%)
Building and grounds cleaning and maintenance occupations (6.0%)
Other management occupations, except farmers and farm managers (5.4%)
Law enforcement workers, including supervisors (4.4%)
Vehicle and mobile equipment mechanics, installers, and repairers (4.1%)
Laborers and material movers, hand (4.0%)
Material recording, scheduling, dispatching, and distributing workers (3.9%)
Cooks and food preparation workers (6.2%)
Cashiers (5.9%)
Secretaries and administrative assistants (5.3%)
Nursing, psychiatric, and home health aides (5.2%)
Other management occupations, except farmers and farm managers (4.8%)
Other office and administrative support workers, including supervisors (4.7%)
Building and grounds cleaning and maintenance occupations (4.5%)
Earthquake activity:
Laredo-area historical earthquake activity is significantly above Texas state average. It is 41% smaller than the overall U.S. average. On 4/14/1995 at 00:32:56, a magnitude 5.7 (5.6 MB, 5.7 MS, 5.7 MW, Depth: 11.1 mi, Class: Moderate, Intensity: VI - VII) earthquake occurred 302.3 miles away from the city center On 10/20/2011 at 12:24:41, a magnitude 4.8 (4.8 MW, Depth: 3.1 mi, Class: Light, Intensity: IV - V) earthquake occurred 126.5 miles away from the city center On 4/9/1993 at 12:29:19, a magnitude 4.3 (4.1 MB, 4.3 LG, Depth: 3.1 mi) earthquake occurred 121.9 miles away from Laredo center On 4/25/2010 at 02:10:42, a magnitude 3.9 (3.9 MB, Depth: 3.1 mi, Class: Light, Intensity: II - III) earthquake occurred 101.6 miles away from Laredo center On 3/24/1997 at 22:31:34, a magnitude 3.8 (3.8 LG, Depth: 3.1 mi) earthquake occurred 89.0 miles away from Laredo center On 5/1/2018 at 16:28:56, a magnitude 4.0 (4.0 MW, Depth: 3.1 mi) earthquake occurred 133.9 miles away from the city center Magnitude types: regional Lg-wave magnitude (LG), body-wave magnitude (MB), surface-wave magnitude (MS), moment magnitude (MW) Natural disasters: The number of natural disasters in Webb County (16) is near the US average (15).Major Disasters (Presidential) Declared: 7Emergencies Declared: 7Hurricanes: 7, Fires: 3, Tropical Storms: 3, Floods: 2, Storms: 2, Tornado: 1, Other: 1 (Note: some incidents may be assigned to more than one category). Main business address for: INTERNATIONAL BANCSHARES CORP STATE COMMERCIAL BANKS ).
Hospitals in Laredo: CASA BONITA (3702 PINE) CASA LINDA DE LAREDO (3105 COLUMBIA DRIVE) CASA SOLEDAD (1436 LOS EBANOS) CASA UNIDA GROUP HOME (111 PALENCIA) CHARTER HOSPITAL OF LAREDO (provides emergency services, 6020 SPRINGFIELD AVE) DOCTORS HOSPITAL OF LAREDO (Proprietary, provides emergency services, 10700 MCPHERSON ROAD) LAREDO MEDICAL CENTER (Voluntary non-profit - Church, 1700 EAST SAUNDERS) LAREDO STATE CENTER CASA ALEGRE (413 CHERRY HILL DRIVE) PROFESSIONAL HOSPICE CARE INC (205 W VILLAGE BLVD SUITE #3) PROVIDENCE HOSPITAL (230 CALLE DEL NORTE) TEXAS HEALTH STAFFING SERVICES, INC (1502 LAREDO STREET) Airports and heliports located in Laredo: Laredo International Airport (LRD) Runways: , Commercial Ops: 3,851, Air Taxi Ops: 9,009, Itinerant Ops: 18,370, Local Ops: 31,979, Military Ops: 37,491)Rancho Blanco Airport (TE32) Runways: Santa Maria Ranch Airport (0TE5) Runways: Doctors Hospital Heliport (28XA) Laredo Medical Center Heliport (XA22) See details about Airports and heliports located in Laredo, TX Amtrak station: LAREDO (801 SAN BERNARDINO AVE.) - Bus Station
.
Services: enclosed waiting area, public payphones, paid short-term parking, paid long-term parking, intercity bus service.
Colleges/Universities in Laredo: Laredo Community College Full-time enrollment: 9,743; Location: West End Washington St; Public; Website: www.laredo.edu)
Texas A & M International University Full-time enrollment: 5,203; Location: 5201 University Blvd; Public; Website: tamiu.edu; Offers Doctor's degree )
Kaplan College-Laredo Full-time enrollment: 515; Location: 6410 McPherson Road; Private, for-profit; Website: www.kaplancollege.com/laredo-tx/)
Laredo Beauty College Inc Full-time enrollment: 276; Location: 3020 N Meadow Ave; Private, for-profit; Website: www.laredobeautycollege.net/)
Other colleges/universities with over 2000 students near Laredo:
Texas A & M University-Kingsville (about 99 miles; Kingsville, TX ; Full-time enrollment: 9,295)
The University of Texas-Pan American (about 118 miles; Edinburg, TX ; FT enrollment: 16,766)
Southwest Texas Junior College (about 119 miles; Uvalde, TX ; FT enrollment: 3,569)
South Texas College (about 119 miles; McAllen, TX ; FT enrollment: 19,701)
Coastal Bend College (about 124 miles; Beeville, TX ; FT enrollment: 2,880)
Del Mar College (about 129 miles; Corpus Christi, TX ; FT enrollment: 5,213)
Texas A & M University-Corpus Christi (about 133 miles; Corpus Christi, TX ; FT enrollment: 9,092)
Biggest public high schools in Laredo: JOHN B ALEXANDER H S Students: 2,652, Location: 3600 E DEL MAR, Grades: 9-12)UNITED SOUTH H S Students: 2,634, Location: 4001 AVE LOS PRESIDENTES, Grades: 9-12)LYNDON B JOHNSON Students: 2,215, Location: 5626 CIELITO LINDO BLVD, Grades: 9-12)NIXON H S Students: 1,970, Location: 2000 PLUM, Grades: 9-12)MARTIN H S Students: 1,824, Location: 2002 SAN BERNARDO AVE, Grades: 9-12)DR LEO CIGARROA H S Students: 1,528, Location: 2600 ZACATECAS ST, Grades: 9-12)CHRISTEN MIDDLE Students: 1,425, Location: 2001 SANTA MARIA AVE, Grades: 6-9)JOAQUIN CIGARROA MIDDLE Students: 1,216, Location: 2600 PALO BLANCO ST, Grades: 6-9)HARMONY SCIENCE ACADEMY - LAREDO Students: 572, Location: 4401 SAN FRANCISCO AVE, Grades: 6-12, Charter school )EARLY COLLEGE H S Students: 381, Location: 5201 UNIVERSITY BLVD, Grades: 9-12, Charter school )Private high schools in Laredo: ST AUGUSTINE HIGH SCHOOL Students: 391, Location: 1300 GALVESTON ST, Grades: 9-12)
POWER CHRISTIAN ACADEMY Students: 63, Location: 1601 SHILOH DR, Grades: PK-12)
Biggest public elementary/middle schools in Laredo: TRAUTMANN MIDDLE Students: 1,514, Location: 8501 CURLY LN, Grades: 6-8)UNITED SOUTH MIDDLE Students: 1,287, Location: 3707 AVE LOS PRESIDENTES, Grades: 6-8)GEORGE WASHINGTON MIDDLE Students: 1,168, Location: 10306 RIVERBANK DR, Grades: 6-8)JUDITH ZAFFIRINI EL Students: 1,052, Location: 5210 SANTA CLAUDIA LN, Grades: PK-5)JOHN W ARNDT EL Students: 1,029, Location: 610 SANTA MARTA BLVD, Grades: PK-5)BONNIE L GARCIA EL Students: 1,021, Location: 1453 CONCORD HILLS BLVD, Grades: PK-5)UNITED MIDDLE Students: 1,019, Location: 700 E DEL MAR BLVD, Grades: 6-8)BARBARA FASKEN EL Students: 1,010, Location: 11111 ATLANTA DR, Grades: PK-5)ANTONIO GONZALEZ MIDDLE Students: 989, Location: 5208 SANTA CLAUDIA LN, Grades: 6-8)DR MALAKOFF EL Students: 919, Location: 2810 HAVANA DR, Grades: PK-5)Private elementary/middle schools in Laredo: MARY HELP OF CHRISTIANS SCHOOL Students: 500, Location: 10 E DEL MAR BLVD, Grades: PK-8)
UNITED DAY SCHOOL Students: 454, Location: 1701 SAN ISIDRO PKWY, Grades: PK-8)BLESSED SACRAMENT SCHOOL Students: 266, Location: 1501 N BARTLETT AVE, Grades: PK-8)
ST PETERS MEMORIAL SCHOOL Students: 163, Location: 1519 HOUSTON ST, Grades: PK-8)
OUR LADY OF GUADALUPE SCHOOL Students: 137, Location: 400 CALLAGHAN ST, Grades: PK-6)
See full list of schools located in Laredo Library in Laredo: LAREDO PUBLIC LIBRARY Operating income: $3,143,416; Location: 1120 E CALTON RD; 226,135 books ; 459 e-books ; 5,840 audio materials ; 13,629 video materials ; 16 local licensed databases ; 50 state licensed databases ; 1 other licensed databases ; 337 print serial subscriptions ; 2 electronic serial subscriptions )
User-submitted facts and corrections:
Laredo texas already has a new mall its called ( Mall Del Norte)
Notable locations in Laredo: (A) , Dairy Crossing (B) , Dolores Ranch (C) , Fort McIntosh (D) , Webb County Courthouse (E) , Hamilton Hotel (F) , Laredo Fire Department Station 14 (G) , Laredo Fire Department Station 7 (H) , Laredo Fire Department Station 2 (I) , Laredo Fire Department Station 5 (J) , Laredo Fire Department Station 6 (K) , Laredo Fire Department Station 9 (L) , Laredo Fire Department Station 4 (M) , Laredo Fire Department Station 10 (N) , Laredo Fire Department Station 8 (O) , Laredo Fire Department Station 11 (P) , Laredo Fire Department Station 12 (Q) , Laredo Fire Department Ambulance Service (R) , Republic of the Rio Grande Museum (S) , Laredo Fire Department (T) . Display/hide their locations on the map
Shopping Center: (1) . Display/hide its location on the map
Main business address in Laredo: (A) . Display/hide its location on the map
Churches in Laredo include: (A) , El Buen Pastor Assembly of God Church (B) , Apostolic Assembly Church (C) , King of Kings Church (D) , Seventh Day Adventist Church (E) , Iglesia Adventist del Septimo Dia Church (F) , Presbyterian Church Sinai (G) , First Presbyterian Church (H) , The Church of Jesus Christ of Latter Day Saints Church (I) . Display/hide their locations on the map
Reservoirs: (A) , Link Lake Number 1 (B) , Link Lake Number 2 (C) , Paul Young Ranch Lake (D) , Scot Camp Tank (E) , Ranchita Tank (F) , Iron Pasture Tank (G) , Casa Blanca Lake (H) . Display/hide their locations on the map
Creeks: (A) , San Idelfonso Creek (B) , Cuervo Creek (C) , Chacon Creek (D) . Display/hide their locations on the map
Parks in Laredo include: (1) , Shirley Field (2) . Display/hide their locations on the map
Tourist attraction: (1) . Display/hide its approximate location on the map
Hotels: (1) , Motel 9 (9017 San Dario Ave) (2) , Bender Hotel (1416 Matamoros Street) (3) , Absolute Relocation Services (407 Chevy Chase Drive) (4) . Display/hide their approximate locations on the map
Courts: (1) , Laredo-City - Municipal Court (4610 Maher Avenue) (2) , Federal Bureau of Investigation (105 Shiloh Drive) (3) , Webb-County - Water Utilities (513 Martha Drive) (4) , Webb-County - Road And Bridge Department (7210 East Saunders Street) (5) . Display/hide their approximate locations on the map
Birthplace of: Henry Cuellar - Politician, Tom DeLay - Republican politician, Albert Huffstickler - Poet, Joe A. Guerra - Politician, John P. Wheeler III - Businessman, Judith Zaffirini - Texas politician, Julio A. Garcia - Lawyer, Quico Canseco - Businessman and politician, Abraham Kazen - Politician, Billy Hall (Texas politician) - Politician.
Webb County has a predicted average indoor radon screening level less than 2 pCi/L (pico curies per liter) - Low Potential Drinking water stations with addresses in Laredo and their reported violations in the past:
TXDOT TRAVEL INFORMATION CENTER (Population served: 300, Groundwater):
Past health violations:
MCL, Monthly (TCR) - In AUG-2007, Contaminant: Coliform. Follow-up actions: St Compliance achieved (AUG-31-2007), St Public Notif requested (DEC-13-2007), St Violation/Reminder Notice (DEC-13-2007)
MCL, Monthly (TCR) - In MAR-2006, Contaminant: Coliform. Follow-up actions: St Compliance achieved (MAR-31-2006), St Public Notif requested (APR-02-2006), St Violation/Reminder Notice (APR-02-2006), St Public Notif received (MAY-02-2006)
Past monitoring violations:
5 routine major monitoring violations
Population served: 107, Groundwater):
Past monitoring violations:
2 routine major monitoring violations
Population served: 72, Groundwater):
Past monitoring violations:
One routine major monitoring violation
Population served: 60, Groundwater):
Past monitoring violations:
One routine major monitoring violation
One minor monitoring violation
One regular monitoring violation
Population served: 25, Purch surface water):
Past health violations:
MCL, Monthly (TCR) - In JAN-2013, Contaminant: Coliform. Follow-up actions: St Public Notif requested (JAN-28-2013), St Violation/Reminder Notice (JAN-28-2013), St Public Notif received (FEB-05-2013)
Past monitoring violations:
One routine major monitoring violation
One minor monitoring violation
Drinking water stations with addresses in Laredo that have no violations reported:
LONG BRANCH SALOON (Population served: 27, Primary Water Source Type: Groundwater)
CITY OF LAREDO WATER HAULER (Population served: 25, Primary Water Source Type: Purch surface water)
Average household size: This city:
3.7 peopleTexas:
2.8 people
Percentage of family households: This city:
83.8%Whole state:
69.9%
Percentage of households with unmarried partners: This city:
5.0%Whole state:
6.0%
Likely homosexual households (counted as self-reported same-sex unmarried-partner households)
Lesbian couples: 0.3% of all households Gay men: 0.2% of all households
People in group quarters in Laredo in 2010:
1,591 people in federal detention centers
727 people in college/university student housing
378 people in other noninstitutional facilities
367 people in nursing facilities/skilled-nursing facilities
228 people in workers' group living quarters and job corps centers
95 people in emergency and transitional shelters (with sleeping facilities) for people experiencing homelessness
33 people in correctional facilities intended for juveniles
23 people in residential treatment centers for adults
14 people in group homes intended for adults
13 people in residential treatment centers for juveniles (non-correctional)
10 people in hospitals with patients who have no usual home elsewhere
People in group quarters in Laredo in 2000:
849 people in federal prisons and detention centers
475 people in other noninstitutional group quarters
388 people in nursing homes
353 people in local jails and other confinement facilities (including police lockups)
313 people in college dormitories (includes college quarters off campus)
282 people in orthopedic wards and institutions for the physically handicapped
152 people in job corps and vocational training facilities
92 people in religious group quarters
33 people in homes for the mentally retarded
27 people in homes or halfway houses for drug/alcohol abuse
19 people in homes for abused, dependent, and neglected children
18 people in short-term care, detention or diagnostic centers for delinquent children
13 people in other nonhousehold living situations
10 people in other types of correctional institutions
10 people in wards in general hospitals for patients who have no usual home elsewhere
10 people in homes for the mentally ill
Arena or stadium:
Laredo Entertainment Center. Capacity: 9,622.
Banks with most branches in Laredo (2011 data):
International Bank of Commerce: 17 branches. Info updated 2007/03/28: Bank assets: $9,621.9 mil, Deposits: $6,548.8 mil, local headquarters , positive income , Commercial Lending Specialization, 197 total offices , Holding Company: International Bancshares Corporation
Compass Bank: 11 branches. Info updated 2011/02/24: Bank assets: $63,107.0 mil, Deposits: $46,232.4 mil, headquarters in Birmingham, AL, negative income in the last year , Commercial Lending Specialization, 720 total offices , Holding Company: Banco Bilbao Vizcaya Argentaria, S.A.
Falcon International Bank: North Branch, San Isidro Branch, Downtown Branch, at 7718 Mcpherson Rd. Bldg. F, East Branch. Info updated 2011/02/16: Bank assets: $869.6 mil, Deposits: $762.9 mil, local headquarters , positive income , Commercial Lending Specialization, 15 total offices , Holding Company: Falcon Bancshares Incorporated
Wells Fargo Bank, National Association: Laredo East Branch, Laredo North Branch, Laredo Loop 20 Branch, Laredo Downtown Branch. Info updated 2011/04/05: Bank assets: $1,161,490.0 mil, Deposits: $905,653.0 mil, headquarters in Sioux Falls, SD, positive income , 6395 total offices , Holding Company: Wells Fargo & Company
Commerce Bank: at 5800 San Dario, South Laredo Branch, Welby Court Branch, Saunders Avenue Branch. Info updated 2006/11/03: Bank assets: $557.2 mil, Deposits: $436.4 mil, local headquarters , positive income , Mortgage Lending Specialization, 4 total offices , Holding Company: International Bancshares Corporation
First National Bank: Village Laredo Branch, Laredo Branch, Laredo-Guadalupe Branch. Info updated 2007/09/20: Bank assets: $3,517.0 mil, Deposits: $2,598.8 mil, headquarters in Edinburg, TX, negative income in the last year , Commercial Lending Specialization, 58 total offices , Holding Company: First National Bank Group, Inc.
JPMorgan Chase Bank, National Association: I 35 And Calton Branch, Clark And Loop 20 Banking Center Bra, International & Loop 20 Banking Cent. Info updated 2011/11/10: Bank assets: $1,811,678.0 mil, Deposits: $1,190,738.0 mil, headquarters in Columbus, OH, positive income , International Specialization, 5577 total offices , Holding Company: Jpmorgan Chase & Co.
Bank of America, National Association: Laredo Banking Store Branch at 7676 Mcpherson Avenue, branch established on 2003/12/30; Mall Del Norte Branch at 5313 San Dario, branch established on 2005/08/31. Info updated 2009/11/18: Bank assets: $1,451,969.3 mil, Deposits: $1,077,176.8 mil, headquarters in Charlotte, NC, positive income , 5782 total offices , Holding Company: Bank Of America Corporation
Texas Community Bank, National Association: at 6721 Mcpherson Road, branch established on 1983/06/20; Sinatra Branch at 6302 Sinatra Parkway, branch established on 2004/09/20. Info updated 2008/06/11: Bank assets: $1,061.2 mil, Deposits: $957.2 mil, local headquarters , positive income , Commercial Lending Specialization, 9 total offices , Holding Company: Vision Bancshares, Inc.
4 other banks with 5 local branches
For population 15 years and over in Laredo:
Never married: 36.2%Now married: 48.8%Separated: 2.9%Widowed: 5.6%Divorced: 6.4% For population 25 years and over in Laredo:
High school or higher: 71.4%Bachelor's degree or higher: 22.6%Graduate or professional degree: 5.8%Unemployed: 9.0%Mean travel time to work (commute): 21.1 minutes
Education Gini index (Inequality in education) Here:
16.8Texas average:
14.0
Religion statistics for Laredo, TX (based on Webb County data)
Religion Adherents Congregations Catholic 126,750 26 Evangelical Protestant 12,812 90 Other 6,120 12 Mainline Protestant 1,354 9 Black Protestant 207 1 None 103,061 -
Source: Clifford Grammich, Kirk Hadaway, Richard Houseal, Dale E.Jones, Alexei Krindatch, Richie Stanley and Richard H.Taylor. 2012. 2010 U.S.Religion Census: Religious Congregations & Membership Study. Association of Statisticians of American Religious Bodies. Jones, Dale E., et al. 2002. Congregations and Membership in the United States 2000. Nashville, TN: Glenmary Research Center. Graphs represent county-level data
Food Environment Statistics: Number of grocery stores : 43Webb County :
1.86 / 10,000 pop.Texas :
1.47 / 10,000 pop.
Number of supercenters and club stores : 4Webb County :
0.17 / 10,000 pop.Texas :
0.14 / 10,000 pop.
Number of convenience stores (no gas) : 10Webb County :
0.43 / 10,000 pop.Texas :
1.11 / 10,000 pop.
Number of convenience stores (with gas) : 88This county :
3.80 / 10,000 pop.State :
3.95 / 10,000 pop.
Number of full-service restaurants : 129This county :
5.57 / 10,000 pop.State :
6.13 / 10,000 pop.
Adult diabetes rate : This county :
9.1%Texas :
8.9%
Adult obesity rate : Webb County :
28.0%State :
26.6%
Low-income preschool obesity rate : Webb County :
15.4%Texas :
15.7%
Health and Nutrition:
Average overall health of teeth and gums : People feeling badly about themselves : This city:
18.5%Texas:
20.6%
People not drinking alcohol at all : Average hours sleeping at night : General health condition : Average condition of hearing : More about Health and Nutrition of Laredo, TX Residents
Local government employment and payroll (March 2022)
Function
Full-time employees
Monthly full-time payroll
Average yearly full-time wage
Part-time employees
Monthly part-time payroll
Police Protection - Officers
495 $3,958,315 $95,959 0 $0 Firefighters
432 $3,923,581 $108,988 0 $0 Streets and Highways
334 $1,174,185 $42,186 0 $0 Water Supply
277 $1,103,449 $47,803 0 $0 Health
256 $911,695 $42,736 0 $0 Parks and Recreation
196 $497,194 $30,440 0 $0 Solid Waste Management
167 $536,508 $38,551 0 $0 Transit
163 $672,628 $49,519 4 $6,993 Housing and Community Development (Local)
140 $507,689 $43,516 0 $0 Police - Other
120 $627,540 $62,754 0 $0 Financial Administration
82 $354,598 $51,892 0 $0 Other Government Administration
82 $450,687 $65,954 0 $0 Airports
60 $203,508 $40,702 0 $0 Other and Unallocable
46 $184,014 $48,004 0 $0 Local Libraries
45 $139,015 $37,071 0 $0 Judicial and Legal
33 $146,984 $53,449 0 $0 Fire - Other
14 $47,992 $41,136 0 $0
Totals for Government
2,942 $15,439,582 $62,976 4 $6,993
Laredo government finances - Expenditure in 2021 (per resident):
Construction - Water Utilities: $17,440,000 ($68.08)
General - Other: $17,332,000 ($67.65)Sewerage: $14,645,000 ($57.17)Air Transportation: $10,921,000 ($42.63)Toll Highways: $1,045,000 ($4.08)Parks and Recreation: $944,000 ($3.68)Regular Highways: $892,000 ($3.48)Transit Utilities: $209,000 ($0.82)Solid Waste Management: $74,000 ($0.29)Current Operations - Police Protection: $80,812,000 ($315.44)
Local Fire Protection: $59,706,000 ($233.06)Toll Highways: $53,300,000 ($208.05)Water Utilities: $26,017,000 ($101.55)Solid Waste Management: $22,408,000 ($87.47)Sewerage: $21,501,000 ($83.93)Health - Other: $20,842,000 ($81.35)Parks and Recreation: $17,041,000 ($66.52)Transit Utilities: $16,689,000 ($65.14)Housing and Community Development: $13,275,000 ($51.82)Air Transportation: $11,746,000 ($45.85)General - Other: $7,818,000 ($30.52)Central Staff Services: $6,977,000 ($27.23)Corrections - Other: $5,637,000 ($22.00)Regular Highways: $5,589,000 ($21.82)Financial Administration: $5,193,000 ($20.27)Libraries: $5,183,000 ($20.23)Protective Inspection and Regulation - Other: $3,252,000 ($12.69)Judicial and Legal Services: $2,609,000 ($10.18)Parking Facilities: $2,194,000 ($8.56)General Public Buildings: $973,000 ($3.80)Miscellaneous Commercial Activities - Other: $398,000 ($1.55)General - Interest on Debt: $6,138,000 ($23.96)
Intergovernmental to Local - Other - Public Welfare - Other: $511,000 ($1.99)
Other Capital Outlay - Solid Waste Management: $4,780,000 ($18.66)
Housing and Community Development: $2,931,000 ($11.44)General - Other: $1,949,000 ($7.61)Protective Inspection and Regulation - Other: $1,349,000 ($5.27)Police Protection: $407,000 ($1.59)Parks and Recreation: $261,000 ($1.02)Libraries: $192,000 ($0.75)Miscellaneous Commercial Activities - Other: $167,000 ($0.65)Water Utilities: $155,000 ($0.61)Health - Other: $103,000 ($0.40)Judicial and Legal Services: $88,000 ($0.34)Parking Facilities: $61,000 ($0.24)Financial Administration: $57,000 ($0.22)Local Fire Protection: $51,000 ($0.20)Total Salaries and Wages: $162,756,000 ($635.30)
Transit Utilities - Interest on Debt: $58,000 ($0.23)
Water Utilities - Interest on Debt: $2,094,000 ($8.17)
Laredo government finances - Revenue in 2021 (per resident):
Charges - Other: $80,242,000 ($313.22)
Toll Highways: $66,660,000 ($260.20)Sewerage: $32,688,000 ($127.59)Solid Waste Management: $24,925,000 ($97.29)Air Transportation: $8,151,000 ($31.82)Parking Facilities: $3,123,000 ($12.19)Housing and Community Development: $1,637,000 ($6.39)Parks and Recreation: $1,200,000 ($4.68)Miscellaneous Commercial Activities: $360,000 ($1.41)Federal Intergovernmental - Air Transportation: $14,358,000 ($56.04)
Housing and Community Development: $7,575,000 ($29.57)Transit Utilities: $4,806,000 ($18.76)Other: $4,753,000 ($18.55)Health and Hospitals: $2,515,000 ($9.82)Local Intergovernmental - Housing and Community Development: $335,000 ($1.31)
Health and Hospitals: $121,000 ($0.47)Other: $60,000 ($0.23)Miscellaneous - Donations From Private Sources: $29,320,000 ($114.45)
General Revenue - Other: $6,032,000 ($23.55)Fines and Forfeits: $5,307,000 ($20.72)Interest Earnings: $3,731,000 ($14.56)Rents: $3,577,000 ($13.96)Special Assessments: $828,000 ($3.23)Sale of Property: $99,000 ($0.39)Revenue - Water Utilities: $40,122,000 ($156.61)
Transit Utilities: $3,796,000 ($14.82)State Intergovernmental - Other: $6,701,000 ($26.16)
Health and Hospitals: $6,568,000 ($25.64)Transit Utilities: $573,000 ($2.24)General Local Government Support: $390,000 ($1.52)Tax - Property: $93,433,000 ($364.71)
General Sales and Gross Receipts: $62,868,000 ($245.40)Other License: $12,476,000 ($48.70)Public Utilities Sales: $9,671,000 ($37.75)Other Selective Sales: $5,359,000 ($20.92)Amusements Sales: $88,000 ($0.34)
Laredo government finances - Debt in 2021 (per resident):
Long Term Debt - Retired Unspecified Public Purpose: $56,922,000 ($222.19)
Beginning Outstanding - Unspecified Public Purpose: $56,922,000 ($222.19)
Laredo government finances - Cash and Securities in 2021 (per resident):
Bond Funds - Cash and Securities: $79,361,000 ($309.78)
Other Funds - Cash and Securities: $265,016,000 ($1034.46)
Sinking Funds - Cash and Securities: $31,564,000 ($123.21)
2.21% of this county's 2021 resident taxpayers lived in other counties in 2020 ($44,945 average adjusted gross income )
Here:
2.21%Texas average:
8.12%
0.02% of residents moved from foreign countries ($549 average AGI )Webb County:
0.02%Texas average:
0.04%
Top counties from which taxpayers relocated into this county between 2020 and 2021:
Businesses in Laredo, TX
Name Count Name Count
ALDO 1 La-Z-Boy 1 Academy Sports + Outdoors 2 Lane Bryant 1 Advance Auto Parts 5 Lane Furniture 1 Aeropostale 1 Long John Silver's 1 American Eagle Outfitters 1 Lowe's 1 Applebee's 1 Macy's 1 Arby's 2 Marriott 4 Ashley Furniture 1 Marshalls 1 AutoZone 5 Mazda 1 Avenue 1 McDonald's 14 Bakers 2 Motel 6 2 Bebe 1 Motherhood Maternity 2 Bed Bath & Beyond 1 New Balance 1 Best Western 1 New York & Co 1 Blockbuster 2 Nike 7 Burger King 11 Nissan 1 Burlington Coat Factory 1 Office Depot 1 Cache 1 OfficeMax 1 Carl\s Jr. 1 Old Navy 1 Casual Male XL 1 Olive Garden 1 Charlotte Russe 1 Pac Sun 1 Chevrolet 1 Papa John's Pizza 2 Chick-Fil-A 4 Payless 8 Chuck E. Cheese's 1 Penske 1 Church's Chicken 9 Pizza Hut 8 Curves 2 Popeyes 8 DHL 1 Quiznos 3 Dairy Queen 2 RadioShack 3 Days Inn 1 Red Lobster 1 Dennys 2 Red Roof Inn 2 Express 1 SAS Shoes 1 Extended Stay America 1 SONIC Drive-In 3 FedEx 20 Sam's Club 1 Finish Line 1 Sears 2 Firestone Complete Auto Care 2 Sephora 1 Foot Locker 1 Shoe Carnival 1 Forever 21 1 Skechers USA 1 GNC 3 Spencer Gifts 1 GameStop 5 Sprint Nextel 2 Gap 1 Starbucks 4 Goodwill 2 Super 8 1 Gymboree 1 T-Mobile 9 H&R Block 7 T.J.Maxx 1 Hilton 1 Target 2 Hobby Lobby 1 The Limited 1 Holiday Inn 3 Toyota 1 Hollister Co. 1 Toys"R"Us 2 Honda 1 True Value 2 Hot Topic 1 U-Haul 6 IHOP 1 UPS 23 JCPenney 1 Vans 4 Jack In The Box 6 Verizon Wireless 1 Jones New York 3 Victoria's Secret 1 Journeys 1 Volkswagen 1 Justice 1 Walgreens 2 KFC 2 Walmart 3 Kmart 1 Wendy's 8 Kohl's 1 Wet Seal 1 La Quinta 2
Strongest AM radio stations in Laredo:
KLNT (1490 AM; 1 kW; LAREDO, TX; Owner: AMIGO RADIO, LTD.)
KLAR (1300 AM; 1 kW; LAREDO, TX; Owner: FAITH AND POWER COMMS., INC.)
KVOZ (890 AM; 12 kW; DEL MAR HILLS, TX; Owner: CONSOLIDATED RADIO, INC.)
KKYX (680 AM; 50 kW; SAN ANTONIO, TX; Owner: CXR HOLDINGS, INC.)
KTKR (760 AM; 50 kW; SAN ANTONIO, TX; Owner: CCB TEXAS LICENSES, L.P.)
KCTA (1030 AM; 50 kW; CORPUS CHRISTI, TX; Owner: BROADCASTING CORPORATION OF THE SOUTHWEST)
KGBT (1530 AM; 50 kW; HARLINGEN, TX; Owner: TICHENOR LICENSE CORPORATION)
WOAI (1200 AM; 50 kW; SAN ANTONIO, TX; Owner: CCB TEXAS LICENSES, L.P.)
KENS (1160 AM; 25 kW; SAN ANTONIO, TX; Owner: KENS-TV, INC.)
KURV (710 AM; 10 kW; EDINBURG, TX; Owner: VOICE OF VALLEY AGRICULTURE, INC.)
KTRH (740 AM; 50 kW; HOUSTON, TX; Owner: AMFM TEXAS LICENSES LIMITED PARTNERSHIP)
KUBR (1210 AM; 10 kW; SAN JUAN, TX; Owner: PAULINO BERNAL)
KSAH (720 AM; 10 kW; UNIVERSAL CITY, TX; Owner: KSAH LICENSING, INC.)
Strongest FM radio stations in Laredo:
KQUR (94.9 FM; LAREDO, TX; Owner: BORDER BROADCASTERS, INC.)
KRRG (98.1 FM; LAREDO, TX; Owner: GUERRA ENTERPRISES)
KBDR-FM1 (100.5 FM; LAREDO, TX; Owner: BMP 100.5 FM, LP)
KHOY (88.1 FM; LAREDO, TX; Owner: LAREDO CATHOLIC COMMUNICATIONS, INC.)
KJBZ (92.7 FM; LAREDO, TX; Owner: GUERRA ENTERPRISES)
KBNL (89.9 FM; LAREDO, TX; Owner: WORLD RADIO NETWORK, INC.)
KNEX (106.1 FM; LAREDO, TX; Owner: AMIGO RADIO, LTD.)
KBDR (100.5 FM; MIRANDO CITY, TX; Owner: BMP 100.5 FM, LP)
TV broadcast stations around Laredo:
KVTV (Channel 13; LAREDO, TX; Owner: EAGLE CREEK BROADCASTING OF LAREDO, LLC)
KLMV-LP (Channel 68; LAREDO, TX; Owner: J. B. SALAZAR)
KLDO-TV (Channel 27; LAREDO, TX; Owner: ENTRAVISION HOLDINGS, LLC)
KGNS-TV (Channel 8; LAREDO, TX; Owner: CENTURY DEVELOPMENT CORPORATION)
KNEZ-LP (Channel 39; LAREDO, TX; Owner: ARACELIS ORTIZ, EXECUTRIX OF THE ESTATE OF CARLOS ORTIZ)
KNEX-LP (Channel 55; LAREDO, TX; Owner: LOCALONE TEXAS, LTD.)
KZLD-LP (Channel 25; LAREDO, TX; Owner: ZAVALETTA BROADCASTING. OF LAREDO, LLC)
Medal of Honor Recipients
Medal of Honor Recipient born in Laredo: David B. Barkeley.
National Bridge Inventory (NBI) Statistics 212 Number of bridges5,295ft / 1,614m Total length3,308,976 Total average daily traffic413,228 Total average daily truck traffic
New bridges - historical statistics
2 1910-1919 7 1920-1929 1 1930-1939 4 1940-1949 11 1950-1959 28 1960-1969 11 1970-1979 24 1980-1989 36 1990-1999 62 2000-2009 22 2010-2019 4 2020-2022
See full National Bridge Inventory statistics for Laredo, TX
Home Mortgage Disclosure Act Aggregated Statistics For Year 2009(Based on 26 full and 2 partial tracts) A) FHA, FSA/RHS & VA B) Conventional C) Refinancings D) Home Improvement Loans E) Loans on Dwellings For 5+ Families F) Non-occupant Loans on G) Loans On Manufactured Number Average Value Number Average Value Number Average Value Number Average Value Number Average Value Number Average Value Number Average Value
LOANS ORIGINATED 428 $129,505 185 $163,883 554 $139,850 93 $44,846 17 $210,635 115 $131,894 9 $30,419 APPLICATIONS APPROVED, NOT ACCEPTED 31 $126,739 22 $115,619 194 $132,099 9 $49,221 1 $150,000 12 $86,402 2 $46,175 APPLICATIONS DENIED 82 $109,114 64 $120,570 652 $107,907 264 $36,655 1 $162,000 63 $78,033 18 $42,234 APPLICATIONS WITHDRAWN 72 $123,379 27 $125,891 186 $125,467 45 $56,118 0 $0 13 $86,358 4 $52,242 FILES CLOSED FOR INCOMPLETENESS 18 $139,319 9 $159,906 81 $130,976 57 $67,658 0 $0 7 $74,136 1 $66,770
Aggregated Statistics For Year 2008(Based on 26 full and 2 partial tracts) A) FHA, FSA/RHS & VA B) Conventional C) Refinancings D) Home Improvement Loans E) Loans on Dwellings For 5+ Families F) Non-occupant Loans on G) Loans On Manufactured Number Average Value Number Average Value Number Average Value Number Average Value Number Average Value Number Average Value Number Average Value
LOANS ORIGINATED 289 $127,076 395 $150,505 477 $119,612 322 $41,740 17 $292,353 147 $107,686 28 $31,027 APPLICATIONS APPROVED, NOT ACCEPTED 22 $122,874 66 $138,485 173 $102,375 46 $38,068 0 $0 21 $96,185 5 $46,618 APPLICATIONS DENIED 122 $120,002 174 $105,271 928 $105,325 718 $41,874 0 $0 83 $65,456 28 $33,544 APPLICATIONS WITHDRAWN 47 $117,626 35 $142,113 200 $111,635 114 $55,170 2 $494,000 14 $96,506 2 $24,290 FILES CLOSED FOR INCOMPLETENESS 56 $118,433 16 $150,155 49 $120,312 84 $67,093 0 $0 7 $91,403 1 $25,970
Aggregated Statistics For Year 2007(Based on 27 full and 2 partial tracts) A) FHA, FSA/RHS & VA B) Conventional C) Refinancings D) Home Improvement Loans E) Loans on Dwellings For 5+ Families F) Non-occupant Loans on G) Loans On Manufactured Number Average Value Number Average Value Number Average Value Number Average Value Number Average Value Number Average Value Number Average Value
LOANS ORIGINATED 262 $125,351 1,200 $120,986 726 $111,578 411 $36,050 30 $353,267 210 $102,920 40 $34,358 APPLICATIONS APPROVED, NOT ACCEPTED 17 $144,640 230 $115,034 211 $94,514 103 $29,636 2 $127,205 34 $94,555 4 $39,698 APPLICATIONS DENIED 68 $124,691 564 $111,203 1,303 $105,966 856 $36,962 2 $187,500 150 $68,800 53 $37,492 APPLICATIONS WITHDRAWN 32 $117,465 223 $117,296 520 $105,085 158 $69,025 1 $450,000 49 $96,856 5 $35,000 FILES CLOSED FOR INCOMPLETENESS 13 $116,502 112 $122,995 187 $161,166 99 $65,966 0 $0 20 $78,586 2 $41,000
Aggregated Statistics For Year 2006(Based on 27 full and 2 partial tracts) A) FHA, FSA/RHS & VA B) Conventional C) Refinancings D) Home Improvement Loans E) Loans on Dwellings For 5+ Families F) Non-occupant Loans on G) Loans On Manufactured Number Average Value Number Average Value Number Average Value Number Average Value Number Average Value Number Average Value Number Average Value
LOANS ORIGINATED 214 $116,992 2,135 $101,376 775 $107,931 447 $32,329 33 $494,898 314 $80,572 39 $30,806 APPLICATIONS APPROVED, NOT ACCEPTED 16 $100,689 393 $87,500 217 $90,328 81 $29,281 0 $0 33 $81,958 7 $32,240 APPLICATIONS DENIED 21 $117,397 720 $84,269 1,247 $97,013 735 $26,426 5 $368,800 151 $61,763 41 $28,660 APPLICATIONS WITHDRAWN 16 $110,925 303 $103,143 754 $112,111 98 $63,581 0 $0 34 $89,668 0 $0 FILES CLOSED FOR INCOMPLETENESS 3 $85,997 68 $97,493 151 $112,678 54 $61,292 0 $0 14 $70,919 0 $0
Aggregated Statistics For Year 2005(Based on 27 full and 2 partial tracts) A) FHA, FSA/RHS & VA B) Conventional C) Refinancings D) Home Improvement Loans E) Loans on Dwellings For 5+ Families F) Non-occupant Loans on G) Loans On Manufactured Number Average Value Number Average Value Number Average Value Number Average Value Number Average Value Number Average Value Number Average Value
LOANS ORIGINATED 191 $106,553 1,742 $100,851 990 $99,572 445 $45,558 24 $395,958 304 $82,395 32 $29,718 APPLICATIONS APPROVED, NOT ACCEPTED 13 $85,725 371 $82,734 248 $82,432 83 $42,543 0 $0 25 $77,224 14 $52,224 APPLICATIONS DENIED 19 $101,862 645 $92,184 1,539 $86,936 577 $27,874 1 $400,000 132 $68,481 78 $37,847 APPLICATIONS WITHDRAWN 11 $108,635 268 $105,519 715 $118,225 244 $174,996 0 $0 63 $98,004 3 $61,823 FILES CLOSED FOR INCOMPLETENESS 2 $99,500 60 $95,875 371 $111,657 12 $65,614 0 $0 10 $101,692 1 $30,420
Aggregated Statistics For Year 2004(Based on 27 full and 2 partial tracts) A) FHA, FSA/RHS & VA B) Conventional C) Refinancings D) Home Improvement Loans E) Loans on Dwellings For 5+ Families F) Non-occupant Loans on G) Loans On Manufactured Number Average Value Number Average Value Number Average Value Number Average Value Number Average Value Number Average Value Number Average Value
LOANS ORIGINATED 273 $95,747 1,133 $104,507 1,194 $92,717 364 $23,546 30 $273,418 241 $77,147 30 $32,928 APPLICATIONS APPROVED, NOT ACCEPTED 15 $77,603 260 $88,993 323 $80,892 69 $27,073 1 $105,000 33 $66,283 17 $32,360 APPLICATIONS DENIED 36 $85,345 450 $82,986 1,585 $81,328 513 $25,804 0 $0 111 $61,162 74 $31,297 APPLICATIONS WITHDRAWN 54 $86,073 231 $104,757 780 $94,139 55 $47,553 0 $0 55 $66,061 8 $36,344 FILES CLOSED FOR INCOMPLETENESS 15 $115,220 59 $110,224 452 $107,854 11 $96,903 0 $0 21 $86,310 2 $36,740
Aggregated Statistics For Year 2003(Based on 27 full and 2 partial tracts) A) FHA, FSA/RHS & VA B) Conventional C) Refinancings D) Home Improvement Loans E) Loans on Dwellings For 5+ Families F) Non-occupant Loans on Number Average Value Number Average Value Number Average Value Number Average Value Number Average Value Number Average Value
LOANS ORIGINATED 285 $99,029 806 $114,149 1,486 $102,164 359 $13,852 26 $465,290 182 $80,061 APPLICATIONS APPROVED, NOT ACCEPTED 29 $90,479 194 $93,485 306 $89,127 39 $24,494 0 $0 36 $72,116 APPLICATIONS DENIED 78 $85,775 330 $75,993 1,293 $74,038 405 $15,658 1 $384,000 97 $50,923 APPLICATIONS WITHDRAWN 50 $84,644 165 $99,041 916 $89,406 25 $18,063 0 $0 53 $56,748 FILES CLOSED FOR INCOMPLETENESS 17 $102,049 38 $99,856 95 $93,289 9 $35,667 0 $0 2 $51,985
Aggregated Statistics For Year 2002(Based on 15 full and 1 partial tracts) A) FHA, FSA/RHS & VA B) Conventional C) Refinancings D) Home Improvement Loans E) Loans on Dwellings For 5+ Families F) Non-occupant Loans on Number Average Value Number Average Value Number Average Value Number Average Value Number Average Value Number Average Value
LOANS ORIGINATED 129 $77,138 241 $60,236 280 $60,680 165 $10,327 6 $567,167 59 $47,803 APPLICATIONS APPROVED, NOT ACCEPTED 8 $64,704 32 $66,437 55 $71,357 28 $16,351 0 $0 5 $62,776 APPLICATIONS DENIED 27 $62,450 155 $48,149 290 $56,104 191 $10,430 1 $750,000 35 $33,260 APPLICATIONS WITHDRAWN 18 $73,033 46 $63,704 161 $60,391 15 $12,152 0 $0 10 $56,600 FILES CLOSED FOR INCOMPLETENESS 7 $74,311 4 $81,858 74 $70,399 3 $31,000 0 $0 3 $45,667
Aggregated Statistics For Year 2001(Based on 15 full and 1 partial tracts) A) FHA, FSA/RHS & VA B) Conventional C) Refinancings D) Home Improvement Loans E) Loans on Dwellings For 5+ Families F) Non-occupant Loans on Number Average Value Number Average Value Number Average Value Number Average Value Number Average Value Number Average Value
LOANS ORIGINATED 157 $78,608 306 $50,501 253 $61,532 216 $9,515 2 $115,500 113 $54,534 APPLICATIONS APPROVED, NOT ACCEPTED 6 $92,822 78 $43,038 64 $55,618 32 $14,122 0 $0 8 $55,341 APPLICATIONS DENIED 30 $86,913 343 $41,413 254 $51,593 170 $7,551 0 $0 40 $54,817 APPLICATIONS WITHDRAWN 41 $82,233 103 $69,984 159 $47,755 13 $9,446 0 $0 28 $74,596 FILES CLOSED FOR INCOMPLETENESS 4 $71,472 9 $65,326 32 $58,402 3 $24,893 0 $0 2 $81,980
Aggregated Statistics For Year 2000(Based on 15 full and 1 partial tracts) A) FHA, FSA/RHS & VA B) Conventional C) Refinancings D) Home Improvement Loans E) Loans on Dwellings For 5+ Families F) Non-occupant Loans on Number Average Value Number Average Value Number Average Value Number Average Value Number Average Value Number Average Value
LOANS ORIGINATED 141 $70,018 369 $48,492 116 $54,147 188 $9,058 8 $439,601 67 $46,761 APPLICATIONS APPROVED, NOT ACCEPTED 49 $58,993 189 $43,738 46 $61,973 65 $11,111 0 $0 5 $35,942 APPLICATIONS DENIED 52 $58,700 823 $38,992 160 $44,477 210 $8,797 0 $0 35 $33,912 APPLICATIONS WITHDRAWN 13 $73,863 47 $55,820 90 $47,260 17 $9,581 0 $0 7 $42,369 FILES CLOSED FOR INCOMPLETENESS 2 $61,080 18 $51,228 77 $62,014 1 $33,390 0 $0 3 $61,000
Aggregated Statistics For Year 1999(Based on 20 full and 2 partial tracts) A) FHA, FSA/RHS & VA B) Conventional C) Refinancings D) Home Improvement Loans E) Loans on Dwellings For 5+ Families F) Non-occupant Loans on Number Average Value Number Average Value Number Average Value Number Average Value Number Average Value Number Average Value
LOANS ORIGINATED 331 $81,715 1,021 $75,153 567 $79,514 336 $11,800 6 $148,553 165 $53,505 APPLICATIONS APPROVED, NOT ACCEPTED 8 $85,224 377 $45,286 97 $54,615 44 $20,132 0 $0 9 $56,750 APPLICATIONS DENIED 41 $75,876 2,067 $39,388 325 $61,914 279 $10,546 2 $753,050 71 $42,853 APPLICATIONS WITHDRAWN 35 $75,669 155 $79,769 291 $68,662 38 $20,549 1 $12,000 10 $51,029 FILES CLOSED FOR INCOMPLETENESS 14 $87,811 16 $162,247 145 $65,261 2 $15,000 0 $0 5 $49,480
Detailed mortgage data for all 29 tracts in Laredo, TX
Private Mortgage Insurance Companies Aggregated Statistics For Year 2009(Based on 17 full and 1 partial tracts) A) Conventional B) Refinancings C) Non-occupant Loans on Number Average Value Number Average Value Number Average Value
LOANS ORIGINATED 33 $182,945 16 $132,862 1 $37,090 APPLICATIONS APPROVED, NOT ACCEPTED 17 $145,866 6 $141,482 2 $135,460 APPLICATIONS DENIED 3 $343,667 9 $209,111 0 $0 APPLICATIONS WITHDRAWN 4 $182,480 1 $140,000 0 $0 FILES CLOSED FOR INCOMPLETENESS 2 $172,500 0 $0 0 $0
Aggregated Statistics For Year 2008(Based on 24 full and 2 partial tracts) A) Conventional B) Refinancings C) Non-occupant Loans on D) Loans On Manufactured Number Average Value Number Average Value Number Average Value Number Average Value
LOANS ORIGINATED 163 $147,945 39 $145,488 5 $125,198 0 $0 APPLICATIONS APPROVED, NOT ACCEPTED 91 $143,618 20 $161,890 5 $83,390 1 $75,000 APPLICATIONS DENIED 28 $158,773 3 $118,000 1 $60,840 0 $0 APPLICATIONS WITHDRAWN 9 $102,886 3 $154,450 1 $64,000 0 $0 FILES CLOSED FOR INCOMPLETENESS 8 $116,119 2 $157,000 2 $157,000 0 $0
Aggregated Statistics For Year 2007(Based on 26 full and 2 partial tracts) A) Conventional B) Refinancings C) Non-occupant Loans on D) Loans On Manufactured Number Average Value Number Average Value Number Average Value Number Average Value
LOANS ORIGINATED 329 $133,067 41 $152,338 23 $83,665 0 $0 APPLICATIONS APPROVED, NOT ACCEPTED 44 $131,700 13 $147,802 6 $100,667 1 $77,000 APPLICATIONS DENIED 5 $85,800 0 $0 2 $67,000 0 $0 APPLICATIONS WITHDRAWN 4 $128,000 1 $120,000 0 $0 0 $0 FILES CLOSED FOR INCOMPLETENESS 1 $54,000 0 $0 0 $0 0 $0
Aggregated Statistics For Year 2006(Based on 26 full and 2 partial tracts) A) Conventional B) Refinancings C) Non-occupant Loans on D) Loans On Manufactured Number Average Value Number Average Value Number Average Value Number Average Value
LOANS ORIGINATED 245 $142,949 25 $173,036 17 $67,316 1 $58,970 APPLICATIONS APPROVED, NOT ACCEPTED 35 $129,919 9 $183,983 5 $81,378 1 $60,000 APPLICATIONS DENIED 1 $298,000 0 $0 0 $0 0 $0 APPLICATIONS WITHDRAWN 10 $146,126 1 $127,000 1 $41,000 0 $0 FILES CLOSED FOR INCOMPLETENESS 0 $0 0 $0 0 $0 0 $0
Aggregated Statistics For Year 2005(Based on 25 full and 2 partial tracts) A) Conventional B) Refinancings C) Non-occupant Loans on D) Loans On Manufactured Number Average Value Number Average Value Number Average Value Number Average Value
LOANS ORIGINATED 258 $131,190 45 $114,317 27 $83,977 1 $40,800 APPLICATIONS APPROVED, NOT ACCEPTED 39 $114,978 14 $129,467 3 $54,987 0 $0 APPLICATIONS DENIED 7 $154,006 1 $124,000 0 $0 0 $0 APPLICATIONS WITHDRAWN 8 $122,240 4 $278,448 1 $74,960 0 $0 FILES CLOSED FOR INCOMPLETENESS 0 $0 0 $0 0 $0 0 $0
Aggregated Statistics For Year 2004(Based on 26 full and 2 partial tracts) A) Conventional B) Refinancings C) Non-occupant Loans on D) Loans On Manufactured Number Average Value Number Average Value Number Average Value Number Average Value
LOANS ORIGINATED 232 $128,279 83 $118,028 19 $77,132 1 $47,000 APPLICATIONS APPROVED, NOT ACCEPTED 51 $144,834 19 $130,311 3 $83,803 2 $124,110 APPLICATIONS DENIED 8 $100,655 1 $97,000 1 $48,000 0 $0 APPLICATIONS WITHDRAWN 14 $89,419 1 $157,000 3 $86,657 0 $0 FILES CLOSED FOR INCOMPLETENESS 2 $43,450 1 $247,000 0 $0 0 $0
Aggregated Statistics For Year 2003(Based on 26 full and 2 partial tracts) A) Conventional B) Refinancings C) Non-occupant Loans on Number Average Value Number Average Value Number Average Value
LOANS ORIGINATED 242 $120,423 146 $117,627 17 $84,232 APPLICATIONS APPROVED, NOT ACCEPTED 43 $89,030 34 $145,582 6 $86,162 APPLICATIONS DENIED 6 $98,933 3 $90,653 0 $0 APPLICATIONS WITHDRAWN 5 $125,908 9 $90,128 1 $115,740 FILES CLOSED FOR INCOMPLETENESS 5 $119,178 1 $89,000 0 $0
Aggregated Statistics For Year 2002(Based on 14 full and 1 partial tracts) A) Conventional B) Refinancings C) Non-occupant Loans on Number Average Value Number Average Value Number Average Value
LOANS ORIGINATED 72 $75,304 27 $72,372 5 $70,386 APPLICATIONS APPROVED, NOT ACCEPTED 11 $53,665 4 $79,980 1 $38,000 APPLICATIONS DENIED 2 $87,735 0 $0 0 $0 APPLICATIONS WITHDRAWN 1 $70,960 0 $0 0 $0 FILES CLOSED FOR INCOMPLETENESS 1 $90,000 0 $0 0 $0
Aggregated Statistics For Year 2001(Based on 14 full and 1 partial tracts) A) Conventional B) Refinancings C) Non-occupant Loans on Number Average Value Number Average Value Number Average Value
LOANS ORIGINATED 41 $68,374 17 $76,823 4 $72,200 APPLICATIONS APPROVED, NOT ACCEPTED 3 $46,333 1 $74,960 0 $0 APPLICATIONS DENIED 2 $79,945 0 $0 0 $0 APPLICATIONS WITHDRAWN 1 $155,060 1 $104,000 0 $0 FILES CLOSED FOR INCOMPLETENESS 2 $63,255 0 $0 0 $0
Aggregated Statistics For Year 2000(Based on 12 full and 1 partial tracts) A) Conventional B) Refinancings C) Non-occupant Loans on Number Average Value Number Average Value Number Average Value
LOANS ORIGINATED 41 $65,130 12 $77,452 2 $86,955 APPLICATIONS APPROVED, NOT ACCEPTED 4 $56,642 0 $0 1 $76,000 APPLICATIONS DENIED 3 $44,333 1 $75,960 0 $0 APPLICATIONS WITHDRAWN 0 $0 1 $84,000 0 $0 FILES CLOSED FOR INCOMPLETENESS 2 $32,305 0 $0 0 $0
Aggregated Statistics For Year 1999(Based on 16 full and 1 partial tracts) A) Conventional B) Refinancings C) Non-occupant Loans on Number Average Value Number Average Value Number Average Value
LOANS ORIGINATED 209 $101,274 47 $105,487 4 $75,382 APPLICATIONS APPROVED, NOT ACCEPTED 19 $102,395 5 $97,608 0 $0 APPLICATIONS DENIED 17 $99,067 1 $176,290 0 $0 APPLICATIONS WITHDRAWN 7 $84,630 1 $176,290 0 $0 FILES CLOSED FOR INCOMPLETENESS 1 $68,180 1 $95,000 0 $0
Fire-safe hotels and motels in Laredo, Texas:
La Quinta Inn - Laredo, 3610 Santa Ursula, Laredo, Texas 78041 Phone: (956) 722-0511, Fax: (956) 723-6642
Ramada Plaza - Laredo, 800 Garden St, Laredo, Texas 78040 Phone: (956) 727-5800, Fax: (956) 727-0278
Americas Best Value Inn, 5240 San Bernardo Ave, Laredo, Texas 78041 Phone: (956) 723-3603, Fax: (956) 724-7697
Hampton Inn Laredo, 7903 San Dario, Laredo, Texas 78045 Phone: (956) 717-8888
Extended Stay America - Laredo - Del Mar, 106 W Village Blvd, Laredo, Texas 78040 Phone: (956) 724-1920, Fax: (956) 724-7119
La Posada Hotel & Suites, 1000 Zaragoza St, Laredo, Texas 78040 Phone: (956) 722-1701, Fax: (956) 722-4758
Days Inn & Suites, 7060 San Bernardo, Laredo, Texas 78041 Phone: (956) 724-8221, Fax: (956) 724-2082
Residence Inn By Marriott Laredo, 310 Lost Oaks Blvd, Laredo, Texas 78041 Phone: (956) 753-9700, Fax: (956) 753-9702
15 other hotels and motels
All 23 fire-safe hotels and motels in Laredo, Texas
Most common first names in Laredo, TX among deceased individuals Name Count Lived (average)
Maria 1,570 76.6 years Jose 984 72.2 years Juan 543 68.6 years Guadalupe 416 76.6 years Jesus 355 71.5 years Manuel 330 74.6 years Francisco 291 74.5 years Antonio 290 73.9 years Pedro 244 74.1 years Francisca 197 79.1 years
Most common last names in Laredo, TX among deceased individuals Last name Count Lived (average)
Garcia 867 74.8 years Gonzalez 793 74.4 years Martinez 768 74.6 years Rodriguez 699 74.1 years Garza 479 74.4 years Hernandez 398 72.5 years Sanchez 372 75.0 years Flores 362 75.6 years Ramirez 345 75.1 years Lopez 332 74.5 years
Laredo compared to Texas state average:
Median house value below state average. Black race population percentage significantly below state average. Hispanic race population percentage significantly above state average. Foreign-born population percentage significantly above state average. Laredo, TX compared to other similar cities:
#4 on the list of "Top 101 cities with largest percentage of males in industries: transportation and warehousing (population 50,000+)"
#4 on the list of "Top 101 cities with largest percentage of females in industries: transportation and warehousing (population 50,000+)"
#5 on the list of "Top 100 least racially diverse cities (pop. 50,000+)"
#6 on the list of "Top 101 cities with the highest percentage of family households, population 100,000+"
#8 on the list of "Top 101 cities with the lowest percentage of English-only speaking households, population 50,000+"
#9 on the list of "Top 101 cities with largest percentage of males in industries: mining, quarrying, and oil and gas extraction (population 50,000+)"
#21 on the list of "Top 101 cities with largest percentage of males in occupations: law enforcement workers including supervisors (population 50,000+)"
#21 on the list of "Top 101 cities with largest percentage of males in occupations: transportation occupations (population 50,000+)"
#29 on the list of "Top 101 cities with the hottest summers (population 50,000+)"
#31 on the list of "Top 101 cities with the highest daily high temperatures (population 50,000+)"
#32 on the list of "Top 101 cities with largest percentage of females in occupations: law enforcement workers including supervisors (population 50,000+)"
#34 on the list of "Top 101 cities with largest percentage of females in occupations: office and administrative support occupations (population 50,000+)"
#35 on the list of "Top 101 cities with largest percentage of males in occupations: fire fighting and prevention workers including supervisors (population 50,000+)"
#40 on the list of "Top 100 cities with youngest residents (pop. 50,000+)"
#49 on the list of "Top 101 cities with the highest average humidity (population 50,000+)"
#49 on the list of "Top 100 least-educated cities (pop. 50,000+)"
#50 on the list of "Top 101 cities with largest percentage of males in industries: public administration (population 50,000+)"
#50 on the list of "Top 101 cities with the smallest percentages of current college students (population 100,000+)"
#51 on the list of "Top 101 cities with the highest average wind speeds (population 50,000+)"
#55 on the list of "Top 101 cities with the highest average temperatures (population 50,000+)"
#47 (78040) on the list of "Top 101 zip codes with the smallest percentage of taxpayers reporting net capital gain/loss in 2012 (pop 1,000+)"
#60 (78040) on the list of "Top 101 zip codes with the smallest percentage of taxpayers using charity contributions deductions in 2012 (pop 5,000+)"
#78 (78040) on the list of "Top 101 zip codes with the lowest charity contributions deductions as a percentage of AGI in 2012 (pop 5,000+)"
#1 on the list of "Top 101 counties with the lowest percentage of residents relocating to other counties in 2011"
#3 on the list of "Top 101 counties with the lowest percentage of residents relocating from other counties between 2010 and 2011"
#3 on the list of "Top 101 counties with the highest number of births per 1000 residents 2007-2013"
#23 on the list of "Top 101 counties with highest percentage of residents voting for Obama (Democrat) in the 2012 Presidential Election (pop. 50,000+)"
#23 on the list of "Top 101 counties with the largest decrease in the number of births per 1000 residents 2000-2006 to 2007-2013 (pop 50,000+)"
Top Patent Applicants
Zeus O. Courtois (5)
Francis E. Erbes (3)
Kenneth Salinas (3)
John Valle (3)
Cordelia Salinas (3)
Howard D. Jenkel (3)
Ricardo Montemayor (2)
Abdiel Guajardo (2)
Jose Medina (2)
Hilda Eunice Gibson (2)
Total of 45 patent applications in 2008-2024.
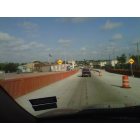
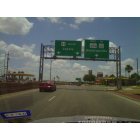

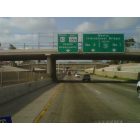

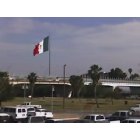

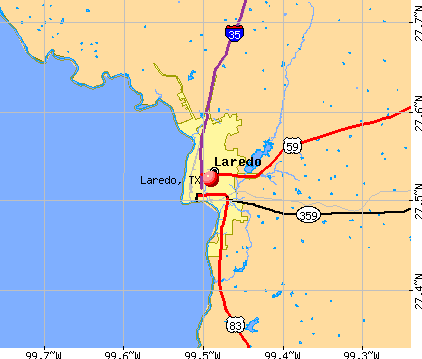


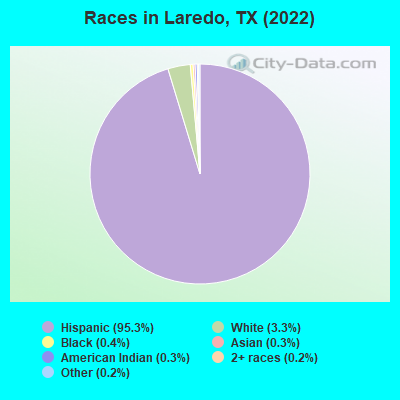
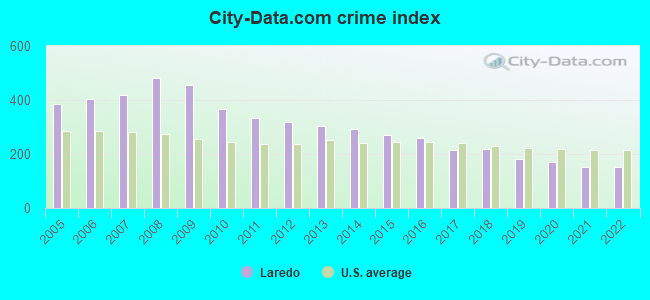
 Recent articles from our blog. Our writers, many of them Ph.D. graduates or candidates, create easy-to-read articles on a wide variety of topics.

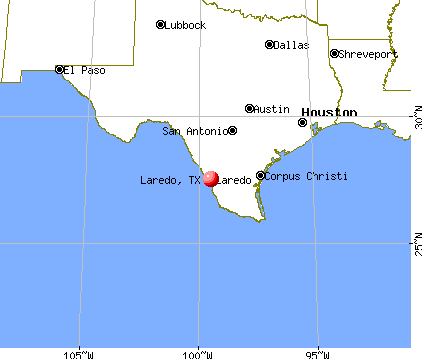
 (128.9 miles
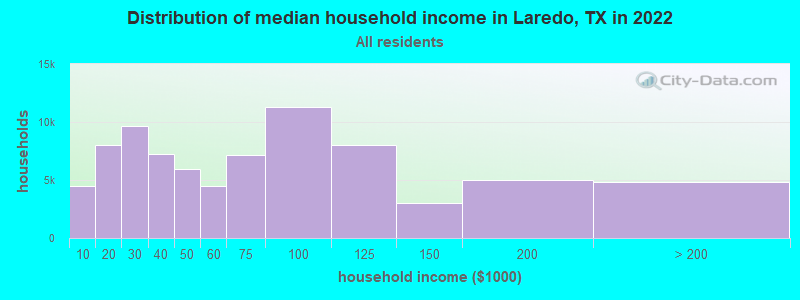
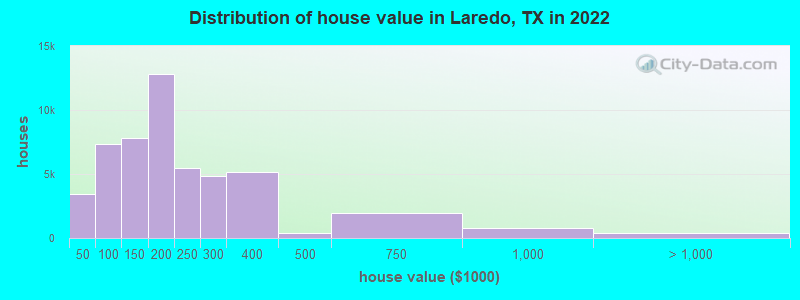
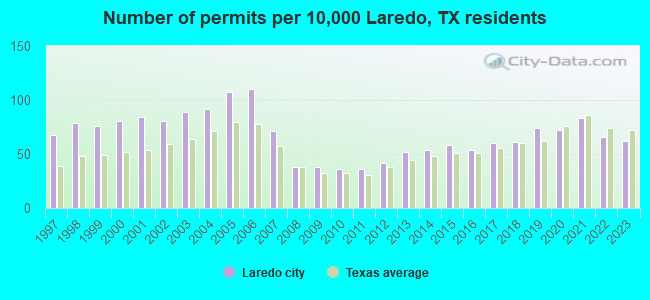
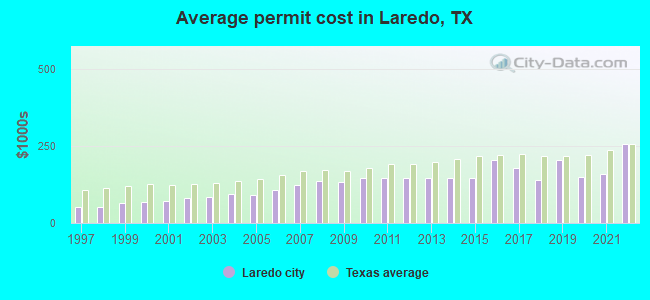
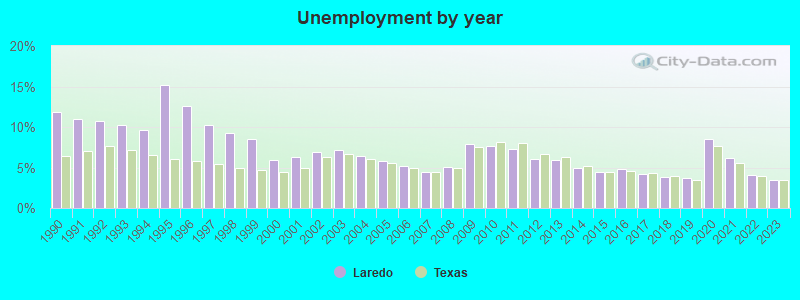
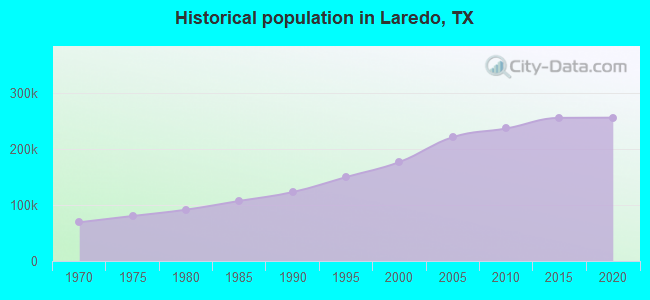
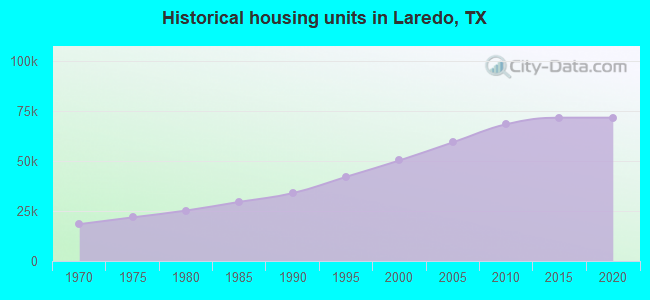
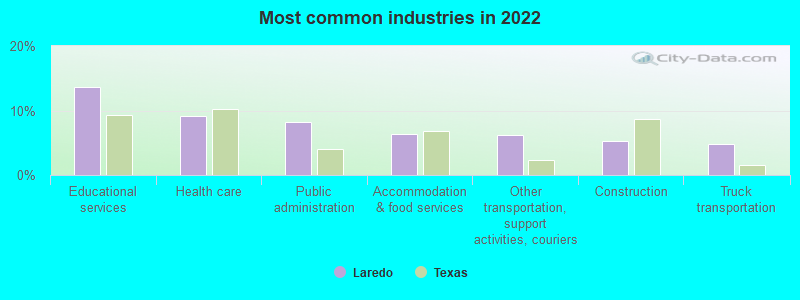

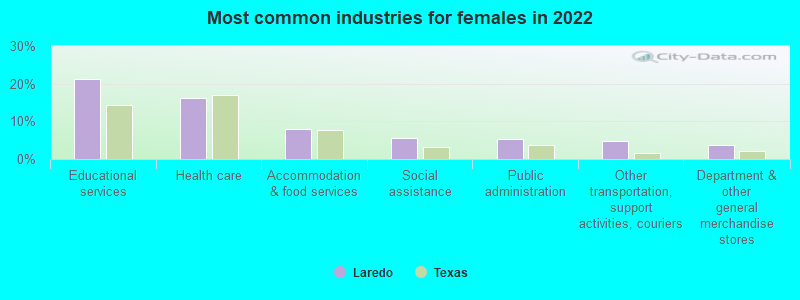
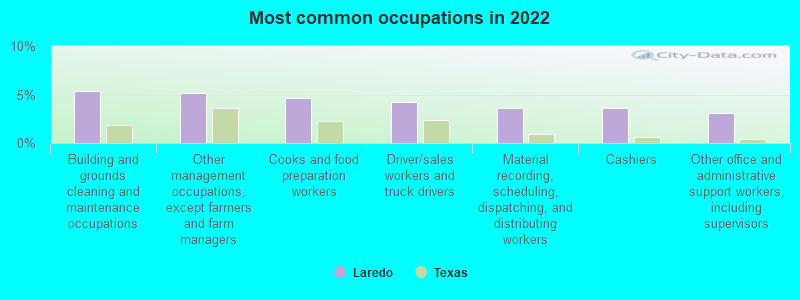
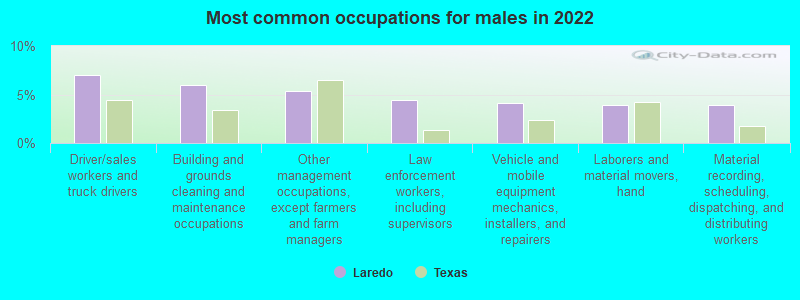
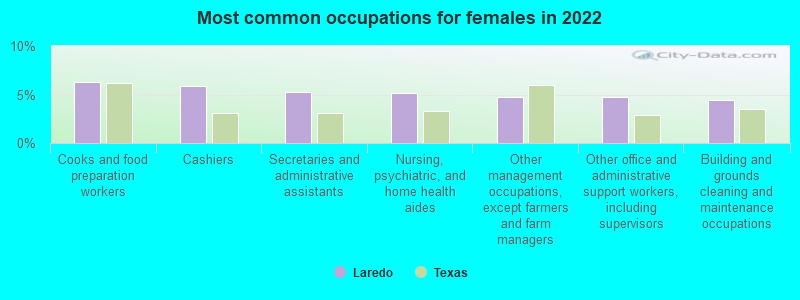


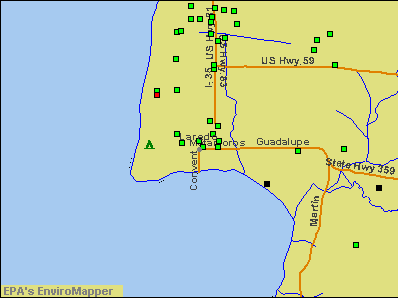

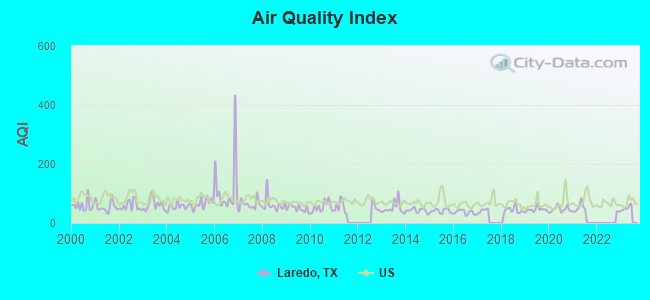
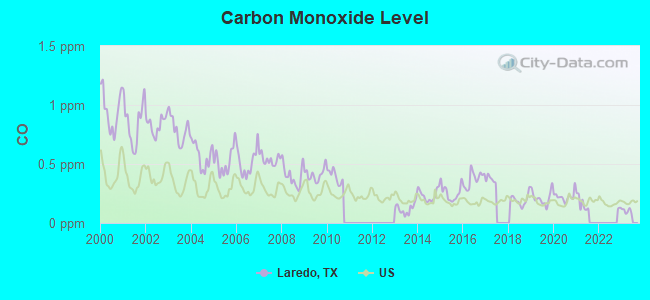
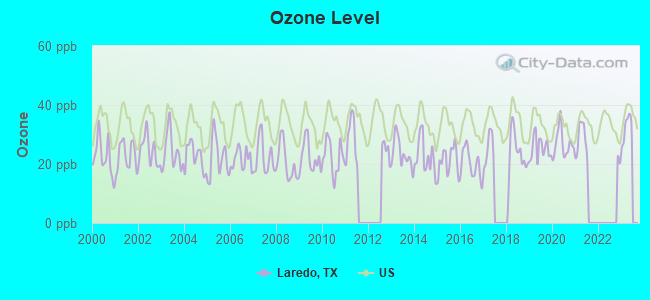
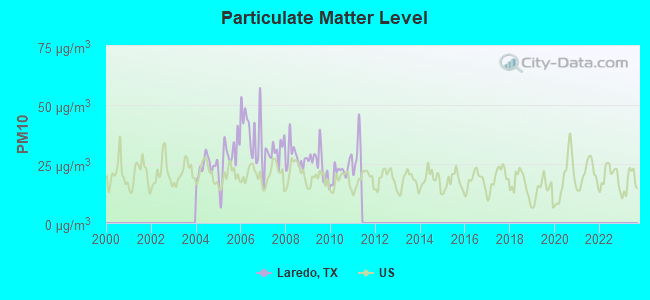
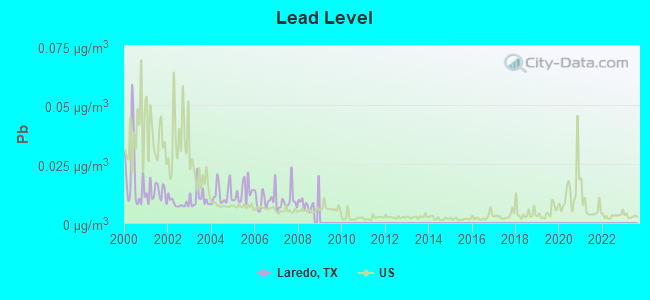
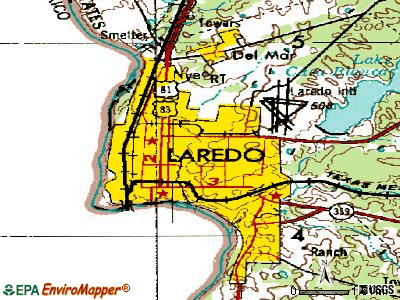
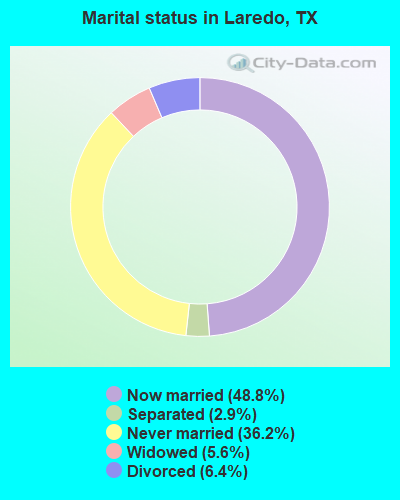
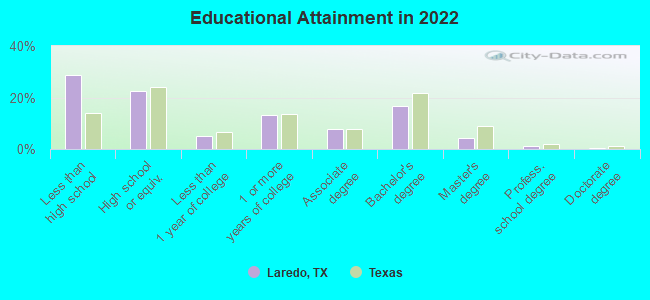

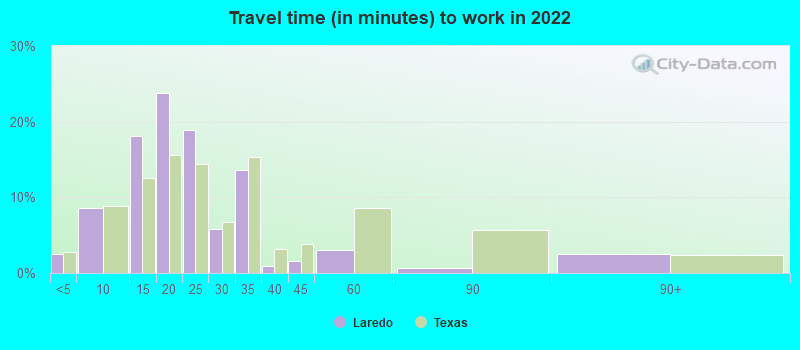
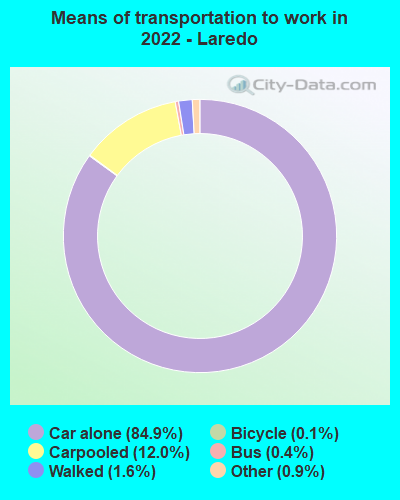
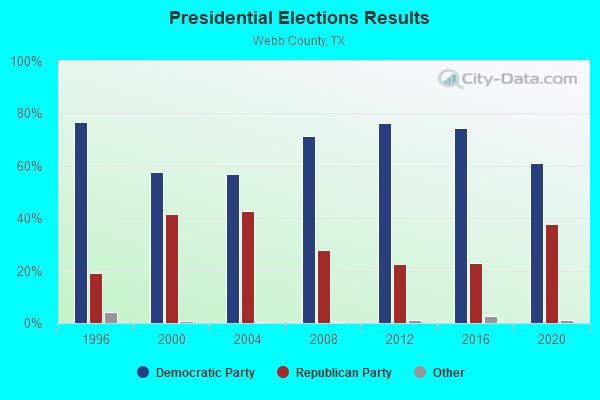
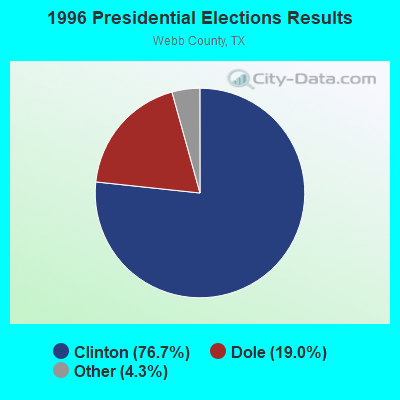
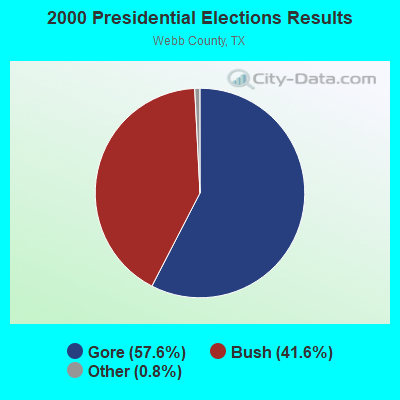

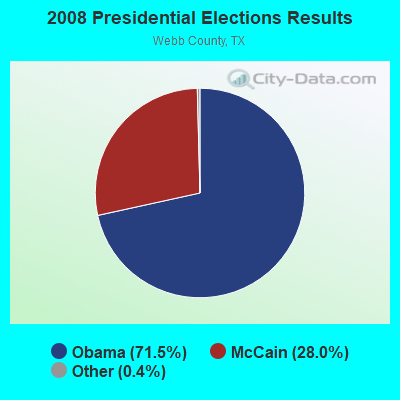
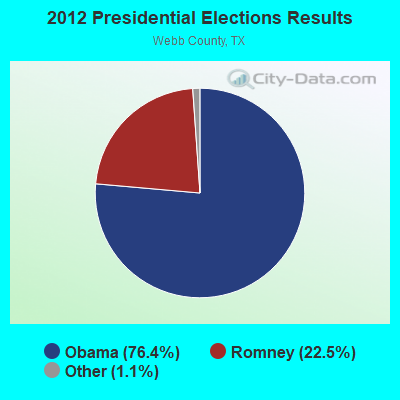
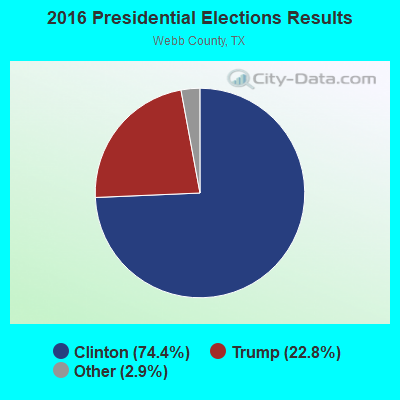
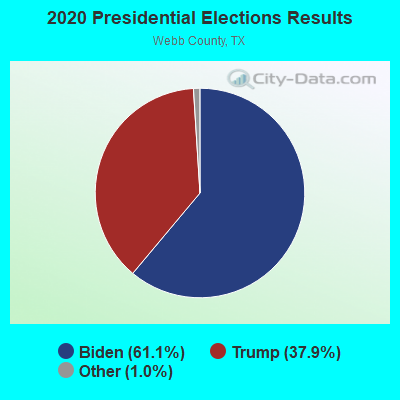
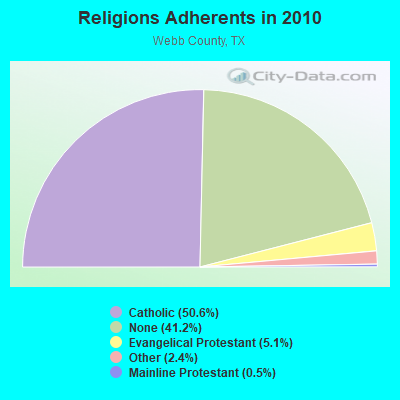
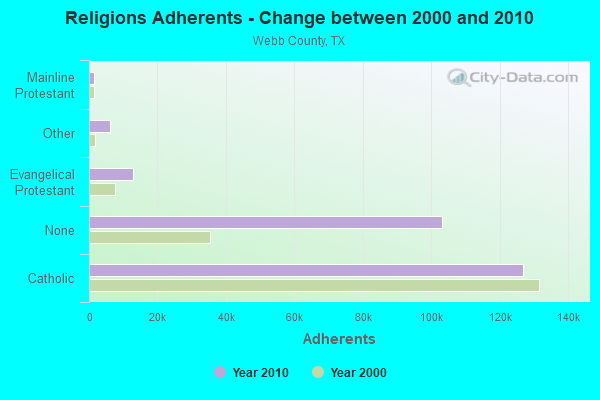
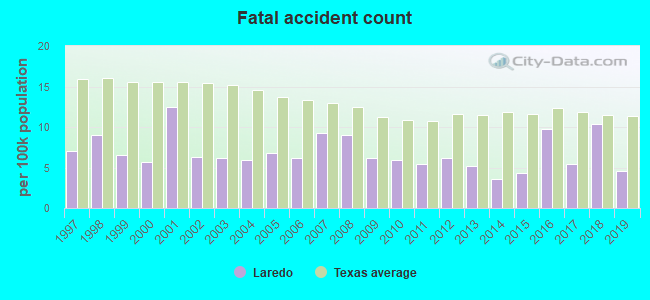
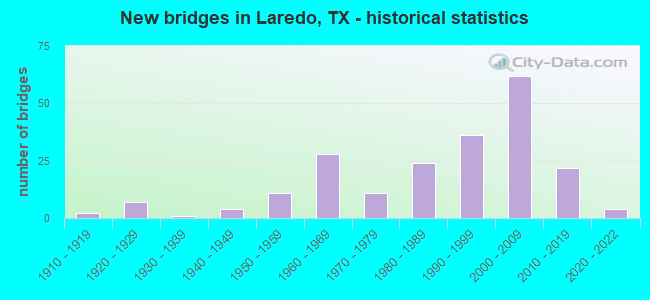
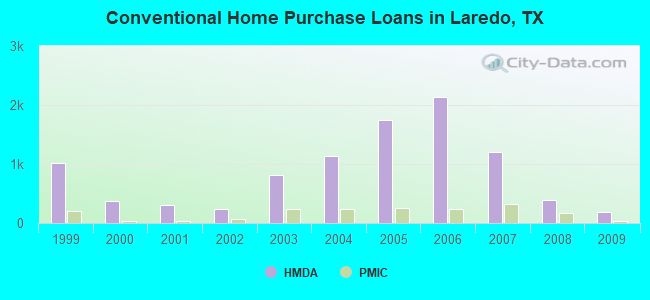
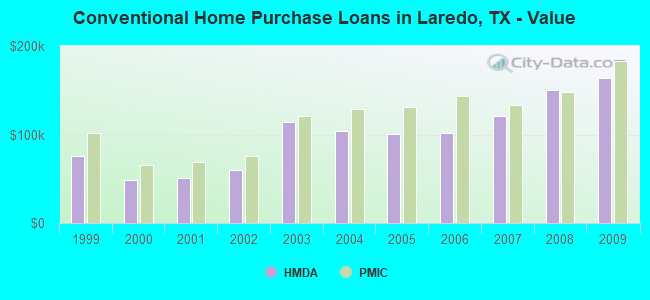
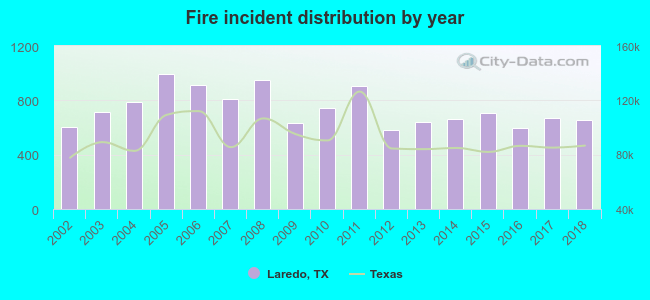 According to the data from the years 2002 - 2018 the average number of fire incidents per year is 739. The highest number of reported fires - 994 took place in 2005, and the least - 579 in 2012. The data has a growing trend.
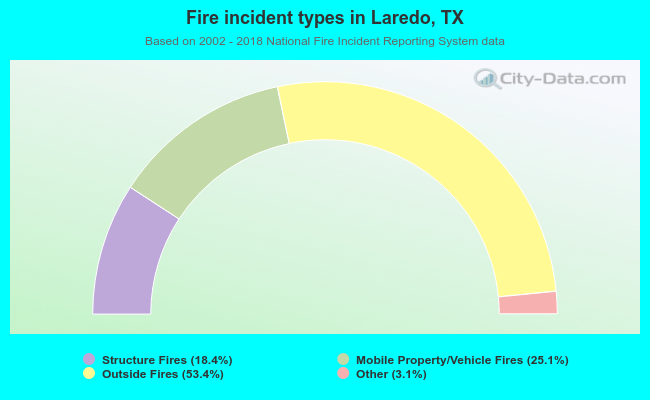 When looking into fire subcategories, the most reports belonged to: Outside Fires (53.4%), and Mobile Property/Vehicle Fires (25.1%).