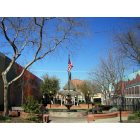
Lemoore, California Submit your own pictures of this city and show them to the world
OSM Map
General Map
Google Map
MSN Map
OSM Map
General Map
Google Map
MSN Map
OSM Map
General Map
Google Map
MSN Map
OSM Map
General Map
Google Map
MSN Map
Please wait while loading the map...
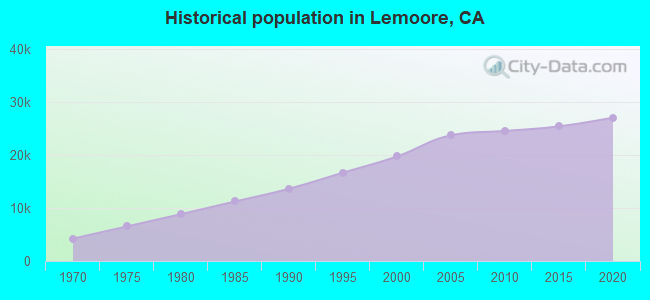
Population in 2022: 27,185 (99% urban, 1% rural). Population change since 2000: +37.9%Males: 14,122 Females: 13,063
March 2022 cost of living index in Lemoore: 94.0 (less than average, U.S. average is 100) Percentage of residents living in poverty in 2022: 15.0%for White Non-Hispanic residents , 11.2% for Black residents , 20.3% for Hispanic or Latino residents , 67.3% for American Indian residents , 20.5% for other race residents , 19.7% for two or more races residents )Business Search - 14 Million verified businesses
Data:
Median household income ($)
Median household income (% change since 2000)
Household income diversity
Ratio of average income to average house value (%)
Ratio of average income to average rent
Median household income ($) - White
Median household income ($) - Black or African American
Median household income ($) - Asian
Median household income ($) - Hispanic or Latino
Median household income ($) - American Indian and Alaska Native
Median household income ($) - Multirace
Median household income ($) - Other Race
Median household income for houses/condos with a mortgage ($)
Median household income for apartments without a mortgage ($)
Races - White alone (%)
Races - White alone (% change since 2000)
Races - Black alone (%)
Races - Black alone (% change since 2000)
Races - American Indian alone (%)
Races - American Indian alone (% change since 2000)
Races - Asian alone (%)
Races - Asian alone (% change since 2000)
Races - Hispanic (%)
Races - Hispanic (% change since 2000)
Races - Native Hawaiian and Other Pacific Islander alone (%)
Races - Native Hawaiian and Other Pacific Islander alone (% change since 2000)
Races - Two or more races (%)
Races - Two or more races (% change since 2000)
Races - Other race alone (%)
Races - Other race alone (% change since 2000)
Racial diversity
Unemployment (%)
Unemployment (% change since 2000)
Unemployment (%) - White
Unemployment (%) - Black or African American
Unemployment (%) - Asian
Unemployment (%) - Hispanic or Latino
Unemployment (%) - American Indian and Alaska Native
Unemployment (%) - Multirace
Unemployment (%) - Other Race
Population density (people per square mile)
Population - Males (%)
Population - Females (%)
Population - Males (%) - White
Population - Males (%) - Black or African American
Population - Males (%) - Asian
Population - Males (%) - Hispanic or Latino
Population - Males (%) - American Indian and Alaska Native
Population - Males (%) - Multirace
Population - Males (%) - Other Race
Population - Females (%) - White
Population - Females (%) - Black or African American
Population - Females (%) - Asian
Population - Females (%) - Hispanic or Latino
Population - Females (%) - American Indian and Alaska Native
Population - Females (%) - Multirace
Population - Females (%) - Other Race
Coronavirus confirmed cases (Apr 27, 2024)
Deaths caused by coronavirus (Apr 27, 2024)
Coronavirus confirmed cases (per 100k population) (Apr 27, 2024)
Deaths caused by coronavirus (per 100k population) (Apr 27, 2024)
Daily increase in number of cases (Apr 27, 2024)
Weekly increase in number of cases (Apr 27, 2024)
Cases doubled (in days) (Apr 27, 2024)
Hospitalized patients (Apr 18, 2022)
Negative test results (Apr 18, 2022)
Total test results (Apr 18, 2022)
COVID Vaccine doses distributed (per 100k population) (Sep 19, 2023)
COVID Vaccine doses administered (per 100k population) (Sep 19, 2023)
COVID Vaccine doses distributed (Sep 19, 2023)
COVID Vaccine doses administered (Sep 19, 2023)
Likely homosexual households (%)
Likely homosexual households (% change since 2000)
Likely homosexual households - Lesbian couples (%)
Likely homosexual households - Lesbian couples (% change since 2000)
Likely homosexual households - Gay men (%)
Likely homosexual households - Gay men (% change since 2000)
Cost of living index
Median gross rent ($)
Median contract rent ($)
Median monthly housing costs ($)
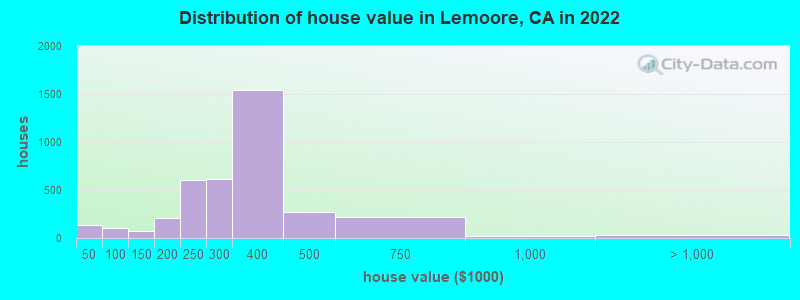
Median house or condo value ($)
Median house or condo value ($ change since 2000)
Mean house or condo value by units in structure - 1, detached ($)
Mean house or condo value by units in structure - 1, attached ($)
Mean house or condo value by units in structure - 2 ($)
Mean house or condo value by units in structure by units in structure - 3 or 4 ($)
Mean house or condo value by units in structure - 5 or more ($)
Mean house or condo value by units in structure - Boat, RV, van, etc. ($)
Mean house or condo value by units in structure - Mobile home ($)
Median house or condo value ($) - White
Median house or condo value ($) - Black or African American
Median house or condo value ($) - Asian
Median house or condo value ($) - Hispanic or Latino
Median house or condo value ($) - American Indian and Alaska Native
Median house or condo value ($) - Multirace
Median house or condo value ($) - Other Race
Median resident age
Resident age diversity
Median resident age - Males
Median resident age - Females
Median resident age - White
Median resident age - Black or African American
Median resident age - Asian
Median resident age - Hispanic or Latino
Median resident age - American Indian and Alaska Native
Median resident age - Multirace
Median resident age - Other Race
Median resident age - Males - White
Median resident age - Males - Black or African American
Median resident age - Males - Asian
Median resident age - Males - Hispanic or Latino
Median resident age - Males - American Indian and Alaska Native
Median resident age - Males - Multirace
Median resident age - Males - Other Race
Median resident age - Females - White
Median resident age - Females - Black or African American
Median resident age - Females - Asian
Median resident age - Females - Hispanic or Latino
Median resident age - Females - American Indian and Alaska Native
Median resident age - Females - Multirace
Median resident age - Females - Other Race
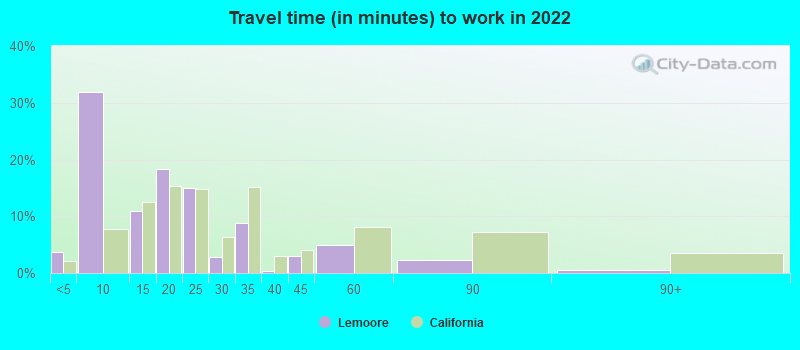
Commute - mean travel time to work (minutes)
Travel time to work - Less than 5 minutes (%)
Travel time to work - Less than 5 minutes (% change since 2000)
Travel time to work - 5 to 9 minutes (%)
Travel time to work - 5 to 9 minutes (% change since 2000)
Travel time to work - 10 to 19 minutes (%)
Travel time to work - 10 to 19 minutes (% change since 2000)
Travel time to work - 20 to 29 minutes (%)
Travel time to work - 20 to 29 minutes (% change since 2000)
Travel time to work - 30 to 39 minutes (%)
Travel time to work - 30 to 39 minutes (% change since 2000)
Travel time to work - 40 to 59 minutes (%)
Travel time to work - 40 to 59 minutes (% change since 2000)
Travel time to work - 60 to 89 minutes (%)
Travel time to work - 60 to 89 minutes (% change since 2000)
Travel time to work - 90 or more minutes (%)
Travel time to work - 90 or more minutes (% change since 2000)
Marital status - Never married (%)
Marital status - Now married (%)
Marital status - Separated (%)
Marital status - Widowed (%)
Marital status - Divorced (%)
Median family income ($)
Median family income (% change since 2000)
Median non-family income ($)
Median non-family income (% change since 2000)
Median per capita income ($)
Median per capita income (% change since 2000)
Median family income ($) - White
Median family income ($) - Black or African American
Median family income ($) - Asian
Median family income ($) - Hispanic or Latino
Median family income ($) - American Indian and Alaska Native
Median family income ($) - Multirace
Median family income ($) - Other Race
Median year house/condo built
Median year apartment built
Year house built - Built 2005 or later (%)
Year house built - Built 2000 to 2004 (%)
Year house built - Built 1990 to 1999 (%)
Year house built - Built 1980 to 1989 (%)
Year house built - Built 1970 to 1979 (%)
Year house built - Built 1960 to 1969 (%)
Year house built - Built 1950 to 1959 (%)
Year house built - Built 1940 to 1949 (%)
Year house built - Built 1939 or earlier (%)
Average household size
Household density (households per square mile)
Average household size - White
Average household size - Black or African American
Average household size - Asian
Average household size - Hispanic or Latino
Average household size - American Indian and Alaska Native
Average household size - Multirace
Average household size - Other Race
Occupied housing units (%)
Vacant housing units (%)
Owner occupied housing units (%)
Renter occupied housing units (%)
Vacancy status - For rent (%)
Vacancy status - For sale only (%)
Vacancy status - Rented or sold, not occupied (%)
Vacancy status - For seasonal, recreational, or occasional use (%)
Vacancy status - For migrant workers (%)
Vacancy status - Other vacant (%)
Residents with income below the poverty level (%)
Residents with income below 50% of the poverty level (%)
Children below poverty level (%)
Poor families by family type - Married-couple family (%)
Poor families by family type - Male, no wife present (%)
Poor families by family type - Female, no husband present (%)
Poverty status for native-born residents (%)
Poverty status for foreign-born residents (%)
Poverty among high school graduates not in families (%)
Poverty among people who did not graduate high school not in families (%)
Residents with income below the poverty level (%) - White
Residents with income below the poverty level (%) - Black or African American
Residents with income below the poverty level (%) - Asian
Residents with income below the poverty level (%) - Hispanic or Latino
Residents with income below the poverty level (%) - American Indian and Alaska Native
Residents with income below the poverty level (%) - Multirace
Residents with income below the poverty level (%) - Other Race
Air pollution - Air Quality Index (AQI)
Air pollution - CO
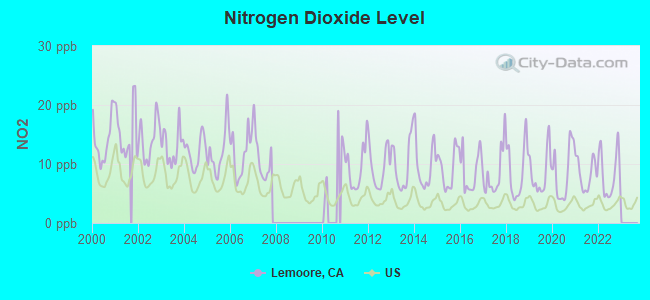
Air pollution - NO2
Air pollution - SO2
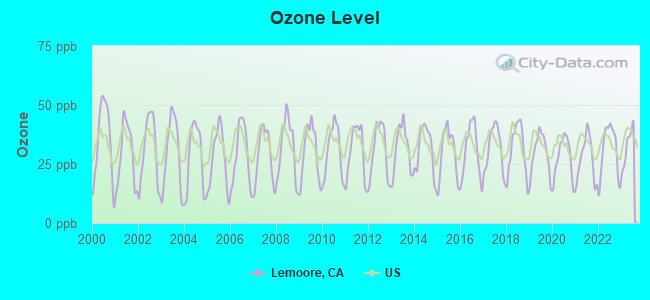
Air pollution - Ozone
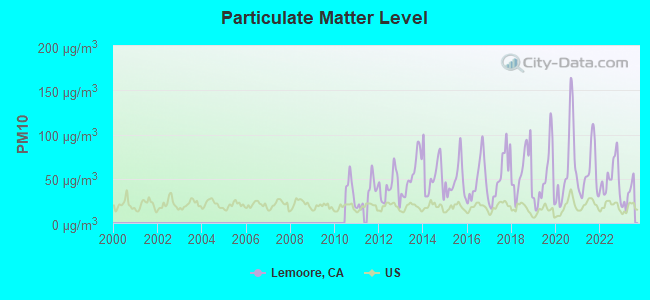
Air pollution - PM10
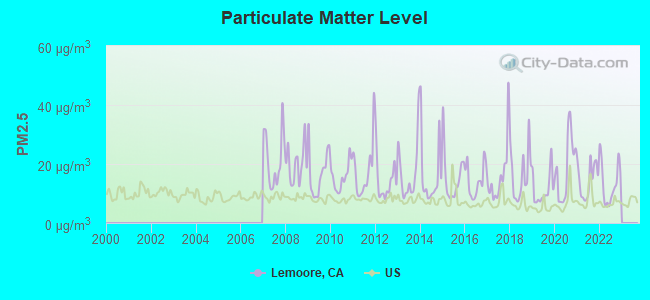
Air pollution - PM25
Air pollution - Pb
Crime - Murders per 100,000 population
Crime - Rapes per 100,000 population
Crime - Robberies per 100,000 population
Crime - Assaults per 100,000 population
Crime - Burglaries per 100,000 population
Crime - Thefts per 100,000 population
Crime - Auto thefts per 100,000 population
Crime - Arson per 100,000 population
Crime - City-data.com crime index
Crime - Violent crime index
Crime - Property crime index
Crime - Murders per 100,000 population (5 year average)
Crime - Rapes per 100,000 population (5 year average)
Crime - Robberies per 100,000 population (5 year average)
Crime - Assaults per 100,000 population (5 year average)
Crime - Burglaries per 100,000 population (5 year average)
Crime - Thefts per 100,000 population (5 year average)
Crime - Auto thefts per 100,000 population (5 year average)
Crime - Arson per 100,000 population (5 year average)
Crime - City-data.com crime index (5 year average)
Crime - Violent crime index (5 year average)
Crime - Property crime index (5 year average)
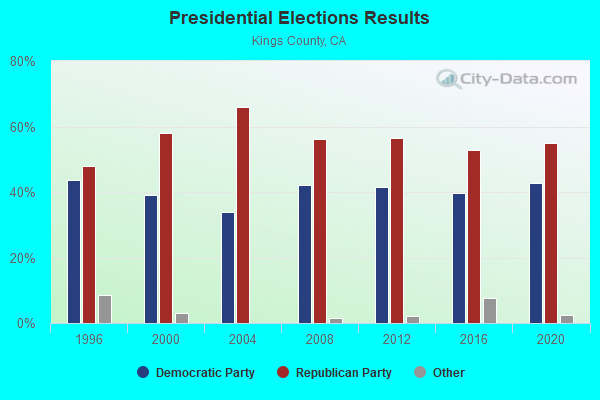
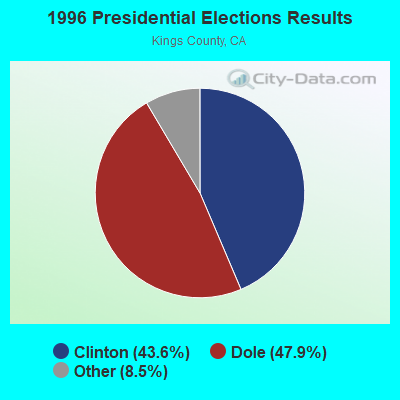
1996 Presidential Elections Results (%) - Democratic Party (Clinton)
1996 Presidential Elections Results (%) - Republican Party (Dole)
1996 Presidential Elections Results (%) - Other
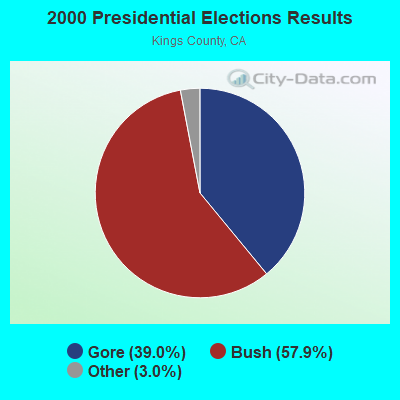
2000 Presidential Elections Results (%) - Democratic Party (Gore)
2000 Presidential Elections Results (%) - Republican Party (Bush)
2000 Presidential Elections Results (%) - Other
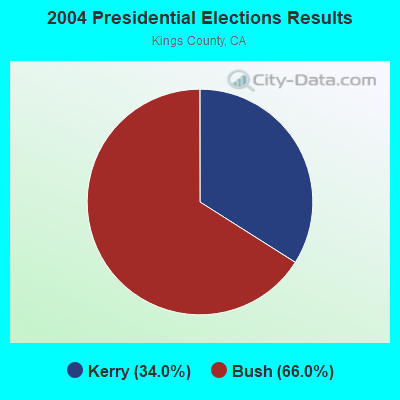
2004 Presidential Elections Results (%) - Democratic Party (Kerry)
2004 Presidential Elections Results (%) - Republican Party (Bush)
2004 Presidential Elections Results (%) - Other
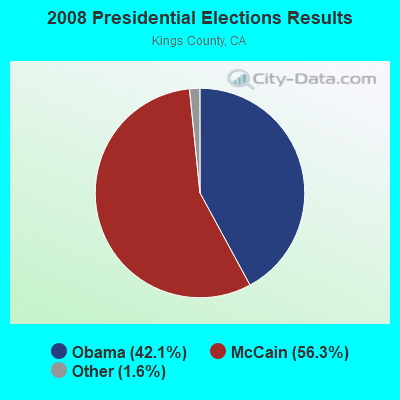
2008 Presidential Elections Results (%) - Democratic Party (Obama)
2008 Presidential Elections Results (%) - Republican Party (McCain)
2008 Presidential Elections Results (%) - Other
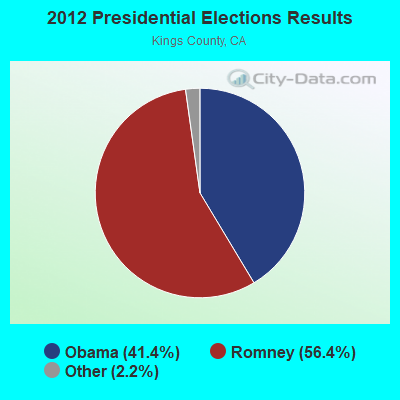
2012 Presidential Elections Results (%) - Democratic Party (Obama)
2012 Presidential Elections Results (%) - Republican Party (Romney)
2012 Presidential Elections Results (%) - Other
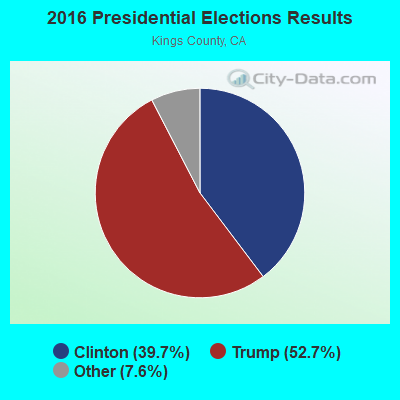
2016 Presidential Elections Results (%) - Democratic Party (Clinton)
2016 Presidential Elections Results (%) - Republican Party (Trump)
2016 Presidential Elections Results (%) - Other
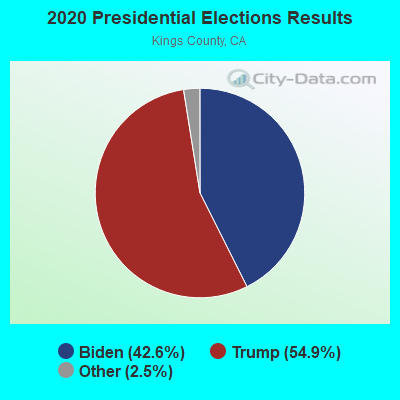
2020 Presidential Elections Results (%) - Democratic Party (Biden)
2020 Presidential Elections Results (%) - Republican Party (Trump)
2020 Presidential Elections Results (%) - Other
Ancestries Reported - Arab (%)
Ancestries Reported - Czech (%)
Ancestries Reported - Danish (%)
Ancestries Reported - Dutch (%)
Ancestries Reported - English (%)
Ancestries Reported - French (%)
Ancestries Reported - French Canadian (%)
Ancestries Reported - German (%)
Ancestries Reported - Greek (%)
Ancestries Reported - Hungarian (%)
Ancestries Reported - Irish (%)
Ancestries Reported - Italian (%)
Ancestries Reported - Lithuanian (%)
Ancestries Reported - Norwegian (%)
Ancestries Reported - Polish (%)
Ancestries Reported - Portuguese (%)
Ancestries Reported - Russian (%)
Ancestries Reported - Scotch-Irish (%)
Ancestries Reported - Scottish (%)
Ancestries Reported - Slovak (%)
Ancestries Reported - Subsaharan African (%)
Ancestries Reported - Swedish (%)
Ancestries Reported - Swiss (%)
Ancestries Reported - Ukrainian (%)
Ancestries Reported - United States (%)
Ancestries Reported - Welsh (%)
Ancestries Reported - West Indian (%)
Ancestries Reported - Other (%)
Educational Attainment - No schooling completed (%)
Educational Attainment - Less than high school (%)
Educational Attainment - High school or equivalent (%)
Educational Attainment - Less than 1 year of college (%)
Educational Attainment - 1 or more years of college (%)
Educational Attainment - Associate degree (%)
Educational Attainment - Bachelor's degree (%)
Educational Attainment - Master's degree (%)
Educational Attainment - Professional school degree (%)
Educational Attainment - Doctorate degree (%)
School Enrollment - Nursery, preschool (%)
School Enrollment - Kindergarten (%)
School Enrollment - Grade 1 to 4 (%)
School Enrollment - Grade 5 to 8 (%)
School Enrollment - Grade 9 to 12 (%)
School Enrollment - College undergrad (%)
School Enrollment - Graduate or professional (%)
School Enrollment - Not enrolled in school (%)
School enrollment - Public schools (%)
School enrollment - Private schools (%)
School enrollment - Not enrolled (%)
Median number of rooms in houses and condos
Median number of rooms in apartments
Housing units lacking complete plumbing facilities (%)
Housing units lacking complete kitchen facilities (%)
Density of houses
Urban houses (%)
Rural houses (%)
Households with people 60 years and over (%)
Households with people 65 years and over (%)
Households with people 75 years and over (%)
Households with one or more nonrelatives (%)
Households with no nonrelatives (%)
Population in households (%)
Family households (%)
Nonfamily households (%)
Population in families (%)
Family households with own children (%)
Median number of bedrooms in owner occupied houses
Mean number of bedrooms in owner occupied houses
Median number of bedrooms in renter occupied houses
Mean number of bedrooms in renter occupied houses
Median number of vehichles in owner occupied houses
Mean number of vehichles in owner occupied houses
Median number of vehichles in renter occupied houses
Mean number of vehichles in renter occupied houses
Mortgage status - with mortgage (%)
Mortgage status - with second mortgage (%)
Mortgage status - with home equity loan (%)
Mortgage status - with both second mortgage and home equity loan (%)
Mortgage status - without a mortgage (%)
Average family size
Average family size - White
Average family size - Black or African American
Average family size - Asian
Average family size - Hispanic or Latino
Average family size - American Indian and Alaska Native
Average family size - Multirace
Average family size - Other Race
Geographical mobility - Same house 1 year ago (%)
Geographical mobility - Moved within same county (%)
Geographical mobility - Moved from different county within same state (%)
Geographical mobility - Moved from different state (%)
Geographical mobility - Moved from abroad (%)
Place of birth - Born in state of residence (%)
Place of birth - Born in other state (%)
Place of birth - Native, outside of US (%)
Place of birth - Foreign born (%)
Housing units in structures - 1, detached (%)
Housing units in structures - 1, attached (%)
Housing units in structures - 2 (%)
Housing units in structures - 3 or 4 (%)
Housing units in structures - 5 to 9 (%)
Housing units in structures - 10 to 19 (%)
Housing units in structures - 20 to 49 (%)
Housing units in structures - 50 or more (%)
Housing units in structures - Mobile home (%)
Housing units in structures - Boat, RV, van, etc. (%)
House/condo owner moved in on average (years ago)
Renter moved in on average (years ago)
Year householder moved into unit - Moved in 1999 to March 2000 (%)
Year householder moved into unit - Moved in 1995 to 1998 (%)
Year householder moved into unit - Moved in 1990 to 1994 (%)
Year householder moved into unit - Moved in 1980 to 1989 (%)
Year householder moved into unit - Moved in 1970 to 1979 (%)
Year householder moved into unit - Moved in 1969 or earlier (%)
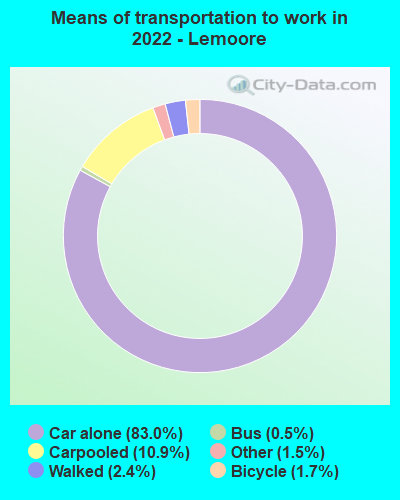
Means of transportation to work - Drove car alone (%)
Means of transportation to work - Carpooled (%)
Means of transportation to work - Public transportation (%)
Means of transportation to work - Bus or trolley bus (%)
Means of transportation to work - Streetcar or trolley car (%)
Means of transportation to work - Subway or elevated (%)
Means of transportation to work - Railroad (%)
Means of transportation to work - Ferryboat (%)
Means of transportation to work - Taxicab (%)
Means of transportation to work - Motorcycle (%)
Means of transportation to work - Bicycle (%)
Means of transportation to work - Walked (%)
Means of transportation to work - Other means (%)
Working at home (%)
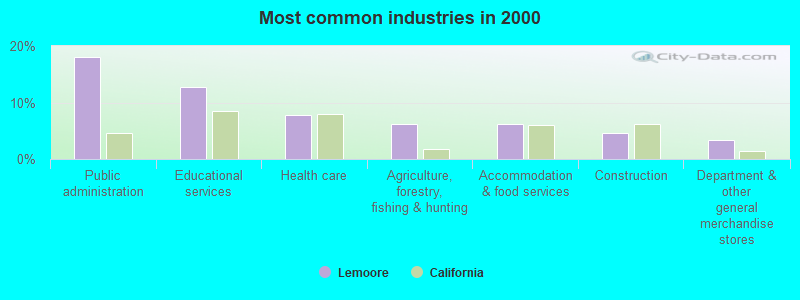
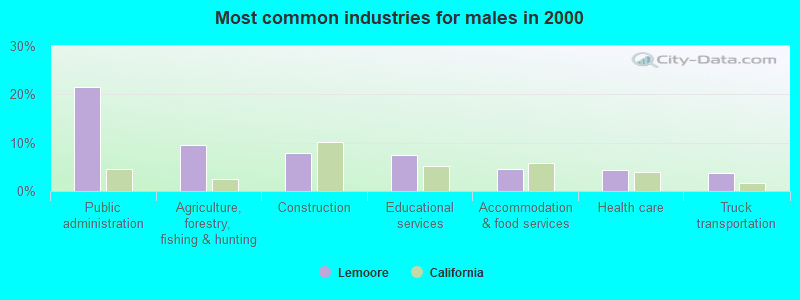
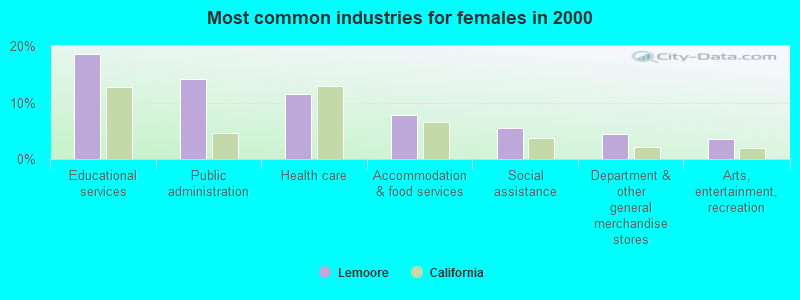
Industry diversity
Most Common Industries - Agriculture, forestry, fishing and hunting, and mining (%)
Most Common Industries - Agriculture, forestry, fishing and hunting (%)
Most Common Industries - Mining, quarrying, and oil and gas extraction (%)
Most Common Industries - Construction (%)
Most Common Industries - Manufacturing (%)
Most Common Industries - Wholesale trade (%)
Most Common Industries - Retail trade (%)
Most Common Industries - Transportation and warehousing, and utilities (%)
Most Common Industries - Transportation and warehousing (%)
Most Common Industries - Utilities (%)
Most Common Industries - Information (%)
Most Common Industries - Finance and insurance, and real estate and rental and leasing (%)
Most Common Industries - Finance and insurance (%)
Most Common Industries - Real estate and rental and leasing (%)
Most Common Industries - Professional, scientific, and management, and administrative and waste management services (%)
Most Common Industries - Professional, scientific, and technical services (%)
Most Common Industries - Management of companies and enterprises (%)
Most Common Industries - Administrative and support and waste management services (%)
Most Common Industries - Educational services, and health care and social assistance (%)
Most Common Industries - Educational services (%)
Most Common Industries - Health care and social assistance (%)
Most Common Industries - Arts, entertainment, and recreation, and accommodation and food services (%)
Most Common Industries - Arts, entertainment, and recreation (%)
Most Common Industries - Accommodation and food services (%)
Most Common Industries - Other services, except public administration (%)
Most Common Industries - Public administration (%)
Occupation diversity
Most Common Occupations - Management, business, science, and arts occupations (%)
Most Common Occupations - Management, business, and financial occupations (%)
Most Common Occupations - Management occupations (%)
Most Common Occupations - Business and financial operations occupations (%)
Most Common Occupations - Computer, engineering, and science occupations (%)
Most Common Occupations - Computer and mathematical occupations (%)
Most Common Occupations - Architecture and engineering occupations (%)
Most Common Occupations - Life, physical, and social science occupations (%)
Most Common Occupations - Education, legal, community service, arts, and media occupations (%)
Most Common Occupations - Community and social service occupations (%)
Most Common Occupations - Legal occupations (%)
Most Common Occupations - Education, training, and library occupations (%)
Most Common Occupations - Arts, design, entertainment, sports, and media occupations (%)
Most Common Occupations - Healthcare practitioners and technical occupations (%)
Most Common Occupations - Health diagnosing and treating practitioners and other technical occupations (%)
Most Common Occupations - Health technologists and technicians (%)
Most Common Occupations - Service occupations (%)
Most Common Occupations - Healthcare support occupations (%)
Most Common Occupations - Protective service occupations (%)
Most Common Occupations - Fire fighting and prevention, and other protective service workers including supervisors (%)
Most Common Occupations - Law enforcement workers including supervisors (%)
Most Common Occupations - Food preparation and serving related occupations (%)
Most Common Occupations - Building and grounds cleaning and maintenance occupations (%)
Most Common Occupations - Personal care and service occupations (%)
Most Common Occupations - Sales and office occupations (%)
Most Common Occupations - Sales and related occupations (%)
Most Common Occupations - Office and administrative support occupations (%)
Most Common Occupations - Natural resources, construction, and maintenance occupations (%)
Most Common Occupations - Farming, fishing, and forestry occupations (%)
Most Common Occupations - Construction and extraction occupations (%)
Most Common Occupations - Installation, maintenance, and repair occupations (%)
Most Common Occupations - Production, transportation, and material moving occupations (%)
Most Common Occupations - Production occupations (%)
Most Common Occupations - Transportation occupations (%)
Most Common Occupations - Material moving occupations (%)
People in Group quarters - Institutionalized population (%)
People in Group quarters - Correctional institutions (%)
People in Group quarters - Federal prisons and detention centers (%)
People in Group quarters - Halfway houses (%)
People in Group quarters - Local jails and other confinement facilities (including police lockups) (%)
People in Group quarters - Military disciplinary barracks (%)
People in Group quarters - State prisons (%)
People in Group quarters - Other types of correctional institutions (%)
People in Group quarters - Nursing homes (%)
People in Group quarters - Hospitals/wards, hospices, and schools for the handicapped (%)
People in Group quarters - Hospitals/wards and hospices for chronically ill (%)
People in Group quarters - Hospices or homes for chronically ill (%)
People in Group quarters - Military hospitals or wards for chronically ill (%)
People in Group quarters - Other hospitals or wards for chronically ill (%)
People in Group quarters - Hospitals or wards for drug/alcohol abuse (%)
People in Group quarters - Mental (Psychiatric) hospitals or wards (%)
People in Group quarters - Schools, hospitals, or wards for the mentally retarded (%)
People in Group quarters - Schools, hospitals, or wards for the physically handicapped (%)
People in Group quarters - Institutions for the deaf (%)
People in Group quarters - Institutions for the blind (%)
People in Group quarters - Orthopedic wards and institutions for the physically handicapped (%)
People in Group quarters - Wards in general hospitals for patients who have no usual home elsewhere (%)
People in Group quarters - Wards in military hospitals for patients who have no usual home elsewhere (%)
People in Group quarters - Juvenile institutions (%)
People in Group quarters - Long-term care (%)
People in Group quarters - Homes for abused, dependent, and neglected children (%)
People in Group quarters - Residential treatment centers for emotionally disturbed children (%)
People in Group quarters - Training schools for juvenile delinquents (%)
People in Group quarters - Short-term care, detention or diagnostic centers for delinquent children (%)
People in Group quarters - Type of juvenile institution unknown (%)
People in Group quarters - Noninstitutionalized population (%)
People in Group quarters - College dormitories (includes college quarters off campus) (%)
People in Group quarters - Military quarters (%)
People in Group quarters - On base (%)
People in Group quarters - Barracks, unaccompanied personnel housing (UPH), (Enlisted/Officer), ;and similar group living quarters for military personnel (%)
People in Group quarters - Transient quarters for temporary residents (%)
People in Group quarters - Military ships (%)
People in Group quarters - Group homes (%)
People in Group quarters - Homes or halfway houses for drug/alcohol abuse (%)
People in Group quarters - Homes for the mentally ill (%)
People in Group quarters - Homes for the mentally retarded (%)
People in Group quarters - Homes for the physically handicapped (%)
People in Group quarters - Other group homes (%)
People in Group quarters - Religious group quarters (%)
People in Group quarters - Dormitories (%)
People in Group quarters - Agriculture workers' dormitories on farms (%)
People in Group quarters - Job Corps and vocational training facilities (%)
People in Group quarters - Other workers' dormitories (%)
People in Group quarters - Crews of maritime vessels (%)
People in Group quarters - Other nonhousehold living situations (%)
People in Group quarters - Other noninstitutional group quarters (%)
Residents speaking English at home (%)
Residents speaking English at home - Born in the United States (%)
Residents speaking English at home - Native, born elsewhere (%)
Residents speaking English at home - Foreign born (%)
Residents speaking Spanish at home (%)
Residents speaking Spanish at home - Born in the United States (%)
Residents speaking Spanish at home - Native, born elsewhere (%)
Residents speaking Spanish at home - Foreign born (%)
Residents speaking other language at home (%)
Residents speaking other language at home - Born in the United States (%)
Residents speaking other language at home - Native, born elsewhere (%)
Residents speaking other language at home - Foreign born (%)
Class of Workers - Employee of private company (%)
Class of Workers - Self-employed in own incorporated business (%)
Class of Workers - Private not-for-profit wage and salary workers (%)
Class of Workers - Local government workers (%)
Class of Workers - State government workers (%)
Class of Workers - Federal government workers (%)
Class of Workers - Self-employed workers in own not incorporated business and Unpaid family workers (%)
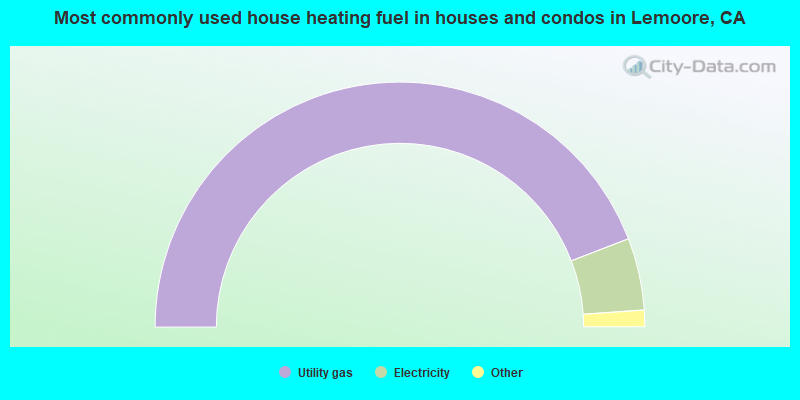
House heating fuel used in houses and condos - Utility gas (%)
House heating fuel used in houses and condos - Bottled, tank, or LP gas (%)
House heating fuel used in houses and condos - Electricity (%)
House heating fuel used in houses and condos - Fuel oil, kerosene, etc. (%)
House heating fuel used in houses and condos - Coal or coke (%)
House heating fuel used in houses and condos - Wood (%)
House heating fuel used in houses and condos - Solar energy (%)
House heating fuel used in houses and condos - Other fuel (%)
House heating fuel used in houses and condos - No fuel used (%)
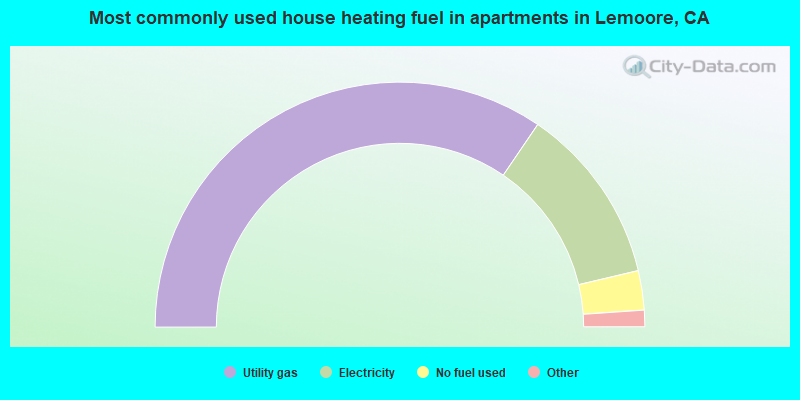
House heating fuel used in apartments - Utility gas (%)
House heating fuel used in apartments - Bottled, tank, or LP gas (%)
House heating fuel used in apartments - Electricity (%)
House heating fuel used in apartments - Fuel oil, kerosene, etc. (%)
House heating fuel used in apartments - Coal or coke (%)
House heating fuel used in apartments - Wood (%)
House heating fuel used in apartments - Solar energy (%)
House heating fuel used in apartments - Other fuel (%)
House heating fuel used in apartments - No fuel used (%)
Armed forces status - In Armed Forces (%)
Armed forces status - Civilian (%)
Armed forces status - Civilian - Veteran (%)
Armed forces status - Civilian - Nonveteran (%)
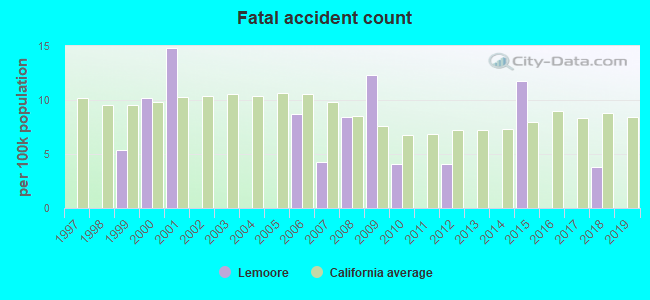
Fatal accidents locations in years 2005-2021
Fatal accidents locations in 2005
Fatal accidents locations in 2006
Fatal accidents locations in 2007
Fatal accidents locations in 2008
Fatal accidents locations in 2009
Fatal accidents locations in 2010
Fatal accidents locations in 2011
Fatal accidents locations in 2012
Fatal accidents locations in 2013
Fatal accidents locations in 2014
Fatal accidents locations in 2015
Fatal accidents locations in 2016
Fatal accidents locations in 2017
Fatal accidents locations in 2018
Fatal accidents locations in 2019
Fatal accidents locations in 2020
Fatal accidents locations in 2021
Alcohol use - People drinking some alcohol every month (%)
Alcohol use - People not drinking at all (%)
Alcohol use - Average days/month drinking alcohol
Alcohol use - Average drinks/week
Alcohol use - Average days/year people drink much
Audiometry - Average condition of hearing (%)
Audiometry - People that can hear a whisper from across a quiet room (%)
Audiometry - People that can hear normal voice from across a quiet room (%)
Audiometry - Ears ringing, roaring, buzzing (%)
Audiometry - Had a job exposure to loud noise (%)
Audiometry - Had off-work exposure to loud noise (%)
Blood Pressure & Cholesterol - Has high blood pressure (%)
Blood Pressure & Cholesterol - Checking blood pressure at home (%)
Blood Pressure & Cholesterol - Frequently checking blood cholesterol (%)
Blood Pressure & Cholesterol - Has high cholesterol level (%)
Consumer Behavior - Money monthly spent on food at supermarket/grocery store
Consumer Behavior - Money monthly spent on food at other stores
Consumer Behavior - Money monthly spent on eating out
Consumer Behavior - Money monthly spent on carryout/delivered foods
Consumer Behavior - Income spent on food at supermarket/grocery store (%)
Consumer Behavior - Income spent on food at other stores (%)
Consumer Behavior - Income spent on eating out (%)
Consumer Behavior - Income spent on carryout/delivered foods (%)
Current Health Status - General health condition (%)
Current Health Status - Blood donors (%)
Current Health Status - Has blood ever tested for HIV virus (%)
Current Health Status - Left-handed people (%)
Dermatology - People using sunscreen (%)
Diabetes - Diabetics (%)
Diabetes - Had a blood test for high blood sugar (%)
Diabetes - People taking insulin (%)
Diet Behavior & Nutrition - Diet health (%)
Diet Behavior & Nutrition - Milk product consumption (# of products/month)
Diet Behavior & Nutrition - Meals not home prepared (#/week)
Diet Behavior & Nutrition - Meals from fast food or pizza place (#/week)
Diet Behavior & Nutrition - Ready-to-eat foods (#/month)
Diet Behavior & Nutrition - Frozen meals/pizza (#/month)
Drug Use - People that ever used marijuana or hashish (%)
Drug Use - Ever used hard drugs (%)
Drug Use - Ever used any form of cocaine (%)
Drug Use - Ever used heroin (%)
Drug Use - Ever used methamphetamine (%)
Health Insurance - People covered by health insurance (%)
Kidney Conditions-Urology - Avg. # of times urinating at night
Medical Conditions - People with asthma (%)
Medical Conditions - People with anemia (%)
Medical Conditions - People with psoriasis (%)
Medical Conditions - People with overweight (%)
Medical Conditions - Elderly people having difficulties in thinking or remembering (%)
Medical Conditions - People who ever received blood transfusion (%)
Medical Conditions - People having trouble seeing even with glass/contacts (%)
Medical Conditions - People with arthritis (%)
Medical Conditions - People with gout (%)
Medical Conditions - People with congestive heart failure (%)
Medical Conditions - People with coronary heart disease (%)
Medical Conditions - People with angina pectoris (%)
Medical Conditions - People who ever had heart attack (%)
Medical Conditions - People who ever had stroke (%)
Medical Conditions - People with emphysema (%)
Medical Conditions - People with thyroid problem (%)
Medical Conditions - People with chronic bronchitis (%)
Medical Conditions - People with any liver condition (%)
Medical Conditions - People who ever had cancer or malignancy (%)
Mental Health - People who have little interest in doing things (%)
Mental Health - People feeling down, depressed, or hopeless (%)
Mental Health - People who have trouble sleeping or sleeping too much (%)
Mental Health - People feeling tired or having little energy (%)
Mental Health - People with poor appetite or overeating (%)
Mental Health - People feeling bad about themself (%)
Mental Health - People who have trouble concentrating on things (%)
Mental Health - People moving or speaking slowly or too fast (%)
Mental Health - People having thoughts they would be better off dead (%)
Oral Health - Average years since last visit a dentist
Oral Health - People embarrassed because of mouth (%)
Oral Health - People with gum disease (%)
Oral Health - General health of teeth and gums (%)
Oral Health - Average days a week using dental floss/device
Oral Health - Average days a week using mouthwash for dental problem
Oral Health - Average number of teeth
Pesticide Use - Households using pesticides to control insects (%)
Pesticide Use - Households using pesticides to kill weeds (%)
Physical Activity - People doing vigorous-intensity work activities (%)
Physical Activity - People doing moderate-intensity work activities (%)
Physical Activity - People walking or bicycling (%)
Physical Activity - People doing vigorous-intensity recreational activities (%)
Physical Activity - People doing moderate-intensity recreational activities (%)
Physical Activity - Average hours a day doing sedentary activities
Physical Activity - Average hours a day watching TV or videos
Physical Activity - Average hours a day using computer
Physical Functioning - People having limitations keeping them from working (%)
Physical Functioning - People limited in amount of work they can do (%)
Physical Functioning - People that need special equipment to walk (%)
Physical Functioning - People experiencing confusion/memory problems (%)
Physical Functioning - People requiring special healthcare equipment (%)
Prescription Medications - Average number of prescription medicines taking
Preventive Aspirin Use - Adults 40+ taking low-dose aspirin (%)
Reproductive Health - Vaginal deliveries (%)
Reproductive Health - Cesarean deliveries (%)
Reproductive Health - Deliveries resulted in a live birth (%)
Reproductive Health - Pregnancies resulted in a delivery (%)
Reproductive Health - Women breastfeeding newborns (%)
Reproductive Health - Women that had a hysterectomy (%)
Reproductive Health - Women that had both ovaries removed (%)
Reproductive Health - Women that have ever taken birth control pills (%)
Reproductive Health - Women taking birth control pills (%)
Reproductive Health - Women that have ever used Depo-Provera or injectables (%)
Reproductive Health - Women that have ever used female hormones (%)
Sexual Behavior - People 18+ that ever had sex (vaginal, anal, or oral) (%)
Sexual Behavior - Males 18+ that ever had vaginal sex with a woman (%)
Sexual Behavior - Males 18+ that ever performed oral sex on a woman (%)
Sexual Behavior - Males 18+ that ever had anal sex with a woman (%)
Sexual Behavior - Males 18+ that ever had any sex with a man (%)
Sexual Behavior - Females 18+ that ever had vaginal sex with a man (%)
Sexual Behavior - Females 18+ that ever performed oral sex on a man (%)
Sexual Behavior - Females 18+ that ever had anal sex with a man (%)
Sexual Behavior - Females 18+ that ever had any kind of sex with a woman (%)
Sexual Behavior - Average age people first had sex
Sexual Behavior - Average number of female sex partners in lifetime (males 18+)
Sexual Behavior - Average number of female vaginal sex partners in lifetime (males 18+)
Sexual Behavior - Average age people first performed oral sex on a woman (18+)
Sexual Behavior - Average number of woman performed oral sex on in lifetime (18+)
Sexual Behavior - Average number of male sex partners in lifetime (males 18+)
Sexual Behavior - Average number of male anal sex partners in lifetime (males 18+)
Sexual Behavior - Average age people first performed oral sex on a man (18+)
Sexual Behavior - Average number of male oral sex partners in lifetime (18+)
Sexual Behavior - People using protection when performing oral sex (%)
Sexual Behavior - Average number of times people have vaginal or anal sex a year
Sexual Behavior - People having sex without condom (%)
Sexual Behavior - Average number of male sex partners in lifetime (females 18+)
Sexual Behavior - Average number of male vaginal sex partners in lifetime (females 18+)
Sexual Behavior - Average number of female sex partners in lifetime (females 18+)
Sexual Behavior - Circumcised males 18+ (%)
Sleep Disorders - Average hours sleeping at night
Sleep Disorders - People that has trouble sleeping (%)
Smoking-Cigarette Use - People smoking cigarettes (%)
Taste & Smell - People 40+ having problems with smell (%)
Taste & Smell - People 40+ having problems with taste (%)
Taste & Smell - People 40+ that ever had wisdom teeth removed (%)
Taste & Smell - People 40+ that ever had tonsils teeth removed (%)
Taste & Smell - People 40+ that ever had a loss of consciousness because of a head injury (%)
Taste & Smell - People 40+ that ever had a broken nose or other serious injury to face or skull (%)
Taste & Smell - People 40+ that ever had two or more sinus infections (%)
Weight - Average height (inches)
Weight - Average weight (pounds)
Weight - Average BMI
Weight - People that are obese (%)
Weight - People that ever were obese (%)
Weight - People trying to lose weight (%)
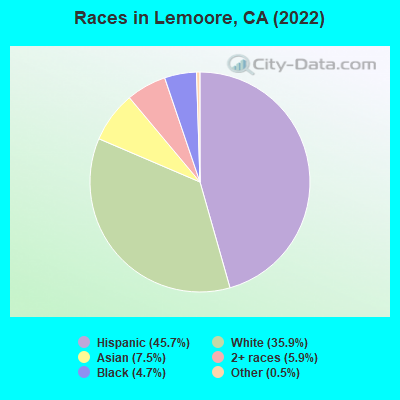
12,347 45.7% Hispanic 9,715 35.9% White alone 2,023 7.5% Asian alone 1,590 5.9% Two or more races 1,260 4.7% Black alone 131 0.5% Other race alone 10 0.04% American Indian alone
Officers per 1,000 residents here:
1.24California average:
2.30
Latest news from Lemoore, CA collected exclusively by city-data.com from local newspapers, TV, and radio stations
Ancestries: Portuguese (4.3%), European (4.2%), English (3.3%), Irish (2.6%), German (2.1%), American (1.4%).
Current Local Time:
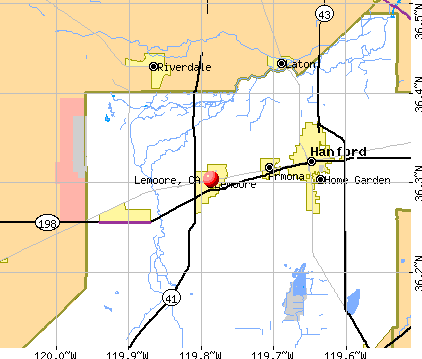
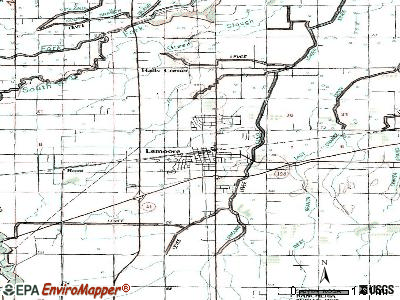
Land area: 8.45 square miles.
Population density: 3,216 people per square mile (average).
3,863 residents are foreign born (7.5% Latin America , 5.5% Asia ).
This city:
14.3%California:
26.5%
Median real estate property taxes paid for housing units with mortgages in 2022: $2,434 (0.7%)Median real estate property taxes paid for housing units with no mortgage in 2022: $1,689 (0.6%)
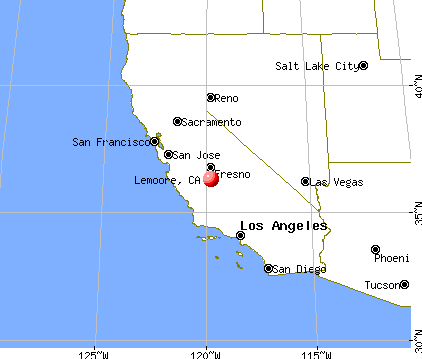
Nearest city with pop. 50,000+: Visalia, CA
Nearest city with pop. 200,000+: Fresno, CA
Nearest city with pop. 1,000,000+: Los Angeles, CA
Nearest cities:
Hardwick, CA (2.8 miles),
Latitude: 36.30 N, Longitude: 119.79 W
Daytime population change due to commuting: -5,309 (-19.6%)Workers who live and work in this city: 2,725 (22.6%)
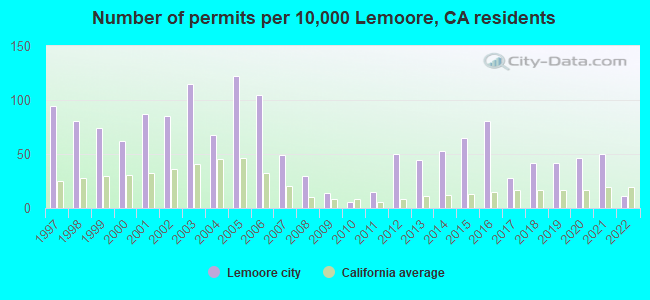
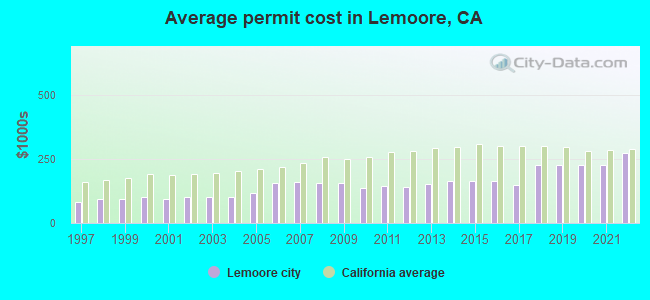
Single-family new house construction building permits:
2022: 22 buildings , average cost: $273,7002021: 99 buildings , average cost: $228,0002020: 90 buildings , average cost: $228,0002019: 82 buildings , average cost: $228,0002018: 82 buildings , average cost: $228,0002017: 55 buildings , average cost: $147,9002016: 159 buildings , average cost: $163,0002015: 128 buildings , average cost: $163,0002014: 105 buildings , average cost: $163,0002013: 87 buildings , average cost: $154,1002012: 99 buildings , average cost: $139,7002011: 29 buildings , average cost: $145,1002010: 11 buildings , average cost: $136,8002009: 28 buildings , average cost: $158,0002008: 60 buildings , average cost: $154,8002007: 96 buildings , average cost: $162,0002006: 206 buildings , average cost: $155,5002005: 241 buildings , average cost: $119,0002004: 134 buildings , average cost: $100,0002003: 227 buildings , average cost: $100,8002002: 167 buildings , average cost: $101,0002001: 171 buildings , average cost: $94,8002000: 122 buildings , average cost: $100,6001999: 146 buildings , average cost: $94,2001998: 160 buildings , average cost: $93,7001997: 185 buildings , average cost: $82,900Unemployment in December 2023:
Population change in the 1990s: +5,223 (+36.0%).
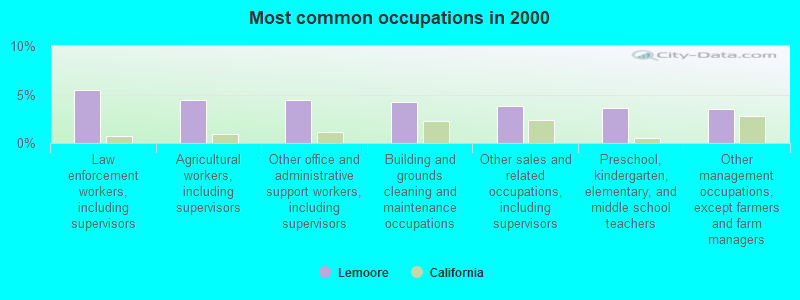
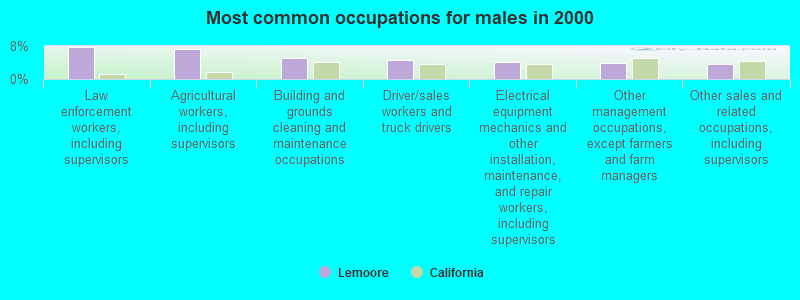
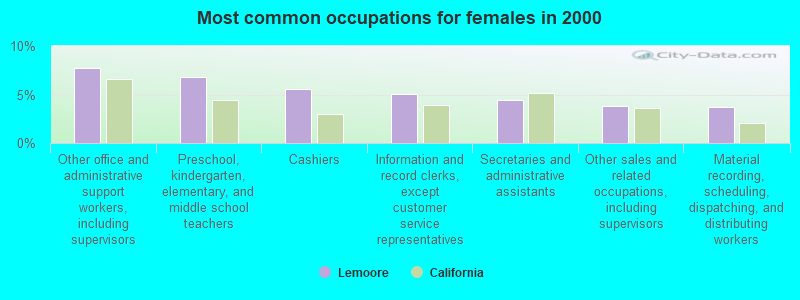
Most common occupations in Lemoore, CA (%)
Both Males Females
Law enforcement workers, including supervisors (5.4%)
Agricultural workers, including supervisors (4.4%)
Other office and administrative support workers, including supervisors (4.4%)
Building and grounds cleaning and maintenance occupations (4.2%)
Other sales and related occupations, including supervisors (3.8%)
Preschool, kindergarten, elementary, and middle school teachers (3.6%)
Other management occupations, except farmers and farm managers (3.5%)
Law enforcement workers, including supervisors (7.7%)
Agricultural workers, including supervisors (7.4%)
Building and grounds cleaning and maintenance occupations (5.1%)
Driver/sales workers and truck drivers (4.6%)
Electrical equipment mechanics and other installation, maintenance, and repair workers, including supervisors (4.0%)
Other management occupations, except farmers and farm managers (3.8%)
Other sales and related occupations, including supervisors (3.7%)
Other office and administrative support workers, including supervisors (7.7%)
Preschool, kindergarten, elementary, and middle school teachers (6.8%)
Cashiers (5.6%)
Information and record clerks, except customer service representatives (5.1%)
Secretaries and administrative assistants (4.4%)
Other sales and related occupations, including supervisors (3.8%)
Material recording, scheduling, dispatching, and distributing workers (3.7%)
Earthquake activity:
Lemoore-area historical earthquake activity is significantly above California state average. It is 8393% greater than the overall U.S. average. On 7/21/1952 at 11:52:14, a magnitude 7.7 (7.7 UK, Class: Major, Intensity: VIII - XII) earthquake occurred 100.4 miles away from Lemoore center, causing $50,000,000 total damage On 4/18/1906 at 13:12:21, a magnitude 7.9 (7.9 UK) earthquake occurred 212.5 miles away from Lemoore center, causing $524,000,000 total damage On 11/4/1927 at 13:51:53, a magnitude 7.5 (7.5 UK) earthquake occurred 118.9 miles away from the city center On 6/28/1992 at 11:57:34, a magnitude 7.6 (6.2 MB, 7.6 MS, 7.3 MW, Depth: 0.7 mi) earthquake occurred 235.1 miles away from Lemoore center, causing 3 deaths ( 1 shaking deaths, 2 other deaths) and 400 injuries, causing $100,000,000 total damage and $40,000,000 insured lossesOn 10/18/1989 at 00:04:15, a magnitude 7.1 (6.5 MB, 7.1 MS, 6.9 MW, 7.0 ML) earthquake occurred 123.3 miles away from Lemoore center, causing 62 deaths ( 62 shaking deaths) and 3757 injuries, causing $1,305,032,704 total damage On 5/2/1983 at 23:42:37, a magnitude 6.7 (6.2 MB, 6.5 MS, 6.5 MW, 6.7 ML, Class: Strong, Intensity: VII - IX) earthquake occurred 29.5 miles away from the city center, causing $31,000,000 total damage Magnitude types: body-wave magnitude (MB), local magnitude (ML), surface-wave magnitude (MS), moment magnitude (MW) Natural disasters: The number of natural disasters in Kings County (14) is near the US average (15).Major Disasters (Presidential) Declared: 10Emergencies Declared: 2Floods: 9, Storms: 4, Winter Storms: 4, Landslides: 2, Mudslides: 2, Drought: 1, Earthquake: 1, Freeze: 1, Hurricane: 1, Tornado: 1, Other: 1 (Note: some incidents may be assigned to more than one category). Hospitals and medical centers in Lemoore: LEMOORE DIALYSIS (1345 W. BUSH STREET)
Other hospitals and medical centers near Lemoore: ADVENTIST MEDICAL CENTER (about 7 miles away; HANFORD, CA)
ADVENTIST HEALTH HOME CARE AND HOSPICE SERVICES (Home Health Center, about 7 miles away; HANFORD, CA)
HANFORD NURSING AND REHABILITATION CENTER (Nursing Home, about 8 miles away; HANFORD, CA)
KINGS CONVALESCENT CENTER (Nursing Home, about 8 miles away; HANFORD, CA)
KINGS NURSING AND REHABILITATION CENTER (Nursing Home, about 8 miles away; HANFORD, CA)
HANFORD AT HOME DIALYSIS (Dialysis Facility, about 9 miles away; HANFORD, CA)
CENTRAL VALLEY GENERAL HOSPITAL (about 9 miles away; HANFORD, CA)
Amtrak station: LEMOORE (19TH AVE. & STATE HWY. 198) - Bus Station
.
Services: fully wheelchair accessible, public payphones, free short-term parking, public transit connection.
College/University in Lemoore: West Hills College-Lemoore Full-time enrollment: 2,314; Location: 555 College Avenue; Public; Website: www.westhillscollege.com)
Other colleges/universities with over 2000 students near Lemoore:
San Joaquin Valley College-Visalia (about 23 miles; Visalia, CA ; Full-time enrollment: 2,386)
College of the Sequoias (about 27 miles; Visalia, CA ; FT enrollment: 6,982)
Reedley College (about 28 miles; Reedley, CA ; FT enrollment: 8,144)
Fresno Pacific University (about 30 miles; Fresno, CA ; FT enrollment: 3,083)
Fresno City College (about 33 miles; Fresno, CA ; FT enrollment: 12,994)
California State University-Fresno (about 36 miles; Fresno, CA ; FT enrollment: 18,993)
Heald College-Fresno (about 36 miles; Fresno, CA ; FT enrollment: 2,199)
Public high schools in Lemoore:
Private high school in Lemoore: KINGS CHRISTIAN SCHOOL Students: 263, Location: 900 E D ST, Grades: PK-12)
Public elementary/middle schools in Lemoore: LIBERTY MIDDLE Students: 587, Location: 1000 LIBERTY DR., Grades: 7-8)P. W. ENGVALL ELEMENTARY Students: 452, Location: 19TH AND CEDAR, Grades: KG-6)LEMOORE ELEMENTARY Students: 423, Location: 573 BUSH ST., Grades: KG-6)CINNAMON ELEMENTARY Students: 385, Location: 500 E. CINNAMON DR., Grades: KG-6)MEADOW LANE ELEMENTARY Students: 374, Location: MEADOW LN. AND QUANDT, Grades: KG-6)CENTRAL ELEMENTARY Students: 277, Location: 15783 18TH AVE., Grades: KG-8)LEMOORE UNIVERSITY ELEMENTARY CHARTER Students: 210, Location: 450 MARSH DR., Grades: 5-8, Charter school )ISLAND ELEMENTARY Students: 195, Location: 7799 21ST AVE., Grades: KG-8, Charter school )BRIDGES ACADEMY Location: 1200 W. CINNAMON DR., Grades: 6-8)
Private elementary/middle school in Lemoore: MARY IMMACULATE QUEEN SCHOOL Students: 220, Location: 884 N LEMOORE AVE, Grades: PK-8)
See full list of schools located in Lemoore
Notable locations in Lemoore: (A) , Lemoore Golf Course (B) , Veterans Memorial Building (C) , Lemoore Civic Auditorium (D) , Lemoore City Hall (E) , Lemoore Branch Kings County Library (F) , American Ambulance (G) , Lemoore Volunteer Fire Department North Side Station (H) , Lemoore Volunteer Fire Department (I) . Display/hide their locations on the map
Shopping Centers: (1) , Lemoore Plaza Shopping Center (2) . Display/hide their locations on the map
Churches in Lemoore include: (A) , Lemoore Baptist Church (B) , Pentecostal Church of God (C) , Saint Peters Roman Catholic Church (D) , Seventh Day Adventist Church (E) . Display/hide their locations on the map
Cemetery: (1) . Display/hide its location on the map
Parks in Lemoore include: (1) , Westfield Park (2) . Display/hide their locations on the map
Hotel:
Birthplace of: Mick Wingert - Comedian, Eric Fox - Baseball player, Larry Jones (wide receiver) - Football player, Roswell G. Ham - Educator.
Kings County has a predicted average indoor radon screening level less than 2 pCi/L (pico curies per liter) - Low Potential Drinking water stations with addresses in Lemoore and their reported violations in the past:
LOWER DEER CREEK TRACT (Population served: 40, Groundwater):
Past monitoring violations:
2 routine major monitoring violations
One regular monitoring violation
Drinking water stations with addresses in Lemoore that have no violations reported:
AZCAL MANAGEMENT CO (Population served: 75, Primary Water Source Type: Surface water)
KINGS REST MOTEL (Population served: 30, Primary Water Source Type: Groundwater)
Average household size: This city:
3.0 peopleCalifornia:
2.9 people
Percentage of family households: This city:
74.1%Whole state:
68.7%
Percentage of households with unmarried partners: This city:
8.4%Whole state:
7.2%
Likely homosexual households (counted as self-reported same-sex unmarried-partner households)
Lesbian couples: 0.3% of all households Gay men: 0.2% of all households
11 people in other noninstitutional facilities in 2010people in group homes for juveniles (non-correctional) in 2010people in religious group quarters in 2000
Banks with branches in Lemoore (2011 data):
Wells Fargo Bank, National Association: Lemoore Branch at 301 W D Street, branch established on 1935/04/01. Info updated 2011/04/05: Bank assets: $1,161,490.0 mil, Deposits: $905,653.0 mil, headquarters in Sioux Falls, SD, positive income , 6395 total offices , Holding Company: Wells Fargo & Company
Union Bank, National Association: Lemoore Branch at 105 West Hanford-Armona Road, branch established on 1996/05/30. Info updated 2011/09/01: Bank assets: $88,967.5 mil, Deposits: $65,286.4 mil, headquarters in San Francisco, CA, positive income , Commercial Lending Specialization, 403 total offices , Holding Company: Mitsubishi Ufj Financial Group, Inc.
Bank of America, National Association: Lemoore Branch at 338 West D Street, branch established on 1957/06/17. Info updated 2009/11/18: Bank assets: $1,451,969.3 mil, Deposits: $1,077,176.8 mil, headquarters in Charlotte, NC, positive income , 5782 total offices , Holding Company: Bank Of America Corporation
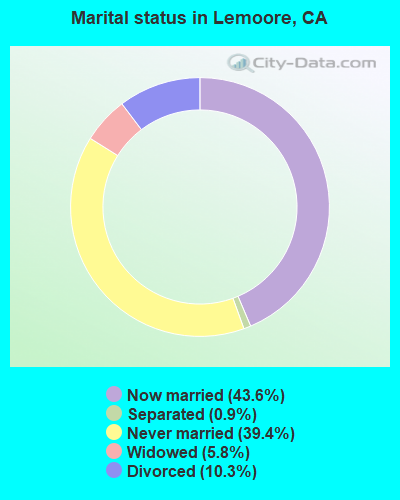
For population 15 years and over in Lemoore:
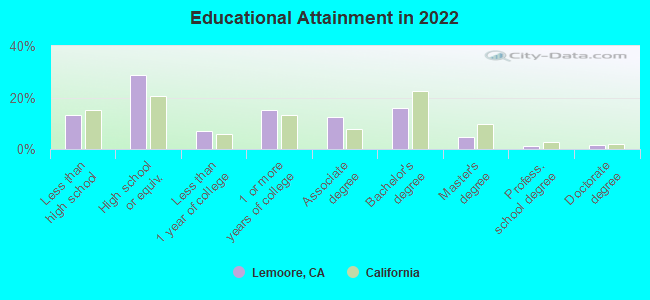
Never married: 39.4%Now married: 43.6%Separated: 0.9%Widowed: 5.8%Divorced: 10.3% For population 25 years and over in Lemoore:
High school or higher: 84.5%Bachelor's degree or higher: 21.4%Graduate or professional degree: 7.6%Unemployed: 11.4%Mean travel time to work (commute): 19.4 minutes
Education Gini index (Inequality in education) Here:
13.8California average:
15.5
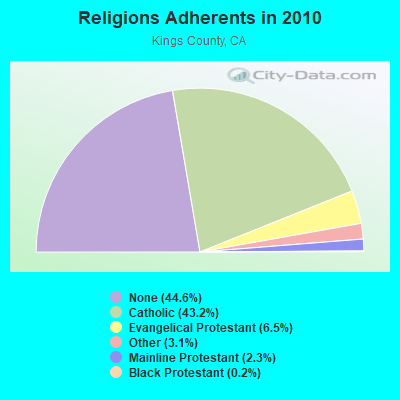
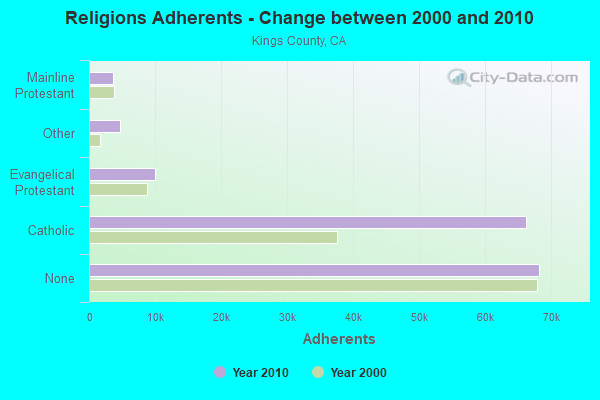
Religion statistics for Lemoore, CA (based on Kings County data)
Religion Adherents Congregations Catholic 66,133 8 Evangelical Protestant 10,014 78 Other 4,742 11 Mainline Protestant 3,586 13 Black Protestant 320 2 None 68,187 -
Source: Clifford Grammich, Kirk Hadaway, Richard Houseal, Dale E.Jones, Alexei Krindatch, Richie Stanley and Richard H.Taylor. 2012. 2010 U.S.Religion Census: Religious Congregations & Membership Study. Association of Statisticians of American Religious Bodies. Jones, Dale E., et al. 2002. Congregations and Membership in the United States 2000. Nashville, TN: Glenmary Research Center. Graphs represent county-level data
Food Environment Statistics: Number of grocery stores : 30Kings County :
2.02 / 10,000 pop.California :
2.14 / 10,000 pop.
Number of convenience stores (no gas) : 9This county :
0.61 / 10,000 pop.State :
0.62 / 10,000 pop.
Number of convenience stores (with gas) : 23Kings County :
1.55 / 10,000 pop.State :
1.49 / 10,000 pop.
Number of full-service restaurants : 48Kings County :
3.24 / 10,000 pop.State :
7.42 / 10,000 pop.
Adult obesity rate : Here :
26.2%California :
21.3%
Low-income preschool obesity rate : Here :
21.4%California :
17.9%
Health and Nutrition: Healthy diet rate : Lemoore:
48.2%California:
49.4%
Average overall health of teeth and gums : Lemoore:
46.7%California:
48.0%
Average BMI : This city:
28.4California:
28.1
People feeling badly about themselves : Lemoore:
20.8%California:
20.2%
People not drinking alcohol at all : Lemoore:
11.5%California:
11.2%
Average hours sleeping at night : Overweight people : This city:
31.7%State:
31.5%
General health condition : This city:
56.1%California:
56.4%
Average condition of hearing : More about Health and Nutrition of Lemoore, CA Residents
Local government employment and payroll (March 2022)
Function
Full-time employees
Monthly full-time payroll
Average yearly full-time wage
Part-time employees
Monthly part-time payroll
Police Protection - Officers
43 $301,092 $84,026 15 $37,273 Water Supply
12 $47,770 $47,770 0 $0 Parks and Recreation
11 $53,070 $57,895 7 $1,389 Sewerage
11 $47,180 $51,469 0 $0 Solid Waste Management
11 $44,304 $48,332 0 $0 Financial Administration
8 $38,425 $57,638 0 $0 Other Government Administration
5 $41,722 $100,133 5 $4,522 Streets and Highways
3 $7,610 $30,440 0 $0 Housing and Community Development (Local)
2 $15,046 $90,276 0 $0 Other and Unallocable
2 $9,612 $57,672 0 $0
Totals for Government
108 $605,831 $67,315 27 $43,184
Lemoore government finances - Expenditure in 2017 (per resident):
Construction - Regular Highways: $2,419,000 ($88.98)
Housing and Community Development: $1,654,000 ($60.84)Water Utilities: $1,494,000 ($54.96)Central Staff Services: $478,000 ($17.58)Parks and Recreation: $175,000 ($6.44)Police Protection: $122,000 ($4.49)Current Operations - Police Protection: $5,095,000 ($187.42)
Water Utilities: $2,880,000 ($105.94)Solid Waste Management: $2,649,000 ($97.44)Parks and Recreation: $2,599,000 ($95.60)Central Staff Services: $2,036,000 ($74.89)Sewerage: $1,677,000 ($61.69)Financial Administration: $906,000 ($33.33)Protective Inspection and Regulation - Other: $795,000 ($29.24)Regular Highways: $691,000 ($25.42)Local Fire Protection: $440,000 ($16.19)Housing and Community Development: $121,000 ($4.45)General - Interest on Debt: $30,000 ($1.10)
Other Capital Outlay - Parks and Recreation: $267,000 ($9.82)
Housing and Community Development: $229,000 ($8.42)Sewerage: $92,000 ($3.38)Water Utilities - Interest on Debt: $150,000 ($5.52)
Lemoore government finances - Revenue in 2017 (per resident):
Charges - Sewerage: $3,421,000 ($125.84)
Solid Waste Management: $3,004,000 ($110.50)Parks and Recreation: $1,438,000 ($52.90)Regular Highways: $767,000 ($28.21)Other: $361,000 ($13.28)Federal Intergovernmental - Housing and Community Development: $214,000 ($7.87)
Other: $15,000 ($0.55)Local Intergovernmental - Highways: $453,000 ($16.66)
Miscellaneous - General Revenue - Other: $940,000 ($34.58)
Interest Earnings: $389,000 ($14.31)Special Assessments: $266,000 ($9.78)Rents: $100,000 ($3.68)Fines and Forfeits: $43,000 ($1.58)Sale of Property: $6,000 ($0.22)Donations From Private Sources: $5,000 ($0.18)Revenue - Water Utilities: $4,248,000 ($156.26)
State Intergovernmental - Other: $766,000 ($28.18)
Highways: $476,000 ($17.51)Sewerage: $140,000 ($5.15)General Local Government Support: $7,000 ($0.26)Tax - Property: $4,351,000 ($160.05)
General Sales and Gross Receipts: $1,753,000 ($64.48)Public Utilities Sales: $626,000 ($23.03)Other License: $261,000 ($9.60)Other Selective Sales: $229,000 ($8.42)Occupation and Business License - Other: $136,000 ($5.00)Documentary and Stock Transfer: $64,000 ($2.35)
Lemoore government finances - Debt in 2017 (per resident):
Long Term Debt - Beginning Outstanding - Unspecified Public Purpose: $6,348,000 ($233.51)
Outstanding Unspecified Public Purpose: $5,831,000 ($214.49)Retired Unspecified Public Purpose: $517,000 ($19.02)
Lemoore government finances - Cash and Securities in 2017 (per resident):
Bond Funds - Cash and Securities: $5,971,000 ($219.64)
Other Funds - Cash and Securities: $39,935,000 ($1469.01)
7.18% of this county's 2021 resident taxpayers lived in other counties in 2020 ($37,717 average adjusted gross income )
Here:
7.18%California average:
5.19%
0.18% of residents moved from foreign countries ($1,419 average AGI )Kings County:
0.18%California average:
0.03%
Top counties from which taxpayers relocated into this county between 2020 and 2021:
7.32% of this county's 2020 resident taxpayers moved to other counties in 2021 ($55,523 average adjusted gross income )
Here:
7.32%California average:
6.14%
0.15% of residents moved to foreign countries ($1,240 average AGI )Kings County:
0.15%California average:
0.02%
Top counties to which taxpayers relocated from this county between 2020 and 2021:
Businesses in Lemoore, CA
Name Count Name Count
7-Eleven 1 Kmart 1 AT&T 1 Little Caesars Pizza 2 AutoZone 1 McDonald's 2 Best Western 1 Motel 6 1 Blockbuster 1 Penske 1 Burger King 1 Quiznos 1 Cricket Wireless 1 RadioShack 1 Days Inn 1 Rite Aid 1 Domino's Pizza 1 Sears 1 FedEx 2 Starbucks 1 GNC 1 T-Mobile 2 H&R Block 3 Taco Bell 1 Jack In The Box 1 True Value 1 Jones New York 1 U-Haul 3 KFC 1 UPS 1
Strongest AM radio stations in Lemoore:
KJOP (1240 AM; 1 kW; LEMOORE, CA; Owner: IHR EDUCATIONAL BROADCASTING)
KMJ (580 AM; 50 kW; FRESNO, CA; Owner: INFINITY RADIO OPERATIONS INC.)
KWRU (940 AM; 50 kW; FRESNO, CA)
KERI (1180 AM; 50 kW; WASCO-GREENACRES, CA; Owner: KWSO, INC.)
KIGS (620 AM; 1 kW; HANFORD, CA; Owner: PERREIRA BROADCASTING)
KOOR (790 AM; 10 kW; CLOVIS, CA; Owner: INFINITY RADIO OPERATIONS INC.)
KIRV (1510 AM; daytime; 10 kW; FRESNO, CA; Owner: GORE-OVERGAARD BROADCASTING, INC)
KGDP (660 AM; 50 kW; ORCUTT, CA; Owner: RADIO REPRESENTATIVES, INC.)
KXEX (1550 AM; 10 kW; FRESNO, CA; Owner: RAK COMMUNICATIONS, INC.)
KAVT (1680 AM; 10 kW; FRESNO, CA; Owner: RAK COMMUNICATIONS, INC.)
KRDU (1130 AM; 6 kW; DINUBA, CA; Owner: CAPSTAR TX LIMITED PARTNERSHIP)
KCBC (770 AM; 50 kW; RIVERBANK, CA; Owner: KIERTRON, INC.)
KJUG (1270 AM; 5 kW; TULARE, CA; Owner: WESTCOAST BROADCASTING, INC.)
Strongest FM radio stations in Lemoore:
KGAR-LP (93.3 FM; LEMOORE, CA; Owner: LEMOORE UNION HIGH SCHOOL DISTRICT)
K217EQ (91.3 FM; COALINGA, CA; Owner: CALVARY CHAPEL OF TWIN FALLS, INC.)
K203AQ (88.5 FM; HELM, ETC., CA; Owner: FAMILY STATIONS, INC.)
KZPO (103.3 FM; LINDSAY, CA; Owner: LINDSAY BROADCASTING)
KMAK (100.3 FM; ORANGE COVE, CA; Owner: RICHARD B. SMITH)
KQKL (88.5 FM; SELMA, CA; Owner: EDUCATIONAL MEDIA FOUNDATION)
K203CM (88.5 FM; SANGER, CA; Owner: EDUCATIONAL MEDIA FOUNDATION)
KDKL (88.3 FM; COALINGA, CA; Owner: EDUCATIONAL MEDIA FOUNDATION)
KFYE (106.3 FM; KINGSBURG, CA; Owner: EDUCATIONAL MEDIA FOUNDATION)
KDUV (88.9 FM; VISALIA, CA; Owner: COMMUNITY EDUCATIONAL B/CASTNG, INC.)
KGEN-FM (94.5 FM; HANFORD, CA; Owner: AZTECA BROADCASTING CORPORATION)
KMGV (97.9 FM; FRESNO, CA; Owner: INFINITY RADIO OPERATIONS INC.)
KJUG-FM (106.7 FM; TULARE, CA; Owner: WESTCOAST BROADCASTING, INC.)
K220EY (91.9 FM; PORTERVILLE, CA; Owner: FAMILY STATIONS, INC.)
KUFW (90.5 FM; WOODLAKE, CA; Owner: NATIONAL FARM WORKERS SERVICE CENTER)
KWYE (101.1 FM; FRESNO, CA; Owner: INFINITY RADIO OPERATIONS INC.)
KMQA (100.5 FM; EAST PORTERVILLE, CA; Owner: MOON BROADCASTING PORTERVILLE L.L.C.)
KRZR (103.7 FM; HANFORD, CA; Owner: CAPSTAR TX LIMITED PARTNERSHIP)
KFNO (90.3 FM; FRESNO, CA; Owner: FAMILY STATIONS, INC.)
KLBN (105.1 FM; AUBERRY, CA; Owner: LOTUS COMMUNICATIONS CORP.)
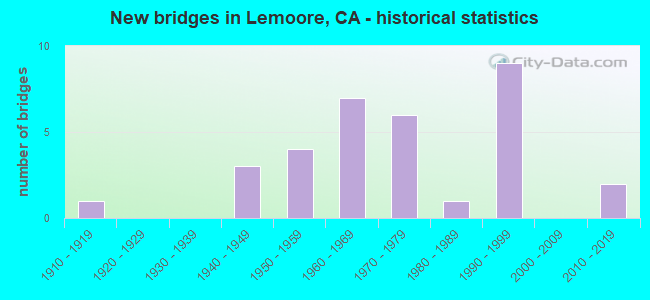
National Bridge Inventory (NBI) Statistics 33 Number of bridges404ft / 123m Total length $3,744,000 Total costs269,262 Total average daily traffic21,919 Total average daily truck traffic
New bridges - historical statistics
1 1910-1919 3 1940-1949 4 1950-1959 7 1960-1969 6 1970-1979 1 1980-1989 9 1990-1999 2 2010-2019
See full National Bridge Inventory statistics for Lemoore, CA
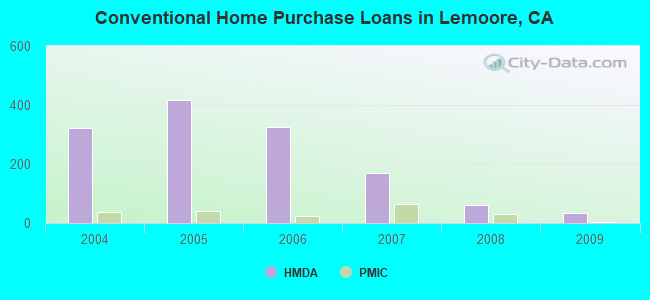
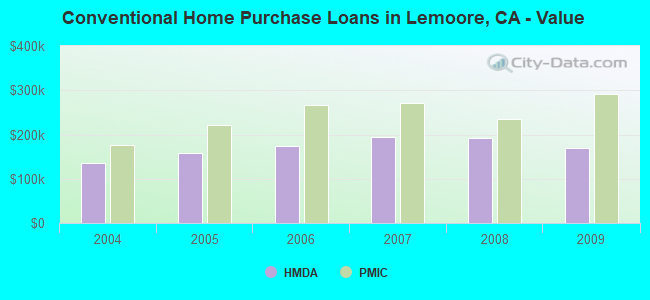
Home Mortgage Disclosure Act Aggregated Statistics For Year 2009(Based on 1 full and 3 partial tracts) A) FHA, FSA/RHS & VA B) Conventional C) Refinancings D) Home Improvement Loans E) Loans on Dwellings For 5+ Families F) Non-occupant Loans on G) Loans On Manufactured Number Average Value Number Average Value Number Average Value Number Average Value Number Average Value Number Average Value Number Average Value
LOANS ORIGINATED 164 $196,403 33 $168,409 198 $194,537 13 $37,316 1 $1,500,000 24 $124,462 3 $112,663 APPLICATIONS APPROVED, NOT ACCEPTED 7 $158,133 3 $189,640 23 $202,038 0 $0 0 $0 1 $136,190 0 $0 APPLICATIONS DENIED 18 $194,156 5 $129,030 107 $183,302 8 $57,950 0 $0 13 $148,177 0 $0 APPLICATIONS WITHDRAWN 15 $163,797 9 $183,244 86 $200,974 3 $129,000 0 $0 11 $156,131 0 $0 FILES CLOSED FOR INCOMPLETENESS 6 $177,093 2 $188,500 15 $174,074 1 $40,000 0 $0 1 $131,830 0 $0
Aggregated Statistics For Year 2008(Based on 1 full and 3 partial tracts) A) FHA, FSA/RHS & VA B) Conventional C) Refinancings D) Home Improvement Loans E) Loans on Dwellings For 5+ Families F) Non-occupant Loans on G) Loans On Manufactured Number Average Value Number Average Value Number Average Value Number Average Value Number Average Value Number Average Value Number Average Value
LOANS ORIGINATED 122 $235,164 62 $193,111 134 $174,724 20 $84,974 2 $427,000 31 $167,341 1 $268,460 APPLICATIONS APPROVED, NOT ACCEPTED 2 $168,990 9 $230,846 34 $192,874 4 $48,480 0 $0 6 $172,843 0 $0 APPLICATIONS DENIED 16 $209,979 11 $181,675 192 $205,873 23 $72,707 0 $0 14 $194,383 2 $79,420 APPLICATIONS WITHDRAWN 8 $225,906 10 $152,327 62 $191,790 6 $128,485 0 $0 8 $173,234 0 $0 FILES CLOSED FOR INCOMPLETENESS 3 $258,343 4 $90,500 15 $201,625 4 $96,192 0 $0 2 $85,000 0 $0
Aggregated Statistics For Year 2007(Based on 1 full and 3 partial tracts) A) FHA, FSA/RHS & VA B) Conventional C) Refinancings D) Home Improvement Loans E) Loans on Dwellings For 5+ Families F) Non-occupant Loans on G) Loans On Manufactured Number Average Value Number Average Value Number Average Value Number Average Value Number Average Value Number Average Value Number Average Value
LOANS ORIGINATED 40 $261,118 171 $194,651 325 $167,357 79 $93,459 4 $909,590 69 $160,180 3 $84,270 APPLICATIONS APPROVED, NOT ACCEPTED 2 $189,315 36 $200,009 83 $177,468 23 $58,084 0 $0 20 $177,814 0 $0 APPLICATIONS DENIED 6 $290,863 41 $235,447 308 $206,968 62 $66,402 0 $0 33 $155,665 1 $80,000 APPLICATIONS WITHDRAWN 4 $233,970 24 $204,684 151 $195,836 19 $114,332 0 $0 19 $181,094 0 $0 FILES CLOSED FOR INCOMPLETENESS 0 $0 7 $135,636 44 $233,062 3 $76,080 0 $0 4 $245,790 0 $0
Aggregated Statistics For Year 2006(Based on 1 full and 3 partial tracts) A) FHA, FSA/RHS & VA B) Conventional C) Refinancings D) Home Improvement Loans F) Non-occupant Loans on G) Loans On Manufactured Number Average Value Number Average Value Number Average Value Number Average Value Number Average Value Number Average Value
LOANS ORIGINATED 31 $261,130 325 $173,290 534 $179,818 104 $96,628 100 $170,046 1 $55,760 APPLICATIONS APPROVED, NOT ACCEPTED 2 $174,595 51 $161,626 111 $184,482 25 $86,936 22 $172,416 0 $0 APPLICATIONS DENIED 0 $0 113 $165,588 365 $201,640 74 $104,884 41 $215,893 3 $149,433 APPLICATIONS WITHDRAWN 7 $268,966 92 $168,088 311 $199,580 26 $135,535 23 $172,712 2 $117,445 FILES CLOSED FOR INCOMPLETENESS 0 $0 15 $195,623 71 $202,362 4 $130,305 12 $213,768 0 $0
Aggregated Statistics For Year 2005(Based on 1 full and 3 partial tracts) A) FHA, FSA/RHS & VA B) Conventional C) Refinancings D) Home Improvement Loans E) Loans on Dwellings For 5+ Families F) Non-occupant Loans on G) Loans On Manufactured Number Average Value Number Average Value Number Average Value Number Average Value Number Average Value Number Average Value Number Average Value
LOANS ORIGINATED 23 $217,513 417 $158,145 736 $167,909 113 $85,330 4 $573,740 137 $157,148 4 $71,008 APPLICATIONS APPROVED, NOT ACCEPTED 0 $0 37 $152,841 107 $153,257 21 $89,795 0 $0 20 $143,647 3 $144,000 APPLICATIONS DENIED 0 $0 66 $152,835 328 $163,547 83 $68,787 0 $0 37 $167,896 3 $57,713 APPLICATIONS WITHDRAWN 6 $212,623 56 $160,747 400 $172,371 49 $100,102 0 $0 38 $158,707 2 $109,255 FILES CLOSED FOR INCOMPLETENESS 0 $0 10 $166,847 55 $173,911 8 $92,409 0 $0 3 $101,583 0 $0
Aggregated Statistics For Year 2004(Based on 1 full and 3 partial tracts) A) FHA, FSA/RHS & VA B) Conventional C) Refinancings D) Home Improvement Loans E) Loans on Dwellings For 5+ Families F) Non-occupant Loans on G) Loans On Manufactured Number Average Value Number Average Value Number Average Value Number Average Value Number Average Value Number Average Value Number Average Value
LOANS ORIGINATED 43 $144,589 321 $134,571 667 $129,567 95 $56,032 3 $835,763 154 $114,891 2 $79,435 APPLICATIONS APPROVED, NOT ACCEPTED 2 $232,160 44 $124,903 123 $142,050 20 $68,168 0 $0 15 $128,114 2 $73,850 APPLICATIONS DENIED 0 $0 95 $122,790 323 $130,022 83 $70,724 0 $0 40 $119,715 2 $63,000 APPLICATIONS WITHDRAWN 7 $171,467 44 $144,855 325 $133,358 22 $74,826 0 $0 24 $127,571 1 $161,350 FILES CLOSED FOR INCOMPLETENESS 0 $0 9 $115,781 58 $150,747 11 $31,664 0 $0 2 $96,665 0 $0
Detailed HMDA statistics for the following Tracts:
0004.02
, 0004.03 , 0004.04 , 0004.05
Private Mortgage Insurance Companies Aggregated Statistics For Year 2009(Based on 1 full and 3 partial tracts) A) Conventional B) Refinancings C) Non-occupant Loans on Number Average Value Number Average Value Number Average Value
LOANS ORIGINATED 3 $290,693 6 $199,100 0 $0 APPLICATIONS APPROVED, NOT ACCEPTED 3 $119,127 2 $158,960 1 $170,000 APPLICATIONS DENIED 0 $0 1 $105,080 0 $0 APPLICATIONS WITHDRAWN 1 $269,160 0 $0 0 $0 FILES CLOSED FOR INCOMPLETENESS 0 $0 0 $0 0 $0
Aggregated Statistics For Year 2008(Based on 1 full and 3 partial tracts) A) Conventional B) Refinancings C) Non-occupant Loans on Number Average Value Number Average Value Number Average Value
LOANS ORIGINATED 29 $234,380 14 $198,709 0 $0 APPLICATIONS APPROVED, NOT ACCEPTED 15 $242,185 11 $263,736 2 $361,315 APPLICATIONS DENIED 2 $204,860 2 $157,060 0 $0 APPLICATIONS WITHDRAWN 2 $257,220 1 $335,000 0 $0 FILES CLOSED FOR INCOMPLETENESS 0 $0 0 $0 0 $0
Aggregated Statistics For Year 2007(Based on 1 full and 3 partial tracts) A) Conventional B) Refinancings C) Non-occupant Loans on Number Average Value Number Average Value Number Average Value
LOANS ORIGINATED 64 $270,342 30 $249,386 3 $217,220 APPLICATIONS APPROVED, NOT ACCEPTED 7 $288,464 9 $255,024 0 $0 APPLICATIONS DENIED 1 $210,160 0 $0 0 $0 APPLICATIONS WITHDRAWN 2 $268,750 1 $338,000 0 $0 FILES CLOSED FOR INCOMPLETENESS 0 $0 1 $217,100 0 $0
Aggregated Statistics For Year 2006(Based on 1 full and 3 partial tracts) A) Conventional B) Refinancings C) Non-occupant Loans on Number Average Value Number Average Value Number Average Value
LOANS ORIGINATED 24 $265,912 22 $242,991 2 $254,000 APPLICATIONS APPROVED, NOT ACCEPTED 2 $269,755 7 $254,277 1 $208,800 APPLICATIONS DENIED 0 $0 0 $0 0 $0 APPLICATIONS WITHDRAWN 1 $257,000 2 $302,935 0 $0 FILES CLOSED FOR INCOMPLETENESS 0 $0 1 $227,130 0 $0
Aggregated Statistics For Year 2005(Based on 1 full and 3 partial tracts) A) Conventional B) Refinancings C) Non-occupant Loans on Number Average Value Number Average Value Number Average Value
LOANS ORIGINATED 42 $220,747 33 $206,870 8 $168,108 APPLICATIONS APPROVED, NOT ACCEPTED 7 $218,853 9 $193,520 3 $164,197 APPLICATIONS DENIED 0 $0 0 $0 0 $0 APPLICATIONS WITHDRAWN 2 $122,570 3 $238,653 1 $272,000 FILES CLOSED FOR INCOMPLETENESS 1 $255,370 0 $0 0 $0
Aggregated Statistics For Year 2004(Based on 1 full and 3 partial tracts) A) Conventional B) Refinancings C) Non-occupant Loans on Number Average Value Number Average Value Number Average Value
LOANS ORIGINATED 36 $176,202 37 $159,797 11 $133,881 APPLICATIONS APPROVED, NOT ACCEPTED 8 $160,625 18 $135,786 4 $153,070 APPLICATIONS DENIED 1 $143,000 0 $0 0 $0 APPLICATIONS WITHDRAWN 0 $0 2 $154,255 1 $229,430 FILES CLOSED FOR INCOMPLETENESS 0 $0 0 $0 0 $0
Detailed PMIC statistics for the following Tracts:
0004.02
, 0004.03 , 0004.04 , 0004.05 Fire-safe hotels and motels in Lemoore, California:
Best Western Inn & Suites Lemoore, 820 E Bush St, Lemoore, California 93245 Phone: (559) 924-3200, Fax: (559) 924-0198
Motel 6, 1290 Sierra Cir, Lemoore, California 93245 Phone: (559) 925-6100, Fax: (559) 925-6500
Naval Air Station Lemoore Navy Lodge, Tracker Ave, Bldg 919, Lemoore, California 93245 Phone: (559) 998-5791, Fax: (559) 998-6149
Navy Lodge Lemoore, Tracker Avenue Bldg 919, Lemoore, California 93245 Phone: (800) 628-9466, Fax: (559) 998-6149
All 4 fire-safe hotels and motels in Lemoore, California
Most common first names in Lemoore, CA among deceased individuals Name Count Lived (average)
John 89 74.3 years Mary 83 76.0 years William 53 73.8 years Robert 49 65.1 years James 47 70.5 years Joe 47 75.2 years Frank 42 75.9 years Manuel 40 77.2 years Maria 38 82.7 years Joseph 33 72.3 years
Most common last names in Lemoore, CA among deceased individuals Last name Count Lived (average)
Smith 33 72.2 years Williams 29 74.3 years Silva 26 79.9 years Jones 23 69.4 years Martin 22 79.1 years Garcia 18 68.3 years Thomas 17 70.9 years Johnson 16 72.3 years Miller 15 65.5 years Davis 15 75.5 years
Lemoore compared to California state average:
Median house value below state average. House age below state average.
Top Patent Applicants
Ronnie Joe Nimmo, Sr. (3)
Ronnie J. Nimmo (3)
Marc Raygoza (1)
Caroline Marie Nimmo (1)
Doug Silva (1)
Kenneth J. Pereira (1)
Ashish K. Verma (1)
Antonio Miravete (1)
Total of 11 patent applications in 2008-2024.


 Recent articles from our blog. Our writers, many of them Ph.D. graduates or candidates, create easy-to-read articles on a wide variety of topics.

 (26.7 miles
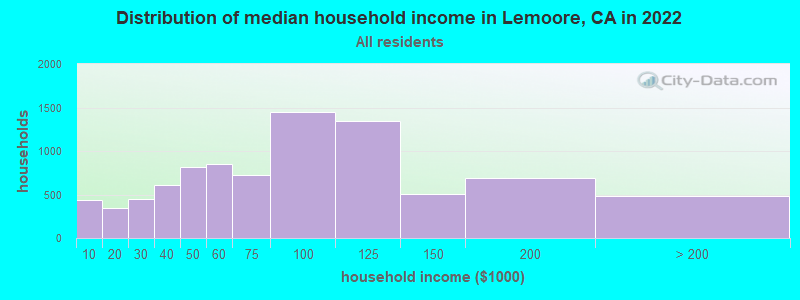


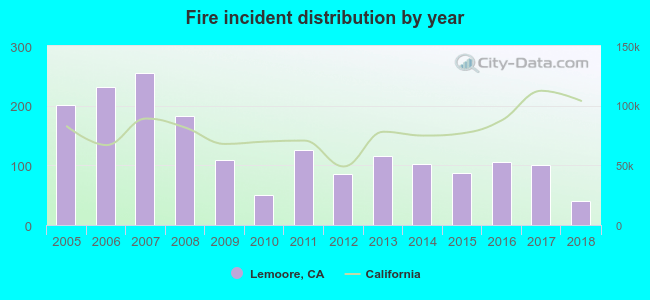 Based on the data from the years 2005 - 2018 the average number of fires per year is 128. The highest number of fire incidents - 254 took place in 2007, and the least - 40 in 2018. The data has a declining trend.
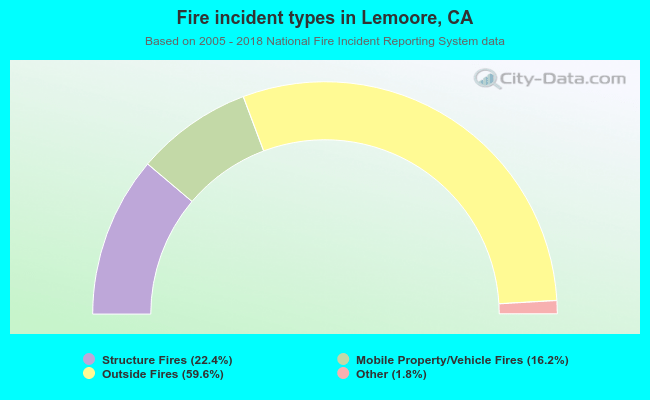 When looking into fire subcategories, the most reports belonged to: Outside Fires (59.6%), and Structure Fires (22.4%).