Lenoir City, Tennessee Submit your own pictures of this city and show them to the world
OSM Map
General Map
Google Map
MSN Map
OSM Map
General Map
Google Map
MSN Map
OSM Map
General Map
Google Map
MSN Map
OSM Map
General Map
Google Map
MSN Map
Please wait while loading the map...
Population in 2022: 11,292 (99% urban, 1% rural). Population change since 2000: +65.6%Males: 5,269 Females: 6,023
March 2022 cost of living index in Lenoir City: 85.9 (less than average, U.S. average is 100) Percentage of residents living in poverty in 2022: 17.9%for White Non-Hispanic residents , 12.2% for Hispanic or Latino residents , 10.8% for other race residents , 24.7% for two or more races residents )
Profiles of local businesses
Business Search - 14 Million verified businesses
Data:
Median household income ($)
Median household income (% change since 2000)
Household income diversity
Ratio of average income to average house value (%)
Ratio of average income to average rent
Median household income ($) - White
Median household income ($) - Black or African American
Median household income ($) - Asian
Median household income ($) - Hispanic or Latino
Median household income ($) - American Indian and Alaska Native
Median household income ($) - Multirace
Median household income ($) - Other Race
Median household income for houses/condos with a mortgage ($)
Median household income for apartments without a mortgage ($)
Races - White alone (%)
Races - White alone (% change since 2000)
Races - Black alone (%)
Races - Black alone (% change since 2000)
Races - American Indian alone (%)
Races - American Indian alone (% change since 2000)
Races - Asian alone (%)
Races - Asian alone (% change since 2000)
Races - Hispanic (%)
Races - Hispanic (% change since 2000)
Races - Native Hawaiian and Other Pacific Islander alone (%)
Races - Native Hawaiian and Other Pacific Islander alone (% change since 2000)
Races - Two or more races (%)
Races - Two or more races (% change since 2000)
Races - Other race alone (%)
Races - Other race alone (% change since 2000)
Racial diversity
Unemployment (%)
Unemployment (% change since 2000)
Unemployment (%) - White
Unemployment (%) - Black or African American
Unemployment (%) - Asian
Unemployment (%) - Hispanic or Latino
Unemployment (%) - American Indian and Alaska Native
Unemployment (%) - Multirace
Unemployment (%) - Other Race
Population density (people per square mile)
Population - Males (%)
Population - Females (%)
Population - Males (%) - White
Population - Males (%) - Black or African American
Population - Males (%) - Asian
Population - Males (%) - Hispanic or Latino
Population - Males (%) - American Indian and Alaska Native
Population - Males (%) - Multirace
Population - Males (%) - Other Race
Population - Females (%) - White
Population - Females (%) - Black or African American
Population - Females (%) - Asian
Population - Females (%) - Hispanic or Latino
Population - Females (%) - American Indian and Alaska Native
Population - Females (%) - Multirace
Population - Females (%) - Other Race
Coronavirus confirmed cases (Apr 28, 2024)
Deaths caused by coronavirus (Apr 28, 2024)
Coronavirus confirmed cases (per 100k population) (Apr 28, 2024)
Deaths caused by coronavirus (per 100k population) (Apr 28, 2024)
Daily increase in number of cases (Apr 28, 2024)
Weekly increase in number of cases (Apr 28, 2024)
Cases doubled (in days) (Apr 28, 2024)
Hospitalized patients (Apr 18, 2022)
Negative test results (Apr 18, 2022)
Total test results (Apr 18, 2022)
COVID Vaccine doses distributed (per 100k population) (Sep 19, 2023)
COVID Vaccine doses administered (per 100k population) (Sep 19, 2023)
COVID Vaccine doses distributed (Sep 19, 2023)
COVID Vaccine doses administered (Sep 19, 2023)
Likely homosexual households (%)
Likely homosexual households (% change since 2000)
Likely homosexual households - Lesbian couples (%)
Likely homosexual households - Lesbian couples (% change since 2000)
Likely homosexual households - Gay men (%)
Likely homosexual households - Gay men (% change since 2000)
Cost of living index
Median gross rent ($)
Median contract rent ($)
Median monthly housing costs ($)
Median house or condo value ($)
Median house or condo value ($ change since 2000)
Mean house or condo value by units in structure - 1, detached ($)
Mean house or condo value by units in structure - 1, attached ($)
Mean house or condo value by units in structure - 2 ($)
Mean house or condo value by units in structure by units in structure - 3 or 4 ($)
Mean house or condo value by units in structure - 5 or more ($)
Mean house or condo value by units in structure - Boat, RV, van, etc. ($)
Mean house or condo value by units in structure - Mobile home ($)
Median house or condo value ($) - White
Median house or condo value ($) - Black or African American
Median house or condo value ($) - Asian
Median house or condo value ($) - Hispanic or Latino
Median house or condo value ($) - American Indian and Alaska Native
Median house or condo value ($) - Multirace
Median house or condo value ($) - Other Race
Median resident age
Resident age diversity
Median resident age - Males
Median resident age - Females
Median resident age - White
Median resident age - Black or African American
Median resident age - Asian
Median resident age - Hispanic or Latino
Median resident age - American Indian and Alaska Native
Median resident age - Multirace
Median resident age - Other Race
Median resident age - Males - White
Median resident age - Males - Black or African American
Median resident age - Males - Asian
Median resident age - Males - Hispanic or Latino
Median resident age - Males - American Indian and Alaska Native
Median resident age - Males - Multirace
Median resident age - Males - Other Race
Median resident age - Females - White
Median resident age - Females - Black or African American
Median resident age - Females - Asian
Median resident age - Females - Hispanic or Latino
Median resident age - Females - American Indian and Alaska Native
Median resident age - Females - Multirace
Median resident age - Females - Other Race
Commute - mean travel time to work (minutes)
Travel time to work - Less than 5 minutes (%)
Travel time to work - Less than 5 minutes (% change since 2000)
Travel time to work - 5 to 9 minutes (%)
Travel time to work - 5 to 9 minutes (% change since 2000)
Travel time to work - 10 to 19 minutes (%)
Travel time to work - 10 to 19 minutes (% change since 2000)
Travel time to work - 20 to 29 minutes (%)
Travel time to work - 20 to 29 minutes (% change since 2000)
Travel time to work - 30 to 39 minutes (%)
Travel time to work - 30 to 39 minutes (% change since 2000)
Travel time to work - 40 to 59 minutes (%)
Travel time to work - 40 to 59 minutes (% change since 2000)
Travel time to work - 60 to 89 minutes (%)
Travel time to work - 60 to 89 minutes (% change since 2000)
Travel time to work - 90 or more minutes (%)
Travel time to work - 90 or more minutes (% change since 2000)
Marital status - Never married (%)
Marital status - Now married (%)
Marital status - Separated (%)
Marital status - Widowed (%)
Marital status - Divorced (%)
Median family income ($)
Median family income (% change since 2000)
Median non-family income ($)
Median non-family income (% change since 2000)
Median per capita income ($)
Median per capita income (% change since 2000)
Median family income ($) - White
Median family income ($) - Black or African American
Median family income ($) - Asian
Median family income ($) - Hispanic or Latino
Median family income ($) - American Indian and Alaska Native
Median family income ($) - Multirace
Median family income ($) - Other Race
Median year house/condo built
Median year apartment built
Year house built - Built 2005 or later (%)
Year house built - Built 2000 to 2004 (%)
Year house built - Built 1990 to 1999 (%)
Year house built - Built 1980 to 1989 (%)
Year house built - Built 1970 to 1979 (%)
Year house built - Built 1960 to 1969 (%)
Year house built - Built 1950 to 1959 (%)
Year house built - Built 1940 to 1949 (%)
Year house built - Built 1939 or earlier (%)
Average household size
Household density (households per square mile)
Average household size - White
Average household size - Black or African American
Average household size - Asian
Average household size - Hispanic or Latino
Average household size - American Indian and Alaska Native
Average household size - Multirace
Average household size - Other Race
Occupied housing units (%)
Vacant housing units (%)
Owner occupied housing units (%)
Renter occupied housing units (%)
Vacancy status - For rent (%)
Vacancy status - For sale only (%)
Vacancy status - Rented or sold, not occupied (%)
Vacancy status - For seasonal, recreational, or occasional use (%)
Vacancy status - For migrant workers (%)
Vacancy status - Other vacant (%)
Residents with income below the poverty level (%)
Residents with income below 50% of the poverty level (%)
Children below poverty level (%)
Poor families by family type - Married-couple family (%)
Poor families by family type - Male, no wife present (%)
Poor families by family type - Female, no husband present (%)
Poverty status for native-born residents (%)
Poverty status for foreign-born residents (%)
Poverty among high school graduates not in families (%)
Poverty among people who did not graduate high school not in families (%)
Residents with income below the poverty level (%) - White
Residents with income below the poverty level (%) - Black or African American
Residents with income below the poverty level (%) - Asian
Residents with income below the poverty level (%) - Hispanic or Latino
Residents with income below the poverty level (%) - American Indian and Alaska Native
Residents with income below the poverty level (%) - Multirace
Residents with income below the poverty level (%) - Other Race
Air pollution - Air Quality Index (AQI)
Air pollution - CO
Air pollution - NO2
Air pollution - SO2
Air pollution - Ozone
Air pollution - PM10
Air pollution - PM25
Air pollution - Pb
Crime - Murders per 100,000 population
Crime - Rapes per 100,000 population
Crime - Robberies per 100,000 population
Crime - Assaults per 100,000 population
Crime - Burglaries per 100,000 population
Crime - Thefts per 100,000 population
Crime - Auto thefts per 100,000 population
Crime - Arson per 100,000 population
Crime - City-data.com crime index
Crime - Violent crime index
Crime - Property crime index
Crime - Murders per 100,000 population (5 year average)
Crime - Rapes per 100,000 population (5 year average)
Crime - Robberies per 100,000 population (5 year average)
Crime - Assaults per 100,000 population (5 year average)
Crime - Burglaries per 100,000 population (5 year average)
Crime - Thefts per 100,000 population (5 year average)
Crime - Auto thefts per 100,000 population (5 year average)
Crime - Arson per 100,000 population (5 year average)
Crime - City-data.com crime index (5 year average)
Crime - Violent crime index (5 year average)
Crime - Property crime index (5 year average)
1996 Presidential Elections Results (%) - Democratic Party (Clinton)
1996 Presidential Elections Results (%) - Republican Party (Dole)
1996 Presidential Elections Results (%) - Other
2000 Presidential Elections Results (%) - Democratic Party (Gore)
2000 Presidential Elections Results (%) - Republican Party (Bush)
2000 Presidential Elections Results (%) - Other
2004 Presidential Elections Results (%) - Democratic Party (Kerry)
2004 Presidential Elections Results (%) - Republican Party (Bush)
2004 Presidential Elections Results (%) - Other
2008 Presidential Elections Results (%) - Democratic Party (Obama)
2008 Presidential Elections Results (%) - Republican Party (McCain)
2008 Presidential Elections Results (%) - Other
2012 Presidential Elections Results (%) - Democratic Party (Obama)
2012 Presidential Elections Results (%) - Republican Party (Romney)
2012 Presidential Elections Results (%) - Other
2016 Presidential Elections Results (%) - Democratic Party (Clinton)
2016 Presidential Elections Results (%) - Republican Party (Trump)
2016 Presidential Elections Results (%) - Other
2020 Presidential Elections Results (%) - Democratic Party (Biden)
2020 Presidential Elections Results (%) - Republican Party (Trump)
2020 Presidential Elections Results (%) - Other
Ancestries Reported - Arab (%)
Ancestries Reported - Czech (%)
Ancestries Reported - Danish (%)
Ancestries Reported - Dutch (%)
Ancestries Reported - English (%)
Ancestries Reported - French (%)
Ancestries Reported - French Canadian (%)
Ancestries Reported - German (%)
Ancestries Reported - Greek (%)
Ancestries Reported - Hungarian (%)
Ancestries Reported - Irish (%)
Ancestries Reported - Italian (%)
Ancestries Reported - Lithuanian (%)
Ancestries Reported - Norwegian (%)
Ancestries Reported - Polish (%)
Ancestries Reported - Portuguese (%)
Ancestries Reported - Russian (%)
Ancestries Reported - Scotch-Irish (%)
Ancestries Reported - Scottish (%)
Ancestries Reported - Slovak (%)
Ancestries Reported - Subsaharan African (%)
Ancestries Reported - Swedish (%)
Ancestries Reported - Swiss (%)
Ancestries Reported - Ukrainian (%)
Ancestries Reported - United States (%)
Ancestries Reported - Welsh (%)
Ancestries Reported - West Indian (%)
Ancestries Reported - Other (%)
Educational Attainment - No schooling completed (%)
Educational Attainment - Less than high school (%)
Educational Attainment - High school or equivalent (%)
Educational Attainment - Less than 1 year of college (%)
Educational Attainment - 1 or more years of college (%)
Educational Attainment - Associate degree (%)
Educational Attainment - Bachelor's degree (%)
Educational Attainment - Master's degree (%)
Educational Attainment - Professional school degree (%)
Educational Attainment - Doctorate degree (%)
School Enrollment - Nursery, preschool (%)
School Enrollment - Kindergarten (%)
School Enrollment - Grade 1 to 4 (%)
School Enrollment - Grade 5 to 8 (%)
School Enrollment - Grade 9 to 12 (%)
School Enrollment - College undergrad (%)
School Enrollment - Graduate or professional (%)
School Enrollment - Not enrolled in school (%)
School enrollment - Public schools (%)
School enrollment - Private schools (%)
School enrollment - Not enrolled (%)
Median number of rooms in houses and condos
Median number of rooms in apartments
Housing units lacking complete plumbing facilities (%)
Housing units lacking complete kitchen facilities (%)
Density of houses
Urban houses (%)
Rural houses (%)
Households with people 60 years and over (%)
Households with people 65 years and over (%)
Households with people 75 years and over (%)
Households with one or more nonrelatives (%)
Households with no nonrelatives (%)
Population in households (%)
Family households (%)
Nonfamily households (%)
Population in families (%)
Family households with own children (%)
Median number of bedrooms in owner occupied houses
Mean number of bedrooms in owner occupied houses
Median number of bedrooms in renter occupied houses
Mean number of bedrooms in renter occupied houses
Median number of vehichles in owner occupied houses
Mean number of vehichles in owner occupied houses
Median number of vehichles in renter occupied houses
Mean number of vehichles in renter occupied houses
Mortgage status - with mortgage (%)
Mortgage status - with second mortgage (%)
Mortgage status - with home equity loan (%)
Mortgage status - with both second mortgage and home equity loan (%)
Mortgage status - without a mortgage (%)
Average family size
Average family size - White
Average family size - Black or African American
Average family size - Asian
Average family size - Hispanic or Latino
Average family size - American Indian and Alaska Native
Average family size - Multirace
Average family size - Other Race
Geographical mobility - Same house 1 year ago (%)
Geographical mobility - Moved within same county (%)
Geographical mobility - Moved from different county within same state (%)
Geographical mobility - Moved from different state (%)
Geographical mobility - Moved from abroad (%)
Place of birth - Born in state of residence (%)
Place of birth - Born in other state (%)
Place of birth - Native, outside of US (%)
Place of birth - Foreign born (%)
Housing units in structures - 1, detached (%)
Housing units in structures - 1, attached (%)
Housing units in structures - 2 (%)
Housing units in structures - 3 or 4 (%)
Housing units in structures - 5 to 9 (%)
Housing units in structures - 10 to 19 (%)
Housing units in structures - 20 to 49 (%)
Housing units in structures - 50 or more (%)
Housing units in structures - Mobile home (%)
Housing units in structures - Boat, RV, van, etc. (%)
House/condo owner moved in on average (years ago)
Renter moved in on average (years ago)
Year householder moved into unit - Moved in 1999 to March 2000 (%)
Year householder moved into unit - Moved in 1995 to 1998 (%)
Year householder moved into unit - Moved in 1990 to 1994 (%)
Year householder moved into unit - Moved in 1980 to 1989 (%)
Year householder moved into unit - Moved in 1970 to 1979 (%)
Year householder moved into unit - Moved in 1969 or earlier (%)
Means of transportation to work - Drove car alone (%)
Means of transportation to work - Carpooled (%)
Means of transportation to work - Public transportation (%)
Means of transportation to work - Bus or trolley bus (%)
Means of transportation to work - Streetcar or trolley car (%)
Means of transportation to work - Subway or elevated (%)
Means of transportation to work - Railroad (%)
Means of transportation to work - Ferryboat (%)
Means of transportation to work - Taxicab (%)
Means of transportation to work - Motorcycle (%)
Means of transportation to work - Bicycle (%)
Means of transportation to work - Walked (%)
Means of transportation to work - Other means (%)
Working at home (%)
Industry diversity
Most Common Industries - Agriculture, forestry, fishing and hunting, and mining (%)
Most Common Industries - Agriculture, forestry, fishing and hunting (%)
Most Common Industries - Mining, quarrying, and oil and gas extraction (%)
Most Common Industries - Construction (%)
Most Common Industries - Manufacturing (%)
Most Common Industries - Wholesale trade (%)
Most Common Industries - Retail trade (%)
Most Common Industries - Transportation and warehousing, and utilities (%)
Most Common Industries - Transportation and warehousing (%)
Most Common Industries - Utilities (%)
Most Common Industries - Information (%)
Most Common Industries - Finance and insurance, and real estate and rental and leasing (%)
Most Common Industries - Finance and insurance (%)
Most Common Industries - Real estate and rental and leasing (%)
Most Common Industries - Professional, scientific, and management, and administrative and waste management services (%)
Most Common Industries - Professional, scientific, and technical services (%)
Most Common Industries - Management of companies and enterprises (%)
Most Common Industries - Administrative and support and waste management services (%)
Most Common Industries - Educational services, and health care and social assistance (%)
Most Common Industries - Educational services (%)
Most Common Industries - Health care and social assistance (%)
Most Common Industries - Arts, entertainment, and recreation, and accommodation and food services (%)
Most Common Industries - Arts, entertainment, and recreation (%)
Most Common Industries - Accommodation and food services (%)
Most Common Industries - Other services, except public administration (%)
Most Common Industries - Public administration (%)
Occupation diversity
Most Common Occupations - Management, business, science, and arts occupations (%)
Most Common Occupations - Management, business, and financial occupations (%)
Most Common Occupations - Management occupations (%)
Most Common Occupations - Business and financial operations occupations (%)
Most Common Occupations - Computer, engineering, and science occupations (%)
Most Common Occupations - Computer and mathematical occupations (%)
Most Common Occupations - Architecture and engineering occupations (%)
Most Common Occupations - Life, physical, and social science occupations (%)
Most Common Occupations - Education, legal, community service, arts, and media occupations (%)
Most Common Occupations - Community and social service occupations (%)
Most Common Occupations - Legal occupations (%)
Most Common Occupations - Education, training, and library occupations (%)
Most Common Occupations - Arts, design, entertainment, sports, and media occupations (%)
Most Common Occupations - Healthcare practitioners and technical occupations (%)
Most Common Occupations - Health diagnosing and treating practitioners and other technical occupations (%)
Most Common Occupations - Health technologists and technicians (%)
Most Common Occupations - Service occupations (%)
Most Common Occupations - Healthcare support occupations (%)
Most Common Occupations - Protective service occupations (%)
Most Common Occupations - Fire fighting and prevention, and other protective service workers including supervisors (%)
Most Common Occupations - Law enforcement workers including supervisors (%)
Most Common Occupations - Food preparation and serving related occupations (%)
Most Common Occupations - Building and grounds cleaning and maintenance occupations (%)
Most Common Occupations - Personal care and service occupations (%)
Most Common Occupations - Sales and office occupations (%)
Most Common Occupations - Sales and related occupations (%)
Most Common Occupations - Office and administrative support occupations (%)
Most Common Occupations - Natural resources, construction, and maintenance occupations (%)
Most Common Occupations - Farming, fishing, and forestry occupations (%)
Most Common Occupations - Construction and extraction occupations (%)
Most Common Occupations - Installation, maintenance, and repair occupations (%)
Most Common Occupations - Production, transportation, and material moving occupations (%)
Most Common Occupations - Production occupations (%)
Most Common Occupations - Transportation occupations (%)
Most Common Occupations - Material moving occupations (%)
People in Group quarters - Institutionalized population (%)
People in Group quarters - Correctional institutions (%)
People in Group quarters - Federal prisons and detention centers (%)
People in Group quarters - Halfway houses (%)
People in Group quarters - Local jails and other confinement facilities (including police lockups) (%)
People in Group quarters - Military disciplinary barracks (%)
People in Group quarters - State prisons (%)
People in Group quarters - Other types of correctional institutions (%)
People in Group quarters - Nursing homes (%)
People in Group quarters - Hospitals/wards, hospices, and schools for the handicapped (%)
People in Group quarters - Hospitals/wards and hospices for chronically ill (%)
People in Group quarters - Hospices or homes for chronically ill (%)
People in Group quarters - Military hospitals or wards for chronically ill (%)
People in Group quarters - Other hospitals or wards for chronically ill (%)
People in Group quarters - Hospitals or wards for drug/alcohol abuse (%)
People in Group quarters - Mental (Psychiatric) hospitals or wards (%)
People in Group quarters - Schools, hospitals, or wards for the mentally retarded (%)
People in Group quarters - Schools, hospitals, or wards for the physically handicapped (%)
People in Group quarters - Institutions for the deaf (%)
People in Group quarters - Institutions for the blind (%)
People in Group quarters - Orthopedic wards and institutions for the physically handicapped (%)
People in Group quarters - Wards in general hospitals for patients who have no usual home elsewhere (%)
People in Group quarters - Wards in military hospitals for patients who have no usual home elsewhere (%)
People in Group quarters - Juvenile institutions (%)
People in Group quarters - Long-term care (%)
People in Group quarters - Homes for abused, dependent, and neglected children (%)
People in Group quarters - Residential treatment centers for emotionally disturbed children (%)
People in Group quarters - Training schools for juvenile delinquents (%)
People in Group quarters - Short-term care, detention or diagnostic centers for delinquent children (%)
People in Group quarters - Type of juvenile institution unknown (%)
People in Group quarters - Noninstitutionalized population (%)
People in Group quarters - College dormitories (includes college quarters off campus) (%)
People in Group quarters - Military quarters (%)
People in Group quarters - On base (%)
People in Group quarters - Barracks, unaccompanied personnel housing (UPH), (Enlisted/Officer), ;and similar group living quarters for military personnel (%)
People in Group quarters - Transient quarters for temporary residents (%)
People in Group quarters - Military ships (%)
People in Group quarters - Group homes (%)
People in Group quarters - Homes or halfway houses for drug/alcohol abuse (%)
People in Group quarters - Homes for the mentally ill (%)
People in Group quarters - Homes for the mentally retarded (%)
People in Group quarters - Homes for the physically handicapped (%)
People in Group quarters - Other group homes (%)
People in Group quarters - Religious group quarters (%)
People in Group quarters - Dormitories (%)
People in Group quarters - Agriculture workers' dormitories on farms (%)
People in Group quarters - Job Corps and vocational training facilities (%)
People in Group quarters - Other workers' dormitories (%)
People in Group quarters - Crews of maritime vessels (%)
People in Group quarters - Other nonhousehold living situations (%)
People in Group quarters - Other noninstitutional group quarters (%)
Residents speaking English at home (%)
Residents speaking English at home - Born in the United States (%)
Residents speaking English at home - Native, born elsewhere (%)
Residents speaking English at home - Foreign born (%)
Residents speaking Spanish at home (%)
Residents speaking Spanish at home - Born in the United States (%)
Residents speaking Spanish at home - Native, born elsewhere (%)
Residents speaking Spanish at home - Foreign born (%)
Residents speaking other language at home (%)
Residents speaking other language at home - Born in the United States (%)
Residents speaking other language at home - Native, born elsewhere (%)
Residents speaking other language at home - Foreign born (%)
Class of Workers - Employee of private company (%)
Class of Workers - Self-employed in own incorporated business (%)
Class of Workers - Private not-for-profit wage and salary workers (%)
Class of Workers - Local government workers (%)
Class of Workers - State government workers (%)
Class of Workers - Federal government workers (%)
Class of Workers - Self-employed workers in own not incorporated business and Unpaid family workers (%)
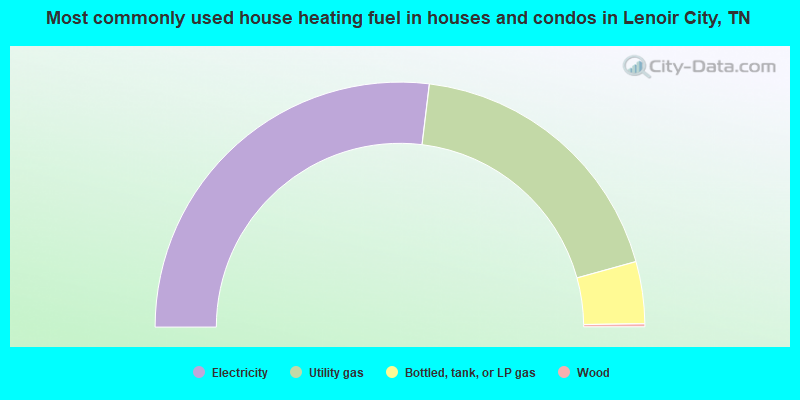
House heating fuel used in houses and condos - Utility gas (%)
House heating fuel used in houses and condos - Bottled, tank, or LP gas (%)
House heating fuel used in houses and condos - Electricity (%)
House heating fuel used in houses and condos - Fuel oil, kerosene, etc. (%)
House heating fuel used in houses and condos - Coal or coke (%)
House heating fuel used in houses and condos - Wood (%)
House heating fuel used in houses and condos - Solar energy (%)
House heating fuel used in houses and condos - Other fuel (%)
House heating fuel used in houses and condos - No fuel used (%)
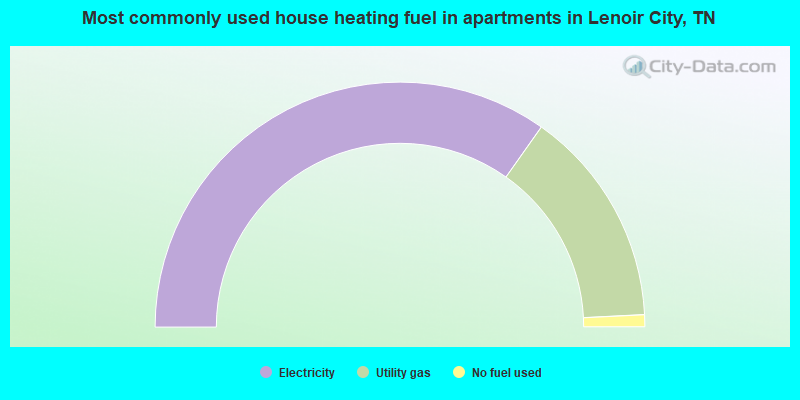
House heating fuel used in apartments - Utility gas (%)
House heating fuel used in apartments - Bottled, tank, or LP gas (%)
House heating fuel used in apartments - Electricity (%)
House heating fuel used in apartments - Fuel oil, kerosene, etc. (%)
House heating fuel used in apartments - Coal or coke (%)
House heating fuel used in apartments - Wood (%)
House heating fuel used in apartments - Solar energy (%)
House heating fuel used in apartments - Other fuel (%)
House heating fuel used in apartments - No fuel used (%)
Armed forces status - In Armed Forces (%)
Armed forces status - Civilian (%)
Armed forces status - Civilian - Veteran (%)
Armed forces status - Civilian - Nonveteran (%)
Fatal accidents locations in years 2005-2021
Fatal accidents locations in 2005
Fatal accidents locations in 2006
Fatal accidents locations in 2007
Fatal accidents locations in 2008
Fatal accidents locations in 2009
Fatal accidents locations in 2010
Fatal accidents locations in 2011
Fatal accidents locations in 2012
Fatal accidents locations in 2013
Fatal accidents locations in 2014
Fatal accidents locations in 2015
Fatal accidents locations in 2016
Fatal accidents locations in 2017
Fatal accidents locations in 2018
Fatal accidents locations in 2019
Fatal accidents locations in 2020
Fatal accidents locations in 2021
Alcohol use - People drinking some alcohol every month (%)
Alcohol use - People not drinking at all (%)
Alcohol use - Average days/month drinking alcohol
Alcohol use - Average drinks/week
Alcohol use - Average days/year people drink much
Audiometry - Average condition of hearing (%)
Audiometry - People that can hear a whisper from across a quiet room (%)
Audiometry - People that can hear normal voice from across a quiet room (%)
Audiometry - Ears ringing, roaring, buzzing (%)
Audiometry - Had a job exposure to loud noise (%)
Audiometry - Had off-work exposure to loud noise (%)
Blood Pressure & Cholesterol - Has high blood pressure (%)
Blood Pressure & Cholesterol - Checking blood pressure at home (%)
Blood Pressure & Cholesterol - Frequently checking blood cholesterol (%)
Blood Pressure & Cholesterol - Has high cholesterol level (%)
Consumer Behavior - Money monthly spent on food at supermarket/grocery store
Consumer Behavior - Money monthly spent on food at other stores
Consumer Behavior - Money monthly spent on eating out
Consumer Behavior - Money monthly spent on carryout/delivered foods
Consumer Behavior - Income spent on food at supermarket/grocery store (%)
Consumer Behavior - Income spent on food at other stores (%)
Consumer Behavior - Income spent on eating out (%)
Consumer Behavior - Income spent on carryout/delivered foods (%)
Current Health Status - General health condition (%)
Current Health Status - Blood donors (%)
Current Health Status - Has blood ever tested for HIV virus (%)
Current Health Status - Left-handed people (%)
Dermatology - People using sunscreen (%)
Diabetes - Diabetics (%)
Diabetes - Had a blood test for high blood sugar (%)
Diabetes - People taking insulin (%)
Diet Behavior & Nutrition - Diet health (%)
Diet Behavior & Nutrition - Milk product consumption (# of products/month)
Diet Behavior & Nutrition - Meals not home prepared (#/week)
Diet Behavior & Nutrition - Meals from fast food or pizza place (#/week)
Diet Behavior & Nutrition - Ready-to-eat foods (#/month)
Diet Behavior & Nutrition - Frozen meals/pizza (#/month)
Drug Use - People that ever used marijuana or hashish (%)
Drug Use - Ever used hard drugs (%)
Drug Use - Ever used any form of cocaine (%)
Drug Use - Ever used heroin (%)
Drug Use - Ever used methamphetamine (%)
Health Insurance - People covered by health insurance (%)
Kidney Conditions-Urology - Avg. # of times urinating at night
Medical Conditions - People with asthma (%)
Medical Conditions - People with anemia (%)
Medical Conditions - People with psoriasis (%)
Medical Conditions - People with overweight (%)
Medical Conditions - Elderly people having difficulties in thinking or remembering (%)
Medical Conditions - People who ever received blood transfusion (%)
Medical Conditions - People having trouble seeing even with glass/contacts (%)
Medical Conditions - People with arthritis (%)
Medical Conditions - People with gout (%)
Medical Conditions - People with congestive heart failure (%)
Medical Conditions - People with coronary heart disease (%)
Medical Conditions - People with angina pectoris (%)
Medical Conditions - People who ever had heart attack (%)
Medical Conditions - People who ever had stroke (%)
Medical Conditions - People with emphysema (%)
Medical Conditions - People with thyroid problem (%)
Medical Conditions - People with chronic bronchitis (%)
Medical Conditions - People with any liver condition (%)
Medical Conditions - People who ever had cancer or malignancy (%)
Mental Health - People who have little interest in doing things (%)
Mental Health - People feeling down, depressed, or hopeless (%)
Mental Health - People who have trouble sleeping or sleeping too much (%)
Mental Health - People feeling tired or having little energy (%)
Mental Health - People with poor appetite or overeating (%)
Mental Health - People feeling bad about themself (%)
Mental Health - People who have trouble concentrating on things (%)
Mental Health - People moving or speaking slowly or too fast (%)
Mental Health - People having thoughts they would be better off dead (%)
Oral Health - Average years since last visit a dentist
Oral Health - People embarrassed because of mouth (%)
Oral Health - People with gum disease (%)
Oral Health - General health of teeth and gums (%)
Oral Health - Average days a week using dental floss/device
Oral Health - Average days a week using mouthwash for dental problem
Oral Health - Average number of teeth
Pesticide Use - Households using pesticides to control insects (%)
Pesticide Use - Households using pesticides to kill weeds (%)
Physical Activity - People doing vigorous-intensity work activities (%)
Physical Activity - People doing moderate-intensity work activities (%)
Physical Activity - People walking or bicycling (%)
Physical Activity - People doing vigorous-intensity recreational activities (%)
Physical Activity - People doing moderate-intensity recreational activities (%)
Physical Activity - Average hours a day doing sedentary activities
Physical Activity - Average hours a day watching TV or videos
Physical Activity - Average hours a day using computer
Physical Functioning - People having limitations keeping them from working (%)
Physical Functioning - People limited in amount of work they can do (%)
Physical Functioning - People that need special equipment to walk (%)
Physical Functioning - People experiencing confusion/memory problems (%)
Physical Functioning - People requiring special healthcare equipment (%)
Prescription Medications - Average number of prescription medicines taking
Preventive Aspirin Use - Adults 40+ taking low-dose aspirin (%)
Reproductive Health - Vaginal deliveries (%)
Reproductive Health - Cesarean deliveries (%)
Reproductive Health - Deliveries resulted in a live birth (%)
Reproductive Health - Pregnancies resulted in a delivery (%)
Reproductive Health - Women breastfeeding newborns (%)
Reproductive Health - Women that had a hysterectomy (%)
Reproductive Health - Women that had both ovaries removed (%)
Reproductive Health - Women that have ever taken birth control pills (%)
Reproductive Health - Women taking birth control pills (%)
Reproductive Health - Women that have ever used Depo-Provera or injectables (%)
Reproductive Health - Women that have ever used female hormones (%)
Sexual Behavior - People 18+ that ever had sex (vaginal, anal, or oral) (%)
Sexual Behavior - Males 18+ that ever had vaginal sex with a woman (%)
Sexual Behavior - Males 18+ that ever performed oral sex on a woman (%)
Sexual Behavior - Males 18+ that ever had anal sex with a woman (%)
Sexual Behavior - Males 18+ that ever had any sex with a man (%)
Sexual Behavior - Females 18+ that ever had vaginal sex with a man (%)
Sexual Behavior - Females 18+ that ever performed oral sex on a man (%)
Sexual Behavior - Females 18+ that ever had anal sex with a man (%)
Sexual Behavior - Females 18+ that ever had any kind of sex with a woman (%)
Sexual Behavior - Average age people first had sex
Sexual Behavior - Average number of female sex partners in lifetime (males 18+)
Sexual Behavior - Average number of female vaginal sex partners in lifetime (males 18+)
Sexual Behavior - Average age people first performed oral sex on a woman (18+)
Sexual Behavior - Average number of woman performed oral sex on in lifetime (18+)
Sexual Behavior - Average number of male sex partners in lifetime (males 18+)
Sexual Behavior - Average number of male anal sex partners in lifetime (males 18+)
Sexual Behavior - Average age people first performed oral sex on a man (18+)
Sexual Behavior - Average number of male oral sex partners in lifetime (18+)
Sexual Behavior - People using protection when performing oral sex (%)
Sexual Behavior - Average number of times people have vaginal or anal sex a year
Sexual Behavior - People having sex without condom (%)
Sexual Behavior - Average number of male sex partners in lifetime (females 18+)
Sexual Behavior - Average number of male vaginal sex partners in lifetime (females 18+)
Sexual Behavior - Average number of female sex partners in lifetime (females 18+)
Sexual Behavior - Circumcised males 18+ (%)
Sleep Disorders - Average hours sleeping at night
Sleep Disorders - People that has trouble sleeping (%)
Smoking-Cigarette Use - People smoking cigarettes (%)
Taste & Smell - People 40+ having problems with smell (%)
Taste & Smell - People 40+ having problems with taste (%)
Taste & Smell - People 40+ that ever had wisdom teeth removed (%)
Taste & Smell - People 40+ that ever had tonsils teeth removed (%)
Taste & Smell - People 40+ that ever had a loss of consciousness because of a head injury (%)
Taste & Smell - People 40+ that ever had a broken nose or other serious injury to face or skull (%)
Taste & Smell - People 40+ that ever had two or more sinus infections (%)
Weight - Average height (inches)
Weight - Average weight (pounds)
Weight - Average BMI
Weight - People that are obese (%)
Weight - People that ever were obese (%)
Weight - People trying to lose weight (%)
Officers per 1,000 residents here:
2.87Tennessee average:
2.57
Latest news from Lenoir City, TN collected exclusively by city-data.com from local newspapers, TV, and radio stations
Ancestries: English (14.5%), American (13.9%), Irish (9.4%), German (8.8%), French (1.7%), Scotch-Irish (1.3%).
Current Local Time:
Land area: 6.20 square miles.
Population density: 1,820 people per square mile (low).
851 residents are foreign born (7.4% Latin America ).
This city:
8.1%Tennessee:
5.4%
Median real estate property taxes paid for housing units with mortgages in 2022: $1,034 (0.4%)Median real estate property taxes paid for housing units with no mortgage in 2022: $677 (0.4%)
Nearest city with pop. 50,000+: Knoxville, TN
Nearest city with pop. 200,000+: Atlanta, GA
Nearest city with pop. 1,000,000+: Chicago, IL
Nearest cities:
Latitude: 35.80 N, Longitude: 84.27 W
Daytime population change due to commuting: +2,240 (+21.4%)Workers who live and work in this city: 1,272 (27.2%)
Single-family new house construction building permits:
2022: 134 buildings , average cost: $163,3002021: 219 buildings , average cost: $170,2002020: 64 buildings , average cost: $189,1002019: 23 buildings , average cost: $194,0002018: 22 buildings , average cost: $172,7002017: 37 buildings , average cost: $172,1002016: 48 buildings , average cost: $179,7002015: 48 buildings , average cost: $173,0002014: 33 buildings , average cost: $174,0002013: 31 buildings , average cost: $157,3002012: 16 buildings , average cost: $120,8002011: 35 buildings , average cost: $65,1002010: 39 buildings , average cost: $125,2002009: 27 buildings , average cost: $143,8002008: 48 buildings , average cost: $115,7002007: 65 buildings , average cost: $107,2002006: 132 buildings , average cost: $94,2002005: 65 buildings , average cost: $83,1002004: 30 buildings , average cost: $81,6002003: 50 buildings , average cost: $88,1002002: 44 buildings , average cost: $64,6002001: 38 buildings , average cost: $63,6002000: 38 buildings , average cost: $63,6001999: 34 buildings , average cost: $70,5001998: 43 buildings , average cost: $106,0001997: 20 buildings , average cost: $100,200Unemployment in December 2023:
Population change in the 1990s: +517 (+8.2%).
Most common occupations in Lenoir City, TN (%)
Both Males Females
Other production occupations, including supervisors (5.5%)
Other sales and related occupations, including supervisors (5.1%)
Assemblers and fabricators (4.4%)
Secretaries and administrative assistants (4.1%)
Metal workers and plastic workers (4.0%)
Material recording, scheduling, dispatching, and distributing workers (3.4%)
Retail sales workers, except cashiers (3.2%)
Other production occupations, including supervisors (7.3%)
Metal workers and plastic workers (6.2%)
Vehicle and mobile equipment mechanics, installers, and repairers (5.6%)
Assemblers and fabricators (4.7%)
Building and grounds cleaning and maintenance occupations (4.1%)
Construction traders workers except carpenters, electricians, painters, plumbers, and construction laborers (4.0%)
Other management occupations, except farmers and farm managers (3.8%)
Secretaries and administrative assistants (8.3%)
Other sales and related occupations, including supervisors (6.8%)
Cashiers (5.5%)
Customer service representatives (5.0%)
Nursing, psychiatric, and home health aides (4.5%)
Assemblers and fabricators (4.0%)
Other production occupations, including supervisors (3.6%)
Tornado activity:
Lenoir City-area historical tornado activity is below Tennessee state average. It is 21% smaller than the overall U.S. average.
On 5/2/1953, a category F4 (max. wind speeds 207-260 mph) tornado 31.3 miles away from the Lenoir City city center killed 4 people and injured 8 people and caused between $50,000 and $500,000 in damages.
On 2/21/1993, a category F3 (max. wind speeds 158-206 mph) tornado 8.6 miles away from the city center killed one person and injured 55 people and caused between $5000 and $50,000 in damages.
Earthquake activity:
Lenoir City-area historical earthquake activity is significantly above Tennessee state average. It is 89% greater than the overall U.S. average. On 11/30/1973 at 07:48:41, a magnitude 4.7 (4.7 MB, 4.6 ML, Class: Light, Intensity: IV - V) earthquake occurred 17.3 miles away from the city center On 7/27/1980 at 18:52:21, a magnitude 5.2 (5.1 MB, 4.7 MS, 5.0 UK, 5.2 UK, Class: Moderate, Intensity: VI - VII) earthquake occurred 167.5 miles away from Lenoir City center On 4/29/2003 at 08:59:39, a magnitude 4.9 (4.4 MB, 4.6 MW, 4.9 LG) earthquake occurred 118.4 miles away from Lenoir City center On 12/12/2018 at 09:14:43, a magnitude 4.4 (4.4 MW, Depth: 4.9 mi) earthquake occurred 28.9 miles away from Lenoir City center On 8/9/2020 at 12:07:37, a magnitude 5.1 (5.1 MW, Depth: 4.7 mi) earthquake occurred 183.6 miles away from the city center On 8/2/1974 at 08:52:09, a magnitude 4.9 (4.3 MB, 4.9 LG) earthquake occurred 167.3 miles away from Lenoir City center Magnitude types: regional Lg-wave magnitude (LG), body-wave magnitude (MB), local magnitude (ML), surface-wave magnitude (MS), moment magnitude (MW) Natural disasters: The number of natural disasters in Loudon County (15) is near the US average (15).Major Disasters (Presidential) Declared: 10Emergencies Declared: 2Floods: 10, Storms: 8, Tornadoes: 5, Winds: 3, Winter Storms: 3, Heavy Rain: 1, Hurricane: 1, Landslide: 1, Mudslide: 1, Snowfall: 1, Other: 1 (Note: some incidents may be assigned to more than one category). Hospitals and medical centers in Lenoir City: FORT LOUDOUN MEDICAL CENTER (Voluntary non-profit - Other, provides emergency services, 550 FORT LOUDOUN MEDICAL CENTER DR) BAPTIST HEALTH CARE CENTER (700 WILLIAMS FERRY RD)
FMC LOUDON DIALYSIS (200 INTERCHANGE PARK DRIVE)
Colleges/universities with over 2000 students nearest to Lenoir City:
Pellissippi State Community College (about 12 miles; Knoxville, TN ; Full-time enrollment: 7,271)
Roane State Community College (about 21 miles; Harriman, TN ; FT enrollment: 4,302)
The University of Tennessee-Knoxville (about 23 miles; Knoxville, TN ; FT enrollment: 25,483)
Cleveland State Community College (about 54 miles; Cleveland, TN ; FT enrollment: 2,500)
Lee University (about 56 miles; Cleveland, TN ; FT enrollment: 4,422)
Walters State Community College (about 64 miles; Morristown, TN ; FT enrollment: 4,359)
Lincoln Memorial University (about 65 miles; Harrogate, TN ; FT enrollment: 3,706)
Public high school in Lenoir City:
Private high school in Lenoir City: CROSSROADS CHRISTIAN ACADEMY Students: 116, Location: 1963 MARTEL RD, Grades: PK-12)
Public elementary/middle schools in Lenoir City:
Private elementary/middle school in Lenoir City: LENOIR CITY CHRISTIAN ACADEMY Students: 100, Location: 2085 SIMPSON RD E, Grades: PK-1)
See full list of schools located in Lenoir City Library in Lenoir City: LENOIR CITY PUBLIC LIBRARY Operating income: $66,307; Location: 100 WEST BROADWAY; 20,258 books ; 312 audio materials ; 1,228 video materials ; 32 state licensed databases ; 53 print serial subscriptions )
User-submitted facts and corrections:
HIGHLAND HILLS CHRISTIAN ACAD is no longer in existence However, there is a K-12 Homeschool Co-op (3-day a week school) called Crossroads Christian Academy 865-986-9823. Also, TV Channel 38 (WDTT) is owned by Daystar (TX)
Lenoir City opened a new hospital in 2004: Fort Loudoun Medical Center (on Hwy 321 in Lenoir City) added by Lenoir City Welcome Lady
ROANE STATE COMMUNITY COLLEGE now has a campus in downtown Lenoir City
Notable locations in Lenoir City: (A) , Lenoir City Industrial Park (B) , Thurmans Dock (C) , Lenoir Mill (D) , Lenoir City Fire Department Station 2 (E) , Lenoir City Fire Department Station 1 (F) , Lenoir City Public Library (G) , Lenoir City City Hall (H) . Display/hide their locations on the map
Shopping Centers: (1) , Lenoir City Plaza Shopping Center (2) , Twin Lakes Plaza Shopping Center (3) . Display/hide their locations on the map
Churches in Lenoir City include: (A) , West Broadway Baptist Church (B) , Victory Temple Church (C) , Trinity United Methodist Church (D) , Silver Ridge Baptist Church (E) , Sixth Avenue Church of God (F) , Second Baptist Church (G) , Nelson Street Baptist Church (H) , Lenoir City Primitive Baptist Church (I) . Display/hide their locations on the map
Cemetery: (1) . Display/hide its location on the map
Creeks: (A) , Muddy Creek (B) . Display/hide their locations on the map
Parks in Lenoir City include: (1) , Lenior City Area Recreation Complex (2) , Rock Springs Park (3) . Display/hide their locations on the map
Tourist attractions:
Hotels:
Court:
Birthplace of: Jese Snyder - College basketball player (Belmont Bruins).
Loudon County has a predicted average indoor radon screening level greater than 4 pCi/L (pico curies per liter) - Highest Potential Drinking water stations with addresses in Lenoir City and their reported violations in the past:
LENOIR CITY UTILITY BOARD (Population served: 22,890, Surface water):
Past monitoring violations:
Monitoring and Reporting (DBP) - Between JUL-2008 and SEP-2008, Contaminant: Total Haloacetic Acids (HAA5). Follow-up actions: St Compliance achieved (OCT-21-2008), St Public Notif requested (OCT-28-2008), St Violation/Reminder Notice (OCT-28-2008), St AO (w/penalty) issued (FEB-03-2009)
Monitoring and Reporting (DBP) - Between JUL-2008 and SEP-2008, Contaminant: TTHM. Follow-up actions: St Compliance achieved (OCT-21-2008), St Public Notif requested (OCT-28-2008), St Violation/Reminder Notice (OCT-28-2008), St AO (w/penalty) issued (FEB-03-2009)
Population served: 3,994, Purch surface water):
Past health violations:
MCL, Average - Between JUL-2006 and SEP-2006, Contaminant: Total Haloacetic Acids (HAA5). Follow-up actions: St Violation/Reminder Notice (OCT-24-2006), St Public Notif requested (OCT-24-2006), St Public Notif received (OCT-27-2006), St Compliance achieved (NOV-13-2006)
Past monitoring violations:
Monitoring and Reporting (DBP) - Between OCT-2012 and DEC-2012, Contaminant: Total Haloacetic Acids (HAA5). Follow-up actions: St Public Notif requested (JAN-29-2013), St Violation/Reminder Notice (JAN-29-2013), St Compliance achieved (MAY-15-2013), St Public Notif received (MAY-15-2013)
Monitoring and Reporting (DBP) - Between OCT-2012 and DEC-2012, Contaminant: TTHM. Follow-up actions: St Public Notif requested (JAN-29-2013), St Violation/Reminder Notice (JAN-29-2013), St Compliance achieved (MAY-15-2013), St Public Notif received (MAY-15-2013)
One minor monitoring violation
Drinking water stations with addresses in Lenoir City that have no violations reported:
CROSS EYED CRICKET CAMPGROUND (Population served: 100, Primary Water Source Type: Groundwater)
Average household size: This city:
2.6 peopleTennessee:
2.5 people
Percentage of family households: This city:
64.8%Whole state:
67.3%
Percentage of households with unmarried partners: This city:
7.2%Whole state:
5.8%
Likely homosexual households (counted as self-reported same-sex unmarried-partner households)
Lesbian couples: 0.4% of all households Gay men: 0.1% of all households
7 people in group homes intended for adults in 2010people in other noninstitutional facilities in 2010people in nursing homes in 2000people in other noninstitutional group quarters in 2000
Banks with branches in Lenoir City (2011 data):
First National Bank: Hwy 321 Office Branch at 257 Medical Park Drive, branch established on 2006/02/22; at 200 East Broadway, branch established on 1907/05/02. Info updated 2006/11/03: Bank assets: $396.3 mil, Deposits: $348.4 mil, local headquarters , negative income in the last year , Commercial Lending Specialization, 9 total offices , Holding Company: Moneytree Corporation
Regions Bank: Lenoir City Branch at 805 East Broadway, branch established on 1974/02/11. Info updated 2011/02/24: Bank assets: $123,368.2 mil, Deposits: $98,301.3 mil, headquarters in Birmingham, AL, positive income , Commercial Lending Specialization, 1778 total offices , Holding Company: Regions Financial Corporation
United Community Bank: Lenoir City Branch at 725 Highway 321 North, branch established on 1991/06/04. Info updated 2009/06/23: Bank assets: $6,977.4 mil, Deposits: $6,170.1 mil, headquarters in Blairsville, GA, negative income in the last year , Commercial Lending Specialization, 106 total offices , Holding Company: United Community Banks, Inc.
American Trust Bank of East Tennessee: Medical Park Drive Branch at 256 Medical Park Drive, branch established on 2005/08/01. Info updated 2009/04/07: Bank assets: $138.8 mil, Deposits: $118.9 mil, headquarters in Knoxville, TN, positive income , Commercial Lending Specialization, 4 total offices
Branch Banking and Trust Company: Lenoir City Branch at 391 Highway 321 North, branch established on 1977/02/10. Info updated 2010/03/29: Bank assets: $168,867.6 mil, Deposits: $127,549.5 mil, headquarters in Winston Salem, NC, positive income , Commercial Lending Specialization, 1793 total offices , Holding Company: Bb&T Corporation
FSGBANK, National Association: Lenoir City Branch at 705 East Broadway, branch established on 2003/10/27. Info updated 2007/10/03: Bank assets: $1,111.8 mil, Deposits: $1,020.8 mil, headquarters in Chattanooga, TN, negative income in the last year , Commercial Lending Specialization, 30 total offices , Holding Company: First Security Group, Inc.
Capital Bank, National Association: Lenior City Branch at 510 Highway 321 North, branch established on 2000/04/10. Info updated 2011/09/21: Bank assets: $6,448.0 mil, Deposits: $5,135.4 mil, headquarters in Miami, FL, positive income , Commercial Lending Specialization, 152 total offices , Holding Company: North American Financial Holdings, Inc.
SunTrust Bank: Lenoir City Branch at 530 Highway 321 N, branch established on 1956/01/07. Info updated 2010/05/27: Bank assets: $171,291.7 mil, Deposits: $129,833.2 mil, headquarters in Atlanta, GA, positive income , Commercial Lending Specialization, 1716 total offices , Holding Company: Suntrust Banks, Inc.
For population 15 years and over in Lenoir City:
Never married: 33.6%Now married: 44.7%Separated: 2.1%Widowed: 8.9%Divorced: 10.7% For population 25 years and over in Lenoir City:
High school or higher: 88.3%Bachelor's degree or higher: 21.5%Graduate or professional degree: 7.8%Unemployed: 4.2%Mean travel time to work (commute): 19.5 minutes
Education Gini index (Inequality in education) Here:
11.6Tennessee average:
11.4
Religion statistics for Lenoir City, TN (based on Loudon County data)
Religion Adherents Congregations Evangelical Protestant 25,099 76 Mainline Protestant 3,573 19 Catholic 1,678 1 Other 656 3 Black Protestant 118 1 None 17,432 -
Source: Clifford Grammich, Kirk Hadaway, Richard Houseal, Dale E.Jones, Alexei Krindatch, Richie Stanley and Richard H.Taylor. 2012. 2010 U.S.Religion Census: Religious Congregations & Membership Study. Association of Statisticians of American Religious Bodies. Jones, Dale E., et al. 2002. Congregations and Membership in the United States 2000. Nashville, TN: Glenmary Research Center. Graphs represent county-level data
Food Environment Statistics: Number of grocery stores : 7Loudon County :
1.54 / 10,000 pop.Tennessee :
1.99 / 10,000 pop.
Number of supercenters and club stores : 1Loudon County :
0.22 / 10,000 pop.Tennessee :
0.17 / 10,000 pop.
Number of convenience stores (no gas) : 4Loudon County :
0.88 / 10,000 pop.State :
0.65 / 10,000 pop.
Number of convenience stores (with gas) : 27This county :
5.95 / 10,000 pop.State :
5.16 / 10,000 pop.
Number of full-service restaurants : 30This county :
6.61 / 10,000 pop.Tennessee :
6.56 / 10,000 pop.
Adult diabetes rate : Loudon County :
12.6%State :
11.4%
Adult obesity rate : Loudon County :
31.1%Tennessee :
30.2%
Low-income preschool obesity rate : Here :
18.3%Tennessee :
13.5%
Health and Nutrition: Healthy diet rate : Here:
46.8%Tennessee:
49.3%
Average overall health of teeth and gums : Lenoir City:
41.7%Tennessee:
46.1%
Average BMI : This city:
28.3Tennessee:
28.8
People feeling badly about themselves : This city:
22.9%State:
21.0%
People not drinking alcohol at all : Lenoir City:
10.6%State:
10.5%
Average hours sleeping at night : This city:
6.8Tennessee:
6.8
Overweight people : Here:
30.8%Tennessee:
33.9%
General health condition : Lenoir City:
53.1%State:
55.9%
Average condition of hearing : Lenoir City:
77.2%Tennessee:
79.1%
More about Health and Nutrition of Lenoir City, TN Residents
Local government employment and payroll (March 2022)
Function
Full-time employees
Monthly full-time payroll
Average yearly full-time wage
Part-time employees
Monthly part-time payroll
Elementary and Secondary - Instruction
211 $962,720 $54,752 32 $30,866 Electric Power
128 $831,219 $77,927 4 $10,934 Elementary and Secondary - Other Total
68 $190,952 $33,697 21 $34,704 Police Protection - Officers
30 $144,431 $57,772 5 $1,264 Firefighters
20 $90,102 $54,061 4 $4,677 Water Supply
16 $84,947 $63,710 0 $0 Streets and Highways
13 $50,125 $46,269 0 $0 Sewerage
9 $53,127 $70,836 3 $5,165 Other Government Administration
8 $17,118 $25,677 0 $0 Parks and Recreation
6 $27,623 $55,246 35 $29,521 Financial Administration
4 $20,480 $61,440 0 $0 Gas Supply
4 $39,509 $118,527 0 $0 Police - Other
2 $6,632 $39,792 0 $0 Judicial and Legal
2 $8,804 $52,824 2 $1,771
Totals for Government
521 $2,527,787 $58,222 106 $118,901
Lenoir City government finances - Expenditure in 2021 (per resident):
Construction - Electric Utilities: $8,180,000 ($724.41)
Regular Highways: $1,789,000 ($158.43)Gas Utilities: $394,000 ($34.89)Elementary and Secondary Education: $32,000 ($2.83)Water Utilities: $6,000 ($0.53)Sewerage: $6,000 ($0.53)Current Operations - Electric Utilities: $304,781,000 ($26990.88)
Elementary and Secondary Education: $23,430,000 ($2074.92)Water Utilities: $7,040,000 ($623.45)Gas Utilities: $6,250,000 ($553.49)Sewerage: $5,127,000 ($454.04)General - Other: $3,061,000 ($271.08)Police Protection: $2,183,000 ($193.32)Local Fire Protection: $1,697,000 ($150.28)Regular Highways: $1,417,000 ($125.49)Central Staff Services: $620,000 ($54.91)Miscellaneous Commercial Activities - Other: $470,000 ($41.62)Solid Waste Management: $399,000 ($35.33)Parks and Recreation: $347,000 ($30.73)Financial Administration: $334,000 ($29.58)Judicial and Legal Services: $268,000 ($23.73)General Public Buildings: $173,000 ($15.32)Protective Inspection and Regulation - Other: $114,000 ($10.10)Libraries: $29,000 ($2.57)Electric Utilities - Interest on Debt: $2,561,000 ($226.80)
Gas Utilities - Interest on Debt: $73,000 ($6.46)
General - Interest on Debt: $1,197,000 ($106.00)
Intergovernmental to Local - Other - Electric Utilities: $4,025,000 ($356.45)
Other - Elementary and Secondary Education: $930,000 ($82.36)Other - Gas Utilities: $178,000 ($15.76)Other - Water Utilities: $4,000 ($0.35)Other Capital Outlay - Electric Utilities: $9,718,000 ($860.61)
Elementary and Secondary Education: $1,120,000 ($99.19)Water Utilities: $920,000 ($81.47)Sewerage: $761,000 ($67.39)Regular Highways: $484,000 ($42.86)Gas Utilities: $360,000 ($31.88)Local Fire Protection: $112,000 ($9.92)Parks and Recreation: $108,000 ($9.56)Police Protection: $11,000 ($0.97)Total Salaries and Wages: $27,742,000 ($2456.78)
Water Utilities - Interest on Debt: $371,000 ($32.86)
Lenoir City government finances - Revenue in 2021 (per resident):
Charges - Sewerage: $8,083,000 ($715.82)
Elementary and Secondary Education - Other: $800,000 ($70.85)Other: $541,000 ($47.91)Parks and Recreation: $479,000 ($42.42)Solid Waste Management: $425,000 ($37.64)Elementary and Secondary Education School Lunch: $45,000 ($3.99)Elementary and Secondary Education School Tuition and Transportation: $19,000 ($1.68)Federal Intergovernmental - Other: $1,961,000 ($173.66)
General Local Government Support: $108,000 ($9.56)Water Utilities: $34,000 ($3.01)Local Intergovernmental - Education: $9,348,000 ($827.84)
Electric Utilities: $60,000 ($5.31)Sewerage: $35,000 ($3.10)General Local Government Support: $24,000 ($2.13)Other: $4,000 ($0.35)Miscellaneous - Donations From Private Sources: $256,000 ($22.67)
General Revenue - Other: $234,000 ($20.72)Fines and Forfeits: $219,000 ($19.39)Interest Earnings: $215,000 ($19.04)Sale of Property: $25,000 ($2.21)Rents: $23,000 ($2.04)Revenue - Electric Utilities: $344,991,000 ($30551.81)
Water Utilities: $9,338,000 ($826.96)Gas Utilities: $8,922,000 ($790.12)State Intergovernmental - Education: $17,126,000 ($1516.65)
General Local Government Support: $1,389,000 ($123.01)Other: $64,000 ($5.67)Highways: $19,000 ($1.68)Tax - Public Utilities Sales: $4,357,000 ($385.85)
Property: $3,794,000 ($335.99)General Sales and Gross Receipts: $1,114,000 ($98.65)Alcoholic Beverage Sales: $719,000 ($63.67)Occupation and Business License - Other: $507,000 ($44.90)Other Selective Sales: $490,000 ($43.39)Alcoholic Beverage License: $10,000 ($0.89)
Lenoir City government finances - Debt in 2021 (per resident):
Long Term Debt - Beginning Outstanding - Unspecified Public Purpose: $173,550,000 ($15369.29)
Outstanding Unspecified Public Purpose: $164,220,000 ($14543.04)Retired Unspecified Public Purpose: $9,330,000 ($826.25)
Lenoir City government finances - Cash and Securities in 2021 (per resident):
Other Funds - Cash and Securities: $64,048,000 ($5671.98)
Sinking Funds - Cash and Securities: $68,000 ($6.02)
Businesses in Lenoir City, TN
Name Count Name Count
Ace Hardware 1 Home Depot 1 Advance Auto Parts 1 KFC 1 Arby's 1 Lane Furniture 1 AutoZone 1 Little Caesars Pizza 1 Baskin-Robbins 1 McDonald's 1 Blockbuster 1 Penske 1 Burger King 1 Quiznos 1 CVS 1 RadioShack 1 Circle K 1 Ramada 1 Comfort Inn 1 Ruby Tuesday 1 Cracker Barrel 1 SONIC Drive-In 1 Cricket Wireless 1 Sprint Nextel 1 Curves 1 Subway 2 Days Inn 1 T-Mobile 2 Domino's Pizza 1 Taco Bell 1 Econo Lodge 1 True Value 1 FedEx 2 U-Haul 1 Ford 1 U.S. Cellular 1 GameStop 1 UPS 1 Goodwill 1 Waffle House 1 H&R Block 1 Walgreens 1 Hilton 1 Walmart 1 Holiday Inn 1 Wendy's 1
Strongest AM radio stations in Lenoir City:
WBLC (1360 AM; 1 kW; LENOIR CITY, TN; Owner: THREE ANGELS BROADCASTING NETWORK, INC.)
WLIL (730 AM; 1 kW; LENOIR CITY, TN; Owner: BP BROADCASTERS, LLC)
WKVL (850 AM; daytime; 50 kW; KNOXVILLE, TN; Owner: HORNE RADIO, LLC)
WMTY (670 AM; daytime; 2 kW; FARRAGUT, TN; Owner: HORNE RADIO, LLC)
WQBB (1040 AM; daytime; 10 kW; POWELL, TN; Owner: JOURNAL BROADCAST CORPORATION)
WLOD (1140 AM; daytime; 1 kW; LOUDON, TN; Owner: HORNE RADIO, LLC)
WNOX (990 AM; 10 kW; KNOXVILLE, TN)
WATO (1290 AM; 5 kW; OAK RIDGE, TN)
WVLZ (1180 AM; daytime; 10 kW; KNOXVILLE, TN; Owner: KIRKLAND WIRELESS BROADCASTERS, INC.)
WRJZ (620 AM; 5 kW; KNOXVILLE, TN; Owner: TENNESSEE MEDIA ASSOCIATES, INC)
WFLI (1070 AM; 50 kW; LOOKOUT MOUNTAIN, TN; Owner: WFLI, INC.)
WWAM (820 AM; daytime; 50 kW; JASPER, TN; Owner: SHELTON BROADCASTING SYSTEM)
WECO (940 AM; 5 kW; WARTBURG, TN; Owner: MORGAN COUNTY B/CASTING CO.)
Strongest FM radio stations in Lenoir City:
WKVL-FM (105.3 FM; LOUDON, TN; Owner: HORNE RADIO, LLC)
WKZX-FM (93.5 FM; LENOIR CITY, TN; Owner: BP BROADCASTERS, LLC)
WNOX-FM (99.1 FM; LOUDON, TN; Owner: CITADEL BROADCASTING COMPANY)
WOKI-FM (100.3 FM; OAK RIDGE, TN; Owner: OAK RIDGE FM, INC.)
WNFZ (94.3 FM; OAK RIDGE, TN; Owner: JOHN W. PIRKLE)
WUOT (91.9 FM; KNOXVILLE, TN; Owner: UNIVERSITY OF TENNESSEE)
WDVX (89.9 FM; CLINTON, TN; Owner: CUMBERLAND COMMUNITIES COMMUNI CORP.)
WIVK-FM (107.7 FM; KNOXVILLE, TN; Owner: CITADEL BROADCASTING COMPANY)
WJXB-FM (97.5 FM; KNOXVILLE, TN; Owner: SOUTH CENTRAL COMMUNICATIONS CORP.)
WWST (102.1 FM; SEVIERVILLE, TN; Owner: JOURNAL BROADCAST CORPORATION)
WWSR (105.7 FM; ROCKWOOD, TN; Owner: SOUTHERN MEDIA GROUP, INC.)
WYLV (89.1 FM; ALCOA, TN; Owner: FOOTHILLS BROADCASTING, INC.)
WKTS (90.1 FM; KINGSTON, TN; Owner: THE KINGSTON CENTURY CLUB INC.)
WLOD-FM (98.3 FM; SWEETWATER, TN; Owner: HORNE RADIO, LLC)
WMYU (93.1 FM; KARNS, TN; Owner: JOURNAL BROADCAST CORPORATION)
WIMZ-FM (103.5 FM; KNOXVILLE, TN; Owner: SOUTH CENTRAL COMM., CORP.)
WBZH (92.7 FM; HARRIMAN, TN; Owner: SOUTHERN MEDIA GROUP, INC.)
WCVP-FM (95.9 FM; ROBBINSVILLE, NC; Owner: CHEROKEE BROADCASTING COMPANY, INC.)
WYIL-FM (98.7 FM; OLIVER SPRINGS, TN; Owner: CITADEL BROADCASTING COMPANY)
WTXM-FM (95.7 FM; MARYVILLE, TN; Owner: SOUTH CENTRAL COMMUNICATIONS CORP.)
TV broadcast stations around Lenoir City:
WDTT-LP (Channel 38; LENOIR CITY, TN; Owner: WORD OF GOD FELLOWSHIP, INC.)
W46DC (Channel 46; KNOXVILLE, TN; Owner: TRINITY BROADCASTING NETWORK)
WVLT-TV (Channel 8; KNOXVILLE, TN; Owner: WVLT LICENSEE CORP.)
WKOP-TV (Channel 15; KNOXVILLE, TN; Owner: EAST TENNESSEE PUBLIC COMMUNICATIONS CORP.)
WBIR-TV (Channel 10; KNOXVILLE, TN; Owner: GANNETT PACIFIC CORPORATION)
WATE-TV (Channel 6; KNOXVILLE, TN; Owner: WATE, G.P.)
WTNZ (Channel 43; KNOXVILLE, TN; Owner: RAYCOM AMERICA, INC.)
WEEE-LP (Channel 32; KNOXVILLE, TN; Owner: TIGER EYE BROADCASTING CORPORATION)
W50AB (Channel 50; HIAWASSEE, GA; Owner: GEORGIA PUBLIC TELECOMMUNICATIONS COMMISSION)
WEZK-LP (Channel 28; KNOXVILLE, TN; Owner: SOUTH CENTRAL COMMUNICATIONS CORP.)
W50CG (Channel 50; KNOXVILLE, TN; Owner: THREE ANGELS BROADCASTING NETWORK, INC.)
W56CM (Channel 56; KNOXVILLE, TN; Owner: VENTANA TELEVISION, INC.)
WFEM-LP (Channel 12; HEISKELL, ETC., TN; Owner: H. EARL MARLAR)
National Bridge Inventory (NBI) Statistics 61 Number of bridges751ft / 229m Total length $24,318,000 Total costs1,033,922 Total average daily traffic218,926 Total average daily truck traffic
New bridges - historical statistics
1 1910-1919 1 1920-1929 2 1930-1939 2 1940-1949 8 1950-1959 18 1960-1969 15 1970-1979 6 1980-1989 3 2000-2009 5 2010-2019
See full National Bridge Inventory statistics for Lenoir City, TN
Home Mortgage Disclosure Act Aggregated Statistics For Year 2009(Based on 1 partial tract) A) FHA, FSA/RHS & VA B) Conventional C) Refinancings D) Home Improvement Loans E) Loans on Dwellings For 5+ Families F) Non-occupant Loans on G) Loans On Manufactured Number Average Value Number Average Value Number Average Value Number Average Value Number Average Value Number Average Value Number Average Value
LOANS ORIGINATED 16 $123,229 13 $141,038 54 $131,822 4 $45,362 1 $113,670 6 $110,797 2 $50,705 APPLICATIONS APPROVED, NOT ACCEPTED 0 $0 1 $142,600 3 $136,000 1 $32,330 0 $0 0 $0 1 $20,070 APPLICATIONS DENIED 4 $109,885 3 $92,810 17 $111,181 4 $38,715 0 $0 2 $74,040 2 $55,400 APPLICATIONS WITHDRAWN 2 $89,940 2 $116,795 13 $148,278 1 $40,410 0 $0 1 $80,820 0 $0 FILES CLOSED FOR INCOMPLETENESS 1 $66,220 1 $23,720 3 $141,300 0 $0 0 $0 0 $0 0 $0
Aggregated Statistics For Year 2008(Based on 1 partial tract) A) FHA, FSA/RHS & VA B) Conventional C) Refinancings D) Home Improvement Loans F) Non-occupant Loans on G) Loans On Manufactured Number Average Value Number Average Value Number Average Value Number Average Value Number Average Value Number Average Value
LOANS ORIGINATED 11 $127,980 25 $120,318 43 $113,974 8 $64,654 11 $113,263 4 $58,268 APPLICATIONS APPROVED, NOT ACCEPTED 1 $154,070 3 $100,023 8 $109,624 1 $25,290 1 $149,900 1 $76,650 APPLICATIONS DENIED 3 $95,330 8 $91,310 29 $119,715 10 $82,042 2 $134,780 5 $68,252 APPLICATIONS WITHDRAWN 2 $80,555 2 $151,990 13 $122,008 1 $92,810 1 $43,540 1 $86,030 FILES CLOSED FOR INCOMPLETENESS 0 $0 0 $0 3 $116,793 0 $0 0 $0 0 $0
Aggregated Statistics For Year 2007(Based on 1 partial tract) A) FHA, FSA/RHS & VA B) Conventional C) Refinancings D) Home Improvement Loans F) Non-occupant Loans on G) Loans On Manufactured Number Average Value Number Average Value Number Average Value Number Average Value Number Average Value Number Average Value
LOANS ORIGINATED 5 $126,074 43 $111,628 39 $100,523 12 $44,276 15 $75,829 5 $44,580 APPLICATIONS APPROVED, NOT ACCEPTED 1 $84,990 7 $115,863 6 $145,383 2 $43,145 1 $301,110 0 $0 APPLICATIONS DENIED 1 $107,150 15 $92,792 38 $102,695 15 $68,060 4 $74,560 5 $72,318 APPLICATIONS WITHDRAWN 0 $0 2 $65,305 15 $104,853 2 $126,700 2 $62,175 0 $0 FILES CLOSED FOR INCOMPLETENESS 0 $0 2 $135,305 6 $103,368 0 $0 1 $59,700 0 $0
Aggregated Statistics For Year 2006(Based on 1 partial tract) A) FHA, FSA/RHS & VA B) Conventional C) Refinancings D) Home Improvement Loans E) Loans on Dwellings For 5+ Families F) Non-occupant Loans on G) Loans On Manufactured Number Average Value Number Average Value Number Average Value Number Average Value Number Average Value Number Average Value Number Average Value
LOANS ORIGINATED 5 $104,384 54 $91,559 41 $87,487 7 $22,346 1 $288,330 16 $79,448 4 $49,925 APPLICATIONS APPROVED, NOT ACCEPTED 1 $161,110 6 $101,282 9 $86,900 2 $48,360 0 $0 2 $64,130 2 $57,745 APPLICATIONS DENIED 1 $78,210 17 $69,331 37 $92,732 11 $54,415 0 $0 8 $74,495 8 $55,236 APPLICATIONS WITHDRAWN 0 $0 4 $119,728 27 $100,833 3 $71,780 0 $0 1 $19,550 1 $11,210 FILES CLOSED FOR INCOMPLETENESS 0 $0 3 $69,087 8 $107,604 0 $0 0 $0 1 $57,090 0 $0
Aggregated Statistics For Year 2005(Based on 1 partial tract) A) FHA, FSA/RHS & VA B) Conventional C) Refinancings D) Home Improvement Loans F) Non-occupant Loans on G) Loans On Manufactured Number Average Value Number Average Value Number Average Value Number Average Value Number Average Value Number Average Value
LOANS ORIGINATED 5 $109,964 52 $84,752 52 $90,789 10 $24,714 15 $76,785 5 $48,646 APPLICATIONS APPROVED, NOT ACCEPTED 0 $0 7 $71,693 7 $99,214 1 $28,420 1 $46,670 3 $46,317 APPLICATIONS DENIED 2 $96,720 15 $61,403 40 $90,534 13 $32,367 4 $72,018 11 $51,903 APPLICATIONS WITHDRAWN 1 $72,210 6 $103,150 33 $96,491 4 $147,425 1 $157,460 3 $57,613 FILES CLOSED FOR INCOMPLETENESS 0 $0 3 $85,163 6 $95,633 1 $9,650 0 $0 0 $0
Aggregated Statistics For Year 2004(Based on 1 partial tract) A) FHA, FSA/RHS & VA B) Conventional C) Refinancings D) Home Improvement Loans E) Loans on Dwellings For 5+ Families F) Non-occupant Loans on G) Loans On Manufactured Number Average Value Number Average Value Number Average Value Number Average Value Number Average Value Number Average Value Number Average Value
LOANS ORIGINATED 7 $97,091 45 $83,847 56 $78,415 11 $29,104 1 $449,710 10 $59,570 5 $58,762 APPLICATIONS APPROVED, NOT ACCEPTED 0 $0 6 $71,910 11 $88,235 2 $22,680 0 $0 1 $44,320 3 $45,100 APPLICATIONS DENIED 1 $121,230 19 $61,278 34 $76,676 8 $27,080 0 $0 2 $53,315 13 $48,751 APPLICATIONS WITHDRAWN 1 $48,230 5 $110,902 29 $87,370 2 $48,750 0 $0 1 $58,400 3 $74,560 FILES CLOSED FOR INCOMPLETENESS 0 $0 2 $136,735 2 $96,200 1 $8,340 0 $0 1 $34,150 0 $0
Aggregated Statistics For Year 2003(Based on 1 partial tract) A) FHA, FSA/RHS & VA B) Conventional C) Refinancings D) Home Improvement Loans F) Non-occupant Loans on Number Average Value Number Average Value Number Average Value Number Average Value Number Average Value
LOANS ORIGINATED 6 $90,723 39 $88,952 83 $79,542 7 $11,620 13 $65,937 APPLICATIONS APPROVED, NOT ACCEPTED 1 $34,410 3 $74,733 12 $97,307 1 $6,780 1 $45,880 APPLICATIONS DENIED 0 $0 9 $65,320 46 $80,420 3 $23,810 2 $40,540 APPLICATIONS WITHDRAWN 0 $0 3 $123,223 19 $93,852 1 $5,740 1 $23,980 FILES CLOSED FOR INCOMPLETENESS 0 $0 0 $0 3 $83,860 0 $0 0 $0
Aggregated Statistics For Year 2002(Based on 1 partial tract) A) FHA, FSA/RHS & VA B) Conventional C) Refinancings D) Home Improvement Loans F) Non-occupant Loans on Number Average Value Number Average Value Number Average Value Number Average Value Number Average Value
LOANS ORIGINATED 9 $97,531 33 $74,845 54 $80,262 15 $14,217 14 $49,328 APPLICATIONS APPROVED, NOT ACCEPTED 0 $0 4 $48,165 13 $64,493 0 $0 0 $0 APPLICATIONS DENIED 2 $77,560 11 $70,318 34 $81,131 5 $8,446 2 $41,450 APPLICATIONS WITHDRAWN 1 $54,230 2 $47,970 12 $96,980 0 $0 1 $74,300 FILES CLOSED FOR INCOMPLETENESS 0 $0 1 $62,050 3 $119,227 0 $0 1 $21,900
Aggregated Statistics For Year 2001(Based on 1 partial tract) A) FHA, FSA/RHS & VA B) Conventional C) Refinancings D) Home Improvement Loans E) Loans on Dwellings For 5+ Families F) Non-occupant Loans on Number Average Value Number Average Value Number Average Value Number Average Value Number Average Value Number Average Value
LOANS ORIGINATED 11 $84,798 31 $67,185 57 $71,624 9 $16,250 1 $41,710 10 $54,460 APPLICATIONS APPROVED, NOT ACCEPTED 1 $53,180 5 $34,778 8 $91,050 0 $0 0 $0 0 $0 APPLICATIONS DENIED 1 $43,020 15 $51,914 37 $68,494 4 $25,158 0 $0 2 $77,560 APPLICATIONS WITHDRAWN 1 $107,150 3 $57,790 16 $80,035 1 $41,970 0 $0 0 $0 FILES CLOSED FOR INCOMPLETENESS 0 $0 1 $21,640 3 $76,037 0 $0 0 $0 0 $0
Aggregated Statistics For Year 2000(Based on 1 partial tract) A) FHA, FSA/RHS & VA B) Conventional C) Refinancings D) Home Improvement Loans E) Loans on Dwellings For 5+ Families F) Non-occupant Loans on Number Average Value Number Average Value Number Average Value Number Average Value Number Average Value Number Average Value
LOANS ORIGINATED 10 $84,050 31 $60,928 27 $56,504 9 $24,246 1 $22,160 3 $56,920 APPLICATIONS APPROVED, NOT ACCEPTED 2 $49,795 6 $55,442 7 $62,270 1 $34,150 0 $0 1 $23,200 APPLICATIONS DENIED 3 $47,970 36 $41,690 23 $60,471 4 $12,512 0 $0 2 $45,100 APPLICATIONS WITHDRAWN 1 $90,200 2 $55,400 12 $61,286 0 $0 0 $0 0 $0 FILES CLOSED FOR INCOMPLETENESS 0 $0 0 $0 3 $92,723 0 $0 0 $0 0 $0
Aggregated Statistics For Year 1999(Based on 1 partial tract) A) FHA, FSA/RHS & VA B) Conventional C) Refinancings D) Home Improvement Loans F) Non-occupant Loans on Number Average Value Number Average Value Number Average Value Number Average Value Number Average Value
LOANS ORIGINATED 13 $69,979 39 $65,019 40 $66,209 12 $18,296 11 $47,339 APPLICATIONS APPROVED, NOT ACCEPTED 0 $0 10 $36,885 11 $58,305 3 $9,817 0 $0 APPLICATIONS DENIED 2 $59,795 31 $36,954 17 $51,888 8 $18,501 1 $17,050 APPLICATIONS WITHDRAWN 1 $65,350 4 $61,345 12 $91,955 1 $39,000 1 $146,460 FILES CLOSED FOR INCOMPLETENESS 0 $0 3 $46,667 4 $62,058 0 $0 0 $0
Detailed HMDA statistics for the following Tracts:
0602.00
Private Mortgage Insurance Companies Aggregated Statistics For Year 2009(Based on 1 partial tract) A) Conventional B) Refinancings Number Average Value Number Average Value
LOANS ORIGINATED 4 $145,862 2 $113,795 APPLICATIONS APPROVED, NOT ACCEPTED 1 $92,290 1 $67,260 APPLICATIONS DENIED 0 $0 1 $221,070 APPLICATIONS WITHDRAWN 0 $0 0 $0 FILES CLOSED FOR INCOMPLETENESS 0 $0 0 $0
Aggregated Statistics For Year 2008(Based on 1 partial tract) A) Conventional B) Refinancings C) Non-occupant Loans on Number Average Value Number Average Value Number Average Value
LOANS ORIGINATED 12 $116,620 3 $132,783 2 $74,040 APPLICATIONS APPROVED, NOT ACCEPTED 2 $165,415 2 $122,400 0 $0 APPLICATIONS DENIED 1 $53,180 0 $0 0 $0 APPLICATIONS WITHDRAWN 1 $123,310 0 $0 0 $0 FILES CLOSED FOR INCOMPLETENESS 0 $0 1 $107,930 1 $89,680
Aggregated Statistics For Year 2007(Based on 1 partial tract) A) Conventional B) Refinancings C) Non-occupant Loans on Number Average Value Number Average Value Number Average Value
LOANS ORIGINATED 17 $120,873 4 $138,562 2 $108,060 APPLICATIONS APPROVED, NOT ACCEPTED 3 $148,250 1 $97,760 1 $61,260 APPLICATIONS DENIED 1 $42,750 0 $0 0 $0 APPLICATIONS WITHDRAWN 1 $45,880 0 $0 0 $0 FILES CLOSED FOR INCOMPLETENESS 0 $0 0 $0 0 $0
Aggregated Statistics For Year 2006(Based on 1 partial tract) A) Conventional B) Refinancings C) Non-occupant Loans on Number Average Value Number Average Value Number Average Value
LOANS ORIGINATED 9 $98,487 2 $115,490 1 $80,030 APPLICATIONS APPROVED, NOT ACCEPTED 2 $87,855 1 $49,010 0 $0 APPLICATIONS DENIED 0 $0 0 $0 0 $0 APPLICATIONS WITHDRAWN 0 $0 0 $0 0 $0 FILES CLOSED FOR INCOMPLETENESS 0 $0 0 $0 0 $0
Aggregated Statistics For Year 2005(Based on 1 partial tract) A) Conventional B) Refinancings Number Average Value Number Average Value
LOANS ORIGINATED 8 $130,904 5 $100,630 APPLICATIONS APPROVED, NOT ACCEPTED 1 $126,440 0 $0 APPLICATIONS DENIED 0 $0 0 $0 APPLICATIONS WITHDRAWN 1 $58,920 0 $0 FILES CLOSED FOR INCOMPLETENESS 0 $0 0 $0
Aggregated Statistics For Year 2004(Based on 1 partial tract) A) Conventional B) Refinancings C) Non-occupant Loans on D) Loans On Manufactured Number Average Value Number Average Value Number Average Value Number Average Value
LOANS ORIGINATED 7 $96,347 5 $91,818 1 $62,570 1 $33,370 APPLICATIONS APPROVED, NOT ACCEPTED 0 $0 2 $94,115 1 $30,760 0 $0 APPLICATIONS DENIED 1 $28,940 0 $0 1 $28,940 0 $0 APPLICATIONS WITHDRAWN 1 $59,180 0 $0 0 $0 0 $0 FILES CLOSED FOR INCOMPLETENESS 0 $0 0 $0 0 $0 0 $0
Aggregated Statistics For Year 2003(Based on 1 partial tract) A) Conventional B) Refinancings C) Non-occupant Loans on Number Average Value Number Average Value Number Average Value
LOANS ORIGINATED 13 $95,256 11 $100,915 3 $53,183 APPLICATIONS APPROVED, NOT ACCEPTED 1 $107,150 2 $112,620 1 $41,190 APPLICATIONS DENIED 0 $0 1 $64,650 0 $0 APPLICATIONS WITHDRAWN 0 $0 1 $33,370 0 $0 FILES CLOSED FOR INCOMPLETENESS 0 $0 0 $0 0 $0
Aggregated Statistics For Year 2002(Based on 1 partial tract) A) Conventional B) Refinancings C) Non-occupant Loans on Number Average Value Number Average Value Number Average Value
LOANS ORIGINATED 8 $73,485 7 $97,017 1 $48,750 APPLICATIONS APPROVED, NOT ACCEPTED 1 $50,050 2 $75,735 0 $0 APPLICATIONS DENIED 0 $0 0 $0 0 $0 APPLICATIONS WITHDRAWN 0 $0 0 $0 0 $0 FILES CLOSED FOR INCOMPLETENESS 0 $0 0 $0 0 $0
Aggregated Statistics For Year 2001(Based on 1 partial tract) A) Conventional B) Refinancings C) Non-occupant Loans on Number Average Value Number Average Value Number Average Value
LOANS ORIGINATED 7 $83,684 8 $83,652 1 $82,380 APPLICATIONS APPROVED, NOT ACCEPTED 1 $73,260 1 $84,210 0 $0 APPLICATIONS DENIED 0 $0 1 $76,120 0 $0 APPLICATIONS WITHDRAWN 0 $0 0 $0 0 $0 FILES CLOSED FOR INCOMPLETENESS 0 $0 0 $0 0 $0
Aggregated Statistics For Year 2000(Based on 1 partial tract) A) Conventional B) Refinancings Number Average Value Number Average Value
LOANS ORIGINATED 5 $89,732 2 $78,730 APPLICATIONS APPROVED, NOT ACCEPTED 0 $0 0 $0 APPLICATIONS DENIED 0 $0 1 $74,040 APPLICATIONS WITHDRAWN 0 $0 0 $0 FILES CLOSED FOR INCOMPLETENESS 0 $0 0 $0
Aggregated Statistics For Year 1999(Based on 1 partial tract) A) Conventional B) Refinancings Number Average Value Number Average Value
LOANS ORIGINATED 5 $75,630 4 $70,515 APPLICATIONS APPROVED, NOT ACCEPTED 0 $0 0 $0 APPLICATIONS DENIED 0 $0 0 $0 APPLICATIONS WITHDRAWN 0 $0 0 $0 FILES CLOSED FOR INCOMPLETENESS 0 $0 0 $0
Detailed PMIC statistics for the following Tracts:
0602.00
Fire-safe hotels and motels in Lenoir City, Tennessee:
Econo Lodge, 1211 Hwy 321 N, Lenoir City, Tennessee 37771 Phone: (865) 986-0295, Fax: (865) 986-0295
Comfort Inn, 150 Interchange Park Ln, Lenoir City, Tennessee 37772 Phone: (865) 988-8880, Fax: (865) 988-0659
Hampton Inn Knoxville/Lenoir City, 585 Ft Loudon Medical Center Dr, Lenoir City, Tennessee 37772 Phone: (865) 988-2000, Fax: (865) 988-2029
Holiday Inn Express Hotel & Suites, 1112 Hwy 321 N, Lenoir City, Tennessee 37771 Phone: (865) 635-0070, Fax: (865) 635-0080
Fairfield Inn & Suites Knoxville Lenoir City/ I-75, 370 Adesa Pkwy, Lenoir city, Tennessee 37771 Phone: (865) 412-0500
All 5 fire-safe hotels and motels in Lenoir City, Tennessee
Most common first names in Lenoir City, TN among deceased individuals Name Count Lived (average)
James 247 70.2 years Mary 173 77.8 years William 169 72.8 years John 125 75.5 years Robert 114 70.8 years Charles 93 70.0 years George 62 71.8 years Margaret 50 77.5 years Ruth 46 81.0 years Roy 46 71.2 years
Most common last names in Lenoir City, TN among deceased individuals Last name Count Lived (average)
Smith 106 75.4 years Brown 92 74.5 years Johnson 90 69.5 years Williams 81 76.3 years Jenkins 69 71.8 years Davis 39 71.9 years Harvey 36 76.9 years Lee 36 74.2 years White 34 75.4 years Rogers 33 72.7 years
Lenoir City compared to Tennessee state average:
Unemployed percentage significantly below state average. Black race population percentage significantly below state average. Hispanic race population percentage significantly above state average. Median age below state average. Foreign-born population percentage significantly above state average. Length of stay since moving in significantly above state average. Lenoir City on our top lists :
#72 on the list of "Top 101 cities with largest percentage of females in occupations: production occupations (population 5,000+)"
#96 on the list of "Top 101 cities with the most residents born in Other Eastern Africa (population 500+)"
#99 on the list of "Top 101 cities with largest percentage of males in industries: utilities (population 5,000+)"
Top Patent Applicants
Matthias J. Schmand (23)
Christian J. Michel (13)
A. Andrew Carey (11)
Wilson A. Felknor (8)
Edgar Lara-Curzio (5)
Robert B. Honea (4)
Alexander Andrew Carey (4)
Nathan A. Ottinger (4)
Matthias Schmand (3)
Timothy Hamilton (3)
Total of 147 patent applications in 2008-2024.


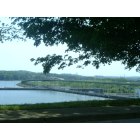


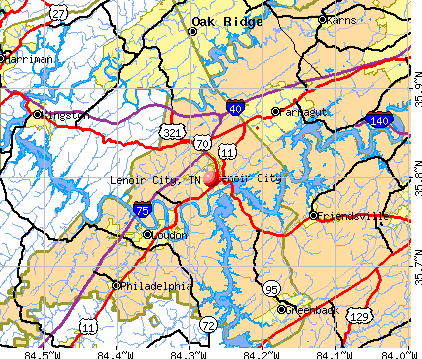


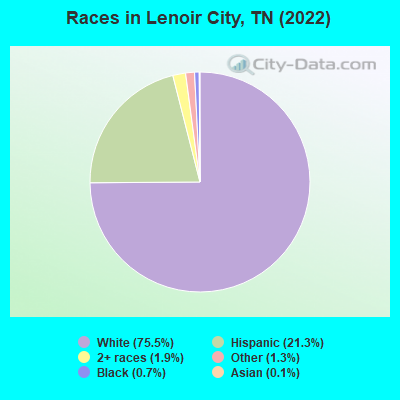
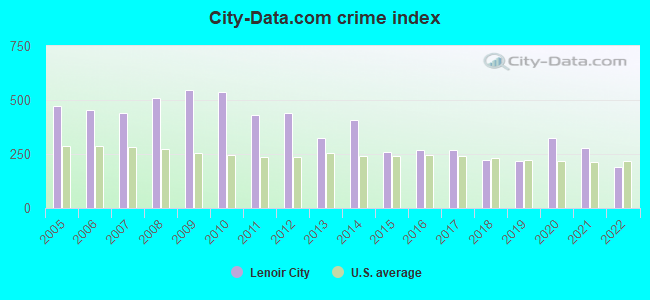
 Recent articles from our blog. Our writers, many of them Ph.D. graduates or candidates, create easy-to-read articles on a wide variety of topics.

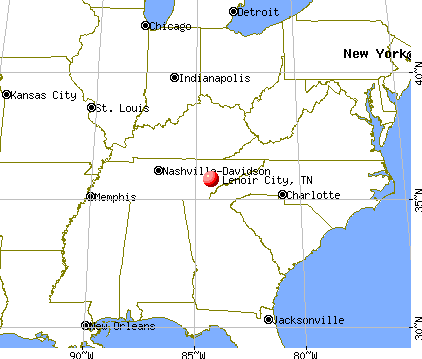
 (22.1 miles
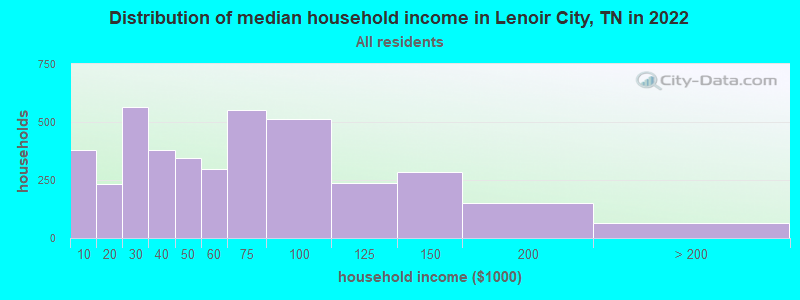
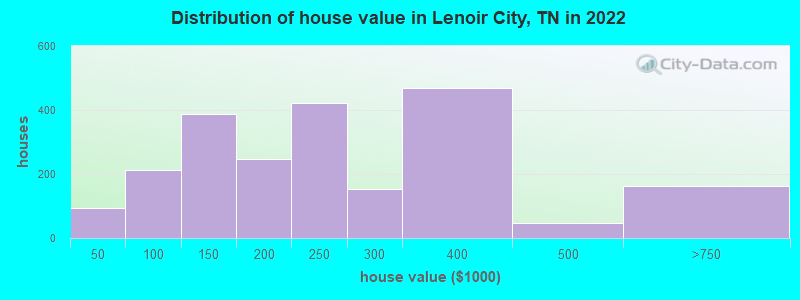

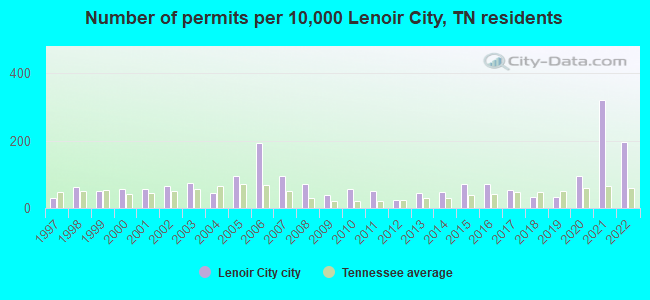
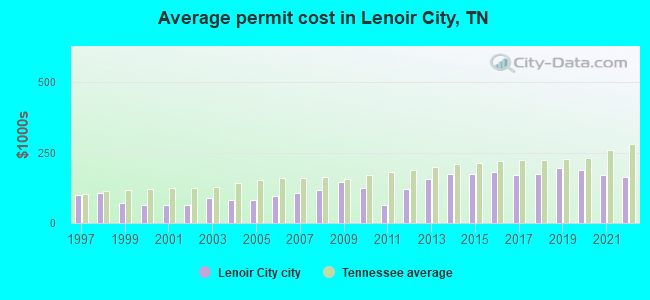
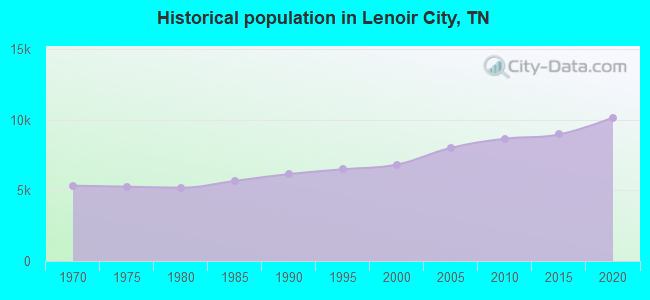
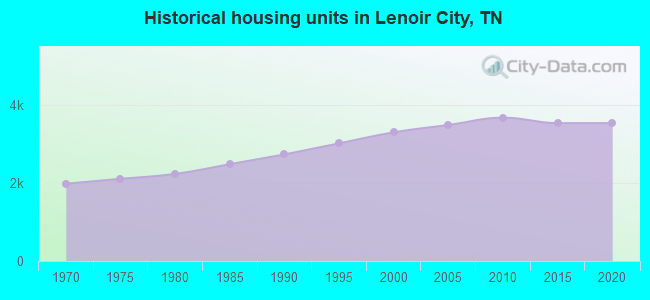
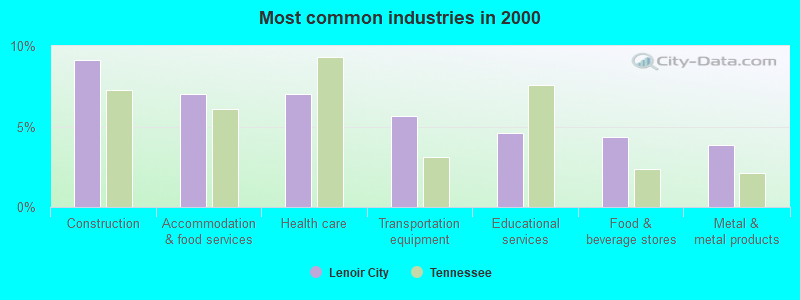
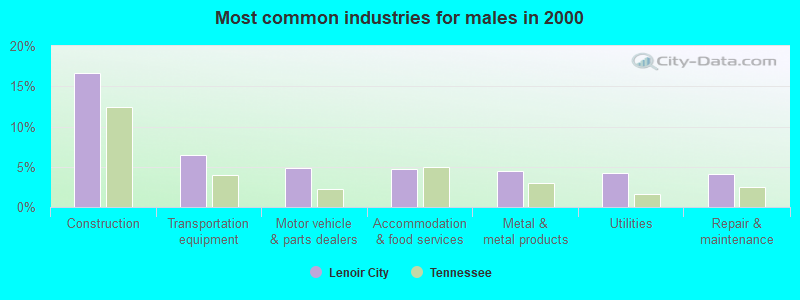
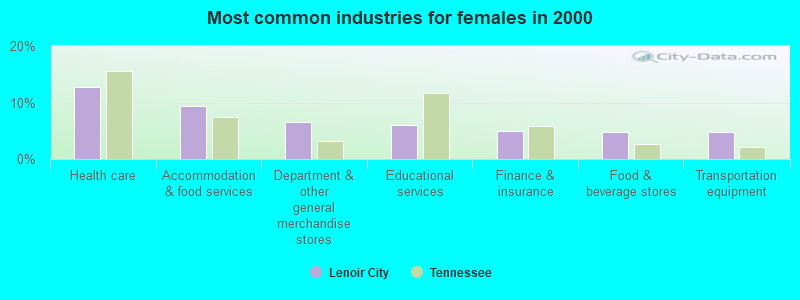
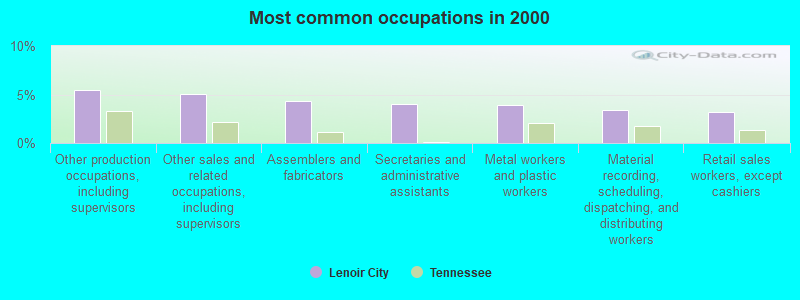
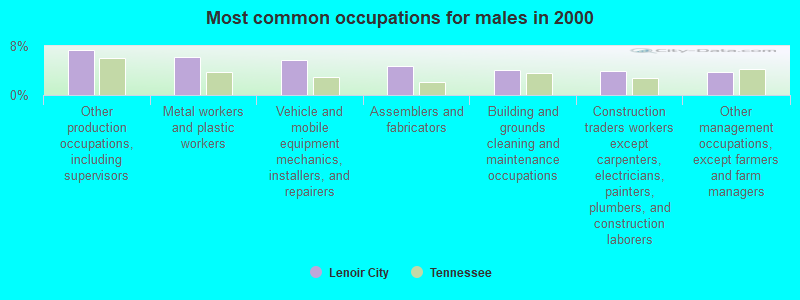
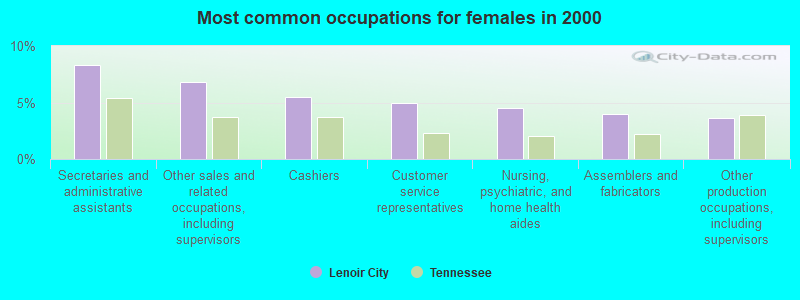
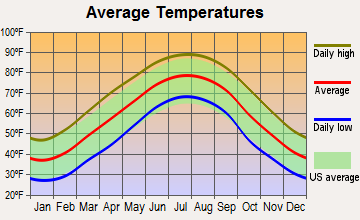
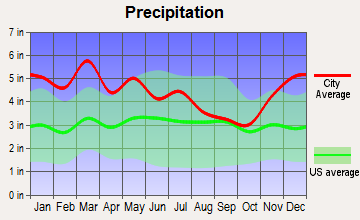
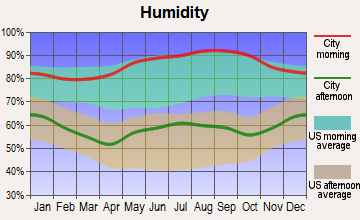
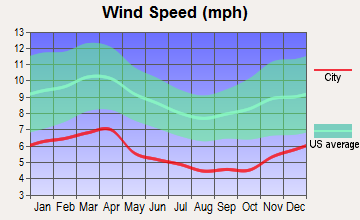
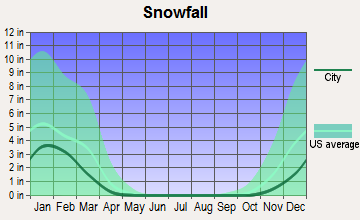
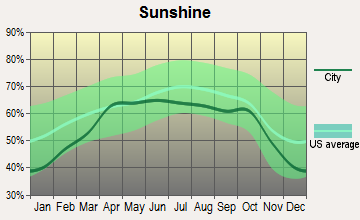
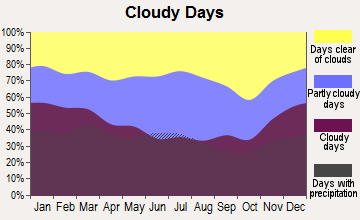
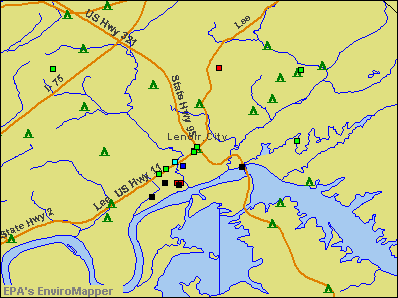

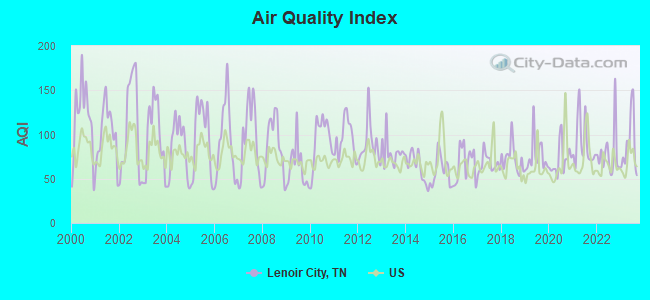
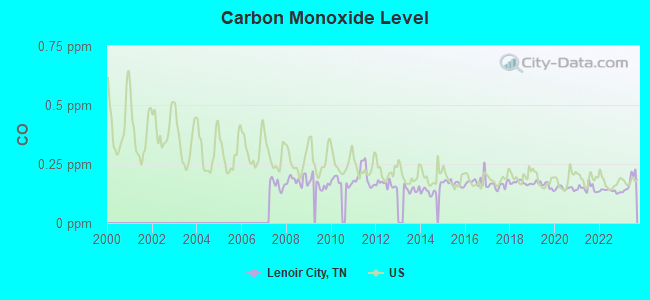
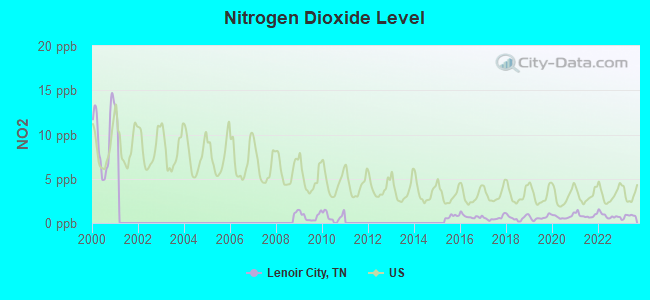
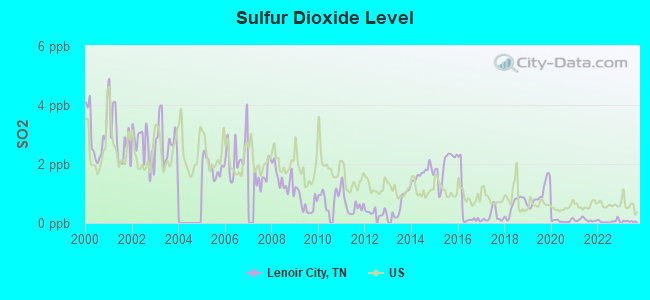
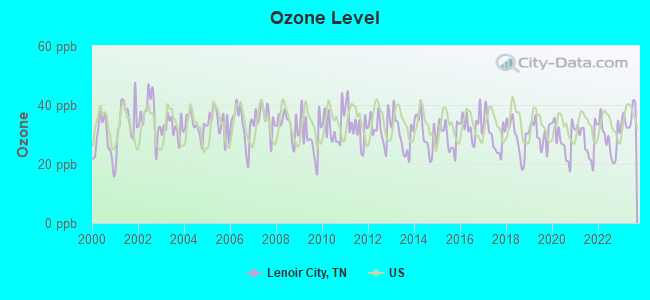
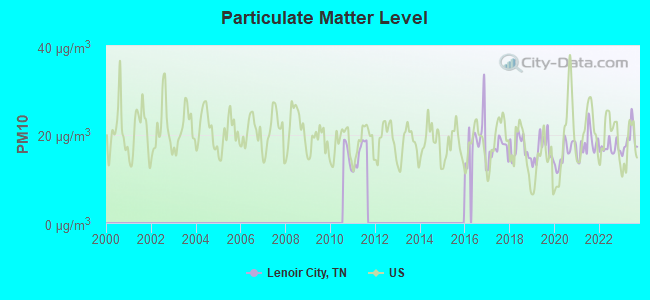
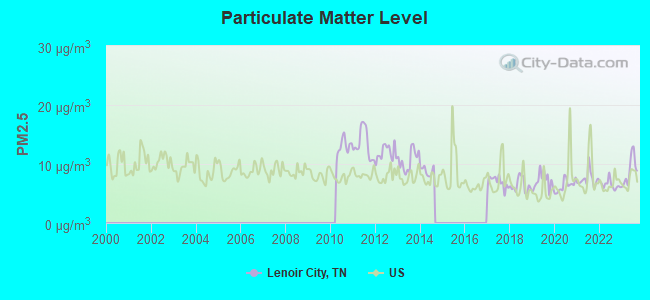
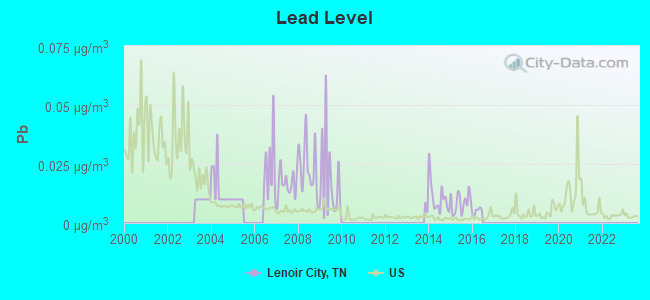

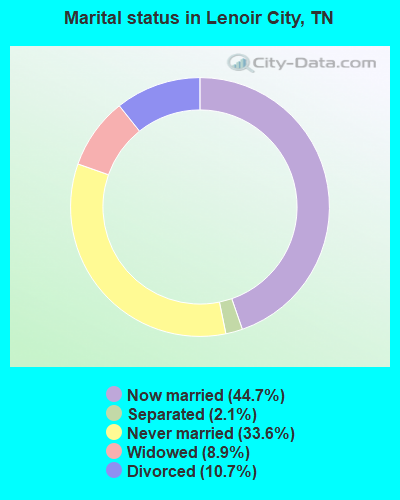
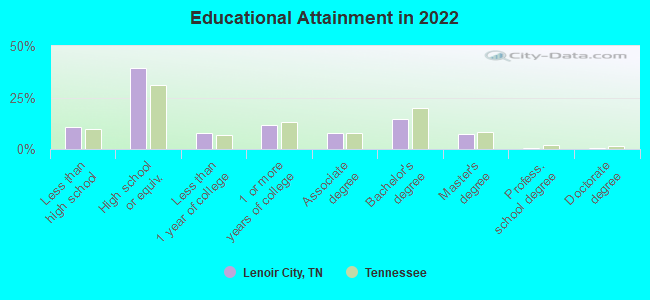
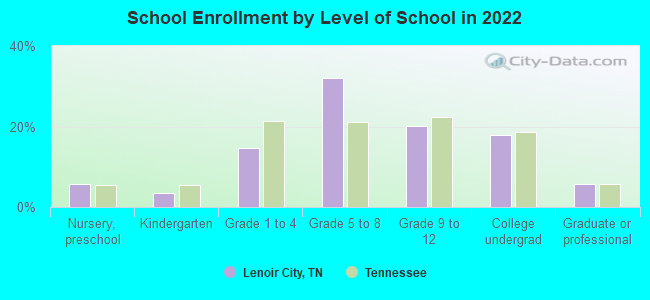
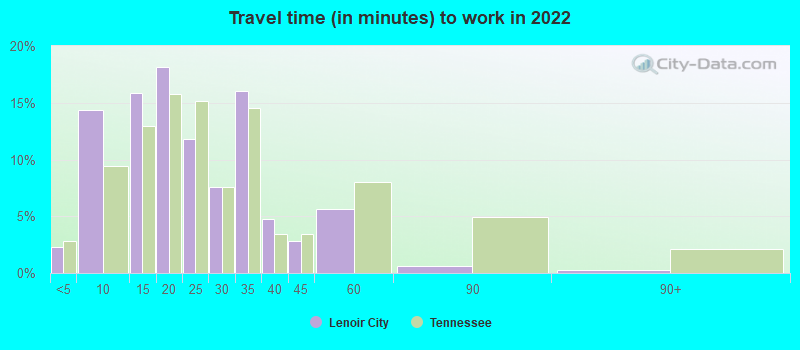
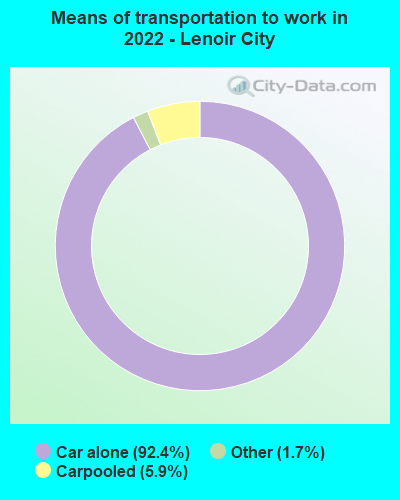
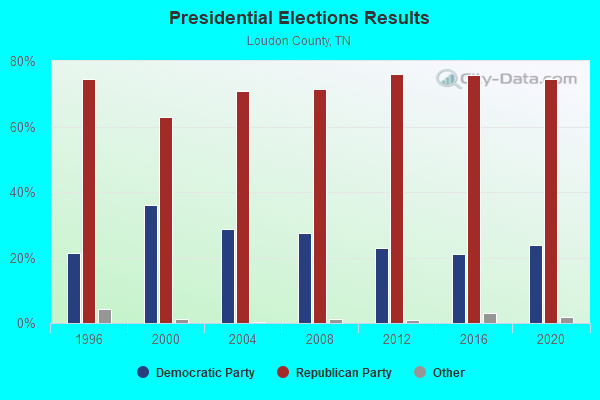
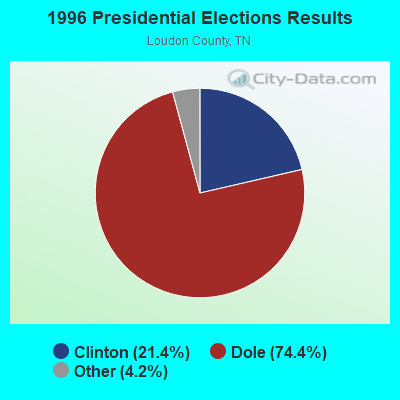
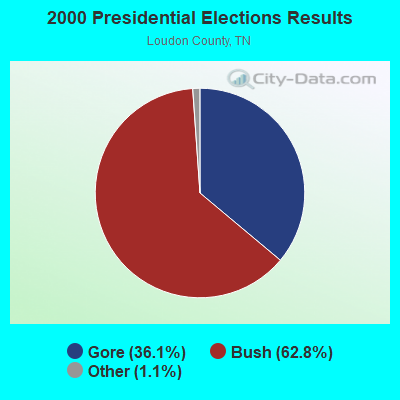

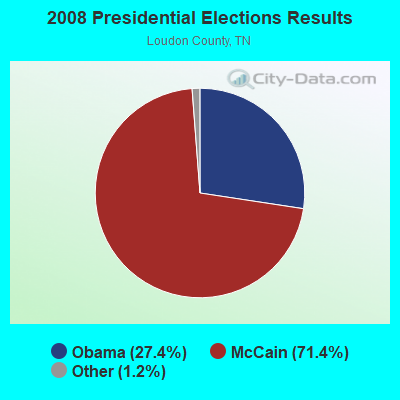
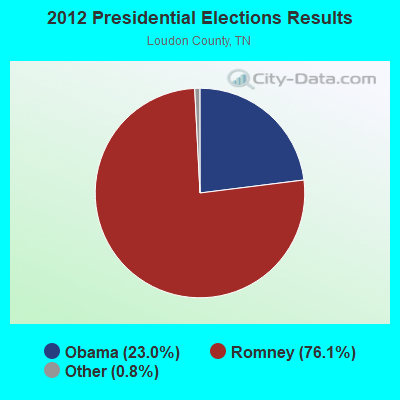

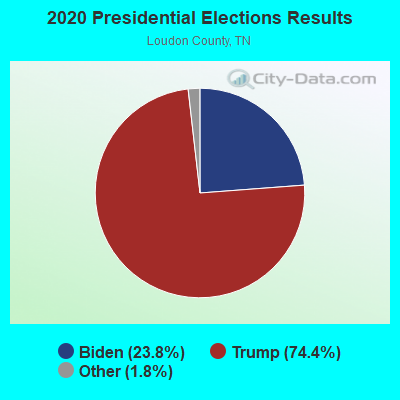
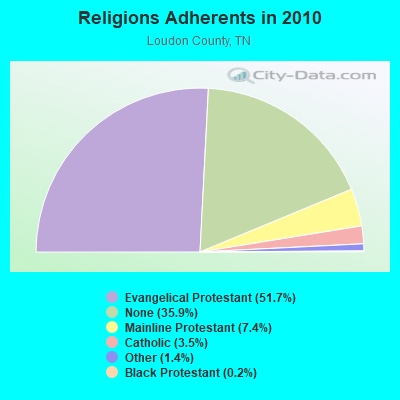
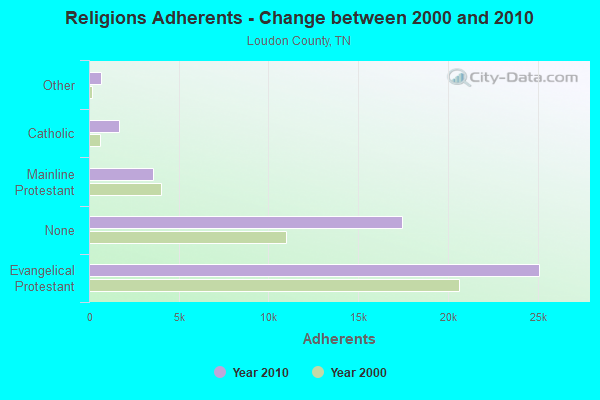
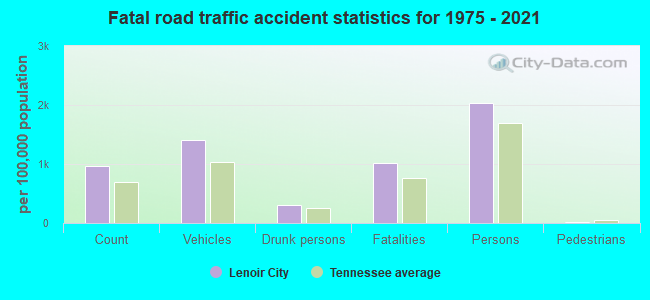
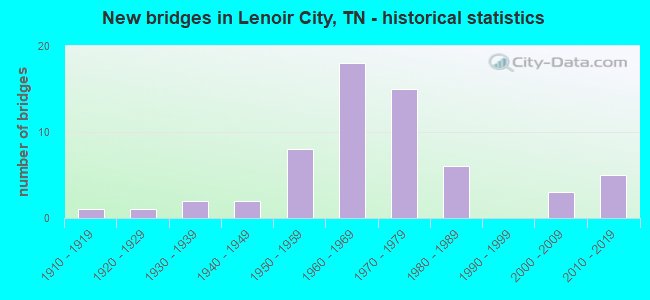
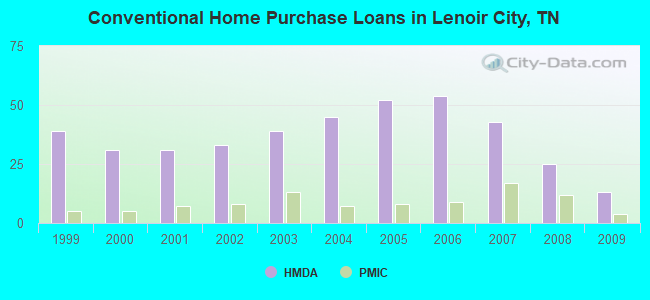
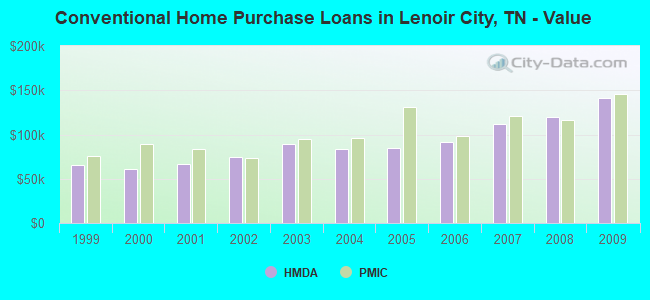
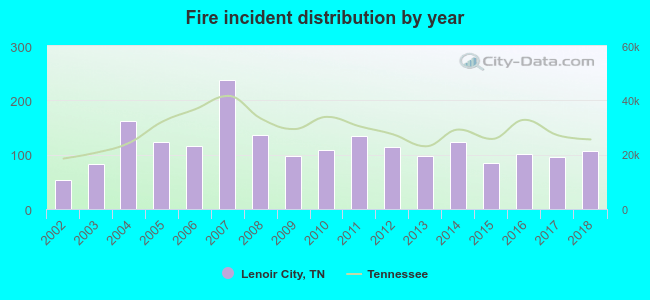 According to the data from the years 2002 - 2018 the average number of fire incidents per year is 116. The highest number of fires - 238 took place in 2007, and the least - 53 in 2002. The data has a rising trend.
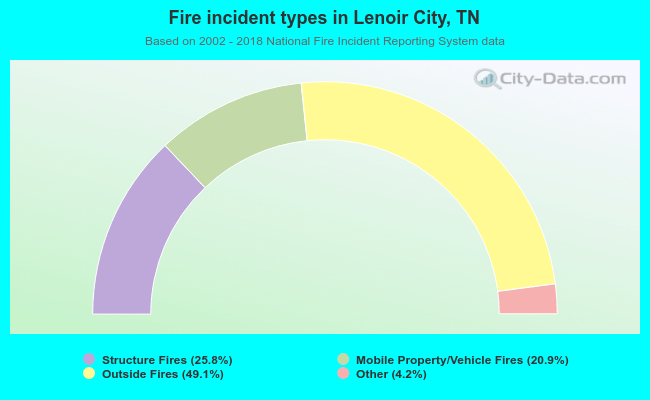 When looking into fire subcategories, the most incidents belonged to: Outside Fires (49.1%), and Structure Fires (25.8%).