Louisville, Tennessee Submit your own pictures of this city and show them to the world
OSM Map
General Map
Google Map
MSN Map
OSM Map
General Map
Google Map
MSN Map
OSM Map
General Map
Google Map
MSN Map
OSM Map
General Map
Google Map
MSN Map
Please wait while loading the map...
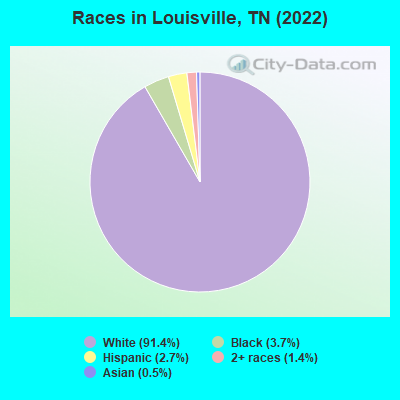
Population in 2022: 4,390 (24% urban, 76% rural). Population change since 2000: +119.4%Males: 2,211 Females: 2,179
March 2022 cost of living index in Louisville: 80.0 (low, U.S. average is 100) Percentage of residents living in poverty in 2022: 10.0%for White Non-Hispanic residents , 3.9% for Black residents , 64.2% for Hispanic or Latino residents )
Profiles of local businesses
Business Search - 14 Million verified businesses
Data:
Median household income ($)
Median household income (% change since 2000)
Household income diversity
Ratio of average income to average house value (%)
Ratio of average income to average rent
Median household income ($) - White
Median household income ($) - Black or African American
Median household income ($) - Asian
Median household income ($) - Hispanic or Latino
Median household income ($) - American Indian and Alaska Native
Median household income ($) - Multirace
Median household income ($) - Other Race
Median household income for houses/condos with a mortgage ($)
Median household income for apartments without a mortgage ($)
Races - White alone (%)
Races - White alone (% change since 2000)
Races - Black alone (%)
Races - Black alone (% change since 2000)
Races - American Indian alone (%)
Races - American Indian alone (% change since 2000)
Races - Asian alone (%)
Races - Asian alone (% change since 2000)
Races - Hispanic (%)
Races - Hispanic (% change since 2000)
Races - Native Hawaiian and Other Pacific Islander alone (%)
Races - Native Hawaiian and Other Pacific Islander alone (% change since 2000)
Races - Two or more races (%)
Races - Two or more races (% change since 2000)
Races - Other race alone (%)
Races - Other race alone (% change since 2000)
Racial diversity
Unemployment (%)
Unemployment (% change since 2000)
Unemployment (%) - White
Unemployment (%) - Black or African American
Unemployment (%) - Asian
Unemployment (%) - Hispanic or Latino
Unemployment (%) - American Indian and Alaska Native
Unemployment (%) - Multirace
Unemployment (%) - Other Race
Population density (people per square mile)
Population - Males (%)
Population - Females (%)
Population - Males (%) - White
Population - Males (%) - Black or African American
Population - Males (%) - Asian
Population - Males (%) - Hispanic or Latino
Population - Males (%) - American Indian and Alaska Native
Population - Males (%) - Multirace
Population - Males (%) - Other Race
Population - Females (%) - White
Population - Females (%) - Black or African American
Population - Females (%) - Asian
Population - Females (%) - Hispanic or Latino
Population - Females (%) - American Indian and Alaska Native
Population - Females (%) - Multirace
Population - Females (%) - Other Race
Coronavirus confirmed cases (Apr 28, 2024)
Deaths caused by coronavirus (Apr 28, 2024)
Coronavirus confirmed cases (per 100k population) (Apr 28, 2024)
Deaths caused by coronavirus (per 100k population) (Apr 28, 2024)
Daily increase in number of cases (Apr 28, 2024)
Weekly increase in number of cases (Apr 28, 2024)
Cases doubled (in days) (Apr 28, 2024)
Hospitalized patients (Apr 18, 2022)
Negative test results (Apr 18, 2022)
Total test results (Apr 18, 2022)
COVID Vaccine doses distributed (per 100k population) (Sep 19, 2023)
COVID Vaccine doses administered (per 100k population) (Sep 19, 2023)
COVID Vaccine doses distributed (Sep 19, 2023)
COVID Vaccine doses administered (Sep 19, 2023)
Likely homosexual households (%)
Likely homosexual households (% change since 2000)
Likely homosexual households - Lesbian couples (%)
Likely homosexual households - Lesbian couples (% change since 2000)
Likely homosexual households - Gay men (%)
Likely homosexual households - Gay men (% change since 2000)
Cost of living index
Median gross rent ($)
Median contract rent ($)
Median monthly housing costs ($)
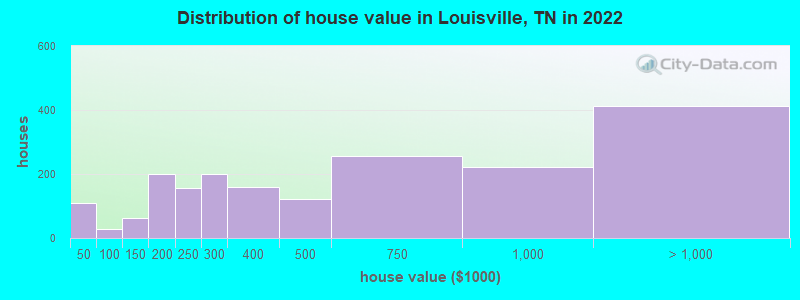
Median house or condo value ($)
Median house or condo value ($ change since 2000)
Mean house or condo value by units in structure - 1, detached ($)
Mean house or condo value by units in structure - 1, attached ($)
Mean house or condo value by units in structure - 2 ($)
Mean house or condo value by units in structure by units in structure - 3 or 4 ($)
Mean house or condo value by units in structure - 5 or more ($)
Mean house or condo value by units in structure - Boat, RV, van, etc. ($)
Mean house or condo value by units in structure - Mobile home ($)
Median house or condo value ($) - White
Median house or condo value ($) - Black or African American
Median house or condo value ($) - Asian
Median house or condo value ($) - Hispanic or Latino
Median house or condo value ($) - American Indian and Alaska Native
Median house or condo value ($) - Multirace
Median house or condo value ($) - Other Race
Median resident age
Resident age diversity
Median resident age - Males
Median resident age - Females
Median resident age - White
Median resident age - Black or African American
Median resident age - Asian
Median resident age - Hispanic or Latino
Median resident age - American Indian and Alaska Native
Median resident age - Multirace
Median resident age - Other Race
Median resident age - Males - White
Median resident age - Males - Black or African American
Median resident age - Males - Asian
Median resident age - Males - Hispanic or Latino
Median resident age - Males - American Indian and Alaska Native
Median resident age - Males - Multirace
Median resident age - Males - Other Race
Median resident age - Females - White
Median resident age - Females - Black or African American
Median resident age - Females - Asian
Median resident age - Females - Hispanic or Latino
Median resident age - Females - American Indian and Alaska Native
Median resident age - Females - Multirace
Median resident age - Females - Other Race
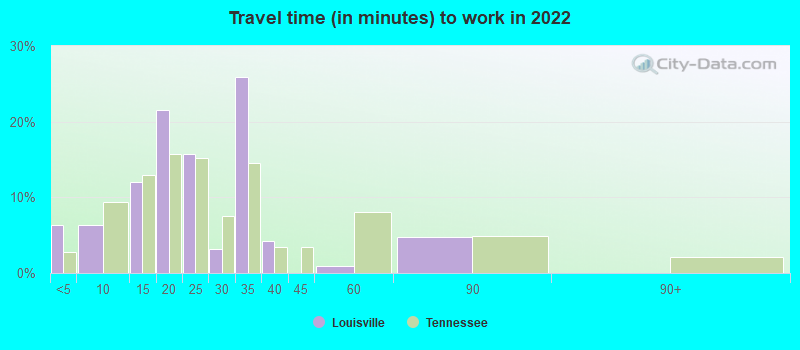
Commute - mean travel time to work (minutes)
Travel time to work - Less than 5 minutes (%)
Travel time to work - Less than 5 minutes (% change since 2000)
Travel time to work - 5 to 9 minutes (%)
Travel time to work - 5 to 9 minutes (% change since 2000)
Travel time to work - 10 to 19 minutes (%)
Travel time to work - 10 to 19 minutes (% change since 2000)
Travel time to work - 20 to 29 minutes (%)
Travel time to work - 20 to 29 minutes (% change since 2000)
Travel time to work - 30 to 39 minutes (%)
Travel time to work - 30 to 39 minutes (% change since 2000)
Travel time to work - 40 to 59 minutes (%)
Travel time to work - 40 to 59 minutes (% change since 2000)
Travel time to work - 60 to 89 minutes (%)
Travel time to work - 60 to 89 minutes (% change since 2000)
Travel time to work - 90 or more minutes (%)
Travel time to work - 90 or more minutes (% change since 2000)
Marital status - Never married (%)
Marital status - Now married (%)
Marital status - Separated (%)
Marital status - Widowed (%)
Marital status - Divorced (%)
Median family income ($)
Median family income (% change since 2000)
Median non-family income ($)
Median non-family income (% change since 2000)
Median per capita income ($)
Median per capita income (% change since 2000)
Median family income ($) - White
Median family income ($) - Black or African American
Median family income ($) - Asian
Median family income ($) - Hispanic or Latino
Median family income ($) - American Indian and Alaska Native
Median family income ($) - Multirace
Median family income ($) - Other Race
Median year house/condo built
Median year apartment built
Year house built - Built 2005 or later (%)
Year house built - Built 2000 to 2004 (%)
Year house built - Built 1990 to 1999 (%)
Year house built - Built 1980 to 1989 (%)
Year house built - Built 1970 to 1979 (%)
Year house built - Built 1960 to 1969 (%)
Year house built - Built 1950 to 1959 (%)
Year house built - Built 1940 to 1949 (%)
Year house built - Built 1939 or earlier (%)
Average household size
Household density (households per square mile)
Average household size - White
Average household size - Black or African American
Average household size - Asian
Average household size - Hispanic or Latino
Average household size - American Indian and Alaska Native
Average household size - Multirace
Average household size - Other Race
Occupied housing units (%)
Vacant housing units (%)
Owner occupied housing units (%)
Renter occupied housing units (%)
Vacancy status - For rent (%)
Vacancy status - For sale only (%)
Vacancy status - Rented or sold, not occupied (%)
Vacancy status - For seasonal, recreational, or occasional use (%)
Vacancy status - For migrant workers (%)
Vacancy status - Other vacant (%)
Residents with income below the poverty level (%)
Residents with income below 50% of the poverty level (%)
Children below poverty level (%)
Poor families by family type - Married-couple family (%)
Poor families by family type - Male, no wife present (%)
Poor families by family type - Female, no husband present (%)
Poverty status for native-born residents (%)
Poverty status for foreign-born residents (%)
Poverty among high school graduates not in families (%)
Poverty among people who did not graduate high school not in families (%)
Residents with income below the poverty level (%) - White
Residents with income below the poverty level (%) - Black or African American
Residents with income below the poverty level (%) - Asian
Residents with income below the poverty level (%) - Hispanic or Latino
Residents with income below the poverty level (%) - American Indian and Alaska Native
Residents with income below the poverty level (%) - Multirace
Residents with income below the poverty level (%) - Other Race
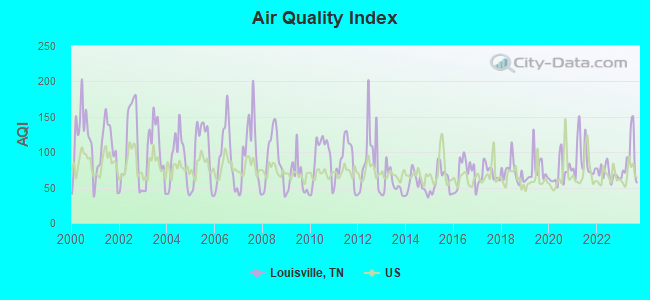
Air pollution - Air Quality Index (AQI)
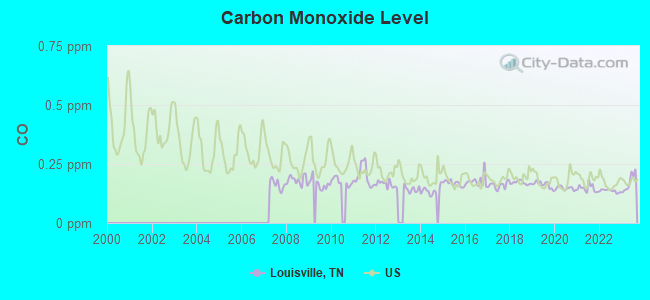
Air pollution - CO
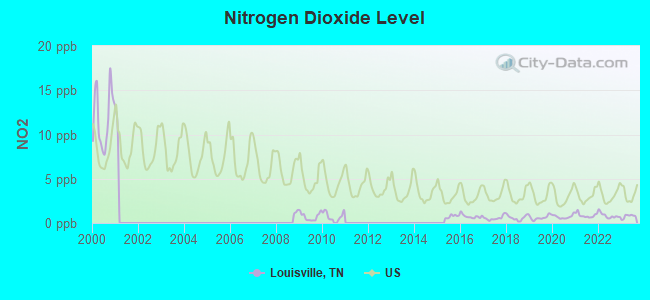
Air pollution - NO2
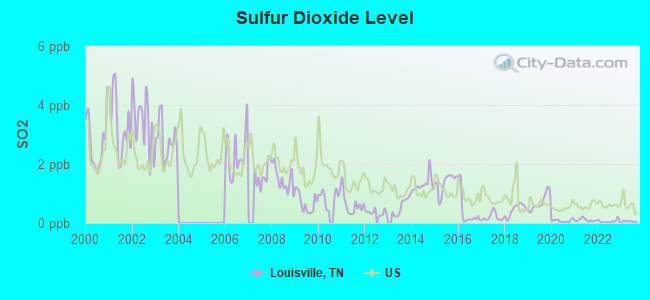
Air pollution - SO2
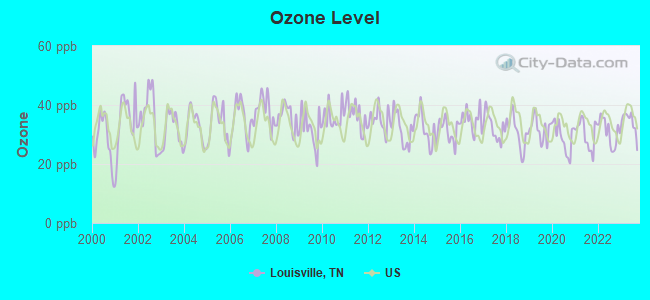
Air pollution - Ozone
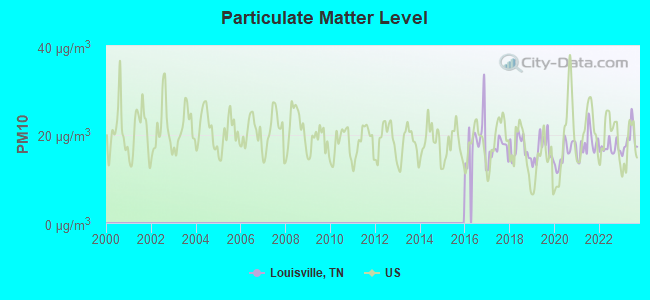
Air pollution - PM10
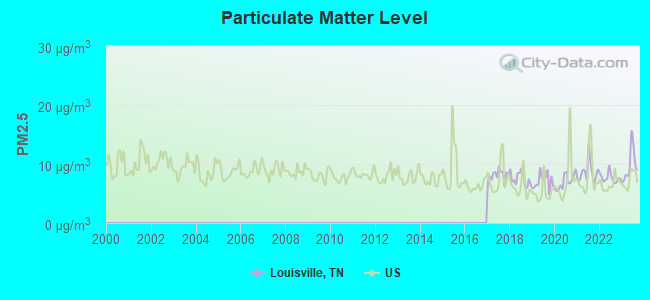
Air pollution - PM25
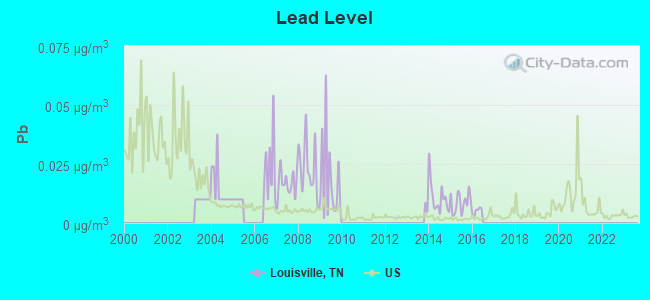
Air pollution - Pb
Crime - Murders per 100,000 population
Crime - Rapes per 100,000 population
Crime - Robberies per 100,000 population
Crime - Assaults per 100,000 population
Crime - Burglaries per 100,000 population
Crime - Thefts per 100,000 population
Crime - Auto thefts per 100,000 population
Crime - Arson per 100,000 population
Crime - City-data.com crime index
Crime - Violent crime index
Crime - Property crime index
Crime - Murders per 100,000 population (5 year average)
Crime - Rapes per 100,000 population (5 year average)
Crime - Robberies per 100,000 population (5 year average)
Crime - Assaults per 100,000 population (5 year average)
Crime - Burglaries per 100,000 population (5 year average)
Crime - Thefts per 100,000 population (5 year average)
Crime - Auto thefts per 100,000 population (5 year average)
Crime - Arson per 100,000 population (5 year average)
Crime - City-data.com crime index (5 year average)
Crime - Violent crime index (5 year average)
Crime - Property crime index (5 year average)
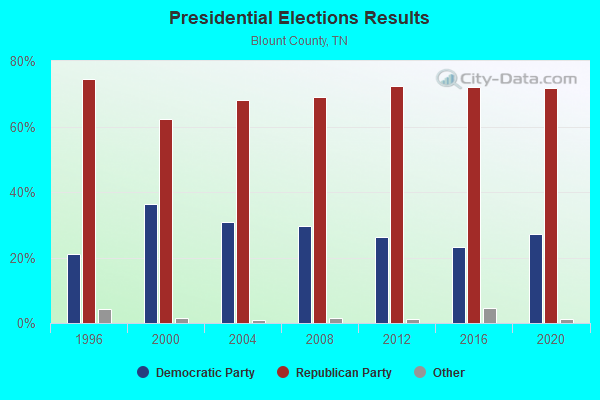
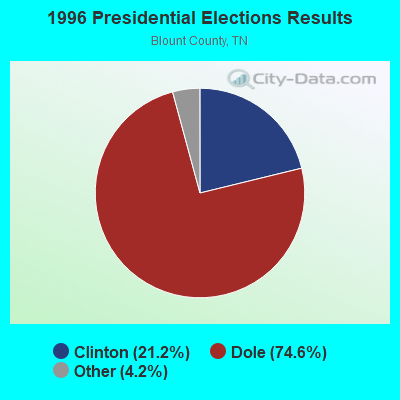
1996 Presidential Elections Results (%) - Democratic Party (Clinton)
1996 Presidential Elections Results (%) - Republican Party (Dole)
1996 Presidential Elections Results (%) - Other
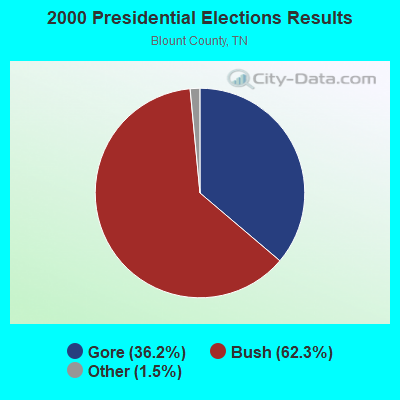
2000 Presidential Elections Results (%) - Democratic Party (Gore)
2000 Presidential Elections Results (%) - Republican Party (Bush)
2000 Presidential Elections Results (%) - Other
2004 Presidential Elections Results (%) - Democratic Party (Kerry)
2004 Presidential Elections Results (%) - Republican Party (Bush)
2004 Presidential Elections Results (%) - Other
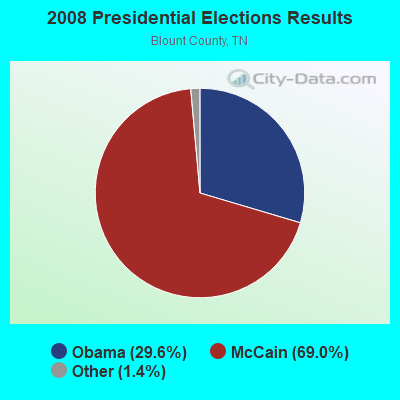
2008 Presidential Elections Results (%) - Democratic Party (Obama)
2008 Presidential Elections Results (%) - Republican Party (McCain)
2008 Presidential Elections Results (%) - Other
2012 Presidential Elections Results (%) - Democratic Party (Obama)
2012 Presidential Elections Results (%) - Republican Party (Romney)
2012 Presidential Elections Results (%) - Other
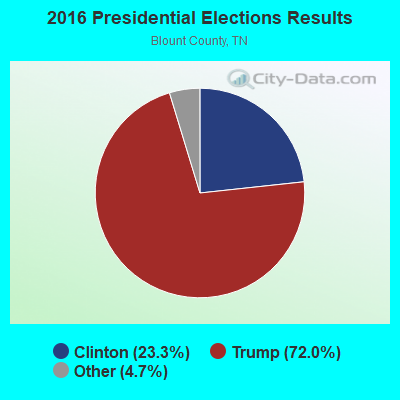
2016 Presidential Elections Results (%) - Democratic Party (Clinton)
2016 Presidential Elections Results (%) - Republican Party (Trump)
2016 Presidential Elections Results (%) - Other
2020 Presidential Elections Results (%) - Democratic Party (Biden)
2020 Presidential Elections Results (%) - Republican Party (Trump)
2020 Presidential Elections Results (%) - Other
Ancestries Reported - Arab (%)
Ancestries Reported - Czech (%)
Ancestries Reported - Danish (%)
Ancestries Reported - Dutch (%)
Ancestries Reported - English (%)
Ancestries Reported - French (%)
Ancestries Reported - French Canadian (%)
Ancestries Reported - German (%)
Ancestries Reported - Greek (%)
Ancestries Reported - Hungarian (%)
Ancestries Reported - Irish (%)
Ancestries Reported - Italian (%)
Ancestries Reported - Lithuanian (%)
Ancestries Reported - Norwegian (%)
Ancestries Reported - Polish (%)
Ancestries Reported - Portuguese (%)
Ancestries Reported - Russian (%)
Ancestries Reported - Scotch-Irish (%)
Ancestries Reported - Scottish (%)
Ancestries Reported - Slovak (%)
Ancestries Reported - Subsaharan African (%)
Ancestries Reported - Swedish (%)
Ancestries Reported - Swiss (%)
Ancestries Reported - Ukrainian (%)
Ancestries Reported - United States (%)
Ancestries Reported - Welsh (%)
Ancestries Reported - West Indian (%)
Ancestries Reported - Other (%)
Educational Attainment - No schooling completed (%)
Educational Attainment - Less than high school (%)
Educational Attainment - High school or equivalent (%)
Educational Attainment - Less than 1 year of college (%)
Educational Attainment - 1 or more years of college (%)
Educational Attainment - Associate degree (%)
Educational Attainment - Bachelor's degree (%)
Educational Attainment - Master's degree (%)
Educational Attainment - Professional school degree (%)
Educational Attainment - Doctorate degree (%)
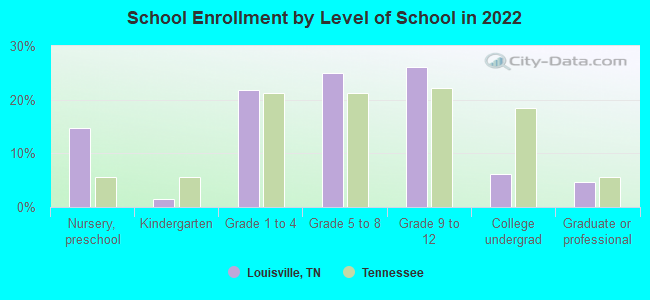
School Enrollment - Nursery, preschool (%)
School Enrollment - Kindergarten (%)
School Enrollment - Grade 1 to 4 (%)
School Enrollment - Grade 5 to 8 (%)
School Enrollment - Grade 9 to 12 (%)
School Enrollment - College undergrad (%)
School Enrollment - Graduate or professional (%)
School Enrollment - Not enrolled in school (%)
School enrollment - Public schools (%)
School enrollment - Private schools (%)
School enrollment - Not enrolled (%)
Median number of rooms in houses and condos
Median number of rooms in apartments
Housing units lacking complete plumbing facilities (%)
Housing units lacking complete kitchen facilities (%)
Density of houses
Urban houses (%)
Rural houses (%)
Households with people 60 years and over (%)
Households with people 65 years and over (%)
Households with people 75 years and over (%)
Households with one or more nonrelatives (%)
Households with no nonrelatives (%)
Population in households (%)
Family households (%)
Nonfamily households (%)
Population in families (%)
Family households with own children (%)
Median number of bedrooms in owner occupied houses
Mean number of bedrooms in owner occupied houses
Median number of bedrooms in renter occupied houses
Mean number of bedrooms in renter occupied houses
Median number of vehichles in owner occupied houses
Mean number of vehichles in owner occupied houses
Median number of vehichles in renter occupied houses
Mean number of vehichles in renter occupied houses
Mortgage status - with mortgage (%)
Mortgage status - with second mortgage (%)
Mortgage status - with home equity loan (%)
Mortgage status - with both second mortgage and home equity loan (%)
Mortgage status - without a mortgage (%)
Average family size
Average family size - White
Average family size - Black or African American
Average family size - Asian
Average family size - Hispanic or Latino
Average family size - American Indian and Alaska Native
Average family size - Multirace
Average family size - Other Race
Geographical mobility - Same house 1 year ago (%)
Geographical mobility - Moved within same county (%)
Geographical mobility - Moved from different county within same state (%)
Geographical mobility - Moved from different state (%)
Geographical mobility - Moved from abroad (%)
Place of birth - Born in state of residence (%)
Place of birth - Born in other state (%)
Place of birth - Native, outside of US (%)
Place of birth - Foreign born (%)
Housing units in structures - 1, detached (%)
Housing units in structures - 1, attached (%)
Housing units in structures - 2 (%)
Housing units in structures - 3 or 4 (%)
Housing units in structures - 5 to 9 (%)
Housing units in structures - 10 to 19 (%)
Housing units in structures - 20 to 49 (%)
Housing units in structures - 50 or more (%)
Housing units in structures - Mobile home (%)
Housing units in structures - Boat, RV, van, etc. (%)
House/condo owner moved in on average (years ago)
Renter moved in on average (years ago)
Year householder moved into unit - Moved in 1999 to March 2000 (%)
Year householder moved into unit - Moved in 1995 to 1998 (%)
Year householder moved into unit - Moved in 1990 to 1994 (%)
Year householder moved into unit - Moved in 1980 to 1989 (%)
Year householder moved into unit - Moved in 1970 to 1979 (%)
Year householder moved into unit - Moved in 1969 or earlier (%)
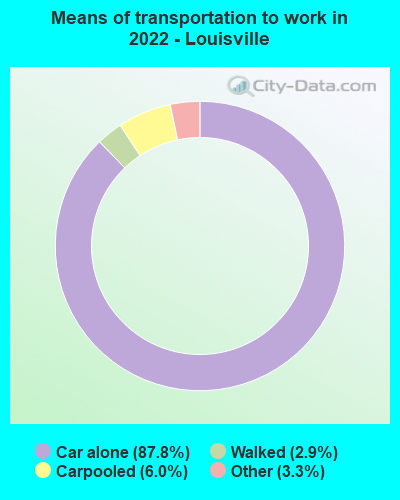
Means of transportation to work - Drove car alone (%)
Means of transportation to work - Carpooled (%)
Means of transportation to work - Public transportation (%)
Means of transportation to work - Bus or trolley bus (%)
Means of transportation to work - Streetcar or trolley car (%)
Means of transportation to work - Subway or elevated (%)
Means of transportation to work - Railroad (%)
Means of transportation to work - Ferryboat (%)
Means of transportation to work - Taxicab (%)
Means of transportation to work - Motorcycle (%)
Means of transportation to work - Bicycle (%)
Means of transportation to work - Walked (%)
Means of transportation to work - Other means (%)
Working at home (%)
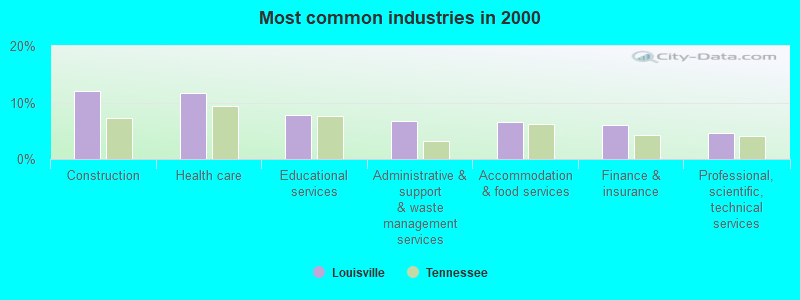
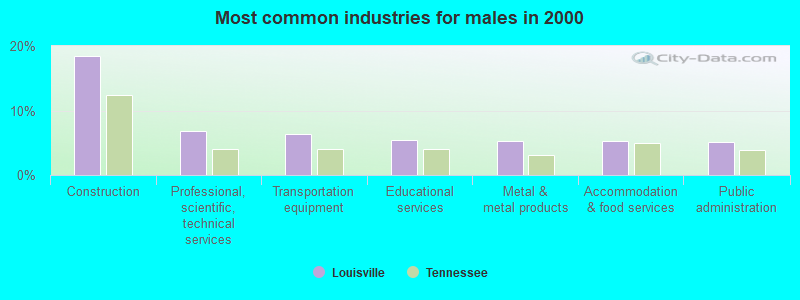
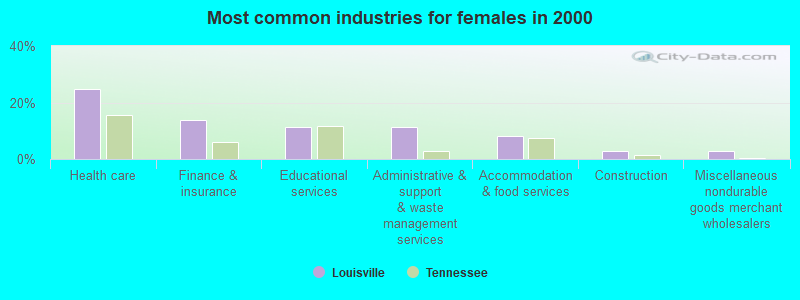
Industry diversity
Most Common Industries - Agriculture, forestry, fishing and hunting, and mining (%)
Most Common Industries - Agriculture, forestry, fishing and hunting (%)
Most Common Industries - Mining, quarrying, and oil and gas extraction (%)
Most Common Industries - Construction (%)
Most Common Industries - Manufacturing (%)
Most Common Industries - Wholesale trade (%)
Most Common Industries - Retail trade (%)
Most Common Industries - Transportation and warehousing, and utilities (%)
Most Common Industries - Transportation and warehousing (%)
Most Common Industries - Utilities (%)
Most Common Industries - Information (%)
Most Common Industries - Finance and insurance, and real estate and rental and leasing (%)
Most Common Industries - Finance and insurance (%)
Most Common Industries - Real estate and rental and leasing (%)
Most Common Industries - Professional, scientific, and management, and administrative and waste management services (%)
Most Common Industries - Professional, scientific, and technical services (%)
Most Common Industries - Management of companies and enterprises (%)
Most Common Industries - Administrative and support and waste management services (%)
Most Common Industries - Educational services, and health care and social assistance (%)
Most Common Industries - Educational services (%)
Most Common Industries - Health care and social assistance (%)
Most Common Industries - Arts, entertainment, and recreation, and accommodation and food services (%)
Most Common Industries - Arts, entertainment, and recreation (%)
Most Common Industries - Accommodation and food services (%)
Most Common Industries - Other services, except public administration (%)
Most Common Industries - Public administration (%)
Occupation diversity
Most Common Occupations - Management, business, science, and arts occupations (%)
Most Common Occupations - Management, business, and financial occupations (%)
Most Common Occupations - Management occupations (%)
Most Common Occupations - Business and financial operations occupations (%)
Most Common Occupations - Computer, engineering, and science occupations (%)
Most Common Occupations - Computer and mathematical occupations (%)
Most Common Occupations - Architecture and engineering occupations (%)
Most Common Occupations - Life, physical, and social science occupations (%)
Most Common Occupations - Education, legal, community service, arts, and media occupations (%)
Most Common Occupations - Community and social service occupations (%)
Most Common Occupations - Legal occupations (%)
Most Common Occupations - Education, training, and library occupations (%)
Most Common Occupations - Arts, design, entertainment, sports, and media occupations (%)
Most Common Occupations - Healthcare practitioners and technical occupations (%)
Most Common Occupations - Health diagnosing and treating practitioners and other technical occupations (%)
Most Common Occupations - Health technologists and technicians (%)
Most Common Occupations - Service occupations (%)
Most Common Occupations - Healthcare support occupations (%)
Most Common Occupations - Protective service occupations (%)
Most Common Occupations - Fire fighting and prevention, and other protective service workers including supervisors (%)
Most Common Occupations - Law enforcement workers including supervisors (%)
Most Common Occupations - Food preparation and serving related occupations (%)
Most Common Occupations - Building and grounds cleaning and maintenance occupations (%)
Most Common Occupations - Personal care and service occupations (%)
Most Common Occupations - Sales and office occupations (%)
Most Common Occupations - Sales and related occupations (%)
Most Common Occupations - Office and administrative support occupations (%)
Most Common Occupations - Natural resources, construction, and maintenance occupations (%)
Most Common Occupations - Farming, fishing, and forestry occupations (%)
Most Common Occupations - Construction and extraction occupations (%)
Most Common Occupations - Installation, maintenance, and repair occupations (%)
Most Common Occupations - Production, transportation, and material moving occupations (%)
Most Common Occupations - Production occupations (%)
Most Common Occupations - Transportation occupations (%)
Most Common Occupations - Material moving occupations (%)
People in Group quarters - Institutionalized population (%)
People in Group quarters - Correctional institutions (%)
People in Group quarters - Federal prisons and detention centers (%)
People in Group quarters - Halfway houses (%)
People in Group quarters - Local jails and other confinement facilities (including police lockups) (%)
People in Group quarters - Military disciplinary barracks (%)
People in Group quarters - State prisons (%)
People in Group quarters - Other types of correctional institutions (%)
People in Group quarters - Nursing homes (%)
People in Group quarters - Hospitals/wards, hospices, and schools for the handicapped (%)
People in Group quarters - Hospitals/wards and hospices for chronically ill (%)
People in Group quarters - Hospices or homes for chronically ill (%)
People in Group quarters - Military hospitals or wards for chronically ill (%)
People in Group quarters - Other hospitals or wards for chronically ill (%)
People in Group quarters - Hospitals or wards for drug/alcohol abuse (%)
People in Group quarters - Mental (Psychiatric) hospitals or wards (%)
People in Group quarters - Schools, hospitals, or wards for the mentally retarded (%)
People in Group quarters - Schools, hospitals, or wards for the physically handicapped (%)
People in Group quarters - Institutions for the deaf (%)
People in Group quarters - Institutions for the blind (%)
People in Group quarters - Orthopedic wards and institutions for the physically handicapped (%)
People in Group quarters - Wards in general hospitals for patients who have no usual home elsewhere (%)
People in Group quarters - Wards in military hospitals for patients who have no usual home elsewhere (%)
People in Group quarters - Juvenile institutions (%)
People in Group quarters - Long-term care (%)
People in Group quarters - Homes for abused, dependent, and neglected children (%)
People in Group quarters - Residential treatment centers for emotionally disturbed children (%)
People in Group quarters - Training schools for juvenile delinquents (%)
People in Group quarters - Short-term care, detention or diagnostic centers for delinquent children (%)
People in Group quarters - Type of juvenile institution unknown (%)
People in Group quarters - Noninstitutionalized population (%)
People in Group quarters - College dormitories (includes college quarters off campus) (%)
People in Group quarters - Military quarters (%)
People in Group quarters - On base (%)
People in Group quarters - Barracks, unaccompanied personnel housing (UPH), (Enlisted/Officer), ;and similar group living quarters for military personnel (%)
People in Group quarters - Transient quarters for temporary residents (%)
People in Group quarters - Military ships (%)
People in Group quarters - Group homes (%)
People in Group quarters - Homes or halfway houses for drug/alcohol abuse (%)
People in Group quarters - Homes for the mentally ill (%)
People in Group quarters - Homes for the mentally retarded (%)
People in Group quarters - Homes for the physically handicapped (%)
People in Group quarters - Other group homes (%)
People in Group quarters - Religious group quarters (%)
People in Group quarters - Dormitories (%)
People in Group quarters - Agriculture workers' dormitories on farms (%)
People in Group quarters - Job Corps and vocational training facilities (%)
People in Group quarters - Other workers' dormitories (%)
People in Group quarters - Crews of maritime vessels (%)
People in Group quarters - Other nonhousehold living situations (%)
People in Group quarters - Other noninstitutional group quarters (%)
Residents speaking English at home (%)
Residents speaking English at home - Born in the United States (%)
Residents speaking English at home - Native, born elsewhere (%)
Residents speaking English at home - Foreign born (%)
Residents speaking Spanish at home (%)
Residents speaking Spanish at home - Born in the United States (%)
Residents speaking Spanish at home - Native, born elsewhere (%)
Residents speaking Spanish at home - Foreign born (%)
Residents speaking other language at home (%)
Residents speaking other language at home - Born in the United States (%)
Residents speaking other language at home - Native, born elsewhere (%)
Residents speaking other language at home - Foreign born (%)
Class of Workers - Employee of private company (%)
Class of Workers - Self-employed in own incorporated business (%)
Class of Workers - Private not-for-profit wage and salary workers (%)
Class of Workers - Local government workers (%)
Class of Workers - State government workers (%)
Class of Workers - Federal government workers (%)
Class of Workers - Self-employed workers in own not incorporated business and Unpaid family workers (%)
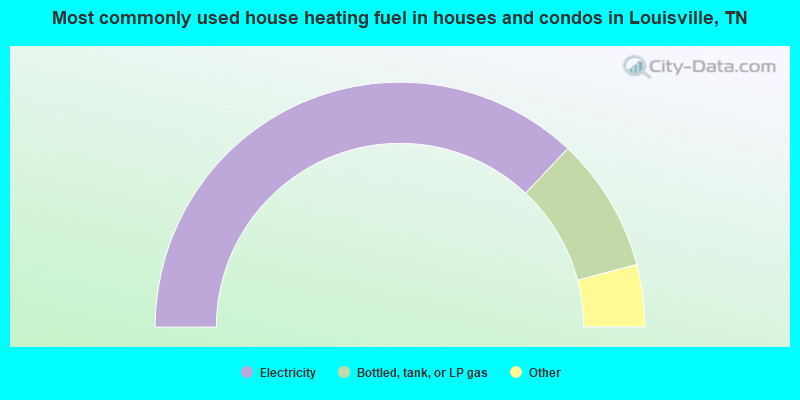
House heating fuel used in houses and condos - Utility gas (%)
House heating fuel used in houses and condos - Bottled, tank, or LP gas (%)
House heating fuel used in houses and condos - Electricity (%)
House heating fuel used in houses and condos - Fuel oil, kerosene, etc. (%)
House heating fuel used in houses and condos - Coal or coke (%)
House heating fuel used in houses and condos - Wood (%)
House heating fuel used in houses and condos - Solar energy (%)
House heating fuel used in houses and condos - Other fuel (%)
House heating fuel used in houses and condos - No fuel used (%)
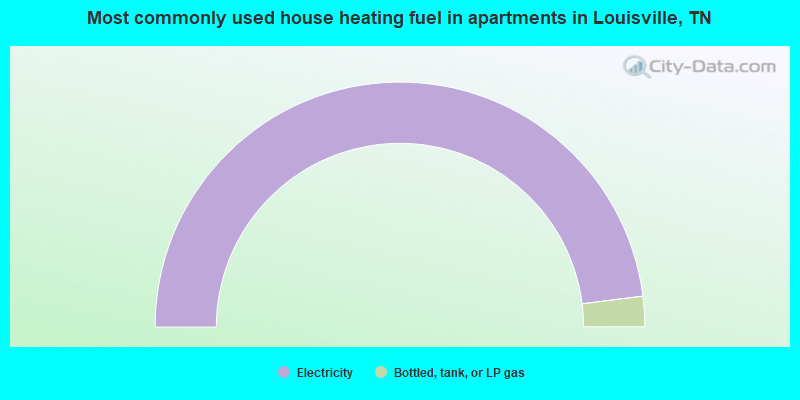
House heating fuel used in apartments - Utility gas (%)
House heating fuel used in apartments - Bottled, tank, or LP gas (%)
House heating fuel used in apartments - Electricity (%)
House heating fuel used in apartments - Fuel oil, kerosene, etc. (%)
House heating fuel used in apartments - Coal or coke (%)
House heating fuel used in apartments - Wood (%)
House heating fuel used in apartments - Solar energy (%)
House heating fuel used in apartments - Other fuel (%)
House heating fuel used in apartments - No fuel used (%)
Armed forces status - In Armed Forces (%)
Armed forces status - Civilian (%)
Armed forces status - Civilian - Veteran (%)
Armed forces status - Civilian - Nonveteran (%)
Fatal accidents locations in years 2005-2021
Fatal accidents locations in 2005
Fatal accidents locations in 2006
Fatal accidents locations in 2007
Fatal accidents locations in 2008
Fatal accidents locations in 2009
Fatal accidents locations in 2010
Fatal accidents locations in 2011
Fatal accidents locations in 2012
Fatal accidents locations in 2013
Fatal accidents locations in 2014
Fatal accidents locations in 2015
Fatal accidents locations in 2016
Fatal accidents locations in 2017
Fatal accidents locations in 2018
Fatal accidents locations in 2019
Fatal accidents locations in 2020
Fatal accidents locations in 2021
Alcohol use - People drinking some alcohol every month (%)
Alcohol use - People not drinking at all (%)
Alcohol use - Average days/month drinking alcohol
Alcohol use - Average drinks/week
Alcohol use - Average days/year people drink much
Audiometry - Average condition of hearing (%)
Audiometry - People that can hear a whisper from across a quiet room (%)
Audiometry - People that can hear normal voice from across a quiet room (%)
Audiometry - Ears ringing, roaring, buzzing (%)
Audiometry - Had a job exposure to loud noise (%)
Audiometry - Had off-work exposure to loud noise (%)
Blood Pressure & Cholesterol - Has high blood pressure (%)
Blood Pressure & Cholesterol - Checking blood pressure at home (%)
Blood Pressure & Cholesterol - Frequently checking blood cholesterol (%)
Blood Pressure & Cholesterol - Has high cholesterol level (%)
Consumer Behavior - Money monthly spent on food at supermarket/grocery store
Consumer Behavior - Money monthly spent on food at other stores
Consumer Behavior - Money monthly spent on eating out
Consumer Behavior - Money monthly spent on carryout/delivered foods
Consumer Behavior - Income spent on food at supermarket/grocery store (%)
Consumer Behavior - Income spent on food at other stores (%)
Consumer Behavior - Income spent on eating out (%)
Consumer Behavior - Income spent on carryout/delivered foods (%)
Current Health Status - General health condition (%)
Current Health Status - Blood donors (%)
Current Health Status - Has blood ever tested for HIV virus (%)
Current Health Status - Left-handed people (%)
Dermatology - People using sunscreen (%)
Diabetes - Diabetics (%)
Diabetes - Had a blood test for high blood sugar (%)
Diabetes - People taking insulin (%)
Diet Behavior & Nutrition - Diet health (%)
Diet Behavior & Nutrition - Milk product consumption (# of products/month)
Diet Behavior & Nutrition - Meals not home prepared (#/week)
Diet Behavior & Nutrition - Meals from fast food or pizza place (#/week)
Diet Behavior & Nutrition - Ready-to-eat foods (#/month)
Diet Behavior & Nutrition - Frozen meals/pizza (#/month)
Drug Use - People that ever used marijuana or hashish (%)
Drug Use - Ever used hard drugs (%)
Drug Use - Ever used any form of cocaine (%)
Drug Use - Ever used heroin (%)
Drug Use - Ever used methamphetamine (%)
Health Insurance - People covered by health insurance (%)
Kidney Conditions-Urology - Avg. # of times urinating at night
Medical Conditions - People with asthma (%)
Medical Conditions - People with anemia (%)
Medical Conditions - People with psoriasis (%)
Medical Conditions - People with overweight (%)
Medical Conditions - Elderly people having difficulties in thinking or remembering (%)
Medical Conditions - People who ever received blood transfusion (%)
Medical Conditions - People having trouble seeing even with glass/contacts (%)
Medical Conditions - People with arthritis (%)
Medical Conditions - People with gout (%)
Medical Conditions - People with congestive heart failure (%)
Medical Conditions - People with coronary heart disease (%)
Medical Conditions - People with angina pectoris (%)
Medical Conditions - People who ever had heart attack (%)
Medical Conditions - People who ever had stroke (%)
Medical Conditions - People with emphysema (%)
Medical Conditions - People with thyroid problem (%)
Medical Conditions - People with chronic bronchitis (%)
Medical Conditions - People with any liver condition (%)
Medical Conditions - People who ever had cancer or malignancy (%)
Mental Health - People who have little interest in doing things (%)
Mental Health - People feeling down, depressed, or hopeless (%)
Mental Health - People who have trouble sleeping or sleeping too much (%)
Mental Health - People feeling tired or having little energy (%)
Mental Health - People with poor appetite or overeating (%)
Mental Health - People feeling bad about themself (%)
Mental Health - People who have trouble concentrating on things (%)
Mental Health - People moving or speaking slowly or too fast (%)
Mental Health - People having thoughts they would be better off dead (%)
Oral Health - Average years since last visit a dentist
Oral Health - People embarrassed because of mouth (%)
Oral Health - People with gum disease (%)
Oral Health - General health of teeth and gums (%)
Oral Health - Average days a week using dental floss/device
Oral Health - Average days a week using mouthwash for dental problem
Oral Health - Average number of teeth
Pesticide Use - Households using pesticides to control insects (%)
Pesticide Use - Households using pesticides to kill weeds (%)
Physical Activity - People doing vigorous-intensity work activities (%)
Physical Activity - People doing moderate-intensity work activities (%)
Physical Activity - People walking or bicycling (%)
Physical Activity - People doing vigorous-intensity recreational activities (%)
Physical Activity - People doing moderate-intensity recreational activities (%)
Physical Activity - Average hours a day doing sedentary activities
Physical Activity - Average hours a day watching TV or videos
Physical Activity - Average hours a day using computer
Physical Functioning - People having limitations keeping them from working (%)
Physical Functioning - People limited in amount of work they can do (%)
Physical Functioning - People that need special equipment to walk (%)
Physical Functioning - People experiencing confusion/memory problems (%)
Physical Functioning - People requiring special healthcare equipment (%)
Prescription Medications - Average number of prescription medicines taking
Preventive Aspirin Use - Adults 40+ taking low-dose aspirin (%)
Reproductive Health - Vaginal deliveries (%)
Reproductive Health - Cesarean deliveries (%)
Reproductive Health - Deliveries resulted in a live birth (%)
Reproductive Health - Pregnancies resulted in a delivery (%)
Reproductive Health - Women breastfeeding newborns (%)
Reproductive Health - Women that had a hysterectomy (%)
Reproductive Health - Women that had both ovaries removed (%)
Reproductive Health - Women that have ever taken birth control pills (%)
Reproductive Health - Women taking birth control pills (%)
Reproductive Health - Women that have ever used Depo-Provera or injectables (%)
Reproductive Health - Women that have ever used female hormones (%)
Sexual Behavior - People 18+ that ever had sex (vaginal, anal, or oral) (%)
Sexual Behavior - Males 18+ that ever had vaginal sex with a woman (%)
Sexual Behavior - Males 18+ that ever performed oral sex on a woman (%)
Sexual Behavior - Males 18+ that ever had anal sex with a woman (%)
Sexual Behavior - Males 18+ that ever had any sex with a man (%)
Sexual Behavior - Females 18+ that ever had vaginal sex with a man (%)
Sexual Behavior - Females 18+ that ever performed oral sex on a man (%)
Sexual Behavior - Females 18+ that ever had anal sex with a man (%)
Sexual Behavior - Females 18+ that ever had any kind of sex with a woman (%)
Sexual Behavior - Average age people first had sex
Sexual Behavior - Average number of female sex partners in lifetime (males 18+)
Sexual Behavior - Average number of female vaginal sex partners in lifetime (males 18+)
Sexual Behavior - Average age people first performed oral sex on a woman (18+)
Sexual Behavior - Average number of woman performed oral sex on in lifetime (18+)
Sexual Behavior - Average number of male sex partners in lifetime (males 18+)
Sexual Behavior - Average number of male anal sex partners in lifetime (males 18+)
Sexual Behavior - Average age people first performed oral sex on a man (18+)
Sexual Behavior - Average number of male oral sex partners in lifetime (18+)
Sexual Behavior - People using protection when performing oral sex (%)
Sexual Behavior - Average number of times people have vaginal or anal sex a year
Sexual Behavior - People having sex without condom (%)
Sexual Behavior - Average number of male sex partners in lifetime (females 18+)
Sexual Behavior - Average number of male vaginal sex partners in lifetime (females 18+)
Sexual Behavior - Average number of female sex partners in lifetime (females 18+)
Sexual Behavior - Circumcised males 18+ (%)
Sleep Disorders - Average hours sleeping at night
Sleep Disorders - People that has trouble sleeping (%)
Smoking-Cigarette Use - People smoking cigarettes (%)
Taste & Smell - People 40+ having problems with smell (%)
Taste & Smell - People 40+ having problems with taste (%)
Taste & Smell - People 40+ that ever had wisdom teeth removed (%)
Taste & Smell - People 40+ that ever had tonsils teeth removed (%)
Taste & Smell - People 40+ that ever had a loss of consciousness because of a head injury (%)
Taste & Smell - People 40+ that ever had a broken nose or other serious injury to face or skull (%)
Taste & Smell - People 40+ that ever had two or more sinus infections (%)
Weight - Average height (inches)
Weight - Average weight (pounds)
Weight - Average BMI
Weight - People that are obese (%)
Weight - People that ever were obese (%)
Weight - People trying to lose weight (%)
Latest news from Louisville, TN collected exclusively by city-data.com from local newspapers, TV, and radio stations
Ancestries: American (21.1%), English (15.9%), German (10.3%), European (9.5%), Irish (7.3%), African (4.4%).
Current Local Time:
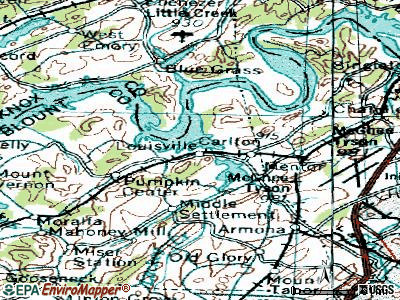
Land area: 11.6 square miles.
Population density: 379 people per square mile (very low).
121 residents are foreign born (1.2% Europe , 0.7% Asia , 0.4% Africa , 0.3% Latin America ).
This city:
2.7%Tennessee:
5.4%
Median real estate property taxes paid for housing units with mortgages in 2022: $1,456 (0.5%)Median real estate property taxes paid for housing units with no mortgage in 2022: $1,361 (0.3%)
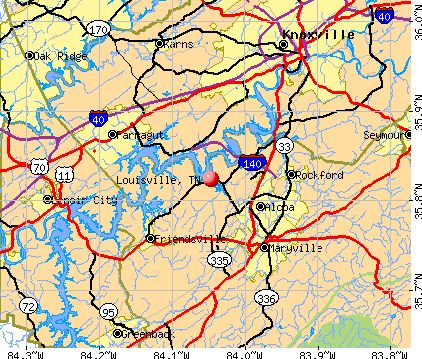
Nearest city with pop. 50,000+: Knoxville, TN
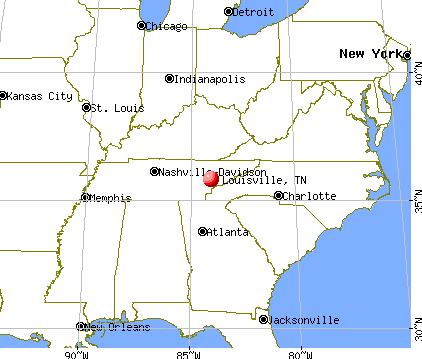
Nearest city with pop. 200,000+: Atlanta, GA
Nearest city with pop. 1,000,000+: Chicago, IL
Nearest cities:
Latitude: 35.82 N, Longitude: 84.05 W
Area code commonly used in this area: 865
Unemployment in December 2023: Population change in the 1990s: +1,108 (+124.1%).
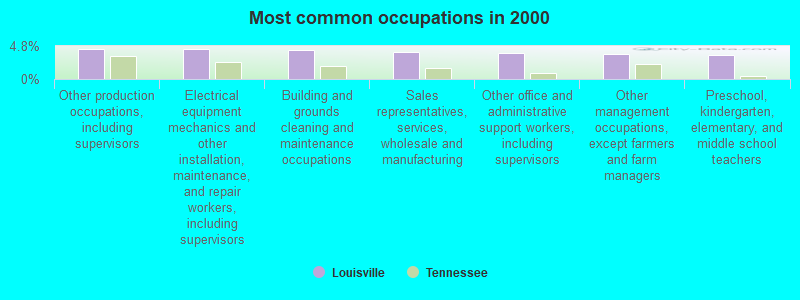
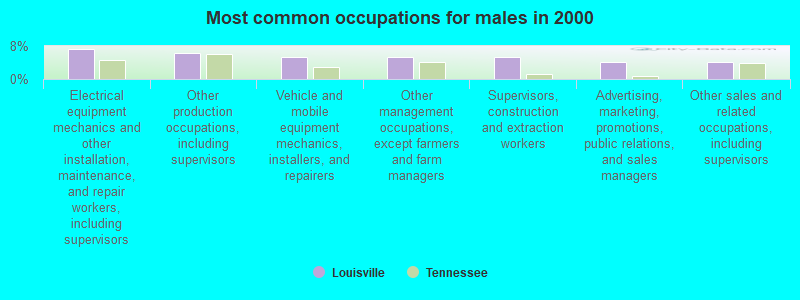
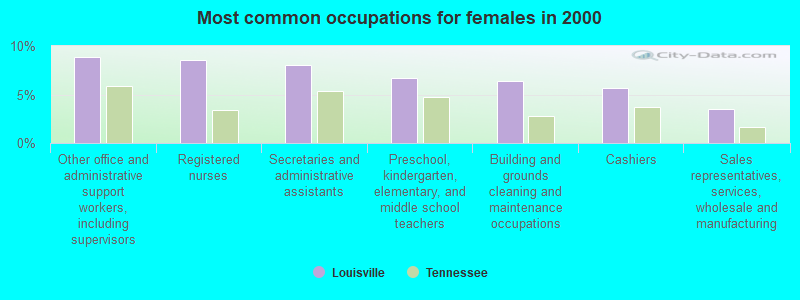
Most common occupations in Louisville, TN (%)
Both Males Females
Other production occupations, including supervisors (4.4%)
Electrical equipment mechanics and other installation, maintenance, and repair workers, including supervisors (4.3%)
Building and grounds cleaning and maintenance occupations (4.2%)
Sales representatives, services, wholesale and manufacturing (3.9%)
Other office and administrative support workers, including supervisors (3.8%)
Other management occupations, except farmers and farm managers (3.7%)
Preschool, kindergarten, elementary, and middle school teachers (3.5%)
Electrical equipment mechanics and other installation, maintenance, and repair workers, including supervisors (7.2%)
Other production occupations, including supervisors (6.3%)
Vehicle and mobile equipment mechanics, installers, and repairers (5.2%)
Other management occupations, except farmers and farm managers (5.2%)
Supervisors, construction and extraction workers (5.2%)
Advertising, marketing, promotions, public relations, and sales managers (4.2%)
Other sales and related occupations, including supervisors (4.2%)
Other office and administrative support workers, including supervisors (8.8%)
Registered nurses (8.6%)
Secretaries and administrative assistants (8.0%)
Preschool, kindergarten, elementary, and middle school teachers (6.7%)
Building and grounds cleaning and maintenance occupations (6.4%)
Cashiers (5.6%)
Sales representatives, services, wholesale and manufacturing (3.5%)
Tornado activity:
Louisville-area historical tornado activity is significantly below Tennessee state average. It is 30% smaller than the overall U.S. average.
On 2/21/1993, a category F3 (max. wind speeds 158-206 mph) tornado 5.7 miles away from the Louisville city center killed one person and injured 55 people and caused between $5000 and $50,000 in damages.
On 2/21/1993, a category F3 tornado 17.7 miles away from the city center injured 3 people and caused between $500,000 and $5,000,000 in damages.
Earthquake activity:
Louisville-area historical earthquake activity is significantly above Tennessee state average. It is 81% greater than the overall U.S. average. On 11/30/1973 at 07:48:41, a magnitude 4.7 (4.7 MB, 4.6 ML, Class: Light, Intensity: IV - V) earthquake occurred 5.0 miles away from the city center On 7/27/1980 at 18:52:21, a magnitude 5.2 (5.1 MB, 4.7 MS, 5.0 UK, 5.2 UK, Class: Moderate, Intensity: VI - VII) earthquake occurred 164.8 miles away from the city center On 4/29/2003 at 08:59:39, a magnitude 4.9 (4.4 MB, 4.6 MW, 4.9 LG) earthquake occurred 128.3 miles away from Louisville center On 8/9/2020 at 12:07:37, a magnitude 5.1 (5.1 MW, Depth: 4.7 mi) earthquake occurred 171.0 miles away from Louisville center On 12/12/2018 at 09:14:43, a magnitude 4.4 (4.4 MW, Depth: 4.9 mi) earthquake occurred 41.2 miles away from Louisville center On 8/2/1974 at 08:52:09, a magnitude 4.9 (4.3 MB, 4.9 LG) earthquake occurred 161.4 miles away from the city center Magnitude types: regional Lg-wave magnitude (LG), body-wave magnitude (MB), local magnitude (ML), surface-wave magnitude (MS), moment magnitude (MW) Natural disasters: The number of natural disasters in Blount County (13) is near the US average (15).Major Disasters (Presidential) Declared: 8Emergencies Declared: 2Floods: 8, Storms: 6, Tornadoes: 4, Heavy Rains: 2, Winds: 2, Winter Storms: 2, Flash Flood: 1, Hurricane: 1, Landslide: 1, Mudslide: 1, Snowfall: 1, Other: 1 (Note: some incidents may be assigned to more than one category). Hospitals and medical centers near Louisville: EAST TN DIALYSIS CTR., INC. (Dialysis Facility, about 7 miles away; MARYVILLE, TN)
TOTAL RENAL CARE, INC. (Dialysis Facility, about 7 miles away; MARYVILLE, TN)
FARRAGUT HEALTH CARE CENTER LTD (Nursing Home, about 7 miles away; KNOXVILLE, TN)
SUMMIT VIEW OF FARRAGUT, LLC (Nursing Home, about 7 miles away; KNOXVILLE, TN)
MARYVILLE SURGICAL CENTER (Hospital, about 7 miles away; MARYVILLE, TN)
SYMPHONY HOME CARE SVS KNOXVILLE PEC (Home Health Center, about 7 miles away; KNOXVILLE, TN)
BLOUNT MEMORIAL HOSPITAL (about 7 miles away; MARYVILLE, TN)
Airports located in Louisville: Colleges/universities with over 2000 students nearest to Louisville:
Pellissippi State Community College (about 11 miles; Knoxville, TN ; Full-time enrollment: 7,271)
The University of Tennessee-Knoxville (about 12 miles; Knoxville, TN ; FT enrollment: 25,483)
Roane State Community College (about 33 miles; Harriman, TN ; FT enrollment: 4,302)
Walters State Community College (about 52 miles; Morristown, TN ; FT enrollment: 4,359)
Lincoln Memorial University (about 57 miles; Harrogate, TN ; FT enrollment: 3,706)
University of the Cumberlands (about 64 miles; Williamsburg, KY ; FT enrollment: 3,585)
Cleveland State Community College (about 64 miles; Cleveland, TN ; FT enrollment: 2,500)
Private high schools in Louisville: THE VILLAGE SCHOOL Students: 60, Location: 2340 JONES BEND RD, Grades: 7-12)
GATEWAY CENTER Students: 20, Location: 3845 HOLSTON COLLEGE RD, Grades: 8-12, Boys only )
Public elementary/middle school in Louisville:
Private elementary/middle school in Louisville: NEW HORIZON MONTESSORI SCHOOL Students: 31, Location: 913 E CUMBERLAND DR, Grades: PK-6)
See full list of schools located in Louisville
Notable locations in Louisville: (A) , Louisville Dock (B) , Blount County Fire Protection District Station 3 (C) . Display/hide their locations on the map
Churches in Louisville include: (A) , Saint Marks Church (B) , Louisville Church (C) . Display/hide their locations on the map
Cemeteries: (1) , Louisville Cemetery (2) , Byerly Cemetery (3) , Cox Cemetery (4) , George Cemetery (5) , Holston Cemetery (6) . Display/hide their locations on the map
Reservoir: (A) . Display/hide its location on the map
Streams, rivers, and creeks: (A) , George Creek (B) , Cox Creek (C) , Caney Branch (D) , Poland Creek (E) , Taylor Branch (F) . Display/hide their locations on the map
Parks in Louisville include: (1) , Louisville Point Park (2) . Display/hide their locations on the map
Tourist attraction: (1) . Display/hide its approximate location on the map
Blount County has a predicted average indoor radon screening level greater than 4 pCi/L (pico curies per liter) - Highest Potential Drinking water stations with addresses in Louisville and their reported violations in the past:
ALLENDALE MOBILE HOME PARK (Population served: 88, Groundwater):
Past health violations:
MCL, Acute (TCR) - In FEB-2008, Contaminant: Coliform. Follow-up actions: St Public Notif requested (MAR-31-2008), St Compliance achieved (MAR-31-2008), St Violation/Reminder Notice (MAR-31-2008)
Population served: 35, Groundwater):
Past health violations:
MCL, Monthly (TCR) - In AUG-2008, Contaminant: Coliform. Follow-up actions: St Public Notif requested (OCT-08-2008), St Violation/Reminder Notice (OCT-08-2008), St Public Notif received (OCT-21-2008), St Compliance achieved (DEC-31-2008)
MCL, Monthly (TCR) - Between JUL-2008 and SEP-2008, Contaminant: Coliform. Follow-up actions: St Violation/Reminder Notice (SEP-02-2008), St Public Notif requested (SEP-02-2008), St Compliance achieved (DEC-31-2008)
Drinking water stations with addresses in Louisville that have no violations reported:
COUNTRY ACRES FARM (Population served: 115, Primary Water Source Type: Groundwater)
Average household size: This city:
2.4 peopleTennessee:
2.5 people
Percentage of family households: This city:
71.2%Whole state:
67.3%
Percentage of households with unmarried partners: This city:
5.7%Whole state:
5.8%
Likely homosexual households (counted as self-reported same-sex unmarried-partner households)
Lesbian couples: 0.8% of all households Gay men: 0.2% of all households
32 people in group homes intended for adults in 2010people in other noninstitutional facilities in 2010people in homes for the mentally retarded in 2000people in other group homes in 2000
Banks with branches in Louisville (2011 data):
Citizens Bank of Blount County: Topside Branch at 2041 Topside Road, branch established on 2001/12/03. Info updated 2010/10/28: Bank assets: $339.6 mil, Deposits: $280.8 mil, headquarters in Maryville, TN, positive income , Commercial Lending Specialization, 12 total offices , Holding Company: Twin Cities Financial Services, Inc.
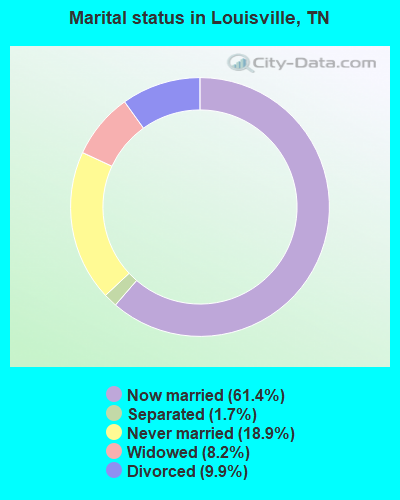
For population 15 years and over in Louisville:
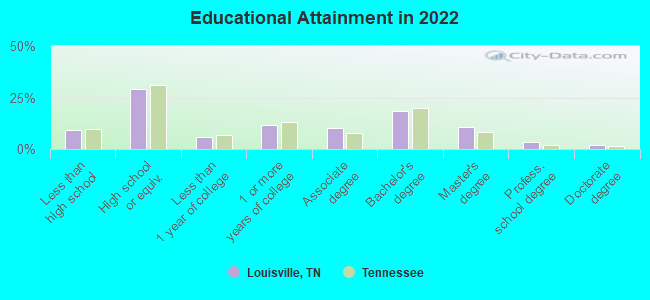
Never married: 18.9%Now married: 61.4%Separated: 1.7%Widowed: 8.2%Divorced: 9.9% For population 25 years and over in Louisville:
High school or higher: 90.3%Bachelor's degree or higher: 30.7%Graduate or professional degree: 14.6%Unemployed: 6.7%Mean travel time to work (commute): 19.2 minutes
Education Gini index (Inequality in education) Here:
10.9Tennessee average:
11.4
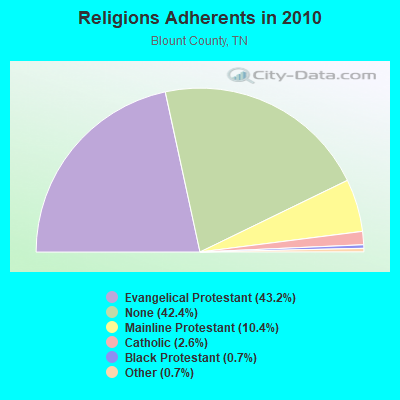
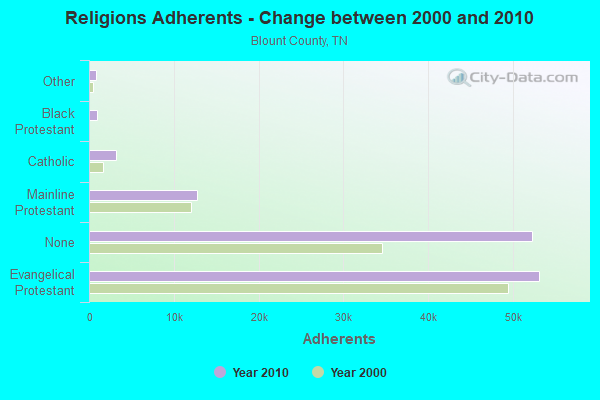
Religion statistics for Louisville, TN (based on Blount County data)
Religion Adherents Congregations Evangelical Protestant 53,117 137 Mainline Protestant 12,736 34 Catholic 3,221 3 Black Protestant 891 7 Other 834 5 Orthodox - - None 52,211 -
Source: Clifford Grammich, Kirk Hadaway, Richard Houseal, Dale E.Jones, Alexei Krindatch, Richie Stanley and Richard H.Taylor. 2012. 2010 U.S.Religion Census: Religious Congregations & Membership Study. Association of Statisticians of American Religious Bodies. Jones, Dale E., et al. 2002. Congregations and Membership in the United States 2000. Nashville, TN: Glenmary Research Center. Graphs represent county-level data
Food Environment Statistics: Number of grocery stores : 16Blount County :
1.34 / 10,000 pop.Tennessee :
1.99 / 10,000 pop.
Number of supercenters and club stores : 1Blount County :
0.08 / 10,000 pop.Tennessee :
0.17 / 10,000 pop.
Number of convenience stores (no gas) : 5Here :
0.42 / 10,000 pop.Tennessee :
0.65 / 10,000 pop.
Number of convenience stores (with gas) : 61This county :
5.10 / 10,000 pop.Tennessee :
5.16 / 10,000 pop.
Number of full-service restaurants : 75Here :
6.27 / 10,000 pop.Tennessee :
6.56 / 10,000 pop.
Adult diabetes rate : Blount County :
11.9%Tennessee :
11.4%
Adult obesity rate : This county :
29.9%Tennessee :
30.2%
Low-income preschool obesity rate : This county :
27.0%Tennessee :
13.5%
Health and Nutrition: Healthy diet rate : Louisville:
54.7%State:
49.3%
Average overall health of teeth and gums : Here:
54.4%Tennessee:
46.1%
People feeling badly about themselves : Louisville:
18.8%Tennessee:
21.0%
People not drinking alcohol at all : Louisville:
10.2%State:
10.5%
Average hours sleeping at night : Overweight people : This city:
37.1%Tennessee:
33.9%
General health condition : Louisville:
60.1%Tennessee:
55.9%
Average condition of hearing : Louisville:
79.2%Tennessee:
79.1%
More about Health and Nutrition of Louisville, TN Residents
Local government employment and payroll (March 2022)
Function
Full-time employees
Monthly full-time payroll
Average yearly full-time wage
Part-time employees
Monthly part-time payroll
Other Government Administration
3 $5,733 $22,932 2 $2,916 Parks and Recreation
1 $3,501 $42,012 1 $292 Financial Administration
1 $1,834 $22,008 2 $2,136 Streets and Highways
0 $0 3 $3,449
Totals for Government
5 $11,068 $26,563 8 $8,793
Louisville government finances - Expenditure in 2017 (per resident):
Construction - Regular Highways: $257,000 ($58.54)
General - Other: $13,000 ($2.96)Current Operations - Regular Highways: $234,000 ($53.30)
Central Staff Services: $216,000 ($49.20)Parks and Recreation: $55,000 ($12.53)General - Other: $24,000 ($5.47)Intergovernmental to Local - Other - Local Fire Protection: $87,000 ($19.82)
Other - General - Other: $13,000 ($2.96)Other Capital Outlay - General - Other: $14,000 ($3.19)
Regular Highways: $1,000 ($0.23)Total Salaries and Wages: $241,000 ($54.90)
Louisville government finances - Revenue in 2017 (per resident):
Charges - Parks and Recreation: $75,000 ($17.08)
Miscellaneous Commercial Activities: $36,000 ($8.20)Natural Resources - Other: $11,000 ($2.51)Other: $1,000 ($0.23)Local Intergovernmental - Other: $3,000 ($0.68)
Miscellaneous - Interest Earnings: $7,000 ($1.59)
State Intergovernmental - General Local Government Support: $529,000 ($120.50)
Highways: $120,000 ($27.33)Other: $67,000 ($15.26)Tax - General Sales and Gross Receipts: $157,000 ($35.76)
Other License: $42,000 ($9.57)Occupation and Business License - Other: $1,000 ($0.23)Alcoholic Beverage License: $1,000 ($0.23)
Louisville government finances - Cash and Securities in 2017 (per resident):
Other Funds - Cash and Securities: $1,968,000 ($448.29)
Businesses in Louisville, TN
Name Count Name Count
Domino's Pizza 1 McDonald's 1 FedEx 2 U-Haul 1
Strongest AM radio stations in Louisville:
WKVL (850 AM; daytime; 50 kW; KNOXVILLE, TN; Owner: HORNE RADIO, LLC)
WQBB (1040 AM; daytime; 10 kW; POWELL, TN; Owner: JOURNAL BROADCAST CORPORATION)
WNOX (990 AM; 10 kW; KNOXVILLE, TN)
WVLZ (1180 AM; daytime; 10 kW; KNOXVILLE, TN; Owner: KIRKLAND WIRELESS BROADCASTERS, INC.)
WRJZ (620 AM; 5 kW; KNOXVILLE, TN; Owner: TENNESSEE MEDIA ASSOCIATES, INC)
WMTY (670 AM; daytime; 2 kW; FARRAGUT, TN; Owner: HORNE RADIO, LLC)
WGAP (1400 AM; 1 kW; MARYVILLE, TN; Owner: HORNE RADIO, LLC)
WBCR (1470 AM; 1 kW; ALCOA, TN)
WATO (1290 AM; 5 kW; OAK RIDGE, TN)
WMEN (760 AM; daytime; 2 kW; KNOXVILLE, TN; Owner: THOMAS MOFFIT JR.)
WKXV (900 AM; 1 kW; KNOXVILLE, TN; Owner: RA-TEL BROADCASTING COMPANY, INC.)
WKGN (1340 AM; 1 kW; KNOXVILLE, TN; Owner: TRIPLE S ENTERPRISES, INC.)
WJXB (1240 AM; 1 kW; KNOXVILLE, TN; Owner: SOUTH CENTRAL COMM., CORP.)
Strongest FM radio stations in Louisville:
WTXM-FM (95.7 FM; MARYVILLE, TN; Owner: SOUTH CENTRAL COMMUNICATIONS CORP.)
WOKI-FM (100.3 FM; OAK RIDGE, TN; Owner: OAK RIDGE FM, INC.)
WUOT (91.9 FM; KNOXVILLE, TN; Owner: UNIVERSITY OF TENNESSEE)
WNFZ (94.3 FM; OAK RIDGE, TN; Owner: JOHN W. PIRKLE)
WJXB-FM (97.5 FM; KNOXVILLE, TN; Owner: SOUTH CENTRAL COMMUNICATIONS CORP.)
WIVK-FM (107.7 FM; KNOXVILLE, TN; Owner: CITADEL BROADCASTING COMPANY)
WWST (102.1 FM; SEVIERVILLE, TN; Owner: JOURNAL BROADCAST CORPORATION)
WYLV (89.1 FM; ALCOA, TN; Owner: FOOTHILLS BROADCASTING, INC.)
WYIL-FM (98.7 FM; OLIVER SPRINGS, TN; Owner: CITADEL BROADCASTING COMPANY)
WDVX (89.9 FM; CLINTON, TN; Owner: CUMBERLAND COMMUNITIES COMMUNI CORP.)
WIMZ-FM (103.5 FM; KNOXVILLE, TN; Owner: SOUTH CENTRAL COMM., CORP.)
WMYU (93.1 FM; KARNS, TN; Owner: JOURNAL BROADCAST CORPORATION)
WKZX-FM (93.5 FM; LENOIR CITY, TN; Owner: BP BROADCASTERS, LLC)
WKHT (104.5 FM; KNOXVILLE, TN; Owner: JOURNAL BROADCAST CORPORATION)
WYFC (95.3 FM; CLINTON, TN; Owner: BIBLE BROADCASTING NETWORK, INC.)
WCVP-FM (95.9 FM; ROBBINSVILLE, NC; Owner: CHEROKEE BROADCASTING COMPANY, INC.)
WRMX-FM (106.7 FM; NORRIS, TN; Owner: SOUTH CENTRAL COMMUNICATIONS CORPORATION)
WSEV-FM (105.5 FM; GATLINBURG, TN; Owner: EAST TENNESSEE RADIO GROUP, L.P.)
WFQS (91.3 FM; FRANKLIN, NC; Owner: WESTERN NORTH CAROLINA PUBLIC RADIO)
WKVL-FM (105.3 FM; LOUDON, TN; Owner: HORNE RADIO, LLC)
TV broadcast stations around Louisville:
W46DC (Channel 46; KNOXVILLE, TN; Owner: TRINITY BROADCASTING NETWORK)
WDTT-LP (Channel 38; LENOIR CITY, TN; Owner: WORD OF GOD FELLOWSHIP, INC.)
WVLT-TV (Channel 8; KNOXVILLE, TN; Owner: WVLT LICENSEE CORP.)
WKOP-TV (Channel 15; KNOXVILLE, TN; Owner: EAST TENNESSEE PUBLIC COMMUNICATIONS CORP.)
WBIR-TV (Channel 10; KNOXVILLE, TN; Owner: GANNETT PACIFIC CORPORATION)
WATE-TV (Channel 6; KNOXVILLE, TN; Owner: WATE, G.P.)
WTNZ (Channel 43; KNOXVILLE, TN; Owner: RAYCOM AMERICA, INC.)
WEEE-LP (Channel 32; KNOXVILLE, TN; Owner: TIGER EYE BROADCASTING CORPORATION)
WEZK-LP (Channel 28; KNOXVILLE, TN; Owner: SOUTH CENTRAL COMMUNICATIONS CORP.)
W50AB (Channel 50; HIAWASSEE, GA; Owner: GEORGIA PUBLIC TELECOMMUNICATIONS COMMISSION)
W50CG (Channel 50; KNOXVILLE, TN; Owner: THREE ANGELS BROADCASTING NETWORK, INC.)
W56CM (Channel 56; KNOXVILLE, TN; Owner: VENTANA TELEVISION, INC.)
WFEM-LP (Channel 12; HEISKELL, ETC., TN; Owner: H. EARL MARLAR)
WKXE-LP (Channel 4; KNOXVILLE, TN; Owner: TIGER EYE BROADCASTING CORPORATION)
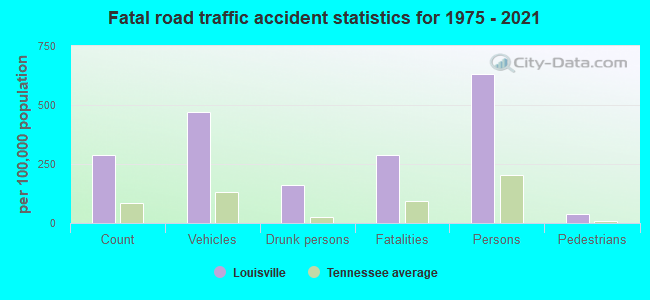
Louisville fatal accident statistics for 1975 - 2021
Louisville fatal accident list:
Mar 23, 2018 09:31 PM, Sr-333 Topside Rd, Lat: 35.830639, Lon: -84.017019, Vehicles: 2, Persons: 3, Fatalities: 1, Drunk persons involved: 1Lat: 35.823219, Lon: -84.102189, Vehicles: 1, Persons: 2, Fatalities: 1, Drunk persons involved: 1Lat: 35.798169, Lon: -84.044161, Vehicles: 1, Persons: 1, Fatalities: 1Lat: 35.853589, Lon: -83.985631, Vehicles: 1, Persons: 1, Pedestrians: 1, Fatalities: 1Vehicles: 2, Persons: 2, Fatalities: 1Vehicles: 2, Persons: 3, Fatalities: 1, Drunk persons involved: 1
National Bridge Inventory (NBI) Statistics 6 Number of bridges46ft / 13.5m Total length $2,361,000 Total costs12,868 Total average daily traffic504 Total average daily truck traffic21,242 Total future (year 2039) average daily traffic
FCC Registered Cell Phone Towers: 2 (
See the full list of FCC Registered Cell Phone Towers in Louisville )
FCC Registered Antenna Towers: 84 (
See the full list of FCC Registered Antenna Towers )
FCC Registered Broadcast Land Mobile Towers: 3
Lat: 35.822556 Lon: -83.992417, Call Sign: WPSZ830, Assigned Frequencies: 152.300 MHz, 158.385 MHz, Grant Date: 08/31/2021, Expiration Date: 08/15/2031, Certifier: Fred W Hoit, Registrant: United Parcel Service, Inc., 2200 Outer Loop, Louisville, KY 40219-3565, Phone: (502) 961-1406, Fax: (502) 374-3893, Email:
PORTABLES, Lat: 35.816111 Lon: -84.064722, Call Sign: WQYB597, Assigned Frequencies: 451.062 MHz, 451.787 MHz, 451.587 MHz, 451.487 MHz, 451.287 MHz, Grant Date: 08/09/2016, Expiration Date: 08/09/2026, Certifier: Stephen Mitchell, Registrant: Metro Communications LLC, 1210 Elm Street, Knoxville, TN 37921, Phone: (865) 546-0311, Fax: (865) 546-8666, Email:
Lat: 35.861667 Lon: -83.978333, Call Sign: WRDY917, Assigned Frequencies: 452.087 MHz, 452.687 MHz, 456.612 MHz, 457.087 MHz, 457.687 MHz, Grant Date: 08/23/2019, Expiration Date: 08/23/2029, Certifier: Gregory Cox, Registrant: Metro Communications LLC, 1210 Elm Street, Knoxville, TN 37921, Phone: (865) 546-0311, Fax: (865) 546-8666, Email:
FCC Registered Microwave Towers: 2
PELLISSIPI, 3601 Lowes Ferry Rd (Lat: 35.832028 Lon: -84.087972), Type: Tower, Structure height: 45.7 m, Overall height: 49.9 m, Call Sign: WMJ438, Assigned Frequencies: 6595.00 MHz, Grant Date: 01/25/2011, Expiration Date: 02/01/2021, Cancellation Date: 05/11/2015, Certifier: John T Scott Iii, Registrant: Verizon Wireless, 1120 Sanctuary Pkwy, #150 Gasa5reg, Alpharetta, GA 30009-7630, Phone: (770) 797-1070, Fax: (770) 797-1036, Email:
Fox HIlls, 2032 East Old Topside Rd (Lat: 35.850611 Lon: -84.005528), Type: Tower, Structure height: 57.9 m, Overall height: 60.3 m, Call Sign: WQIK539, Assigned Frequencies: 11075.0 MHz, Grant Date: 03/04/2008, Expiration Date: 03/04/2018, Cancellation Date: 09/04/2009, Certifier: William Chastain, Registrant: Radio Dynamics Corporation, 774 Mays Blvd., #10-465, Silver Spring, MD 20914, Phone: (301) 493-5171, Fax: (301) 576-4553, Email:
FCC Registered Amateur Radio Licenses: 113 (
See the full list of FCC Registered Amateur Radio Licenses in Louisville )
FAA Registered Aircraft: 24 (
See the full list of FAA Registered Aircraft in Louisville )
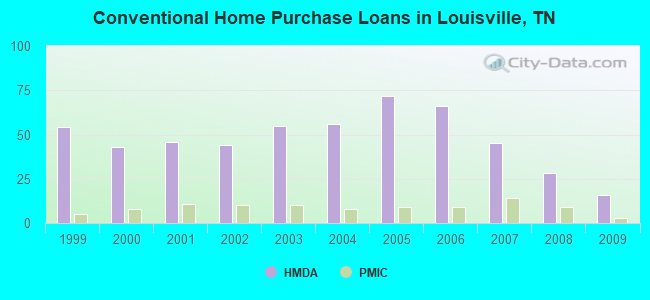
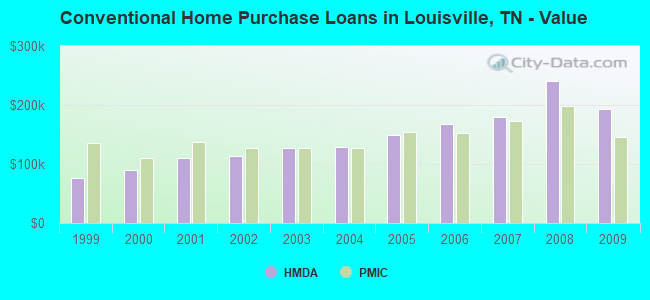
Home Mortgage Disclosure Act Aggregated Statistics For Year 2009(Based on 3 partial tracts) A) FHA, FSA/RHS & VA B) Conventional C) Refinancings D) Home Improvement Loans F) Non-occupant Loans on G) Loans On Manufactured Number Average Value Number Average Value Number Average Value Number Average Value Number Average Value Number Average Value
LOANS ORIGINATED 14 $139,451 16 $192,607 98 $183,918 5 $56,446 7 $156,331 3 $77,067 APPLICATIONS APPROVED, NOT ACCEPTED 1 $101,540 1 $203,170 7 $207,080 1 $36,710 0 $0 1 $35,140 APPLICATIONS DENIED 1 $206,730 4 $190,755 25 $198,663 2 $28,860 2 $337,330 2 $65,900 APPLICATIONS WITHDRAWN 2 $145,455 2 $263,620 19 $203,338 0 $0 1 $200,600 1 $54,390 FILES CLOSED FOR INCOMPLETENESS 0 $0 0 $0 5 $265,194 0 $0 0 $0 0 $0
Aggregated Statistics For Year 2008(Based on 3 partial tracts) A) FHA, FSA/RHS & VA B) Conventional C) Refinancings D) Home Improvement Loans F) Non-occupant Loans on G) Loans On Manufactured Number Average Value Number Average Value Number Average Value Number Average Value Number Average Value Number Average Value
LOANS ORIGINATED 10 $151,086 28 $240,563 51 $180,441 9 $58,559 6 $187,788 5 $80,842 APPLICATIONS APPROVED, NOT ACCEPTED 1 $122,560 3 $157,467 6 $245,798 1 $129,160 1 $89,800 2 $81,495 APPLICATIONS DENIED 1 $188,580 6 $203,095 34 $176,456 8 $113,672 2 $139,165 7 $94,011 APPLICATIONS WITHDRAWN 1 $138,710 2 $273,465 17 $166,541 2 $81,150 1 $74,140 1 $116,940 FILES CLOSED FOR INCOMPLETENESS 0 $0 1 $317,160 2 $214,055 0 $0 0 $0 0 $0
Aggregated Statistics For Year 2007(Based on 3 partial tracts) A) FHA, FSA/RHS & VA B) Conventional C) Refinancings D) Home Improvement Loans E) Loans on Dwellings For 5+ Families F) Non-occupant Loans on G) Loans On Manufactured Number Average Value Number Average Value Number Average Value Number Average Value Number Average Value Number Average Value Number Average Value
LOANS ORIGINATED 4 $130,470 45 $180,162 62 $160,680 13 $61,782 1 $789,750 10 $231,828 8 $70,502 APPLICATIONS APPROVED, NOT ACCEPTED 0 $0 8 $137,210 9 $207,197 1 $77,120 0 $0 1 $66,100 3 $88,713 APPLICATIONS DENIED 1 $77,630 13 $142,825 40 $171,200 6 $100,870 0 $0 3 $131,917 7 $64,260 APPLICATIONS WITHDRAWN 1 $115,140 5 $224,396 16 $163,199 2 $106,440 0 $0 0 $0 3 $66,953 FILES CLOSED FOR INCOMPLETENESS 0 $0 1 $425,600 6 $170,802 0 $0 0 $0 0 $0 0 $0
Aggregated Statistics For Year 2006(Based on 3 partial tracts) A) FHA, FSA/RHS & VA B) Conventional C) Refinancings D) Home Improvement Loans E) Loans on Dwellings For 5+ Families F) Non-occupant Loans on G) Loans On Manufactured Number Average Value Number Average Value Number Average Value Number Average Value Number Average Value Number Average Value Number Average Value
LOANS ORIGINATED 6 $142,872 66 $167,757 65 $136,909 11 $38,873 1 $550,360 15 $148,197 11 $67,748 APPLICATIONS APPROVED, NOT ACCEPTED 0 $0 12 $101,757 12 $144,978 1 $61,390 0 $0 4 $85,542 6 $63,690 APPLICATIONS DENIED 2 $116,570 24 $103,897 38 $158,808 7 $61,826 0 $0 12 $87,754 19 $56,761 APPLICATIONS WITHDRAWN 0 $0 6 $182,355 25 $147,918 2 $60,260 0 $0 2 $70,325 1 $63,000 FILES CLOSED FOR INCOMPLETENESS 0 $0 4 $209,610 8 $131,405 0 $0 0 $0 1 $94,700 0 $0
Aggregated Statistics For Year 2005(Based on 3 partial tracts) A) FHA, FSA/RHS & VA B) Conventional C) Refinancings D) Home Improvement Loans E) Loans on Dwellings For 5+ Families F) Non-occupant Loans on G) Loans On Manufactured Number Average Value Number Average Value Number Average Value Number Average Value Number Average Value Number Average Value Number Average Value
LOANS ORIGINATED 7 $129,207 72 $149,302 79 $135,483 8 $56,969 0 $0 13 $148,703 12 $54,549 APPLICATIONS APPROVED, NOT ACCEPTED 1 $76,080 15 $92,733 13 $154,672 1 $37,670 0 $0 1 $58,260 9 $54,989 APPLICATIONS DENIED 2 $67,960 25 $88,763 47 $123,759 6 $72,508 0 $0 3 $103,047 24 $66,424 APPLICATIONS WITHDRAWN 1 $125,220 8 $135,424 37 $133,923 2 $48,725 1 $304,580 0 $0 3 $67,070 FILES CLOSED FOR INCOMPLETENESS 0 $0 3 $96,373 6 $172,685 0 $0 0 $0 0 $0 0 $0
Aggregated Statistics For Year 2004(Based on 3 partial tracts) A) FHA, FSA/RHS & VA B) Conventional C) Refinancings D) Home Improvement Loans F) Non-occupant Loans on G) Loans On Manufactured Number Average Value Number Average Value Number Average Value Number Average Value Number Average Value Number Average Value
LOANS ORIGINATED 9 $118,893 56 $128,634 76 $129,701 10 $52,753 12 $126,788 13 $49,255 APPLICATIONS APPROVED, NOT ACCEPTED 1 $58,610 11 $70,804 12 $114,933 2 $28,235 1 $70,630 7 $49,511 APPLICATIONS DENIED 1 $106,020 33 $67,052 36 $104,758 5 $48,646 2 $83,020 29 $47,706 APPLICATIONS WITHDRAWN 1 $90,510 5 $152,830 35 $118,577 2 $97,460 2 $147,960 3 $84,280 FILES CLOSED FOR INCOMPLETENESS 0 $0 1 $143,020 3 $149,947 0 $0 0 $0 0 $0
Aggregated Statistics For Year 2003(Based on 3 partial tracts) A) FHA, FSA/RHS & VA B) Conventional C) Refinancings D) Home Improvement Loans E) Loans on Dwellings For 5+ Families F) Non-occupant Loans on Number Average Value Number Average Value Number Average Value Number Average Value Number Average Value Number Average Value
LOANS ORIGINATED 9 $109,022 55 $127,941 146 $121,940 6 $36,498 1 $276,230 13 $119,855 APPLICATIONS APPROVED, NOT ACCEPTED 0 $0 10 $114,093 18 $115,689 1 $18,690 0 $0 1 $92,980 APPLICATIONS DENIED 2 $64,150 26 $78,434 46 $93,541 3 $42,563 0 $0 2 $98,160 APPLICATIONS WITHDRAWN 1 $54,690 5 $105,066 32 $114,589 0 $0 0 $0 2 $101,975 FILES CLOSED FOR INCOMPLETENESS 0 $0 1 $125,540 3 $157,740 0 $0 0 $0 0 $0
Aggregated Statistics For Year 2002(Based on 3 partial tracts) A) FHA, FSA/RHS & VA B) Conventional C) Refinancings D) Home Improvement Loans E) Loans on Dwellings For 5+ Families F) Non-occupant Loans on Number Average Value Number Average Value Number Average Value Number Average Value Number Average Value Number Average Value
LOANS ORIGINATED 10 $108,419 44 $113,333 91 $120,529 6 $18,678 1 $149,910 8 $100,445 APPLICATIONS APPROVED, NOT ACCEPTED 1 $46,630 12 $66,007 13 $75,231 2 $11,720 0 $0 1 $41,580 APPLICATIONS DENIED 1 $71,050 28 $56,143 36 $89,597 2 $24,330 0 $0 1 $58,730 APPLICATIONS WITHDRAWN 2 $72,880 4 $156,568 21 $100,370 1 $33,870 0 $0 1 $69,640 FILES CLOSED FOR INCOMPLETENESS 0 $0 2 $64,795 5 $103,788 0 $0 0 $0 0 $0
Aggregated Statistics For Year 2001(Based on 3 partial tracts) A) FHA, FSA/RHS & VA B) Conventional C) Refinancings D) Home Improvement Loans E) Loans on Dwellings For 5+ Families F) Non-occupant Loans on Number Average Value Number Average Value Number Average Value Number Average Value Number Average Value Number Average Value
LOANS ORIGINATED 12 $112,218 46 $110,816 94 $109,828 8 $26,368 1 $103,350 7 $92,129 APPLICATIONS APPROVED, NOT ACCEPTED 1 $34,000 12 $51,963 11 $99,568 1 $33,930 0 $0 0 $0 APPLICATIONS DENIED 1 $74,510 37 $50,322 38 $75,579 5 $33,348 0 $0 2 $57,030 APPLICATIONS WITHDRAWN 0 $0 6 $93,600 19 $99,426 0 $0 0 $0 1 $81,260 FILES CLOSED FOR INCOMPLETENESS 1 $46,850 1 $64,690 4 $103,760 0 $0 0 $0 0 $0
Aggregated Statistics For Year 2000(Based on 3 partial tracts) A) FHA, FSA/RHS & VA B) Conventional C) Refinancings D) Home Improvement Loans F) Non-occupant Loans on Number Average Value Number Average Value Number Average Value Number Average Value Number Average Value
LOANS ORIGINATED 13 $92,460 43 $90,594 38 $90,186 10 $19,483 3 $92,183 APPLICATIONS APPROVED, NOT ACCEPTED 2 $47,400 15 $45,799 8 $80,490 3 $22,013 1 $23,310 APPLICATIONS DENIED 5 $59,750 48 $40,621 27 $86,460 4 $35,338 2 $54,155 APPLICATIONS WITHDRAWN 1 $87,550 4 $63,560 11 $87,616 2 $52,075 1 $74,570 FILES CLOSED FOR INCOMPLETENESS 0 $0 0 $0 1 $192,880 0 $0 0 $0
Aggregated Statistics For Year 1999(Based on 3 partial tracts) A) FHA, FSA/RHS & VA B) Conventional C) Refinancings D) Home Improvement Loans E) Loans on Dwellings For 5+ Families F) Non-occupant Loans on Number Average Value Number Average Value Number Average Value Number Average Value Number Average Value Number Average Value
LOANS ORIGINATED 14 $90,191 54 $75,672 55 $84,312 10 $28,133 1 $176,870 7 $79,206 APPLICATIONS APPROVED, NOT ACCEPTED 1 $39,300 19 $39,774 9 $66,467 2 $9,435 0 $0 1 $47,280 APPLICATIONS DENIED 1 $78,690 46 $45,156 23 $84,177 5 $28,414 0 $0 1 $46,000 APPLICATIONS WITHDRAWN 1 $48,490 5 $63,908 13 $100,108 2 $63,360 0 $0 1 $34,670 FILES CLOSED FOR INCOMPLETENESS 0 $0 1 $40,250 3 $99,493 0 $0 0 $0 0 $0
Detailed HMDA statistics for the following Tracts:
0103.00
, 0116.01
Private Mortgage Insurance Companies Aggregated Statistics For Year 2009(Based on 3 partial tracts) A) Conventional B) Refinancings Number Average Value Number Average Value
LOANS ORIGINATED 3 $146,437 3 $218,980 APPLICATIONS APPROVED, NOT ACCEPTED 0 $0 1 $139,510 APPLICATIONS DENIED 0 $0 1 $83,770 APPLICATIONS WITHDRAWN 1 $123,130 0 $0 FILES CLOSED FOR INCOMPLETENESS 0 $0 0 $0
Aggregated Statistics For Year 2008(Based on 3 partial tracts) A) Conventional B) Refinancings C) Non-occupant Loans on Number Average Value Number Average Value Number Average Value
LOANS ORIGINATED 9 $198,687 6 $190,012 1 $124,130 APPLICATIONS APPROVED, NOT ACCEPTED 3 $244,320 2 $186,285 0 $0 APPLICATIONS DENIED 0 $0 0 $0 0 $0 APPLICATIONS WITHDRAWN 0 $0 0 $0 0 $0 FILES CLOSED FOR INCOMPLETENESS 0 $0 0 $0 0 $0
Aggregated Statistics For Year 2007(Based on 3 partial tracts) A) Conventional B) Refinancings C) Non-occupant Loans on Number Average Value Number Average Value Number Average Value
LOANS ORIGINATED 14 $172,968 6 $169,090 1 $128,570 APPLICATIONS APPROVED, NOT ACCEPTED 2 $175,695 1 $208,190 0 $0 APPLICATIONS DENIED 0 $0 0 $0 0 $0 APPLICATIONS WITHDRAWN 1 $85,570 0 $0 0 $0 FILES CLOSED FOR INCOMPLETENESS 0 $0 0 $0 0 $0
Aggregated Statistics For Year 2006(Based on 3 partial tracts) A) Conventional B) Refinancings C) Non-occupant Loans on Number Average Value Number Average Value Number Average Value
LOANS ORIGINATED 9 $152,876 4 $196,910 0 $0 APPLICATIONS APPROVED, NOT ACCEPTED 0 $0 2 $221,060 0 $0 APPLICATIONS DENIED 0 $0 0 $0 0 $0 APPLICATIONS WITHDRAWN 1 $335,250 0 $0 1 $92,760 FILES CLOSED FOR INCOMPLETENESS 0 $0 0 $0 0 $0
Aggregated Statistics For Year 2005(Based on 3 partial tracts) A) Conventional B) Refinancings C) Non-occupant Loans on Number Average Value Number Average Value Number Average Value
LOANS ORIGINATED 9 $153,722 6 $175,458 1 $162,700 APPLICATIONS APPROVED, NOT ACCEPTED 1 $152,510 1 $189,210 0 $0 APPLICATIONS DENIED 0 $0 0 $0 0 $0 APPLICATIONS WITHDRAWN 1 $261,710 0 $0 0 $0 FILES CLOSED FOR INCOMPLETENESS 0 $0 0 $0 0 $0
Aggregated Statistics For Year 2004(Based on 3 partial tracts) A) Conventional B) Refinancings C) Non-occupant Loans on D) Loans On Manufactured Number Average Value Number Average Value Number Average Value Number Average Value
LOANS ORIGINATED 8 $127,565 7 $135,587 1 $193,840 1 $42,300 APPLICATIONS APPROVED, NOT ACCEPTED 1 $172,960 3 $175,440 0 $0 0 $0 APPLICATIONS DENIED 0 $0 0 $0 0 $0 0 $0 APPLICATIONS WITHDRAWN 0 $0 1 $137,540 0 $0 0 $0 FILES CLOSED FOR INCOMPLETENESS 0 $0 0 $0 0 $0 0 $0
Aggregated Statistics For Year 2003(Based on 3 partial tracts) A) Conventional B) Refinancings C) Non-occupant Loans on Number Average Value Number Average Value Number Average Value
LOANS ORIGINATED 10 $126,612 17 $142,529 1 $96,030 APPLICATIONS APPROVED, NOT ACCEPTED 2 $146,290 3 $111,447 0 $0 APPLICATIONS DENIED 0 $0 0 $0 0 $0 APPLICATIONS WITHDRAWN 0 $0 1 $128,490 0 $0 FILES CLOSED FOR INCOMPLETENESS 0 $0 0 $0 0 $0
Aggregated Statistics For Year 2002(Based on 3 partial tracts) A) Conventional B) Refinancings C) Non-occupant Loans on Number Average Value Number Average Value Number Average Value
LOANS ORIGINATED 10 $127,253 12 $121,812 1 $133,050 APPLICATIONS APPROVED, NOT ACCEPTED 2 $146,340 3 $96,303 0 $0 APPLICATIONS DENIED 0 $0 1 $51,050 0 $0 APPLICATIONS WITHDRAWN 0 $0 1 $66,550 0 $0 FILES CLOSED FOR INCOMPLETENESS 1 $36,990 0 $0 0 $0
Aggregated Statistics For Year 2001(Based on 3 partial tracts) A) Conventional B) Refinancings C) Non-occupant Loans on Number Average Value Number Average Value Number Average Value
LOANS ORIGINATED 11 $137,229 10 $133,296 1 $62,040 APPLICATIONS APPROVED, NOT ACCEPTED 1 $203,140 2 $117,055 0 $0 APPLICATIONS DENIED 0 $0 0 $0 0 $0 APPLICATIONS WITHDRAWN 0 $0 1 $49,160 0 $0 FILES CLOSED FOR INCOMPLETENESS 0 $0 0 $0 0 $0
Aggregated Statistics For Year 2000(Based on 3 partial tracts) A) Conventional B) Refinancings Number Average Value Number Average Value
LOANS ORIGINATED 8 $109,639 3 $88,023 APPLICATIONS APPROVED, NOT ACCEPTED 1 $68,630 0 $0 APPLICATIONS DENIED 0 $0 1 $73,040 APPLICATIONS WITHDRAWN 0 $0 0 $0 FILES CLOSED FOR INCOMPLETENESS 0 $0 0 $0
Aggregated Statistics For Year 1999(Based on 3 partial tracts) A) Conventional B) Refinancings Number Average Value Number Average Value
LOANS ORIGINATED 5 $135,584 5 $93,502 APPLICATIONS APPROVED, NOT ACCEPTED 1 $92,260 1 $91,210 APPLICATIONS DENIED 0 $0 0 $0 APPLICATIONS WITHDRAWN 0 $0 0 $0 FILES CLOSED FOR INCOMPLETENESS 0 $0 0 $0
Detailed PMIC statistics for the following Tracts:
0103.00
, 0116.01
Most common first names in Louisville, TN among deceased individuals Name Count Lived (average)
James 79 69.9 years Mary 50 77.3 years John 46 75.2 years William 45 69.9 years Robert 36 71.8 years Charles 29 69.5 years George 24 77.4 years Paul 20 73.0 years Margaret 18 73.1 years Anna 17 82.5 years
Most common last names in Louisville, TN among deceased individuals Last name Count Lived (average)
Smith 30 74.5 years Davis 23 78.1 years Jones 22 73.0 years Hicks 19 78.3 years Hatcher 15 64.8 years Brown 13 70.3 years Williams 12 64.3 years Russell 12 71.8 years Robinson 12 73.4 years Robbins 12 75.6 years
Louisville compared to Tennessee state average:
Unemployed percentage below state average. Black race population percentage below state average. Median age above state average. Renting percentage below state average. Length of stay since moving in significantly above state average.
Top Patent Applicants
Michael E. Casey (24)
Don Crawford (6)
Earl Edward Breazeale, Jr. (3)
Phillip G. Abbott (3)
Don Atkins (3)
Chris Hodgin (3)
Michael Loope (3)
Michael Casey (2)
Douglas A. Luther (2)
Dustin W. Cole (2)
Total of 67 patent applications in 2008-2024.


 Recent articles from our blog. Our writers, many of them Ph.D. graduates or candidates, create easy-to-read articles on a wide variety of topics.

 (11.9 miles
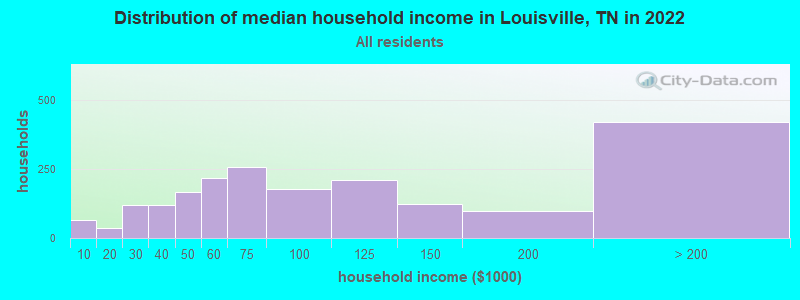


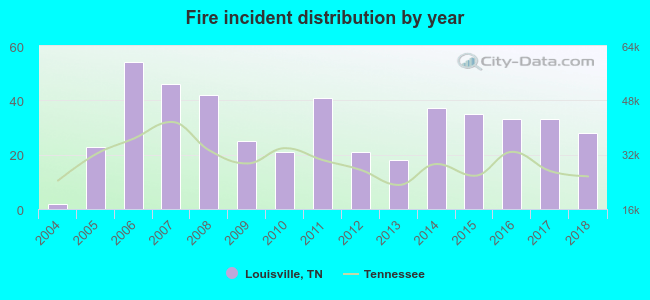 Based on the data from the years 2004 - 2018 the average number of fire incidents per year is 31. The highest number of reported fire incidents - 54 took place in 2006, and the least - 2 in 2004. The data has a rising trend.
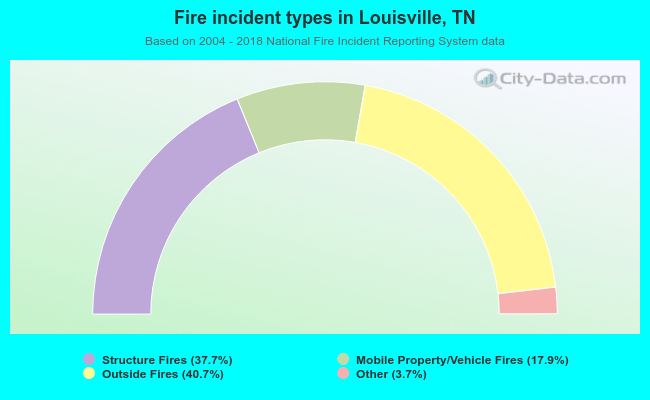 When looking into fire subcategories, the most reports belonged to: Outside Fires (40.7%), and Structure Fires (37.7%).