Lucas, Texas Submit your own pictures of this city and show them to the world
OSM Map
General Map
Google Map
MSN Map
OSM Map
General Map
Google Map
MSN Map
OSM Map
General Map
Google Map
MSN Map
OSM Map
General Map
Google Map
MSN Map
Please wait while loading the map...
Population in 2022: 8,461 (75% urban, 25% rural). Population change since 2000: +192.8%Males: 4,426 Females: 4,035
March 2022 cost of living index in Lucas: 96.1 (near average, U.S. average is 100) Percentage of residents living in poverty in 2022: 1.1%for White Non-Hispanic residents , 5.0% for Black residents , 0.8% for Hispanic or Latino residents )
Profiles of local businesses
Business Search - 14 Million verified businesses
Data:
Median household income ($)
Median household income (% change since 2000)
Household income diversity
Ratio of average income to average house value (%)
Ratio of average income to average rent
Median household income ($) - White
Median household income ($) - Black or African American
Median household income ($) - Asian
Median household income ($) - Hispanic or Latino
Median household income ($) - American Indian and Alaska Native
Median household income ($) - Multirace
Median household income ($) - Other Race
Median household income for houses/condos with a mortgage ($)
Median household income for apartments without a mortgage ($)
Races - White alone (%)
Races - White alone (% change since 2000)
Races - Black alone (%)
Races - Black alone (% change since 2000)
Races - American Indian alone (%)
Races - American Indian alone (% change since 2000)
Races - Asian alone (%)
Races - Asian alone (% change since 2000)
Races - Hispanic (%)
Races - Hispanic (% change since 2000)
Races - Native Hawaiian and Other Pacific Islander alone (%)
Races - Native Hawaiian and Other Pacific Islander alone (% change since 2000)
Races - Two or more races (%)
Races - Two or more races (% change since 2000)
Races - Other race alone (%)
Races - Other race alone (% change since 2000)
Racial diversity
Unemployment (%)
Unemployment (% change since 2000)
Unemployment (%) - White
Unemployment (%) - Black or African American
Unemployment (%) - Asian
Unemployment (%) - Hispanic or Latino
Unemployment (%) - American Indian and Alaska Native
Unemployment (%) - Multirace
Unemployment (%) - Other Race
Population density (people per square mile)
Population - Males (%)
Population - Females (%)
Population - Males (%) - White
Population - Males (%) - Black or African American
Population - Males (%) - Asian
Population - Males (%) - Hispanic or Latino
Population - Males (%) - American Indian and Alaska Native
Population - Males (%) - Multirace
Population - Males (%) - Other Race
Population - Females (%) - White
Population - Females (%) - Black or African American
Population - Females (%) - Asian
Population - Females (%) - Hispanic or Latino
Population - Females (%) - American Indian and Alaska Native
Population - Females (%) - Multirace
Population - Females (%) - Other Race
Coronavirus confirmed cases (Apr 27, 2024)
Deaths caused by coronavirus (Apr 27, 2024)
Coronavirus confirmed cases (per 100k population) (Apr 27, 2024)
Deaths caused by coronavirus (per 100k population) (Apr 27, 2024)
Daily increase in number of cases (Apr 27, 2024)
Weekly increase in number of cases (Apr 27, 2024)
Cases doubled (in days) (Apr 27, 2024)
Hospitalized patients (Apr 18, 2022)
Negative test results (Apr 18, 2022)
Total test results (Apr 18, 2022)
COVID Vaccine doses distributed (per 100k population) (Sep 19, 2023)
COVID Vaccine doses administered (per 100k population) (Sep 19, 2023)
COVID Vaccine doses distributed (Sep 19, 2023)
COVID Vaccine doses administered (Sep 19, 2023)
Likely homosexual households (%)
Likely homosexual households (% change since 2000)
Likely homosexual households - Lesbian couples (%)
Likely homosexual households - Lesbian couples (% change since 2000)
Likely homosexual households - Gay men (%)
Likely homosexual households - Gay men (% change since 2000)
Cost of living index
Median gross rent ($)
Median contract rent ($)
Median monthly housing costs ($)
Median house or condo value ($)
Median house or condo value ($ change since 2000)
Mean house or condo value by units in structure - 1, detached ($)
Mean house or condo value by units in structure - 1, attached ($)
Mean house or condo value by units in structure - 2 ($)
Mean house or condo value by units in structure by units in structure - 3 or 4 ($)
Mean house or condo value by units in structure - 5 or more ($)
Mean house or condo value by units in structure - Boat, RV, van, etc. ($)
Mean house or condo value by units in structure - Mobile home ($)
Median house or condo value ($) - White
Median house or condo value ($) - Black or African American
Median house or condo value ($) - Asian
Median house or condo value ($) - Hispanic or Latino
Median house or condo value ($) - American Indian and Alaska Native
Median house or condo value ($) - Multirace
Median house or condo value ($) - Other Race
Median resident age
Resident age diversity
Median resident age - Males
Median resident age - Females
Median resident age - White
Median resident age - Black or African American
Median resident age - Asian
Median resident age - Hispanic or Latino
Median resident age - American Indian and Alaska Native
Median resident age - Multirace
Median resident age - Other Race
Median resident age - Males - White
Median resident age - Males - Black or African American
Median resident age - Males - Asian
Median resident age - Males - Hispanic or Latino
Median resident age - Males - American Indian and Alaska Native
Median resident age - Males - Multirace
Median resident age - Males - Other Race
Median resident age - Females - White
Median resident age - Females - Black or African American
Median resident age - Females - Asian
Median resident age - Females - Hispanic or Latino
Median resident age - Females - American Indian and Alaska Native
Median resident age - Females - Multirace
Median resident age - Females - Other Race
Commute - mean travel time to work (minutes)
Travel time to work - Less than 5 minutes (%)
Travel time to work - Less than 5 minutes (% change since 2000)
Travel time to work - 5 to 9 minutes (%)
Travel time to work - 5 to 9 minutes (% change since 2000)
Travel time to work - 10 to 19 minutes (%)
Travel time to work - 10 to 19 minutes (% change since 2000)
Travel time to work - 20 to 29 minutes (%)
Travel time to work - 20 to 29 minutes (% change since 2000)
Travel time to work - 30 to 39 minutes (%)
Travel time to work - 30 to 39 minutes (% change since 2000)
Travel time to work - 40 to 59 minutes (%)
Travel time to work - 40 to 59 minutes (% change since 2000)
Travel time to work - 60 to 89 minutes (%)
Travel time to work - 60 to 89 minutes (% change since 2000)
Travel time to work - 90 or more minutes (%)
Travel time to work - 90 or more minutes (% change since 2000)
Marital status - Never married (%)
Marital status - Now married (%)
Marital status - Separated (%)
Marital status - Widowed (%)
Marital status - Divorced (%)
Median family income ($)
Median family income (% change since 2000)
Median non-family income ($)
Median non-family income (% change since 2000)
Median per capita income ($)
Median per capita income (% change since 2000)
Median family income ($) - White
Median family income ($) - Black or African American
Median family income ($) - Asian
Median family income ($) - Hispanic or Latino
Median family income ($) - American Indian and Alaska Native
Median family income ($) - Multirace
Median family income ($) - Other Race
Median year house/condo built
Median year apartment built
Year house built - Built 2005 or later (%)
Year house built - Built 2000 to 2004 (%)
Year house built - Built 1990 to 1999 (%)
Year house built - Built 1980 to 1989 (%)
Year house built - Built 1970 to 1979 (%)
Year house built - Built 1960 to 1969 (%)
Year house built - Built 1950 to 1959 (%)
Year house built - Built 1940 to 1949 (%)
Year house built - Built 1939 or earlier (%)
Average household size
Household density (households per square mile)
Average household size - White
Average household size - Black or African American
Average household size - Asian
Average household size - Hispanic or Latino
Average household size - American Indian and Alaska Native
Average household size - Multirace
Average household size - Other Race
Occupied housing units (%)
Vacant housing units (%)
Owner occupied housing units (%)
Renter occupied housing units (%)
Vacancy status - For rent (%)
Vacancy status - For sale only (%)
Vacancy status - Rented or sold, not occupied (%)
Vacancy status - For seasonal, recreational, or occasional use (%)
Vacancy status - For migrant workers (%)
Vacancy status - Other vacant (%)
Residents with income below the poverty level (%)
Residents with income below 50% of the poverty level (%)
Children below poverty level (%)
Poor families by family type - Married-couple family (%)
Poor families by family type - Male, no wife present (%)
Poor families by family type - Female, no husband present (%)
Poverty status for native-born residents (%)
Poverty status for foreign-born residents (%)
Poverty among high school graduates not in families (%)
Poverty among people who did not graduate high school not in families (%)
Residents with income below the poverty level (%) - White
Residents with income below the poverty level (%) - Black or African American
Residents with income below the poverty level (%) - Asian
Residents with income below the poverty level (%) - Hispanic or Latino
Residents with income below the poverty level (%) - American Indian and Alaska Native
Residents with income below the poverty level (%) - Multirace
Residents with income below the poverty level (%) - Other Race
Air pollution - Air Quality Index (AQI)
Air pollution - CO
Air pollution - NO2
Air pollution - SO2
Air pollution - Ozone
Air pollution - PM10
Air pollution - PM25
Air pollution - Pb
Crime - Murders per 100,000 population
Crime - Rapes per 100,000 population
Crime - Robberies per 100,000 population
Crime - Assaults per 100,000 population
Crime - Burglaries per 100,000 population
Crime - Thefts per 100,000 population
Crime - Auto thefts per 100,000 population
Crime - Arson per 100,000 population
Crime - City-data.com crime index
Crime - Violent crime index
Crime - Property crime index
Crime - Murders per 100,000 population (5 year average)
Crime - Rapes per 100,000 population (5 year average)
Crime - Robberies per 100,000 population (5 year average)
Crime - Assaults per 100,000 population (5 year average)
Crime - Burglaries per 100,000 population (5 year average)
Crime - Thefts per 100,000 population (5 year average)
Crime - Auto thefts per 100,000 population (5 year average)
Crime - Arson per 100,000 population (5 year average)
Crime - City-data.com crime index (5 year average)
Crime - Violent crime index (5 year average)
Crime - Property crime index (5 year average)
1996 Presidential Elections Results (%) - Democratic Party (Clinton)
1996 Presidential Elections Results (%) - Republican Party (Dole)
1996 Presidential Elections Results (%) - Other
2000 Presidential Elections Results (%) - Democratic Party (Gore)
2000 Presidential Elections Results (%) - Republican Party (Bush)
2000 Presidential Elections Results (%) - Other
2004 Presidential Elections Results (%) - Democratic Party (Kerry)
2004 Presidential Elections Results (%) - Republican Party (Bush)
2004 Presidential Elections Results (%) - Other
2008 Presidential Elections Results (%) - Democratic Party (Obama)
2008 Presidential Elections Results (%) - Republican Party (McCain)
2008 Presidential Elections Results (%) - Other
2012 Presidential Elections Results (%) - Democratic Party (Obama)
2012 Presidential Elections Results (%) - Republican Party (Romney)
2012 Presidential Elections Results (%) - Other
2016 Presidential Elections Results (%) - Democratic Party (Clinton)
2016 Presidential Elections Results (%) - Republican Party (Trump)
2016 Presidential Elections Results (%) - Other
2020 Presidential Elections Results (%) - Democratic Party (Biden)
2020 Presidential Elections Results (%) - Republican Party (Trump)
2020 Presidential Elections Results (%) - Other
Ancestries Reported - Arab (%)
Ancestries Reported - Czech (%)
Ancestries Reported - Danish (%)
Ancestries Reported - Dutch (%)
Ancestries Reported - English (%)
Ancestries Reported - French (%)
Ancestries Reported - French Canadian (%)
Ancestries Reported - German (%)
Ancestries Reported - Greek (%)
Ancestries Reported - Hungarian (%)
Ancestries Reported - Irish (%)
Ancestries Reported - Italian (%)
Ancestries Reported - Lithuanian (%)
Ancestries Reported - Norwegian (%)
Ancestries Reported - Polish (%)
Ancestries Reported - Portuguese (%)
Ancestries Reported - Russian (%)
Ancestries Reported - Scotch-Irish (%)
Ancestries Reported - Scottish (%)
Ancestries Reported - Slovak (%)
Ancestries Reported - Subsaharan African (%)
Ancestries Reported - Swedish (%)
Ancestries Reported - Swiss (%)
Ancestries Reported - Ukrainian (%)
Ancestries Reported - United States (%)
Ancestries Reported - Welsh (%)
Ancestries Reported - West Indian (%)
Ancestries Reported - Other (%)
Educational Attainment - No schooling completed (%)
Educational Attainment - Less than high school (%)
Educational Attainment - High school or equivalent (%)
Educational Attainment - Less than 1 year of college (%)
Educational Attainment - 1 or more years of college (%)
Educational Attainment - Associate degree (%)
Educational Attainment - Bachelor's degree (%)
Educational Attainment - Master's degree (%)
Educational Attainment - Professional school degree (%)
Educational Attainment - Doctorate degree (%)
School Enrollment - Nursery, preschool (%)
School Enrollment - Kindergarten (%)
School Enrollment - Grade 1 to 4 (%)
School Enrollment - Grade 5 to 8 (%)
School Enrollment - Grade 9 to 12 (%)
School Enrollment - College undergrad (%)
School Enrollment - Graduate or professional (%)
School Enrollment - Not enrolled in school (%)
School enrollment - Public schools (%)
School enrollment - Private schools (%)
School enrollment - Not enrolled (%)
Median number of rooms in houses and condos
Median number of rooms in apartments
Housing units lacking complete plumbing facilities (%)
Housing units lacking complete kitchen facilities (%)
Density of houses
Urban houses (%)
Rural houses (%)
Households with people 60 years and over (%)
Households with people 65 years and over (%)
Households with people 75 years and over (%)
Households with one or more nonrelatives (%)
Households with no nonrelatives (%)
Population in households (%)
Family households (%)
Nonfamily households (%)
Population in families (%)
Family households with own children (%)
Median number of bedrooms in owner occupied houses
Mean number of bedrooms in owner occupied houses
Median number of bedrooms in renter occupied houses
Mean number of bedrooms in renter occupied houses
Median number of vehichles in owner occupied houses
Mean number of vehichles in owner occupied houses
Median number of vehichles in renter occupied houses
Mean number of vehichles in renter occupied houses
Mortgage status - with mortgage (%)
Mortgage status - with second mortgage (%)
Mortgage status - with home equity loan (%)
Mortgage status - with both second mortgage and home equity loan (%)
Mortgage status - without a mortgage (%)
Average family size
Average family size - White
Average family size - Black or African American
Average family size - Asian
Average family size - Hispanic or Latino
Average family size - American Indian and Alaska Native
Average family size - Multirace
Average family size - Other Race
Geographical mobility - Same house 1 year ago (%)
Geographical mobility - Moved within same county (%)
Geographical mobility - Moved from different county within same state (%)
Geographical mobility - Moved from different state (%)
Geographical mobility - Moved from abroad (%)
Place of birth - Born in state of residence (%)
Place of birth - Born in other state (%)
Place of birth - Native, outside of US (%)
Place of birth - Foreign born (%)
Housing units in structures - 1, detached (%)
Housing units in structures - 1, attached (%)
Housing units in structures - 2 (%)
Housing units in structures - 3 or 4 (%)
Housing units in structures - 5 to 9 (%)
Housing units in structures - 10 to 19 (%)
Housing units in structures - 20 to 49 (%)
Housing units in structures - 50 or more (%)
Housing units in structures - Mobile home (%)
Housing units in structures - Boat, RV, van, etc. (%)
House/condo owner moved in on average (years ago)
Renter moved in on average (years ago)
Year householder moved into unit - Moved in 1999 to March 2000 (%)
Year householder moved into unit - Moved in 1995 to 1998 (%)
Year householder moved into unit - Moved in 1990 to 1994 (%)
Year householder moved into unit - Moved in 1980 to 1989 (%)
Year householder moved into unit - Moved in 1970 to 1979 (%)
Year householder moved into unit - Moved in 1969 or earlier (%)
Means of transportation to work - Drove car alone (%)
Means of transportation to work - Carpooled (%)
Means of transportation to work - Public transportation (%)
Means of transportation to work - Bus or trolley bus (%)
Means of transportation to work - Streetcar or trolley car (%)
Means of transportation to work - Subway or elevated (%)
Means of transportation to work - Railroad (%)
Means of transportation to work - Ferryboat (%)
Means of transportation to work - Taxicab (%)
Means of transportation to work - Motorcycle (%)
Means of transportation to work - Bicycle (%)
Means of transportation to work - Walked (%)
Means of transportation to work - Other means (%)
Working at home (%)
Industry diversity
Most Common Industries - Agriculture, forestry, fishing and hunting, and mining (%)
Most Common Industries - Agriculture, forestry, fishing and hunting (%)
Most Common Industries - Mining, quarrying, and oil and gas extraction (%)
Most Common Industries - Construction (%)
Most Common Industries - Manufacturing (%)
Most Common Industries - Wholesale trade (%)
Most Common Industries - Retail trade (%)
Most Common Industries - Transportation and warehousing, and utilities (%)
Most Common Industries - Transportation and warehousing (%)
Most Common Industries - Utilities (%)
Most Common Industries - Information (%)
Most Common Industries - Finance and insurance, and real estate and rental and leasing (%)
Most Common Industries - Finance and insurance (%)
Most Common Industries - Real estate and rental and leasing (%)
Most Common Industries - Professional, scientific, and management, and administrative and waste management services (%)
Most Common Industries - Professional, scientific, and technical services (%)
Most Common Industries - Management of companies and enterprises (%)
Most Common Industries - Administrative and support and waste management services (%)
Most Common Industries - Educational services, and health care and social assistance (%)
Most Common Industries - Educational services (%)
Most Common Industries - Health care and social assistance (%)
Most Common Industries - Arts, entertainment, and recreation, and accommodation and food services (%)
Most Common Industries - Arts, entertainment, and recreation (%)
Most Common Industries - Accommodation and food services (%)
Most Common Industries - Other services, except public administration (%)
Most Common Industries - Public administration (%)
Occupation diversity
Most Common Occupations - Management, business, science, and arts occupations (%)
Most Common Occupations - Management, business, and financial occupations (%)
Most Common Occupations - Management occupations (%)
Most Common Occupations - Business and financial operations occupations (%)
Most Common Occupations - Computer, engineering, and science occupations (%)
Most Common Occupations - Computer and mathematical occupations (%)
Most Common Occupations - Architecture and engineering occupations (%)
Most Common Occupations - Life, physical, and social science occupations (%)
Most Common Occupations - Education, legal, community service, arts, and media occupations (%)
Most Common Occupations - Community and social service occupations (%)
Most Common Occupations - Legal occupations (%)
Most Common Occupations - Education, training, and library occupations (%)
Most Common Occupations - Arts, design, entertainment, sports, and media occupations (%)
Most Common Occupations - Healthcare practitioners and technical occupations (%)
Most Common Occupations - Health diagnosing and treating practitioners and other technical occupations (%)
Most Common Occupations - Health technologists and technicians (%)
Most Common Occupations - Service occupations (%)
Most Common Occupations - Healthcare support occupations (%)
Most Common Occupations - Protective service occupations (%)
Most Common Occupations - Fire fighting and prevention, and other protective service workers including supervisors (%)
Most Common Occupations - Law enforcement workers including supervisors (%)
Most Common Occupations - Food preparation and serving related occupations (%)
Most Common Occupations - Building and grounds cleaning and maintenance occupations (%)
Most Common Occupations - Personal care and service occupations (%)
Most Common Occupations - Sales and office occupations (%)
Most Common Occupations - Sales and related occupations (%)
Most Common Occupations - Office and administrative support occupations (%)
Most Common Occupations - Natural resources, construction, and maintenance occupations (%)
Most Common Occupations - Farming, fishing, and forestry occupations (%)
Most Common Occupations - Construction and extraction occupations (%)
Most Common Occupations - Installation, maintenance, and repair occupations (%)
Most Common Occupations - Production, transportation, and material moving occupations (%)
Most Common Occupations - Production occupations (%)
Most Common Occupations - Transportation occupations (%)
Most Common Occupations - Material moving occupations (%)
People in Group quarters - Institutionalized population (%)
People in Group quarters - Correctional institutions (%)
People in Group quarters - Federal prisons and detention centers (%)
People in Group quarters - Halfway houses (%)
People in Group quarters - Local jails and other confinement facilities (including police lockups) (%)
People in Group quarters - Military disciplinary barracks (%)
People in Group quarters - State prisons (%)
People in Group quarters - Other types of correctional institutions (%)
People in Group quarters - Nursing homes (%)
People in Group quarters - Hospitals/wards, hospices, and schools for the handicapped (%)
People in Group quarters - Hospitals/wards and hospices for chronically ill (%)
People in Group quarters - Hospices or homes for chronically ill (%)
People in Group quarters - Military hospitals or wards for chronically ill (%)
People in Group quarters - Other hospitals or wards for chronically ill (%)
People in Group quarters - Hospitals or wards for drug/alcohol abuse (%)
People in Group quarters - Mental (Psychiatric) hospitals or wards (%)
People in Group quarters - Schools, hospitals, or wards for the mentally retarded (%)
People in Group quarters - Schools, hospitals, or wards for the physically handicapped (%)
People in Group quarters - Institutions for the deaf (%)
People in Group quarters - Institutions for the blind (%)
People in Group quarters - Orthopedic wards and institutions for the physically handicapped (%)
People in Group quarters - Wards in general hospitals for patients who have no usual home elsewhere (%)
People in Group quarters - Wards in military hospitals for patients who have no usual home elsewhere (%)
People in Group quarters - Juvenile institutions (%)
People in Group quarters - Long-term care (%)
People in Group quarters - Homes for abused, dependent, and neglected children (%)
People in Group quarters - Residential treatment centers for emotionally disturbed children (%)
People in Group quarters - Training schools for juvenile delinquents (%)
People in Group quarters - Short-term care, detention or diagnostic centers for delinquent children (%)
People in Group quarters - Type of juvenile institution unknown (%)
People in Group quarters - Noninstitutionalized population (%)
People in Group quarters - College dormitories (includes college quarters off campus) (%)
People in Group quarters - Military quarters (%)
People in Group quarters - On base (%)
People in Group quarters - Barracks, unaccompanied personnel housing (UPH), (Enlisted/Officer), ;and similar group living quarters for military personnel (%)
People in Group quarters - Transient quarters for temporary residents (%)
People in Group quarters - Military ships (%)
People in Group quarters - Group homes (%)
People in Group quarters - Homes or halfway houses for drug/alcohol abuse (%)
People in Group quarters - Homes for the mentally ill (%)
People in Group quarters - Homes for the mentally retarded (%)
People in Group quarters - Homes for the physically handicapped (%)
People in Group quarters - Other group homes (%)
People in Group quarters - Religious group quarters (%)
People in Group quarters - Dormitories (%)
People in Group quarters - Agriculture workers' dormitories on farms (%)
People in Group quarters - Job Corps and vocational training facilities (%)
People in Group quarters - Other workers' dormitories (%)
People in Group quarters - Crews of maritime vessels (%)
People in Group quarters - Other nonhousehold living situations (%)
People in Group quarters - Other noninstitutional group quarters (%)
Residents speaking English at home (%)
Residents speaking English at home - Born in the United States (%)
Residents speaking English at home - Native, born elsewhere (%)
Residents speaking English at home - Foreign born (%)
Residents speaking Spanish at home (%)
Residents speaking Spanish at home - Born in the United States (%)
Residents speaking Spanish at home - Native, born elsewhere (%)
Residents speaking Spanish at home - Foreign born (%)
Residents speaking other language at home (%)
Residents speaking other language at home - Born in the United States (%)
Residents speaking other language at home - Native, born elsewhere (%)
Residents speaking other language at home - Foreign born (%)
Class of Workers - Employee of private company (%)
Class of Workers - Self-employed in own incorporated business (%)
Class of Workers - Private not-for-profit wage and salary workers (%)
Class of Workers - Local government workers (%)
Class of Workers - State government workers (%)
Class of Workers - Federal government workers (%)
Class of Workers - Self-employed workers in own not incorporated business and Unpaid family workers (%)
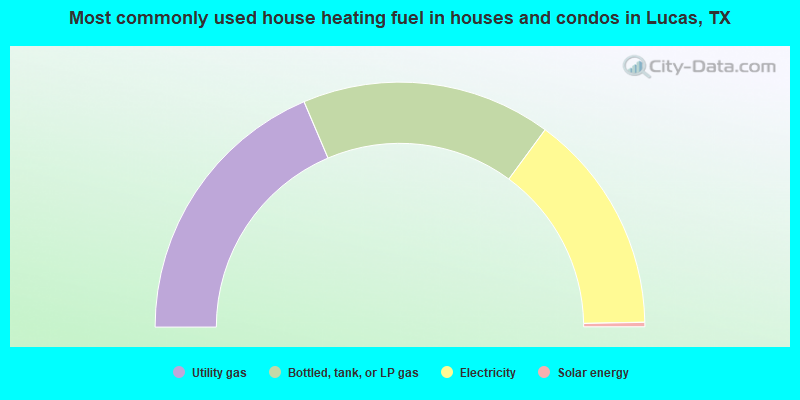
House heating fuel used in houses and condos - Utility gas (%)
House heating fuel used in houses and condos - Bottled, tank, or LP gas (%)
House heating fuel used in houses and condos - Electricity (%)
House heating fuel used in houses and condos - Fuel oil, kerosene, etc. (%)
House heating fuel used in houses and condos - Coal or coke (%)
House heating fuel used in houses and condos - Wood (%)
House heating fuel used in houses and condos - Solar energy (%)
House heating fuel used in houses and condos - Other fuel (%)
House heating fuel used in houses and condos - No fuel used (%)
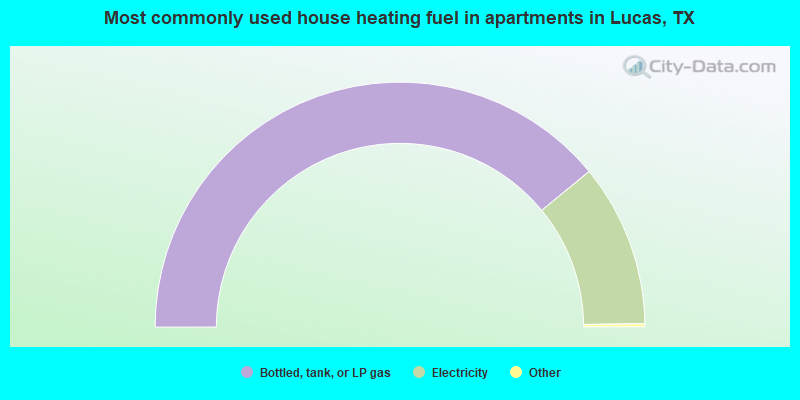
House heating fuel used in apartments - Utility gas (%)
House heating fuel used in apartments - Bottled, tank, or LP gas (%)
House heating fuel used in apartments - Electricity (%)
House heating fuel used in apartments - Fuel oil, kerosene, etc. (%)
House heating fuel used in apartments - Coal or coke (%)
House heating fuel used in apartments - Wood (%)
House heating fuel used in apartments - Solar energy (%)
House heating fuel used in apartments - Other fuel (%)
House heating fuel used in apartments - No fuel used (%)
Armed forces status - In Armed Forces (%)
Armed forces status - Civilian (%)
Armed forces status - Civilian - Veteran (%)
Armed forces status - Civilian - Nonveteran (%)
Fatal accidents locations in years 2005-2021
Fatal accidents locations in 2005
Fatal accidents locations in 2006
Fatal accidents locations in 2007
Fatal accidents locations in 2008
Fatal accidents locations in 2009
Fatal accidents locations in 2010
Fatal accidents locations in 2011
Fatal accidents locations in 2012
Fatal accidents locations in 2013
Fatal accidents locations in 2014
Fatal accidents locations in 2015
Fatal accidents locations in 2016
Fatal accidents locations in 2017
Fatal accidents locations in 2018
Fatal accidents locations in 2019
Fatal accidents locations in 2020
Fatal accidents locations in 2021
Alcohol use - People drinking some alcohol every month (%)
Alcohol use - People not drinking at all (%)
Alcohol use - Average days/month drinking alcohol
Alcohol use - Average drinks/week
Alcohol use - Average days/year people drink much
Audiometry - Average condition of hearing (%)
Audiometry - People that can hear a whisper from across a quiet room (%)
Audiometry - People that can hear normal voice from across a quiet room (%)
Audiometry - Ears ringing, roaring, buzzing (%)
Audiometry - Had a job exposure to loud noise (%)
Audiometry - Had off-work exposure to loud noise (%)
Blood Pressure & Cholesterol - Has high blood pressure (%)
Blood Pressure & Cholesterol - Checking blood pressure at home (%)
Blood Pressure & Cholesterol - Frequently checking blood cholesterol (%)
Blood Pressure & Cholesterol - Has high cholesterol level (%)
Consumer Behavior - Money monthly spent on food at supermarket/grocery store
Consumer Behavior - Money monthly spent on food at other stores
Consumer Behavior - Money monthly spent on eating out
Consumer Behavior - Money monthly spent on carryout/delivered foods
Consumer Behavior - Income spent on food at supermarket/grocery store (%)
Consumer Behavior - Income spent on food at other stores (%)
Consumer Behavior - Income spent on eating out (%)
Consumer Behavior - Income spent on carryout/delivered foods (%)
Current Health Status - General health condition (%)
Current Health Status - Blood donors (%)
Current Health Status - Has blood ever tested for HIV virus (%)
Current Health Status - Left-handed people (%)
Dermatology - People using sunscreen (%)
Diabetes - Diabetics (%)
Diabetes - Had a blood test for high blood sugar (%)
Diabetes - People taking insulin (%)
Diet Behavior & Nutrition - Diet health (%)
Diet Behavior & Nutrition - Milk product consumption (# of products/month)
Diet Behavior & Nutrition - Meals not home prepared (#/week)
Diet Behavior & Nutrition - Meals from fast food or pizza place (#/week)
Diet Behavior & Nutrition - Ready-to-eat foods (#/month)
Diet Behavior & Nutrition - Frozen meals/pizza (#/month)
Drug Use - People that ever used marijuana or hashish (%)
Drug Use - Ever used hard drugs (%)
Drug Use - Ever used any form of cocaine (%)
Drug Use - Ever used heroin (%)
Drug Use - Ever used methamphetamine (%)
Health Insurance - People covered by health insurance (%)
Kidney Conditions-Urology - Avg. # of times urinating at night
Medical Conditions - People with asthma (%)
Medical Conditions - People with anemia (%)
Medical Conditions - People with psoriasis (%)
Medical Conditions - People with overweight (%)
Medical Conditions - Elderly people having difficulties in thinking or remembering (%)
Medical Conditions - People who ever received blood transfusion (%)
Medical Conditions - People having trouble seeing even with glass/contacts (%)
Medical Conditions - People with arthritis (%)
Medical Conditions - People with gout (%)
Medical Conditions - People with congestive heart failure (%)
Medical Conditions - People with coronary heart disease (%)
Medical Conditions - People with angina pectoris (%)
Medical Conditions - People who ever had heart attack (%)
Medical Conditions - People who ever had stroke (%)
Medical Conditions - People with emphysema (%)
Medical Conditions - People with thyroid problem (%)
Medical Conditions - People with chronic bronchitis (%)
Medical Conditions - People with any liver condition (%)
Medical Conditions - People who ever had cancer or malignancy (%)
Mental Health - People who have little interest in doing things (%)
Mental Health - People feeling down, depressed, or hopeless (%)
Mental Health - People who have trouble sleeping or sleeping too much (%)
Mental Health - People feeling tired or having little energy (%)
Mental Health - People with poor appetite or overeating (%)
Mental Health - People feeling bad about themself (%)
Mental Health - People who have trouble concentrating on things (%)
Mental Health - People moving or speaking slowly or too fast (%)
Mental Health - People having thoughts they would be better off dead (%)
Oral Health - Average years since last visit a dentist
Oral Health - People embarrassed because of mouth (%)
Oral Health - People with gum disease (%)
Oral Health - General health of teeth and gums (%)
Oral Health - Average days a week using dental floss/device
Oral Health - Average days a week using mouthwash for dental problem
Oral Health - Average number of teeth
Pesticide Use - Households using pesticides to control insects (%)
Pesticide Use - Households using pesticides to kill weeds (%)
Physical Activity - People doing vigorous-intensity work activities (%)
Physical Activity - People doing moderate-intensity work activities (%)
Physical Activity - People walking or bicycling (%)
Physical Activity - People doing vigorous-intensity recreational activities (%)
Physical Activity - People doing moderate-intensity recreational activities (%)
Physical Activity - Average hours a day doing sedentary activities
Physical Activity - Average hours a day watching TV or videos
Physical Activity - Average hours a day using computer
Physical Functioning - People having limitations keeping them from working (%)
Physical Functioning - People limited in amount of work they can do (%)
Physical Functioning - People that need special equipment to walk (%)
Physical Functioning - People experiencing confusion/memory problems (%)
Physical Functioning - People requiring special healthcare equipment (%)
Prescription Medications - Average number of prescription medicines taking
Preventive Aspirin Use - Adults 40+ taking low-dose aspirin (%)
Reproductive Health - Vaginal deliveries (%)
Reproductive Health - Cesarean deliveries (%)
Reproductive Health - Deliveries resulted in a live birth (%)
Reproductive Health - Pregnancies resulted in a delivery (%)
Reproductive Health - Women breastfeeding newborns (%)
Reproductive Health - Women that had a hysterectomy (%)
Reproductive Health - Women that had both ovaries removed (%)
Reproductive Health - Women that have ever taken birth control pills (%)
Reproductive Health - Women taking birth control pills (%)
Reproductive Health - Women that have ever used Depo-Provera or injectables (%)
Reproductive Health - Women that have ever used female hormones (%)
Sexual Behavior - People 18+ that ever had sex (vaginal, anal, or oral) (%)
Sexual Behavior - Males 18+ that ever had vaginal sex with a woman (%)
Sexual Behavior - Males 18+ that ever performed oral sex on a woman (%)
Sexual Behavior - Males 18+ that ever had anal sex with a woman (%)
Sexual Behavior - Males 18+ that ever had any sex with a man (%)
Sexual Behavior - Females 18+ that ever had vaginal sex with a man (%)
Sexual Behavior - Females 18+ that ever performed oral sex on a man (%)
Sexual Behavior - Females 18+ that ever had anal sex with a man (%)
Sexual Behavior - Females 18+ that ever had any kind of sex with a woman (%)
Sexual Behavior - Average age people first had sex
Sexual Behavior - Average number of female sex partners in lifetime (males 18+)
Sexual Behavior - Average number of female vaginal sex partners in lifetime (males 18+)
Sexual Behavior - Average age people first performed oral sex on a woman (18+)
Sexual Behavior - Average number of woman performed oral sex on in lifetime (18+)
Sexual Behavior - Average number of male sex partners in lifetime (males 18+)
Sexual Behavior - Average number of male anal sex partners in lifetime (males 18+)
Sexual Behavior - Average age people first performed oral sex on a man (18+)
Sexual Behavior - Average number of male oral sex partners in lifetime (18+)
Sexual Behavior - People using protection when performing oral sex (%)
Sexual Behavior - Average number of times people have vaginal or anal sex a year
Sexual Behavior - People having sex without condom (%)
Sexual Behavior - Average number of male sex partners in lifetime (females 18+)
Sexual Behavior - Average number of male vaginal sex partners in lifetime (females 18+)
Sexual Behavior - Average number of female sex partners in lifetime (females 18+)
Sexual Behavior - Circumcised males 18+ (%)
Sleep Disorders - Average hours sleeping at night
Sleep Disorders - People that has trouble sleeping (%)
Smoking-Cigarette Use - People smoking cigarettes (%)
Taste & Smell - People 40+ having problems with smell (%)
Taste & Smell - People 40+ having problems with taste (%)
Taste & Smell - People 40+ that ever had wisdom teeth removed (%)
Taste & Smell - People 40+ that ever had tonsils teeth removed (%)
Taste & Smell - People 40+ that ever had a loss of consciousness because of a head injury (%)
Taste & Smell - People 40+ that ever had a broken nose or other serious injury to face or skull (%)
Taste & Smell - People 40+ that ever had two or more sinus infections (%)
Weight - Average height (inches)
Weight - Average weight (pounds)
Weight - Average BMI
Weight - People that are obese (%)
Weight - People that ever were obese (%)
Weight - People trying to lose weight (%)
According to our research of Texas and other state lists, there were 3 registered sex offenders living in Lucas, Texas as of April 27, 2024 . The ratio of all residents to sex offenders in Lucas is 2,326 to 1.The ratio of registered sex offenders to all residents in this city is much lower than the state average.
Latest news from Lucas, TX collected exclusively by city-data.com from local newspapers, TV, and radio stations
Ancestries: American (29.1%), English (16.1%), German (6.8%), European (5.4%), Italian (3.4%), Danish (2.8%).
Current Local Time:
Land area: 9.20 square miles.
Population density: 920 people per square mile (low).
451 residents are foreign born (2.5% Asia , 2.3% Europe , 0.6% Latin America ).
This city:
5.4%Texas:
17.1%
Median real estate property taxes paid for housing units with mortgages in 2022: $9,780 (1.0%)Median real estate property taxes paid for housing units with no mortgage in 2022: $9,939 (1.3%)
Nearest city with pop. 50,000+: McKinney, TX
Nearest city with pop. 200,000+: Plano, TX
Nearest city with pop. 1,000,000+: Dallas, TX
Nearest cities:
Latitude: 33.10 N, Longitude: 96.58 W
Property values in Lucas, TX
Single-family new house construction building permits:
2022: 93 buildings , average cost: $696,6002021: 143 buildings , average cost: $715,9002020: 112 buildings , average cost: $563,0002019: 78 buildings , average cost: $553,5002018: 163 buildings , average cost: $473,3002017: 157 buildings , average cost: $469,1002016: 97 buildings , average cost: $524,5002015: 127 buildings , average cost: $225,7002014: 103 buildings , average cost: $443,1002013: 99 buildings , average cost: $445,8002012: 90 buildings , average cost: $353,7002011: 92 buildings , average cost: $364,2002010: 75 buildings , average cost: $373,4002009: 34 buildings , average cost: $484,7002008: 53 buildings , average cost: $437,3002007: 59 buildings , average cost: $503,6002006: 82 buildings , average cost: $387,8002005: 101 buildings , average cost: $375,7002004: 56 buildings , average cost: $363,8002003: 96 buildings , average cost: $270,7002002: 104 buildings , average cost: $275,0002001: 35 buildings , average cost: $228,3002000: 31 buildings , average cost: $228,3001999: 34 buildings , average cost: $228,4001998: 34 buildings , average cost: $228,0001997: 27 buildings , average cost: $230,000Unemployment in December 2023:
Most common occupations in Lucas, TX (%)
Both Males Females
Other management occupations, except farmers and farm managers (7.3%)
Engineers (6.9%)
Computer specialists (6.3%)
Sales representatives, services, wholesale and manufacturing (6.1%)
Top executives (4.9%)
Preschool, kindergarten, elementary, and middle school teachers (4.7%)
Other sales and related occupations, including supervisors (4.6%)
Engineers (10.5%)
Other management occupations, except farmers and farm managers (10.0%)
Computer specialists (8.5%)
Sales representatives, services, wholesale and manufacturing (8.4%)
Other sales and related occupations, including supervisors (6.1%)
Top executives (5.9%)
Operations specialties managers, except financial managers (3.4%)
Preschool, kindergarten, elementary, and middle school teachers (10.4%)
Secretaries and administrative assistants (8.7%)
Other office and administrative support workers, including supervisors (8.0%)
Other teachers, instructors, education, training, and library occupations (4.0%)
Accountants and auditors (3.7%)
Other management occupations, except farmers and farm managers (3.5%)
Top executives (3.5%)
Tornado activity:
Lucas-area historical tornado activity is above Texas state average. It is 150% greater than the overall U.S. average.
On 4/25/1994, a category F4 (max. wind speeds 207-260 mph) tornado 30.3 miles away from the Lucas city center killed 3 people and injured 48 people and caused between $50,000,000 and $500,000,000 in damages.
On 10/4/1959, a category F3 (max. wind speeds 158-206 mph) tornado 9.4 miles away from the city center injured 5 people and caused between $50,000 and $500,000 in damages.
Earthquake activity:
Lucas-area historical earthquake activity is significantly above Texas state average. It is 501% greater than the overall U.S. average. On 11/6/2011 at 03:53:10, a magnitude 5.7 (5.7 MW, Depth: 3.2 mi, Class: Moderate, Intensity: VI - VII) earthquake occurred 168.4 miles away from the city center On 9/3/2016 at 12:02:44, a magnitude 5.8 (5.8 MW, Depth: 3.5 mi) earthquake occurred 230.7 miles away from the city center On 6/16/1978 at 11:46:54, a magnitude 5.3 (4.4 MB, 4.6 UK, 5.3 ML) earthquake occurred 242.8 miles away from Lucas center On 5/17/2012 at 08:12:00, a magnitude 4.8 (4.8 MW, Depth: 3.1 mi, Class: Light, Intensity: IV - V) earthquake occurred 152.3 miles away from Lucas center On 11/7/2016 at 01:44:24, a magnitude 5.0 (5.0 MW, Depth: 2.8 mi) earthquake occurred 200.2 miles away from the city center On 11/8/2011 at 02:46:57, a magnitude 4.8 (4.8 MW, Depth: 3.1 mi) earthquake occurred 168.5 miles away from the city center Magnitude types: body-wave magnitude (MB), local magnitude (ML), moment magnitude (MW) Natural disasters: The number of natural disasters in Collin County (14) is near the US average (15).Major Disasters (Presidential) Declared: 5Emergencies Declared: 8Hurricanes: 5, Floods: 4, Storms: 4, Fires: 3, Tornadoes: 3, Other: 2 (Note: some incidents may be assigned to more than one category). Hospitals and medical centers near Lucas: ABIDING CARE SERVICES INC (Home Health Center, about 3 miles away; ALLEN, TX)
SINCERE HOME HEALTH CARE INC (Home Health Center, about 3 miles away; WYLIE, TX)
KINGS HEALTH CARE LLC (Home Health Center, about 4 miles away; ALLEN, TX)
BLEDKOB HOME HEALTH AGENCY INC (Home Health Center, about 4 miles away; ALLEN, TX)
ADVANT HOME HEALTH SERVICES INC (Home Health Center, about 4 miles away; ALLEN, TX)
STAR CHOICE HOME HEALTH INC (Home Health Center, about 4 miles away; MURPHY, TX)
GARNET HILL REHABILITATION AND SKILLED CARE (Nursing Home, about 5 miles away; WYLIE, TX)
Colleges/universities with over 2000 students nearest to Lucas:
Collin County Community College District (about 6 miles; McKinney, TX ; Full-time enrollment: 18,044)
The University of Texas at Dallas (about 13 miles; Richardson, TX ; FT enrollment: 16,777)
Richland College (about 16 miles; Dallas, TX ; FT enrollment: 11,617)
Brookhaven College (about 20 miles; Farmers Branch, TX ; FT enrollment: 6,868)
Eastfield College (about 21 miles; Mesquite, TX ; FT enrollment: 8,323)
Southern Methodist University (about 22 miles; Dallas, TX ; FT enrollment: 9,150)
El Centro College (about 26 miles; Dallas, TX ; FT enrollment: 6,086)
Public high school in Lucas: LOVEJOY H S Students: 950, Location: 2350 ESTATES PKWY, Grades: 9-12)Private high school in Lucas: LUCAS CHRISTIAN ACADEMY Students: 355, Location: 415 W LUCAS RD, Grades: KG-12)
Public elementary/middle schools in Lucas: JOE V HART EL Students: 534, Location: 450 COUNTRY CLUB RD, Grades: PK-4)WILLOW SPRINGS MIDDLE Location: 1101 W LUCAS RD, Grades: 7-8)
See full list of schools located in Lucas Birthplace of: Casey Dick - Football player.
Collin County has a predicted average indoor radon screening level less than 2 pCi/L (pico curies per liter) - Low Potential Average household size: This city:
3.2 peopleTexas:
2.8 people
Percentage of family households: This city:
90.7%Whole state:
69.9%
Percentage of households with unmarried partners: This city:
2.4%Whole state:
6.0%
Likely homosexual households (counted as self-reported same-sex unmarried-partner households)
Lesbian couples: 0.3% of all households Gay men: 0.3% of all households
7 people in workers' group living quarters and job corps centers in 2010
For population 15 years and over in Lucas:
Never married: 21.2%Now married: 69.5%Separated: 0.0%Widowed: 1.6%Divorced: 7.8% For population 25 years and over in Lucas:
High school or higher: 99.3%Bachelor's degree or higher: 62.7%Graduate or professional degree: 19.7%Unemployed: 2.3%Mean travel time to work (commute): 17.2 minutes
Education Gini index (Inequality in education) Here:
7.3Texas average:
14.0
Religion statistics for Lucas, TX (based on Collin County data)
Religion Adherents Congregations Evangelical Protestant 184,331 334 Catholic 111,182 8 Mainline Protestant 59,022 60 Other 54,475 74 Black Protestant 1,014 8 Orthodox 190 1 None 372,127 -
Source: Clifford Grammich, Kirk Hadaway, Richard Houseal, Dale E.Jones, Alexei Krindatch, Richie Stanley and Richard H.Taylor. 2012. 2010 U.S.Religion Census: Religious Congregations & Membership Study. Association of Statisticians of American Religious Bodies. Jones, Dale E., et al. 2002. Congregations and Membership in the United States 2000. Nashville, TN: Glenmary Research Center. Graphs represent county-level data
Food Environment Statistics: Number of grocery stores : 77This county :
1.05 / 10,000 pop.Texas :
1.47 / 10,000 pop.
Number of supercenters and club stores : 13Collin County :
0.18 / 10,000 pop.Texas :
0.14 / 10,000 pop.
Number of convenience stores (no gas) : 53This county :
0.73 / 10,000 pop.Texas :
1.11 / 10,000 pop.
Number of convenience stores (with gas) : 215Collin County :
2.94 / 10,000 pop.Texas :
3.95 / 10,000 pop.
Number of full-service restaurants : 478Here :
6.54 / 10,000 pop.Texas :
6.13 / 10,000 pop.
Adult diabetes rate : Collin County :
7.3%Texas :
8.9%
Low-income preschool obesity rate : Collin County :
15.3%Texas :
15.7%
Health and Nutrition: Healthy diet rate : This city:
52.7%State:
48.6%
Average overall health of teeth and gums : People feeling badly about themselves : People not drinking alcohol at all : This city:
7.1%Texas:
10.3%
Average hours sleeping at night : General health condition : Average condition of hearing : More about Health and Nutrition of Lucas, TX Residents
Local government employment and payroll (March 2022)
Function
Full-time employees
Monthly full-time payroll
Average yearly full-time wage
Part-time employees
Monthly part-time payroll
Firefighters
14 $77,404 $66,346 44 $244,351 Other Government Administration
14 $159,373 $136,605 10 $23,518 Financial Administration
7 $30,516 $52,313 0 $0 Streets and Highways
6 $24,450 $48,900 0 $0 Water Supply
5 $17,451 $41,882 0 $0 Housing and Community Development (Local)
3 $14,216 $56,864 0 $0 Other and Unallocable
3 $13,154 $52,616 0 $0 Fire - Other
1 $11,313 $135,756 0 $0
Totals for Government
53 $347,877 $78,765 54 $267,869
Lucas government finances - Expenditure in 2017 (per resident):
Construction - Regular Highways: $1,207,000 ($142.65)
Water Utilities: $487,000 ($57.56)Current Operations - Water Utilities: $2,262,000 ($267.34)
Local Fire Protection: $1,550,000 ($183.19)Financial Administration: $449,000 ($53.07)Solid Waste Management: $392,000 ($46.33)Regular Highways: $339,000 ($40.07)Central Staff Services: $299,000 ($35.34)Protective Inspection and Regulation - Other: $279,000 ($32.97)General Public Buildings: $217,000 ($25.65)Parks and Recreation: $106,000 ($12.53)Judicial and Legal Services: $45,000 ($5.32)Health - Other: $34,000 ($4.02)General - Interest on Debt: $273,000 ($32.27)
Intergovernmental to Local - Other - Police Protection: $90,000 ($10.64)
Other Capital Outlay - Regular Highways: $115,000 ($13.59)
Water Utilities: $25,000 ($2.95)Total Salaries and Wages: $1,892,000 ($223.61)
Water Utilities - Interest on Debt: $153,000 ($18.08)
Lucas government finances - Revenue in 2017 (per resident):
Charges - Solid Waste Management: $455,000 ($53.78)
Sewerage: $36,000 ($4.25)Local Intergovernmental - Other: $108,000 ($12.76)
Miscellaneous - Fines and Forfeits: $91,000 ($10.76)
Rents: $77,000 ($9.10)General Revenue - Other: $48,000 ($5.67)Sale of Property: $43,000 ($5.08)Interest Earnings: $40,000 ($4.73)Donations From Private Sources: $38,000 ($4.49)Revenue - Water Utilities: $3,290,000 ($388.84)
State Intergovernmental - Other: $293,000 ($34.63)
Tax - Property: $2,988,000 ($353.15)
General Sales and Gross Receipts: $1,349,000 ($159.44)Other License: $686,000 ($81.08)Public Utilities Sales: $325,000 ($38.41)
Lucas government finances - Debt in 2017 (per resident):
Long Term Debt - Beginning Outstanding - Unspecified Public Purpose: $12,124,000 ($1432.93)
Outstanding Unspecified Public Purpose: $11,179,000 ($1321.24)Retired Unspecified Public Purpose: $945,000 ($111.69)
Lucas government finances - Cash and Securities in 2017 (per resident):
Bond Funds - Cash and Securities: $3,290,000 ($388.84)
Other Funds - Cash and Securities: $14,599,000 ($1725.45)
Sinking Funds - Cash and Securities: $1,079,000 ($127.53)
11.92% of this county's 2021 resident taxpayers lived in other counties in 2020 ($95,581 average adjusted gross income )
Here:
11.92%Texas average:
8.12%
0.01% of residents moved from foreign countries ($68 average AGI )Collin County:
0.01%Texas average:
0.04%
Top counties from which taxpayers relocated into this county between 2020 and 2021:
9.42% of this county's 2020 resident taxpayers moved to other counties in 2021 ($90,634 average adjusted gross income )
Here:
9.42%Texas average:
7.40%
0.01% of residents moved to foreign countries ($143 average AGI )Collin County:
0.01%Texas average:
0.03%
Top counties to which taxpayers relocated from this county between 2020 and 2021: Strongest AM radio stations in Lucas:
KAAM (770 AM; 10 kW; GARLAND, TX; Owner: DONTRON, INC.)
KRLD (1080 AM; 50 kW; DALLAS, TX; Owner: TEXAS INFINITY BROADCASTING L.P.)
KFXR (1190 AM; 50 kW; DALLAS, TX; Owner: CLEAR CHANNEL BROADCASTING LICENSES, INC.)
KMKI (620 AM; 5 kW; PLANO, TX; Owner: ABC, INC)
KSKY (660 AM; 20 kW; BALCH SPRINGS, TX; Owner: BISON MEDIA, INC.)
KBIS (1150 AM; 25 kW; HIGHLAND PARK, TX; Owner: DALLAS AM RADIO PARTNERS, L.P.)
KZMP (1540 AM; 50 kW; UNIVERSITY PARK, TX; Owner: ENTRAVISION HOLDINGS, LLC)
WBAP (820 AM; 50 kW; FORT WORTH, TX; Owner: WBAP-KSCS OPERATING, LTD.)
KESS (1270 AM; 50 kW; FORT WORTH, TX; Owner: KESS-AM LICENSE CORP.)
KAHZ (1360 AM; 50 kW; HURST, TX)
KTCK (1310 AM; 9 kW; DALLAS, TX; Owner: KRBE LICO, INC.)
KLIF (570 AM; 5 kW; DALLAS, TX; Owner: KLIF LICO, INC.)
KTNO (1440 AM; 12 kW; DENTON, TX; Owner: MORTENSON BROADCASTING COMPANY)
Strongest FM radio stations in Lucas:
WRR (101.1 FM; DALLAS, TX; Owner: CITY OF DALLAS, TEXAS)
KPLX (99.5 FM; FORT WORTH, TX; Owner: KPLX LICO, INC.)
KLUV-FM (98.7 FM; DALLAS, TX; Owner: INFINITY BROADCASTING CORPORATION OF DALLAS)
KESN (103.3 FM; ALLEN, TX; Owner: WBAP-KSCS OPERATING, LTD.)
KSOC (94.5 FM; GAINESVILLE, TX; Owner: RADIO ONE LICENSES, LLC)
KTPW (89.7 FM; SANGER, TX; Owner: RESEARCH EDUCATIONAL FOUNDATION, INC)
KLLI (105.3 FM; DALLAS, TX; Owner: INFINITY BROADCASTING CORPORATION OF DALLAS)
KLTY (94.9 FM; ARLINGTON, TX; Owner: INSPIRATION MEDIA OF TEXAS, LLC)
KRBV (100.3 FM; DALLAS, TX; Owner: INFINITY BROADCASTING CORP. OF FORT WORTH)
KOAI (107.5 FM; FORT WORTH, TX; Owner: INFINITY KOAI-FM, INC.)
KEGL (97.1 FM; FORT WORTH, TX; Owner: CITICASTERS LICENSES, L.P.)
KHKS (106.1 FM; DENTON, TX; Owner: AMFM TEXAS LICENSES LIMITED PARTNERSHIP)
KZPS (92.5 FM; DALLAS, TX; Owner: AMFM TEXAS LICENSES LIMITED PARTNERSHIP)
KVIL-FM (103.7 FM; HIGHLAND PARK-DALLAS, TX; Owner: INFINITY BROADCASTING CORPORATION OF TEXAS)
KKDA-FM (104.5 FM; DALLAS, TX; Owner: SERVICE BROADCASTING I, LTD.)
KXEZ (92.1 FM; FARMERSVILLE, TX; Owner: METRO BROADCASTERS-TEXAS, INC.)
KBFB (97.9 FM; DALLAS, TX; Owner: RADIO ONE LICENSES, LLC)
KSCS (96.3 FM; FORT WORTH, TX; Owner: WBAP-KSCS OPERATING, LTD.)
KTCY (104.9 FM; PILOT POINT, TX; Owner: ENTRAVISION HOLDINGS, LLC)
KLNO (94.1 FM; FORT WORTH, TX; Owner: HBC LICENSE CORPORATION)
TV broadcast stations around Lucas:
KTAQ (Channel 47; GREENVILLE, TX; Owner: MIKE SIMONS)
KLDT (Channel 55; LAKE DALLAS, TX; Owner: JOHNSON BROADCASTING OF DALLAS, INC.)
KLEG-LP (Channel 44; DALLAS, TX; Owner: DILIP VISWANATH)
KJJM-LP (Channel 46; DALLAS/MESQUITE, TX; Owner: JANE McGINNIS)
KTVT (Channel 11; FORT WORTH, TX; Owner: CBS STATIONS GROUP OF TEXAS L.P.)
KXAS-TV (Channel 5; FORT WORTH, TX; Owner: STATION VENTURE OPERATIONS, LP)
KDTN (Channel 2; DENTON, TX; Owner: NORTH TEXAS PUBLIC BROADCASTING, INC.)
KMPX (Channel 29; DECATUR, TX; Owner: WORD OF GOD FELLOWSHIP, INC.)
KTXA (Channel 21; FORT WORTH, TX; Owner: VIACOM TELEVISION STATIONS GROUP OF DALLAS/FORT WORTH L.P.)
KUVN (Channel 23; GARLAND, TX; Owner: KUVN LICENSE PARTNERSHIP, L.P.)
KSTR-TV (Channel 49; IRVING, TX; Owner: TELEFUTURA DALLAS LLC)
KPXD (Channel 68; ARLINGTON, TX; Owner: PAXSON DALLAS LICENSE, INC.)
KERA-TV (Channel 13; DALLAS, TX; Owner: NORTH TEXAS PUBLIC BROADCASTING, INC.)
WFAA-TV (Channel 8; DALLAS, TX; Owner: WFAA-TV, L.P.)
KDAF (Channel 33; DALLAS, TX; Owner: TRIBUNE TELEVISION COMPANY)
KXTX-TV (Channel 39; DALLAS, TX; Owner: TELEMUNDO OF TEXAS PARTNERSHIP, LP)
KDTX-TV (Channel 58; DALLAS, TX; Owner: TRINITY BROADCASTING OF TEXAS, INC.)
KDFW (Channel 4; DALLAS, TX; Owner: KDFW LICENSE, INC.)
KDFI (Channel 27; DALLAS, TX; Owner: NEW DMIC, INC.)
K26HF (Channel 26; BRITTON, TX; Owner: MAKO COMMUNICATIONS, LLC)
KHPK-LP (Channel 28; DE SOTO, TX; Owner: MAKO COMMUNICATIONS, LLC)
KNOK-LP (Channel 43; GREENVILLE, TX; Owner: IGLESIA JESU CHRISTO ES MI REFUGIO, INC.)
National Bridge Inventory (NBI) Statistics 11 Number of bridges758ft / 231m Total length $2,000 Total costs61,166 Total average daily traffic3,161 Total average daily truck traffic86,255 Total future (year 2031) average daily traffic
New bridges - historical statistics
2 1950-1959 1 1980-1989 1 1990-1999 3 2000-2009 3 2010-2019 1 2020-2022
See full National Bridge Inventory statistics for Lucas, TX
FCC Registered Antenna Towers: 26 (
See the full list of FCC Registered Antenna Towers in Lucas )
FCC Registered Commercial Land Mobile Towers: 1
Stinson Rd 1.5 Mi S (Lat: 33.064000 Lon: -96.584167), Structure height: 96 m, Call Sign: KPJ732, Licensee ID: L01689557, Assigned Frequencies: 450.980 MHz, Grant Date: 05/10/1988, Expiration Date: 08/01/2013, Cancellation Date: 11/16/2012, Registrant: Pacificstar Media Ii Corporation, C/O Jeffrey L. Timmons, Esq. 1110 Whitehawk Trail, Lawrenceville, GA 30043-7158 FCC Registered Broadcast Land Mobile Towers: 2
State Hwy 1378 At Water Tower (Lat: 33.085389 Lon: -96.580833), Call Sign: WQU365, Assigned Frequencies: 37.1800 MHz, Grant Date: 07/03/2000, Expiration Date: 10/18/2005, Cancellation Date: 01/07/2006, Registrant: City Of Lucas, 151 Country Club Rd, Lucas, TX 75002, Phone: (972) 727-8999 Lat: 33.102278 Lon: -96.612833, Call Sign: WRCD468, Assigned Frequencies: 457.287 MHz, 456.587 MHz, 457.062 MHz, 457.112 MHz, 456.637 MHz, Grant Date: 09/04/2018, Expiration Date: 09/04/2028, Certifier: Cecile Poe, Registrant: Cara Enterprises, Inc, Las Vegas, NV 89140-0124, Phone: (702) 838-9728, Fax: (702) 363-4607, Email:
FCC Registered Microwave Towers: 5
Lat: 33.116778 Lon: -96.600250, Overall height: 2.4 m, Call Sign: WPNM469, Assigned Frequencies: 956.381 MHz, Grant Date: 03/23/2018, Expiration Date: 04/10/2028, Registrant: City Of Lucas, Texas, 665 Country Club Road, Lucas, TX 75002, Phone: (972) 912-1210, Fax: (972) 727-0091, Email:
DLS0451, 1655 Stinson Road (Lat: 33.063889 Lon: -96.584167), Type: Tower, Structure height: 138.4 m, Overall height: 144.5 m, Call Sign: WQDM906, Licensee ID: L01728370, Assigned Frequencies: 19640.0 MHz, Grant Date: 10/04/2005, Expiration Date: 10/04/2015, Cancellation Date: 09/16/2013, Certifier: Joseph M Sandri Jr., Registrant: Fibertower Network Services, Corp., Debtor-In-Possession, 1875 Eye Street, Nw, 5th Floor, Room 505, Washington, DC 20006, Phone: (202) 223-1028, Email:
MCGARITY, 2295 Mcgarity Lane (Lat: 33.093444 Lon: -96.612250), Type: Tank, Structure height: 45.7 m, Overall height: 47.2 m, Call Sign: WQNX859, Assigned Frequencies: 19390.0 MHz, 19390.0 MHz, 19390.0 MHz, 19390.0 MHz, 19390.0 MHz, 19390.0 MHz, 19390.0 MHz, 19390.0 MHz, 19390.0 MHz, 19390.0 MHz... (+5 more), Grant Date: 06/15/2021, Expiration Date: 06/30/2031, Certifier: Kris Mcelroy, Registrant: Micronet Communications, Inc., 812 Lexington Dr, Plano, TX 75075, Phone: (972) 422-7200, Email:
LUW, 1440 Winningkoff Rd (Lat: 33.111639 Lon: -96.565111), Type: Ltower, Structure height: 51.8 m, Call Sign: WQOH382, Assigned Frequencies: 18060.0 MHz, 18060.0 MHz, 18060.0 MHz, 18060.0 MHz, 18060.0 MHz, 18060.0 MHz, 18060.0 MHz, 18060.0 MHz, 18060.0 MHz, 18060.0 MHz... (+112 more), Grant Date: 10/05/2021, Expiration Date: 09/27/2031, Certifier: Kris Mcelroy, Registrant: Micronet Communications, Inc., 812 Lexington Dr, Plano, TX 75075, Phone: (972) 422-7200, Email:
LSL, Municipal City Water Tower (Lat: 33.074528 Lon: -96.556639), Type: Tank, Structure height: 48.8 m, Overall height: 53.3 m, Call Sign: WQZY938, Assigned Frequencies: 19540.0 MHz, 19540.0 MHz, 19540.0 MHz, 19540.0 MHz, 19540.0 MHz, 19540.0 MHz, 19540.0 MHz, 19540.0 MHz, 19540.0 MHz, 19540.0 MHz... (+19 more), Grant Date: 09/12/2017, Expiration Date: 09/12/2027, Certifier: Derrick Whitlock, Registrant: Micronet Communications, Inc., 812 Lexington Dr, Plano, TX 75075, Phone: (972) 422-7200, Email:
FCC Registered Paging Towers: 1
1655 Stinson Road (Lat: 33.063889 Lon: -96.584167), Type: Tower, Structure height: 138.4 m, Overall height: 144.5 m, Call Sign: KNKL415, Assigned Frequencies: 931.687 MHz, Grant Date: 06/11/1999, Expiration Date: 04/01/2009, Cancellation Date: 05/23/2009, Certifier: Shawn E Endsley, Registrant: Usa Mobility Wireless, Inc., 300 Technology Drive #400, Plano, TX 75074, Phone: (972) 801-1626, Fax: (972) 801-1699, Email:
FCC Registered Amateur Radio Licenses: 103 (
See the full list of FCC Registered Amateur Radio Licenses in Lucas )
FAA Registered Aircraft: 17 (
See the full list of FAA Registered Aircraft in Lucas )
Home Mortgage Disclosure Act Aggregated Statistics For Year 2009(Based on 5 partial tracts) A) FHA, FSA/RHS & VA B) Conventional C) Refinancings D) Home Improvement Loans F) Non-occupant Loans on G) Loans On Manufactured Number Average Value Number Average Value Number Average Value Number Average Value Number Average Value Number Average Value
LOANS ORIGINATED 72 $198,463 198 $228,551 504 $211,787 15 $73,591 13 $165,618 1 $43,200 APPLICATIONS APPROVED, NOT ACCEPTED 2 $239,595 18 $222,938 39 $196,847 2 $37,960 0 $0 1 $30,190 APPLICATIONS DENIED 7 $205,963 22 $199,777 110 $233,497 18 $58,972 5 $142,722 2 $42,035 APPLICATIONS WITHDRAWN 7 $211,421 27 $264,288 89 $216,908 3 $135,373 2 $127,650 0 $0 FILES CLOSED FOR INCOMPLETENESS 1 $274,950 5 $305,960 20 $251,370 1 $92,950 1 $148,960 0 $0
Aggregated Statistics For Year 2008(Based on 5 partial tracts) A) FHA, FSA/RHS & VA B) Conventional C) Refinancings D) Home Improvement Loans F) Non-occupant Loans on G) Loans On Manufactured Number Average Value Number Average Value Number Average Value Number Average Value Number Average Value Number Average Value
LOANS ORIGINATED 55 $198,469 269 $217,394 154 $208,643 27 $62,433 19 $169,549 7 $34,159 APPLICATIONS APPROVED, NOT ACCEPTED 2 $148,210 33 $240,363 21 $190,092 7 $47,761 2 $120,300 2 $37,575 APPLICATIONS DENIED 7 $192,583 34 $200,690 83 $190,033 26 $55,063 4 $133,792 2 $42,095 APPLICATIONS WITHDRAWN 8 $200,075 38 $228,222 41 $199,200 4 $63,362 3 $126,773 1 $26,550 FILES CLOSED FOR INCOMPLETENESS 2 $146,340 7 $240,789 9 $221,548 2 $54,085 1 $81,130 0 $0
Aggregated Statistics For Year 2007(Based on 5 partial tracts) A) FHA, FSA/RHS & VA B) Conventional C) Refinancings D) Home Improvement Loans F) Non-occupant Loans on G) Loans On Manufactured Number Average Value Number Average Value Number Average Value Number Average Value Number Average Value Number Average Value
LOANS ORIGINATED 21 $188,737 428 $191,960 133 $190,216 41 $47,299 26 $160,410 3 $38,617 APPLICATIONS APPROVED, NOT ACCEPTED 1 $222,020 57 $190,916 25 $187,962 12 $39,929 3 $196,513 2 $44,200 APPLICATIONS DENIED 3 $161,223 75 $204,006 99 $185,378 28 $41,514 9 $247,650 11 $35,273 APPLICATIONS WITHDRAWN 1 $264,870 49 $202,118 53 $196,053 5 $58,662 3 $267,670 0 $0 FILES CLOSED FOR INCOMPLETENESS 0 $0 8 $259,538 20 $226,438 1 $104,580 1 $181,210 0 $0
Aggregated Statistics For Year 2006(Based on 5 partial tracts) A) FHA, FSA/RHS & VA B) Conventional C) Refinancings D) Home Improvement Loans F) Non-occupant Loans on G) Loans On Manufactured Number Average Value Number Average Value Number Average Value Number Average Value Number Average Value Number Average Value
LOANS ORIGINATED 21 $178,141 637 $171,070 104 $189,590 35 $53,122 52 $141,611 1 $110,970 APPLICATIONS APPROVED, NOT ACCEPTED 2 $180,325 83 $173,680 22 $188,975 11 $42,631 9 $142,707 0 $0 APPLICATIONS DENIED 2 $197,830 91 $190,655 83 $180,165 33 $53,578 13 $170,922 2 $41,675 APPLICATIONS WITHDRAWN 2 $265,935 75 $179,227 54 $196,672 6 $48,202 7 $192,729 0 $0 FILES CLOSED FOR INCOMPLETENESS 0 $0 16 $198,935 25 $218,665 1 $157,440 4 $199,785 0 $0
Aggregated Statistics For Year 2005(Based on 5 partial tracts) A) FHA, FSA/RHS & VA B) Conventional C) Refinancings D) Home Improvement Loans F) Non-occupant Loans on G) Loans On Manufactured Number Average Value Number Average Value Number Average Value Number Average Value Number Average Value Number Average Value
LOANS ORIGINATED 23 $172,352 578 $147,140 169 $171,936 36 $52,662 48 $119,098 1 $68,490 APPLICATIONS APPROVED, NOT ACCEPTED 0 $0 64 $149,892 27 $172,106 10 $37,515 6 $113,840 1 $23,840 APPLICATIONS DENIED 3 $171,083 80 $139,428 89 $161,174 27 $33,061 9 $146,129 2 $53,740 APPLICATIONS WITHDRAWN 3 $169,647 78 $149,943 88 $183,845 9 $245,967 7 $139,033 0 $0 FILES CLOSED FOR INCOMPLETENESS 0 $0 12 $175,596 19 $188,838 1 $74,790 2 $107,480 0 $0
Aggregated Statistics For Year 2004(Based on 5 partial tracts) A) FHA, FSA/RHS & VA B) Conventional C) Refinancings D) Home Improvement Loans F) Non-occupant Loans on G) Loans On Manufactured Number Average Value Number Average Value Number Average Value Number Average Value Number Average Value Number Average Value
LOANS ORIGINATED 38 $156,994 491 $142,043 234 $167,038 23 $49,169 20 $133,850 0 $0 APPLICATIONS APPROVED, NOT ACCEPTED 1 $154,360 55 $156,637 34 $173,629 6 $52,295 3 $196,727 0 $0 APPLICATIONS DENIED 4 $149,372 60 $143,192 105 $154,068 23 $43,350 6 $165,037 1 $77,440 APPLICATIONS WITHDRAWN 9 $151,563 72 $162,868 101 $168,336 2 $67,410 5 $150,562 0 $0 FILES CLOSED FOR INCOMPLETENESS 1 $85,540 13 $164,452 16 $165,082 1 $26,260 1 $188,740 0 $0
Aggregated Statistics For Year 2003(Based on 5 partial tracts) A) FHA, FSA/RHS & VA B) Conventional C) Refinancings D) Home Improvement Loans F) Non-occupant Loans on Number Average Value Number Average Value Number Average Value Number Average Value Number Average Value
LOANS ORIGINATED 66 $152,385 408 $145,541 671 $160,371 24 $44,863 14 $133,056 APPLICATIONS APPROVED, NOT ACCEPTED 2 $182,165 47 $138,777 73 $147,128 10 $61,824 3 $154,337 APPLICATIONS DENIED 5 $144,744 38 $150,353 154 $157,417 22 $35,014 4 $158,748 APPLICATIONS WITHDRAWN 12 $150,537 70 $149,127 113 $171,355 2 $44,155 2 $115,535 FILES CLOSED FOR INCOMPLETENESS 1 $112,410 10 $153,056 17 $180,908 0 $0 0 $0
Aggregated Statistics For Year 2002(Based on 2 partial tracts) A) FHA, FSA/RHS & VA B) Conventional C) Refinancings D) Home Improvement Loans F) Non-occupant Loans on Number Average Value Number Average Value Number Average Value Number Average Value Number Average Value
LOANS ORIGINATED 13 $156,099 198 $164,127 181 $196,704 13 $43,249 5 $119,220 APPLICATIONS APPROVED, NOT ACCEPTED 0 $0 14 $143,412 16 $183,054 5 $31,770 1 $77,830 APPLICATIONS DENIED 1 $80,270 16 $185,486 30 $209,833 6 $45,965 1 $468,870 APPLICATIONS WITHDRAWN 4 $147,015 33 $188,234 26 $200,218 1 $93,360 0 $0 FILES CLOSED FOR INCOMPLETENESS 1 $74,090 6 $214,230 8 $212,850 0 $0 0 $0
Aggregated Statistics For Year 2001(Based on 2 partial tracts) A) FHA, FSA/RHS & VA B) Conventional C) Refinancings D) Home Improvement Loans F) Non-occupant Loans on Number Average Value Number Average Value Number Average Value Number Average Value Number Average Value
LOANS ORIGINATED 25 $156,258 208 $161,175 113 $194,660 15 $35,873 4 $169,465 APPLICATIONS APPROVED, NOT ACCEPTED 1 $168,950 15 $150,541 8 $199,168 4 $29,000 0 $0 APPLICATIONS DENIED 2 $110,110 13 $114,232 19 $172,162 5 $44,306 0 $0 APPLICATIONS WITHDRAWN 6 $154,108 33 $167,999 16 $154,252 1 $54,450 0 $0 FILES CLOSED FOR INCOMPLETENESS 1 $59,500 4 $177,932 2 $197,110 0 $0 0 $0
Aggregated Statistics For Year 2000(Based on 2 partial tracts) A) FHA, FSA/RHS & VA B) Conventional C) Refinancings D) Home Improvement Loans F) Non-occupant Loans on Number Average Value Number Average Value Number Average Value Number Average Value Number Average Value
LOANS ORIGINATED 11 $149,442 117 $170,367 17 $203,356 14 $45,506 3 $159,037 APPLICATIONS APPROVED, NOT ACCEPTED 0 $0 6 $150,958 3 $177,933 2 $23,575 0 $0 APPLICATIONS DENIED 0 $0 9 $121,261 4 $170,915 4 $33,022 0 $0 APPLICATIONS WITHDRAWN 1 $153,980 14 $163,753 3 $167,080 1 $20,210 0 $0 FILES CLOSED FOR INCOMPLETENESS 0 $0 3 $175,000 1 $300,670 0 $0 0 $0
Aggregated Statistics For Year 1999(Based on 3 partial tracts) A) FHA, FSA/RHS & VA B) Conventional C) Refinancings D) Home Improvement Loans Number Average Value Number Average Value Number Average Value Number Average Value
LOANS ORIGINATED 10 $137,421 104 $153,200 31 $146,426 12 $34,733 APPLICATIONS APPROVED, NOT ACCEPTED 0 $0 10 $98,249 6 $168,300 3 $56,363 APPLICATIONS DENIED 1 $113,450 12 $122,146 9 $121,086 4 $27,042 APPLICATIONS WITHDRAWN 2 $136,260 8 $159,926 8 $142,752 1 $23,690 FILES CLOSED FOR INCOMPLETENESS 0 $0 1 $176,910 2 $134,740 0 $0
Detailed HMDA statistics for the following Tracts:
0313.05
, 0313.06 , 0314.01 , 0314.03
Private Mortgage Insurance Companies Aggregated Statistics For Year 2009(Based on 5 partial tracts) A) Conventional B) Refinancings Number Average Value Number Average Value
LOANS ORIGINATED 27 $255,685 18 $209,588 APPLICATIONS APPROVED, NOT ACCEPTED 8 $300,472 7 $274,300 APPLICATIONS DENIED 3 $262,463 4 $258,872 APPLICATIONS WITHDRAWN 2 $270,775 3 $239,890 FILES CLOSED FOR INCOMPLETENESS 1 $177,470 0 $0
Aggregated Statistics For Year 2008(Based on 5 partial tracts) A) Conventional B) Refinancings C) Non-occupant Loans on Number Average Value Number Average Value Number Average Value
LOANS ORIGINATED 75 $247,846 18 $218,355 4 $166,068 APPLICATIONS APPROVED, NOT ACCEPTED 20 $264,184 6 $226,353 1 $162,330 APPLICATIONS DENIED 4 $290,488 0 $0 1 $247,690 APPLICATIONS WITHDRAWN 2 $305,480 1 $153,590 0 $0 FILES CLOSED FOR INCOMPLETENESS 1 $277,060 0 $0 1 $133,590
Aggregated Statistics For Year 2007(Based on 5 partial tracts) A) Conventional B) Refinancings C) Non-occupant Loans on Number Average Value Number Average Value Number Average Value
LOANS ORIGINATED 51 $231,548 12 $200,418 3 $237,353 APPLICATIONS APPROVED, NOT ACCEPTED 10 $236,831 3 $209,930 1 $181,950 APPLICATIONS DENIED 2 $238,890 0 $0 0 $0 APPLICATIONS WITHDRAWN 3 $215,077 1 $155,630 0 $0 FILES CLOSED FOR INCOMPLETENESS 0 $0 0 $0 0 $0
Aggregated Statistics For Year 2006(Based on 5 partial tracts) A) Conventional B) Refinancings C) Non-occupant Loans on Number Average Value Number Average Value Number Average Value
LOANS ORIGINATED 31 $219,743 7 $182,614 3 $161,763 APPLICATIONS APPROVED, NOT ACCEPTED 8 $212,026 3 $258,830 0 $0 APPLICATIONS DENIED 1 $185,420 0 $0 0 $0 APPLICATIONS WITHDRAWN 2 $195,940 1 $272,300 0 $0 FILES CLOSED FOR INCOMPLETENESS 0 $0 0 $0 0 $0
Aggregated Statistics For Year 2005(Based on 5 partial tracts) A) Conventional B) Refinancings C) Non-occupant Loans on Number Average Value Number Average Value Number Average Value
LOANS ORIGINATED 29 $200,900 12 $201,163 3 $192,170 APPLICATIONS APPROVED, NOT ACCEPTED 9 $215,318 4 $234,168 1 $196,420 APPLICATIONS DENIED 1 $125,180 1 $534,360 0 $0 APPLICATIONS WITHDRAWN 2 $285,255 0 $0 0 $0 FILES CLOSED FOR INCOMPLETENESS 0 $0 0 $0 0 $0
Aggregated Statistics For Year 2004(Based on 5 partial tracts) A) Conventional B) Refinancings C) Non-occupant Loans on Number Average Value Number Average Value Number Average Value
LOANS ORIGINATED 51 $187,033 24 $180,911 5 $158,664 APPLICATIONS APPROVED, NOT ACCEPTED 13 $196,414 11 $182,465 1 $218,410 APPLICATIONS DENIED 1 $267,880 0 $0 0 $0 APPLICATIONS WITHDRAWN 4 $188,702 2 $165,355 1 $151,850 FILES CLOSED FOR INCOMPLETENESS 0 $0 0 $0 0 $0
Aggregated Statistics For Year 2003(Based on 5 partial tracts) A) Conventional B) Refinancings C) Non-occupant Loans on Number Average Value Number Average Value Number Average Value
LOANS ORIGINATED 70 $181,029 58 $172,599 4 $160,498 APPLICATIONS APPROVED, NOT ACCEPTED 12 $199,309 13 $175,982 1 $152,670 APPLICATIONS DENIED 2 $140,795 2 $187,090 0 $0 APPLICATIONS WITHDRAWN 4 $183,648 4 $189,952 1 $87,470 FILES CLOSED FOR INCOMPLETENESS 1 $89,010 0 $0 0 $0
Aggregated Statistics For Year 2002(Based on 2 partial tracts) A) Conventional B) Refinancings C) Non-occupant Loans on Number Average Value Number Average Value Number Average Value
LOANS ORIGINATED 28 $195,900 9 $190,592 0 $0 APPLICATIONS APPROVED, NOT ACCEPTED 7 $216,983 2 $262,595 0 $0 APPLICATIONS DENIED 1 $100,850 1 $177,750 0 $0 APPLICATIONS WITHDRAWN 3 $227,950 1 $163,530 1 $85,690 FILES CLOSED FOR INCOMPLETENESS 1 $213,670 0 $0 0 $0
Aggregated Statistics For Year 2001(Based on 2 partial tracts) A) Conventional B) Refinancings C) Non-occupant Loans on Number Average Value Number Average Value Number Average Value
LOANS ORIGINATED 33 $186,482 5 $188,972 1 $72,410 APPLICATIONS APPROVED, NOT ACCEPTED 4 $238,928 1 $231,630 0 $0 APPLICATIONS DENIED 1 $304,970 1 $246,600 0 $0 APPLICATIONS WITHDRAWN 0 $0 0 $0 0 $0 FILES CLOSED FOR INCOMPLETENESS 0 $0 0 $0 0 $0
Aggregated Statistics For Year 2000(Based on 2 partial tracts) A) Conventional B) Refinancings C) Non-occupant Loans on Number Average Value Number Average Value Number Average Value
LOANS ORIGINATED 24 $192,682 0 $0 1 $105,150 APPLICATIONS APPROVED, NOT ACCEPTED 4 $177,090 1 $206,560 0 $0 APPLICATIONS DENIED 1 $147,810 0 $0 0 $0 APPLICATIONS WITHDRAWN 0 $0 0 $0 0 $0 FILES CLOSED FOR INCOMPLETENESS 0 $0 0 $0 0 $0
Aggregated Statistics For Year 1999(Based on 3 partial tracts) A) Conventional B) Refinancings Number Average Value Number Average Value
LOANS ORIGINATED 19 $182,692 4 $159,988 APPLICATIONS APPROVED, NOT ACCEPTED 3 $189,363 0 $0 APPLICATIONS DENIED 0 $0 0 $0 APPLICATIONS WITHDRAWN 1 $97,000 0 $0 FILES CLOSED FOR INCOMPLETENESS 0 $0 0 $0
Detailed PMIC statistics for the following Tracts:
0313.05
, 0313.06 , 0314.01 , 0314.03 Lucas compared to Texas state average:
Median household income significantly above state average. Median house value significantly above state average. Unemployed percentage significantly below state average. Black race population percentage significantly below state average. Median age significantly above state average. Renting percentage significantly below state average. Length of stay since moving in significantly above state average. Number of rooms per house significantly above state average. House age significantly below state average. Percentage of population with a bachelor's degree or higher significantly above state average.
#2 on the list of "Top 101 cities with largest percentage of males in industries: information (population 5,000+)"
#7 on the list of "Top 101 cities with largest percentage of females in occupations: education, training, and library occupations (population 5,000+)"
#38 on the list of "Top 101 cities with largest percentage of females in industries: finance and insurance (population 5,000+)"
#39 on the list of "Top 101 cities with largest percentage of females in industries: management of companies and enterprises (population 5,000+)"
#44 on the list of "Top 101 cities with largest percentage of males in occupations: management occupations (population 5,000+)"
#68 on the list of "Top 101 cities with most building permits per 10,000 residents (population 5,000+)"
#95 on the list of "Top 101 cities with the lowest percentage of single-parent households, population 5,000+"
#6 on the list of "Top 101 counties with the lowest number of deaths per 1000 residents 2007-2013 (pop. 50,000+)"
#10 on the list of "Top 101 counties with the largest number of children under 18 without health insurance coverage in 2000 (pop. 50,000+)"
#21 on the list of "Top 101 counties with the highest surface withdrawal of fresh water for public supply"
#28 on the list of "Top 101 counties with the largest decrease in the number of births per 1000 residents 2000-2006 to 2007-2013 (pop 50,000+)"
#28 on the list of "Top 101 counties with the largest increase in the number of deaths per 1000 residents 2000-2006 to 2007-2013 (pop. 50,000+)"
Top Patent Applicants
David R. Brown (34)
Robert F. Payne (24)
Robert A. Clavenna (20)
Robert Floyd Payne (18)
Simon Joshua Jacobs (13)
John F. Schreck (13)
Peter R. Harper (11)
Mark A. Gerber (11)
Robert A. Clavenna, Ii (11)
Daniel G. Roper (9)
Total of 349 patent applications in 2008-2024.

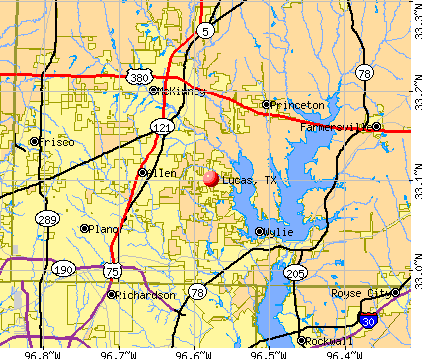


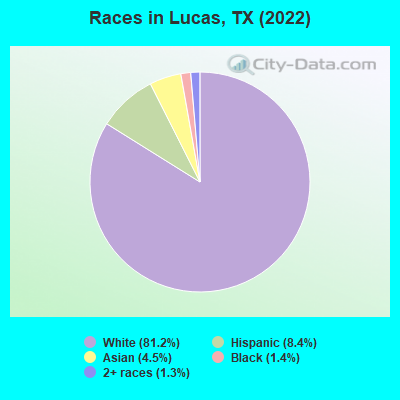
 Recent articles from our blog. Our writers, many of them Ph.D. graduates or candidates, create easy-to-read articles on a wide variety of topics.

 (7.5 miles
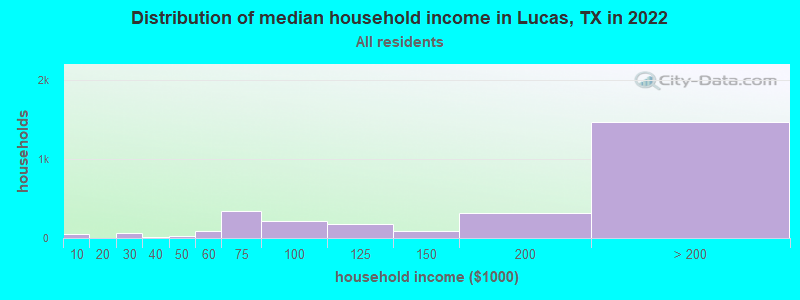
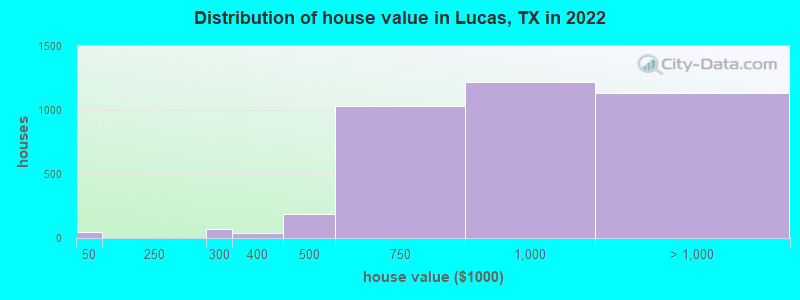

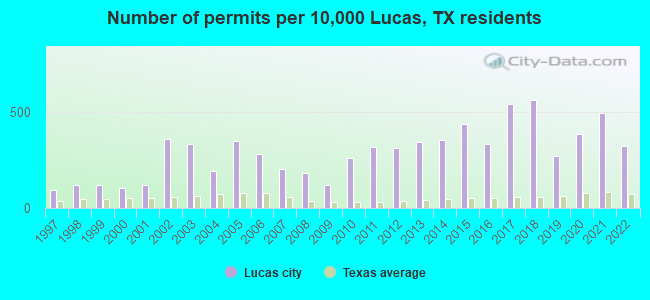
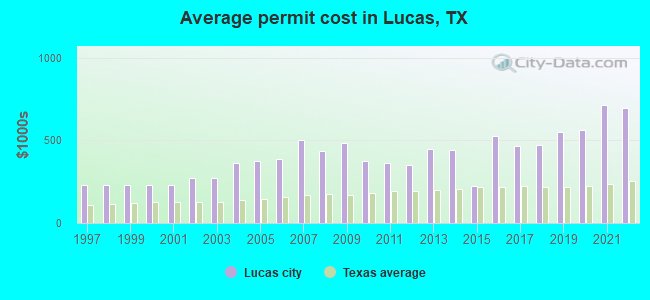
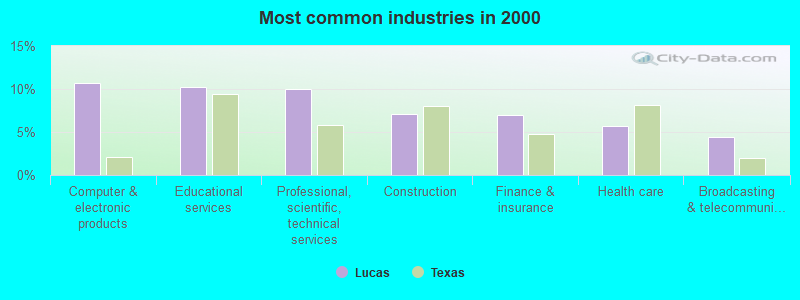
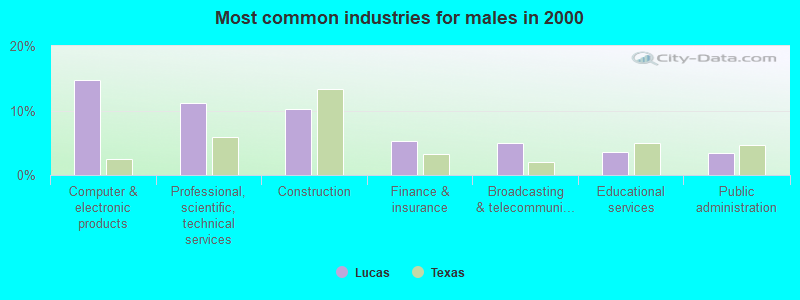
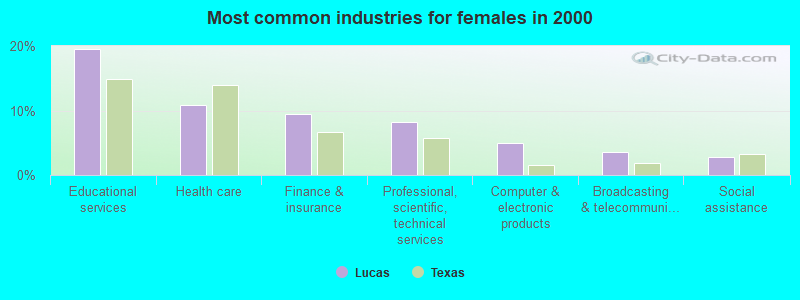
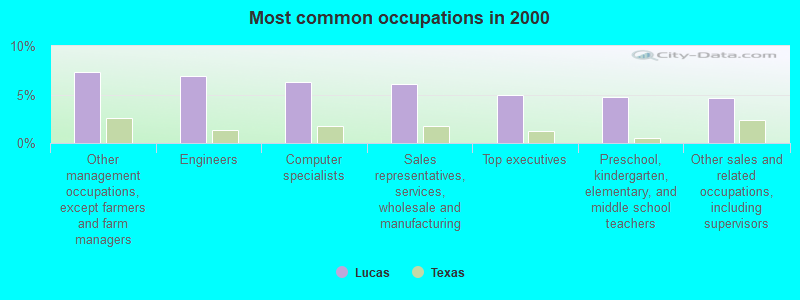
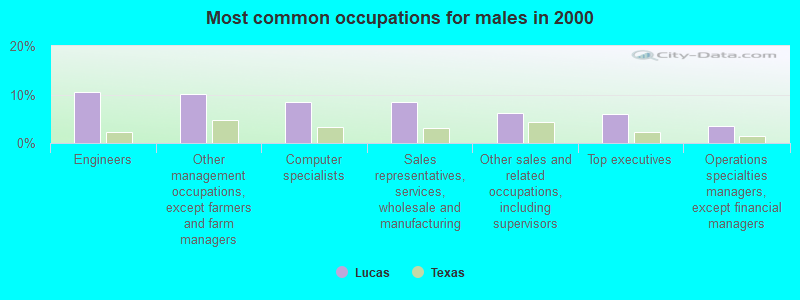
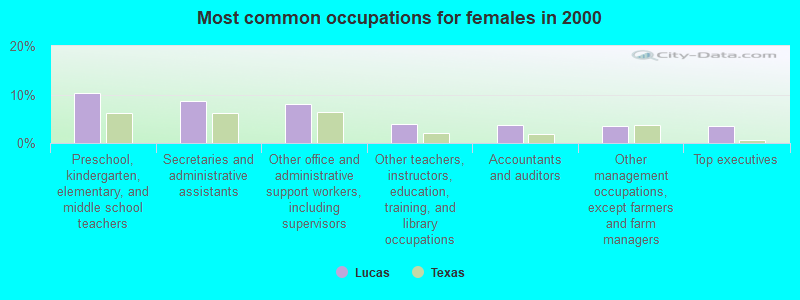
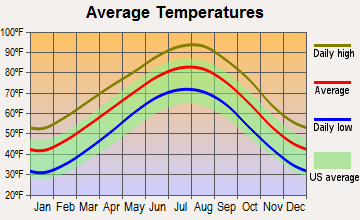
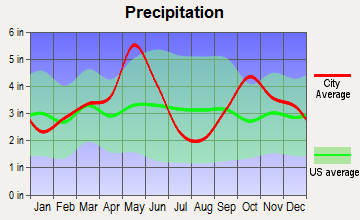
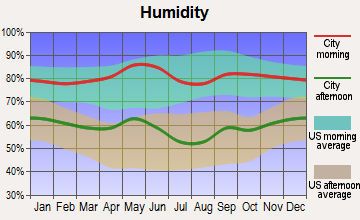
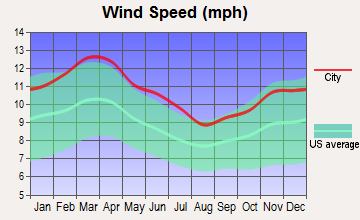
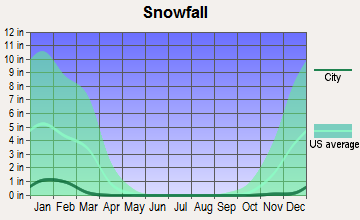
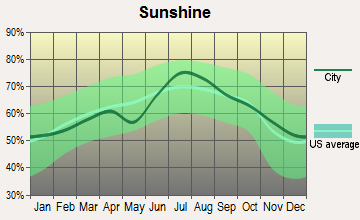
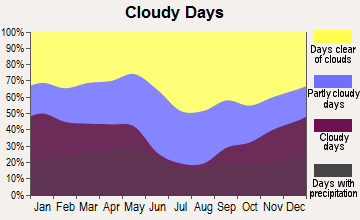
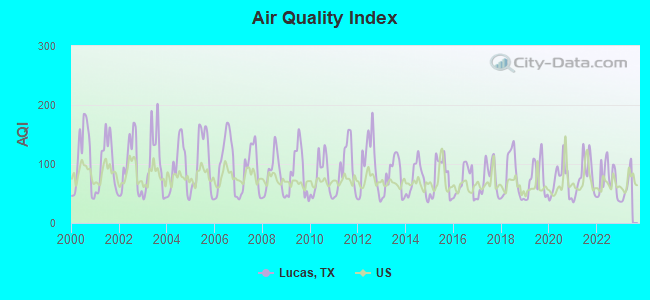
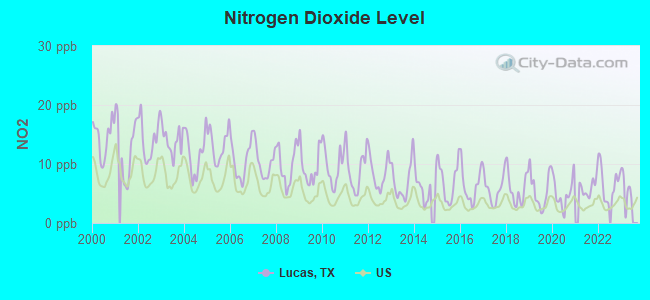
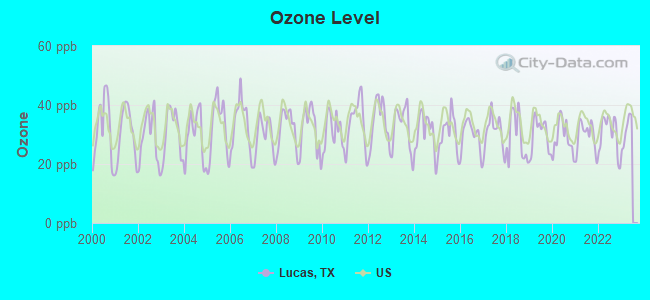
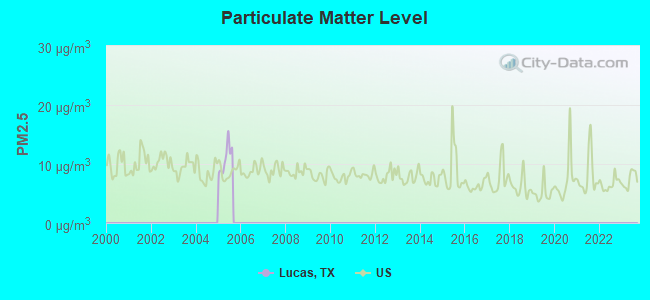
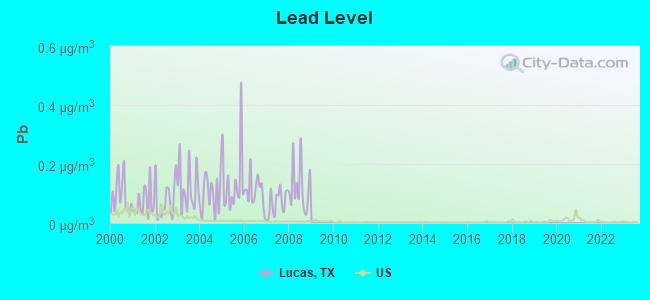

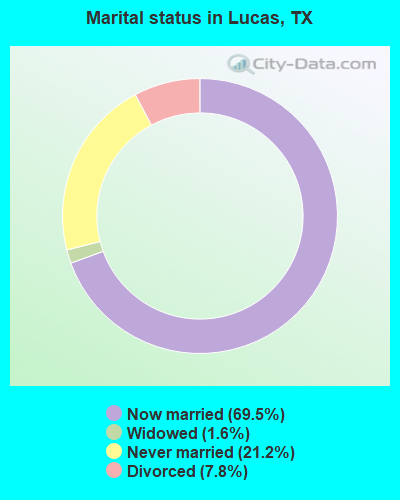
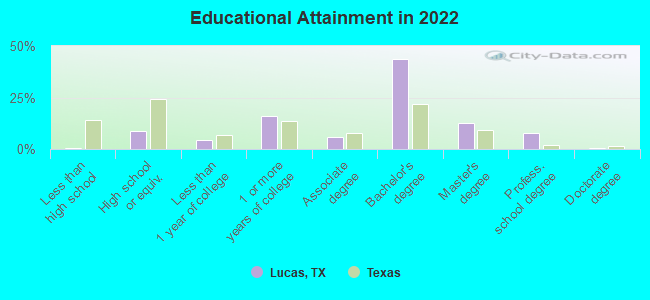
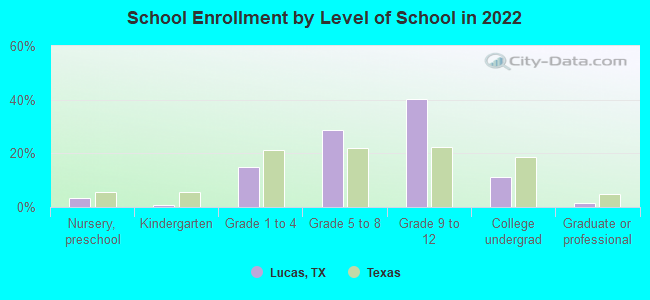
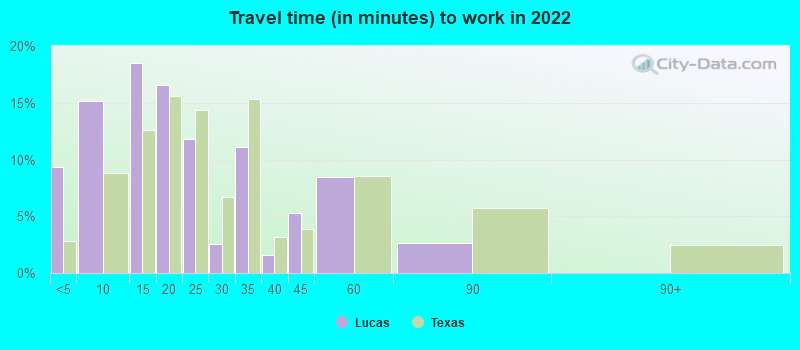
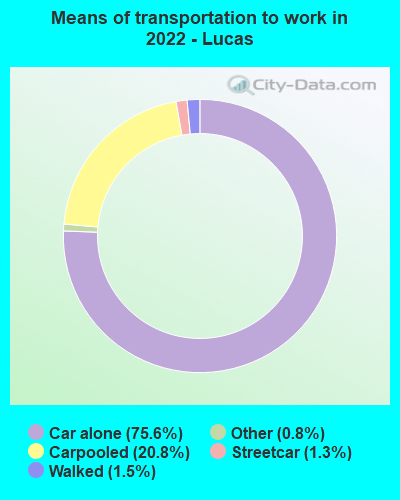
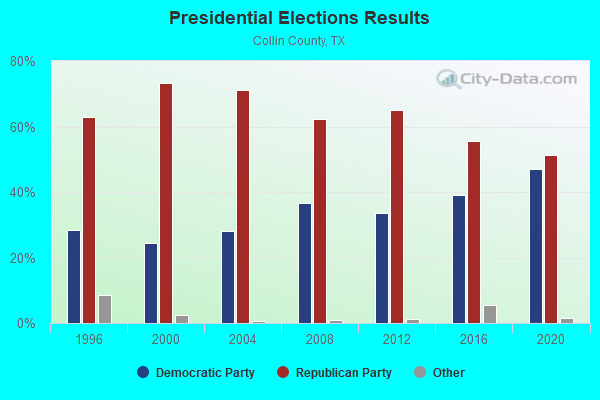
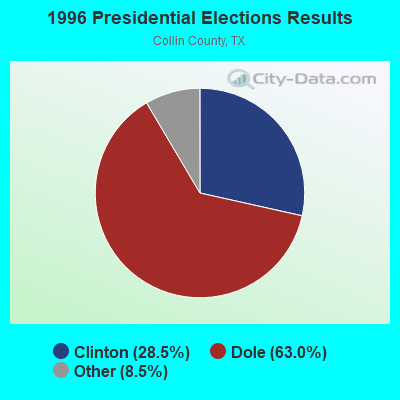
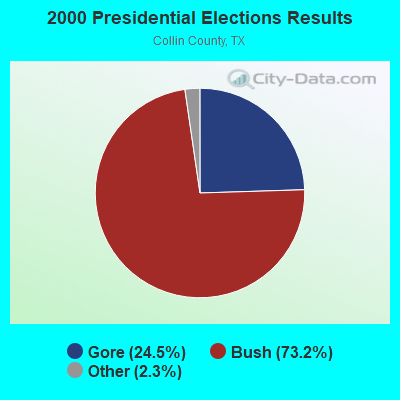
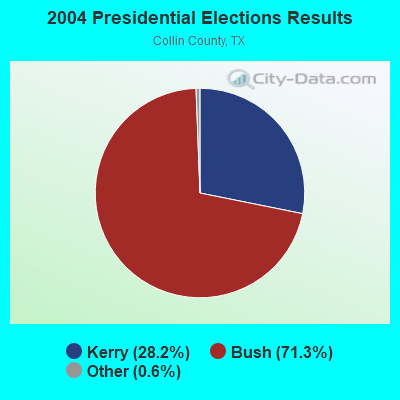
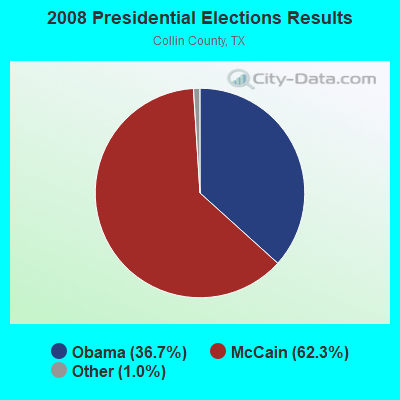
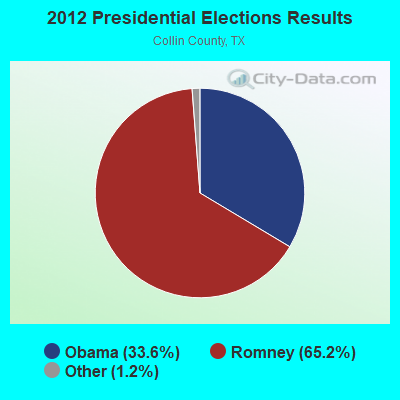
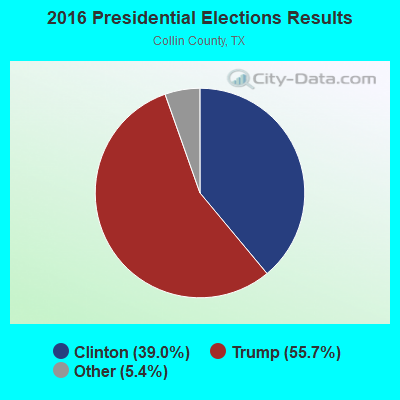
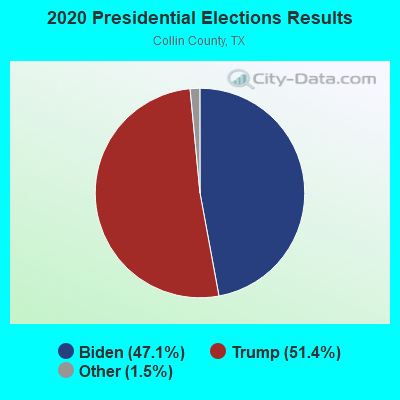
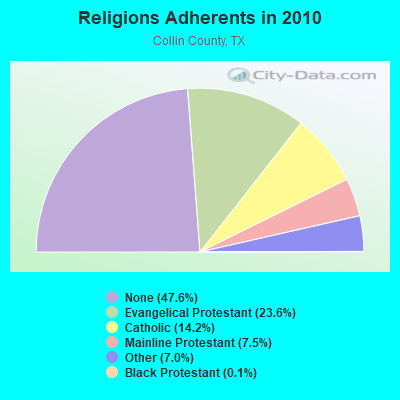
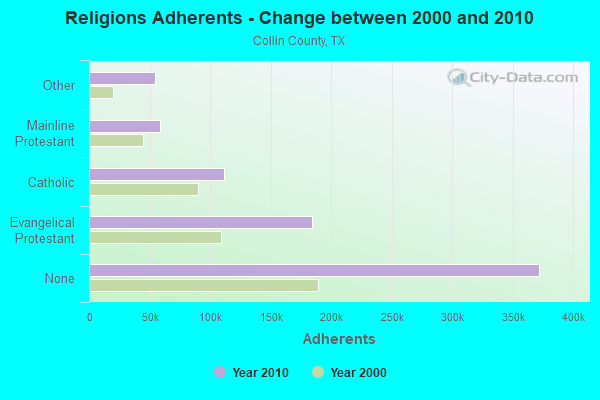
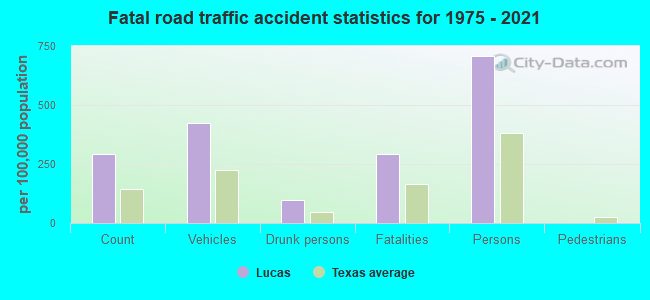
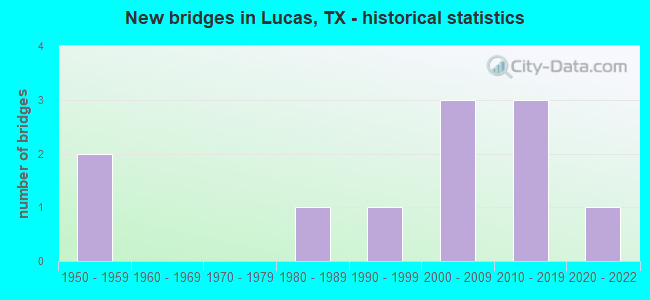
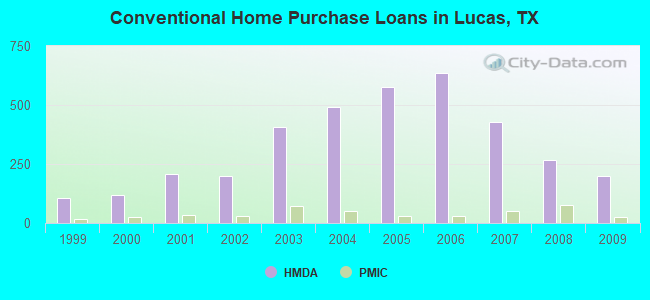
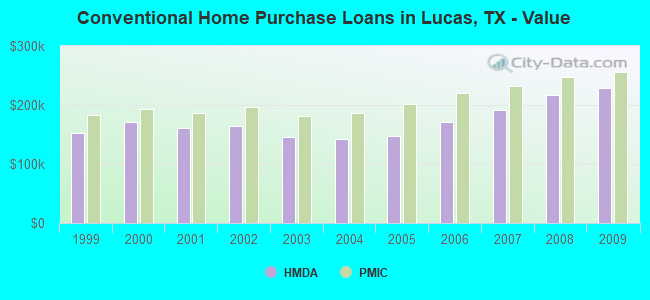
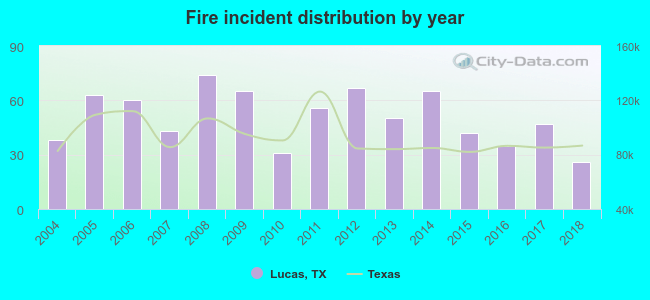 According to the data from the years 2004 - 2018 the average number of fire incidents per year is 51. The highest number of reported fires - 74 took place in 2008, and the least - 26 in 2018. The data has a dropping trend.
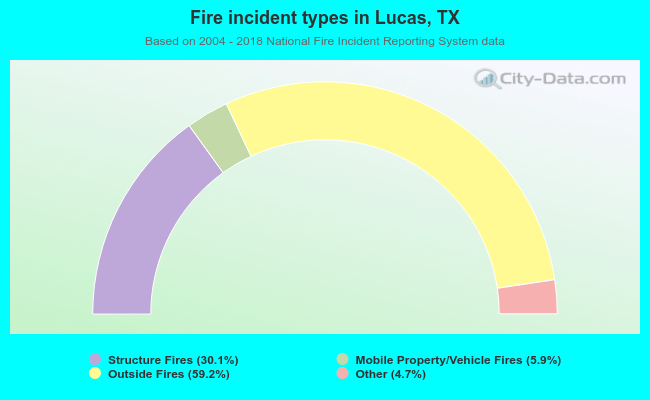 When looking into fire subcategories, the most reports belonged to: Outside Fires (59.2%), and Structure Fires (30.1%).