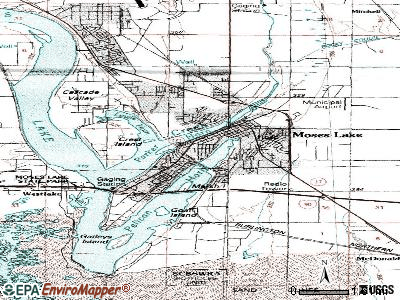
Moses Lake, Washington
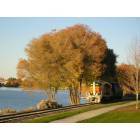
Moses Lake: Moses Lake view from Cascade Valley
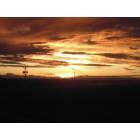
Moses Lake: Sunset on Moses Lake
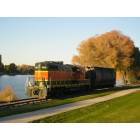
Moses Lake: Train-Downtown Moses Lake along Lake
Moses Lake: Train-Downtown Moses Lake along Lake
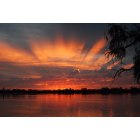
Moses Lake: moses lake sunset
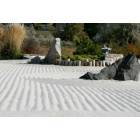
Moses Lake: Japanese Gardens
Moses Lake: End of August Sunrise
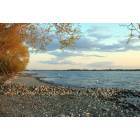
Moses Lake: Fall in Moses Lake
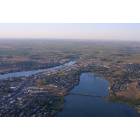
Moses Lake: The city of Moses Lake from a hot air balloon
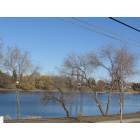
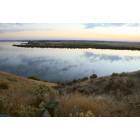
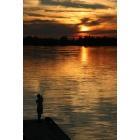
Moses Lake: the lake
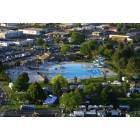
Moses Lake: Moses Lake Aquatic Center. User comment: park has expanded - old pic
- see
15
more - add
your
Submit your own pictures of this city and show them to the world
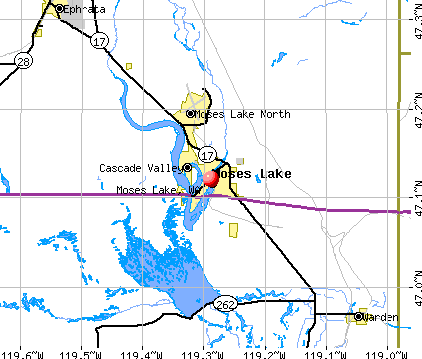
- OSM Map
- General Map
- Google Map
- MSN Map
Population change since 2000: +73.1%
| Males: 12,245 | |
| Females: 13,643 |
| Median resident age: | 31.8 years |
| Washington median age: | 38.4 years |
Zip codes: 98837.
| Moses Lake: | $63,657 |
| WA: | $91,306 |
Estimated per capita income in 2022: $32,036 (it was $16,644 in 2000)
Moses Lake city income, earnings, and wages data
Estimated median house or condo value in 2022: $284,982 (it was $89,800 in 2000)
| Moses Lake: | $284,982 |
| WA: | $569,500 |
Mean prices in 2022: all housing units: $322,556; detached houses: $375,549; townhouses or other attached units: $363,887; in 2-unit structures: $630,893; in 3-to-4-unit structures: $509,178; in 5-or-more-unit structures: $256,743; mobile homes: $183,554; occupied boats, rvs, vans, etc.: $236,485
Median gross rent in 2022: $1,204.
(10.9% for White Non-Hispanic residents, 6.0% for Black residents, 14.0% for Hispanic or Latino residents, 5.4% for other race residents, 11.6% for two or more races residents)
Detailed information about poverty and poor residents in Moses Lake, WA


Compare current foreclosures in Moses Lake, WA:
| Photo | Address | Area | Beds / Baths | Price | Details |
|---|---|---|---|---|---|

|
#1
W Texas St
Moses Lake, WA 98837
|
1,060 sq. feet
|
1 baths 3 beds |
$161,000
|
show details |

|
#2
S Gibby Rd
Moses Lake, WA 98837
|
696 sq. feet
|
1 baths 2 beds |
show details | |

|
#3
N Mary St
Moses Lake, WA 98837
|
1,008 sq. feet
|
1 baths 2 beds |
show details | |

|
#4
N Central Dr
Moses Lake, WA 98837
|
1,200 sq. feet
|
1 baths 2 beds |
show details | |

|
#5
W Electra St
Moses Lake, WA 98837
|
- sq. feet
|
2 baths 3 beds |
show details | |

|
#6
S Turnagain Ct
Moses Lake, WA 98837
|
1,976 sq. feet
|
3 baths 3 beds |
show details | |

|
#7
Doolittle Dr
Moses Lake, WA 98837
|
1,036 sq. feet
|
1 baths 3 beds |
show details | |

|
#8
N Grape Dr
Moses Lake, WA 98837
|
1,633 sq. feet
|
2 baths 3 beds |
show details | |

|
#9
Rd H.1 NE
Moses Lake, WA 98837
|
1,040 sq. feet
|
2 baths 4 beds |
show details | |

|
#10
S Garden Dr
Moses Lake, WA 98837
|
2,201 sq. feet
|
2 baths 3 beds |
show details |
| Photo | Address | Area | Beds / Baths | Price | Details |
|---|---|---|---|---|---|

|
#11
W Basin St
Moses Lake, WA 98837
|
1,261 sq. feet
|
1 baths 2 beds |
show details | |

|
#12
Space St NE
Moses Lake, WA 98837
|
- sq. feet
|
1 baths 2 beds |
show details | |

|
#13
N Central Dr
Moses Lake, WA 98837
|
1,200 sq. feet
|
1 baths 2 beds |
show details | |

|
#14
Space St NE
Moses Lake, WA 98837
|
952 sq. feet
|
1 baths 2 beds |
show details | |

|
#15
S Eastlake Dr
Moses Lake, WA 98837
|
2,742 sq. feet
|
3 baths 5 beds |
show details | |

|
#16
S Turnagin Ct
Moses Lake, WA 98837
|
1,976 sq. feet
|
2 baths 3 beds |
show details | |

|
#17
Stratford Rd NE
Moses Lake, WA 98837
|
1,536 sq. feet
|
1 baths 3 beds |
show details | |

|
#18
Bouldercrest Rd NE
Moses Lake, WA 98837
|
1,680 sq. feet
|
2 baths 3 beds |
show details | |

|
#19
E Hill Ave
Moses Lake, WA 98837
|
1,404 sq. feet
|
1 baths 3 beds |
show details | |

|
#20
Doolittle Dr
Moses Lake, WA 98837
|
1,036 sq. feet
|
1 baths 3 beds |
show details |
| Photo | Address | Area | Beds / Baths | Price | Details |
|---|---|---|---|---|---|

|
#21
Carswell Dr
Moses Lake, WA 98837
|
1,161 sq. feet
|
1 baths 3 beds |
show details | |

|
#22
Pershing Rd
Moses Lake, WA 98837
|
1,064 sq. feet
|
1 baths 3 beds |
show details | |

|
#23
S Skyline Dr
Moses Lake, WA 98837
|
1,248 sq. feet
|
2 baths 3 beds |
show details | |

|
#24
W Peninsula Dr
Moses Lake, WA 98837
|
1,380 sq. feet
|
1 baths 3 beds |
show details | |

|
#25
Arlington Dr
Moses Lake, WA 98837
|
1,064 sq. feet
|
1 baths 3 beds |
show details | |

|
#26
Arnold Dr
Moses Lake, WA 98837
|
1,064 sq. feet
|
1 baths 3 beds |
show details | |

|
#27
W Craig St
Moses Lake, WA 98837
|
1,551 sq. feet
|
1 baths 3 beds |
show details | |

|
#28
Kinder Rd NE
Moses Lake, WA 98837
|
1,152 sq. feet
|
2 baths 2 beds |
show details | |

|
#29
Castle Dr
Moses Lake, WA 98837
|
2,231 sq. feet
|
1 baths 3 beds |
show details | |

|
#30
W Peninsula Dr
Moses Lake, WA 98837
|
1,448 sq. feet
|
2 baths 3 beds |
show details |
| Photo | Address | Area | Beds / Baths | Price | Details |
|---|---|---|---|---|---|

|
#31
Loring Dr
Moses Lake, WA 98837
|
1,855 sq. feet
|
1 baths 4 beds |
show details | |

|
#32
W Cascade Ave
Moses Lake, WA 98837
|
1,182 sq. feet
|
1 baths 2 beds |
show details | |

|
#33
W Texas St
Moses Lake, WA 98837
|
1,415 sq. feet
|
1 baths 3 beds |
show details | |

|
#34
W Steven Ln
Moses Lake, WA 98837
|
1,176 sq. feet
|
1 baths 3 beds |
show details | |

|
#35
S Crestmont Dr
Moses Lake, WA 98837
|
3,375 sq. feet
|
3 baths 4 beds |
show details | |

|
#36
Goodrich Rd SE
Moses Lake, WA 98837
|
2,724 sq. feet
|
2 baths 6 beds |
show details | |

|
#37
Road K NE
Moses Lake, WA 98837
|
- sq. feet
|
2 baths 3 beds |
show details | |

|
#38
N Mattson Dr
Moses Lake, WA 98837
|
- sq. feet
|
- baths - beds |
show details | |

|
#39
W Broadway Ave Unit 202
Moses Lake, WA 98837
|
- sq. feet
|
- baths - beds |
show details | |

|
#40
N Grape Dr Apt D301
Moses Lake, WA 98837
|
- sq. feet
|
- baths - beds |
show details |
| Photo | Address | Area | Beds / Baths | Price | Details |
|---|---|---|---|---|---|

|
#41
Road H NE Unit 25
Moses Lake, WA 98837
|
- sq. feet
|
- baths - beds |
show details | |

|
#42
Road 4 NE
Moses Lake, WA 98837
|
- sq. feet
|
- baths - beds |
show details | |

|
#43
Owens Rd Unit 13
Moses Lake, WA 98837
|
- sq. feet
|
- baths - beds |
show details | |

|
#44
Nelson Rd NE # B210
Moses Lake, WA 98837
|
- sq. feet
|
- baths - beds |
show details | |

|
#45
Road 6.7 NE
Moses Lake, WA 98837
|
- sq. feet
|
- baths - beds |
show details | |

|
#46
Badger St
Moses Lake, WA 98837
|
- sq. feet
|
- baths - beds |
show details | |

|
#47
W Wapato Dr Unit 8
Moses Lake, WA 98837
|
- sq. feet
|
- baths - beds |
show details | |

|
#48
Goodrich Rd Se, # A
Moses Lake, WA 98837
|
- sq. feet
|
- baths - beds |
show details | |

|
#49
W 6th Ave Apt C1
Moses Lake, WA 98837
|
- sq. feet
|
- baths - beds |
show details | |

|
Check over 1 million property listings on Foreclosure.com!
|
browse all offers | |||


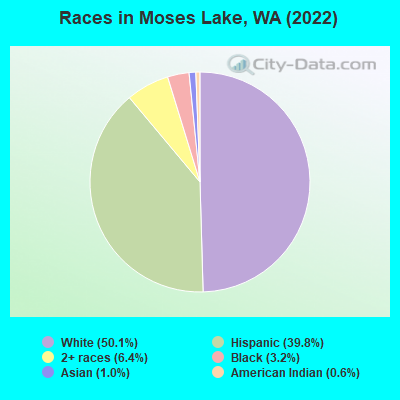
- 12,87350.1%White alone
- 10,24339.8%Hispanic
- 1,6546.4%Two or more races
- 8343.2%Black alone
- 2511.0%Asian alone
- 1590.6%American Indian alone
- 90.04%Other race alone
Races in Moses Lake detailed stats: ancestries, foreign born residents, place of birth
According to our research of Washington and other state lists, there were 35 registered sex offenders living in Moses Lake, Washington as of April 27, 2024.
The ratio of all residents to sex offenders in Moses Lake is 643 to 1.
Type |
2009 |
2010 |
2011 |
2012 |
2013 |
2014 |
2015 |
2016 |
2017 |
2018 |
2019 |
2020 |
2021 |
2022 |
|---|---|---|---|---|---|---|---|---|---|---|---|---|---|---|
| Murders (per 100,000) | 0 (0.0) | 0 (0.0) | 1 (4.8) | 1 (4.7) | 0 (0.0) | 1 (4.6) | 1 (4.5) | 1 (4.5) | 0 (0.0) | 1 (4.2) | 0 (0.0) | 0 (0.0) | 3 (12.1) | 2 (7.8) |
| Rapes (per 100,000) | 23 (119.7) | 13 (63.8) | 9 (43.5) | 13 (61.7) | 19 (88.7) | 22 (101.9) | 21 (95.3) | 13 (58.1) | 16 (69.6) | 12 (50.5) | 4 (16.3) | 2 (8.2) | 9 (36.4) | 9 (35.0) |
| Robberies (per 100,000) | 21 (109.3) | 18 (88.4) | 17 (82.2) | 27 (128.2) | 29 (135.5) | 21 (97.3) | 29 (131.7) | 12 (53.6) | 18 (78.3) | 9 (37.9) | 16 (65.3) | 18 (73.4) | 19 (76.9) | 25 (97.2) |
| Assaults (per 100,000) | 54 (281.0) | 52 (255.3) | 42 (203.0) | 55 (261.1) | 55 (256.9) | 57 (264.1) | 60 (272.4) | 88 (393.3) | 96 (417.7) | 59 (248.3) | 73 (298.1) | 73 (297.7) | 77 (311.8) | 98 (381.2) |
| Burglaries (per 100,000) | 275 (1,431) | 297 (1,458) | 279 (1,349) | 291 (1,382) | 329 (1,537) | 281 (1,302) | 270 (1,226) | 262 (1,171) | 164 (713.5) | 173 (728.0) | 143 (583.9) | 127 (517.9) | 178 (720.8) | 193 (750.7) |
| Thefts (per 100,000) | 1,116 (5,808) | 1,130 (5,548) | 1,117 (5,400) | 1,120 (5,317) | 1,140 (5,325) | 1,055 (4,889) | 1,127 (5,117) | 1,000 (4,470) | 838 (3,646) | 811 (3,413) | 567 (2,315) | 695 (2,834) | 966 (3,912) | 1,103 (4,290) |
| Auto thefts (per 100,000) | 99 (515.2) | 85 (417.4) | 73 (352.9) | 109 (517.5) | 106 (495.1) | 125 (579.2) | 161 (731.0) | 103 (460.4) | 85 (369.8) | 72 (303.0) | 68 (277.7) | 81 (330.3) | 110 (445.5) | 103 (400.6) |
| Arson (per 100,000) | 6 (31.2) | 4 (19.6) | 2 (9.7) | 11 (52.2) | 4 (18.7) | 8 (37.1) | 3 (13.6) | 5 (22.3) | 2 (8.7) | 3 (12.6) | 3 (12.2) | 5 (20.4) | 7 (28.3) | 13 (50.6) |
| City-Data.com crime index | 558.5 | 486.1 | 448.4 | 500.4 | 523.2 | 505.9 | 528.3 | 447.8 | 388.1 | 321.6 | 248.0 | 264.1 | 381.5 | 405.2 |
The City-Data.com crime index weighs serious crimes and violent crimes more heavily. Higher means more crime, U.S. average is 246.1. It adjusts for the number of visitors and daily workers commuting into cities.
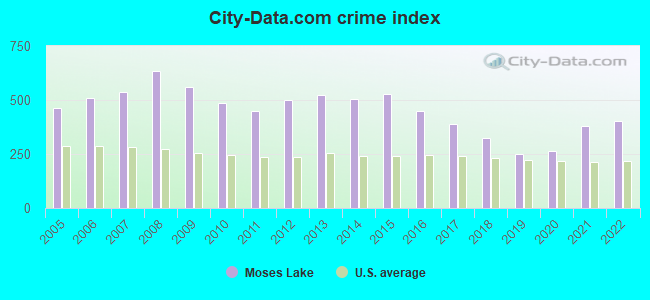
Crime rate in Moses Lake detailed stats: murders, rapes, robberies, assaults, burglaries, thefts, arson
Full-time law enforcement employees in 2021, including police officers: 50 (42 officers - 40 male; 2 female).
| Officers per 1,000 residents here: | 1.70 |
| Washington average: | 1.35 |
 Recent articles from our blog. Our writers, many of them Ph.D. graduates or candidates, create easy-to-read articles on a wide variety of topics.

 | Noise from Sand Dunes from Moses Lake (9 replies) |
| Noise from Sand Dunes from Moses Lake (3 replies) |
| Salmon Creek vs. Fishers Landing (222 replies) |
| ‘Their Crisis’ Is ‘Our Problem’: Washington Grapples With Idaho Covid Cases (132 replies) |
| Are you ready for Electricity and Natural Gas to increase too? (31 replies) |
| Moses Lake Drug Problem? (2 replies) |
Latest news from Moses Lake, WA collected exclusively by city-data.com from local newspapers, TV, and radio stations
Ancestries: American (6.6%), German (5.7%), English (4.6%), Irish (2.1%), Ukrainian (2.0%), Norwegian (1.5%).
Current Local Time: PST time zone
Incorporated in 1938
Elevation: 1060 feet
Land area: 10.2 square miles.
Population density: 2,543 people per square mile (average).
2,548 residents are foreign born (8.2% Latin America).
| This city: | 9.9% |
| Washington: | 14.9% |
Median real estate property taxes paid for housing units with mortgages in 2022: $2,327 (0.7%)
Median real estate property taxes paid for housing units with no mortgage in 2022: $2,205 (0.9%)
Nearest city with pop. 50,000+: Kennewick, WA  (63.8 miles , pop. 54,693).
Nearest city with pop. 200,000+: East Seattle, WA (139.1 miles , pop. 480,100).
Nearest city with pop. 1,000,000+: Los Angeles, CA (902.8 miles , pop. 3,694,820).
Nearest cities:
), ), ), ), Latitude: 47.12 N, Longitude: 119.29 W
Daytime population change due to commuting: +4,006 (+15.6%)
Workers who live and work in this city: 7,491 (63.4%)
Area code: 509
Moses Lake, Washington accommodation & food services, waste management - Economy and Business Data
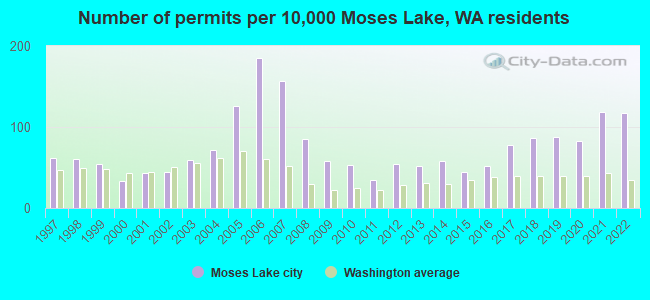
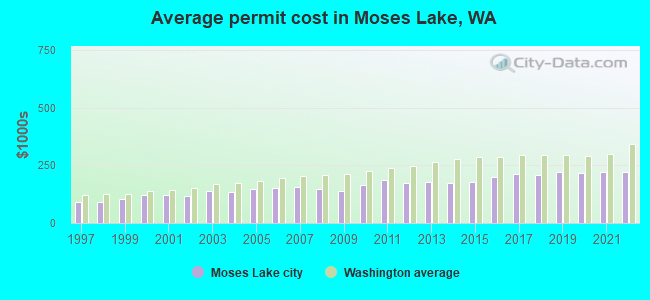
Single-family new house construction building permits:
- 2022: 175 buildings, average cost: $219,600
- 2021: 178 buildings, average cost: $219,700
- 2020: 124 buildings, average cost: $219,200
- 2019: 132 buildings, average cost: $221,400
- 2018: 130 buildings, average cost: $209,900
- 2017: 117 buildings, average cost: $212,400
- 2016: 78 buildings, average cost: $197,800
- 2015: 66 buildings, average cost: $178,200
- 2014: 86 buildings, average cost: $174,500
- 2013: 78 buildings, average cost: $179,700
- 2012: 81 buildings, average cost: $172,200
- 2011: 52 buildings, average cost: $186,800
- 2010: 79 buildings, average cost: $167,200
- 2009: 87 buildings, average cost: $140,300
- 2008: 127 buildings, average cost: $145,600
- 2007: 235 buildings, average cost: $155,300
- 2006: 277 buildings, average cost: $150,600
- 2005: 189 buildings, average cost: $146,800
- 2004: 106 buildings, average cost: $134,000
- 2003: 88 buildings, average cost: $138,900
- 2002: 67 buildings, average cost: $118,400
- 2001: 64 buildings, average cost: $120,800
- 2000: 50 buildings, average cost: $121,800
- 1999: 81 buildings, average cost: $104,300
- 1998: 89 buildings, average cost: $91,900
- 1997: 93 buildings, average cost: $92,100
| Here: | 6.9% |
| Washington: | 4.6% |
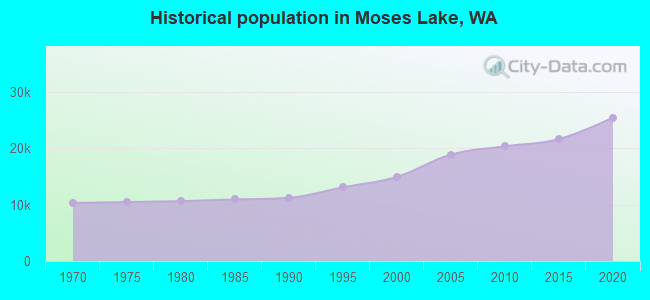
Population change in the 1990s: +2,896 (+24.0%).
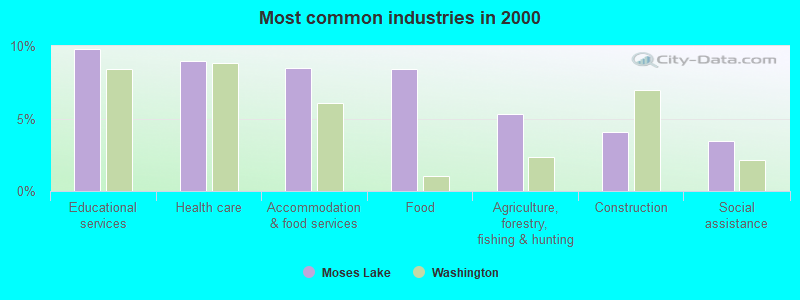
- Educational services (9.8%)
- Health care (9.0%)
- Accommodation & food services (8.5%)
- Food (8.4%)
- Agriculture, forestry, fishing & hunting (5.3%)
- Construction (4.1%)
- Social assistance (3.4%)
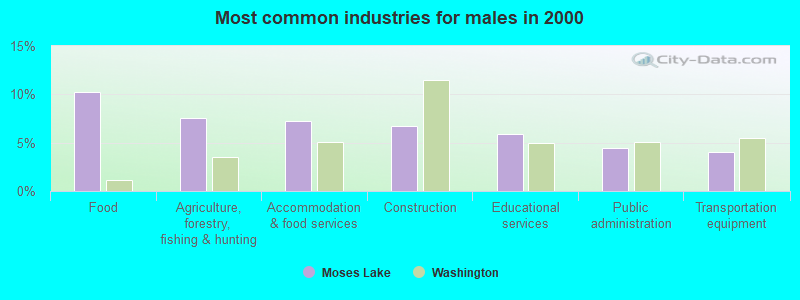
- Food (10.2%)
- Agriculture, forestry, fishing & hunting (7.5%)
- Accommodation & food services (7.2%)
- Construction (6.7%)
- Educational services (5.9%)
- Public administration (4.5%)
- Transportation equipment (4.1%)
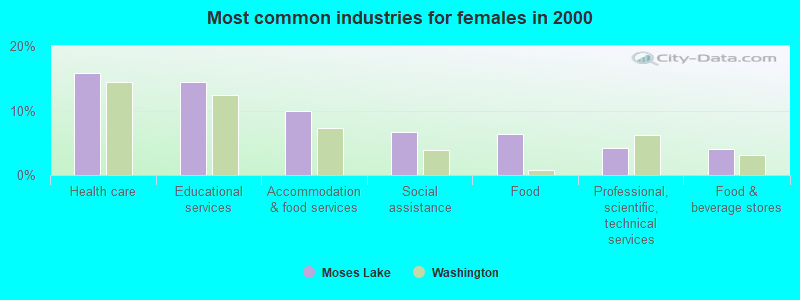
- Health care (15.8%)
- Educational services (14.4%)
- Accommodation & food services (10.0%)
- Social assistance (6.6%)
- Food (6.3%)
- Professional, scientific, technical services (4.2%)
- Food & beverage stores (4.1%)
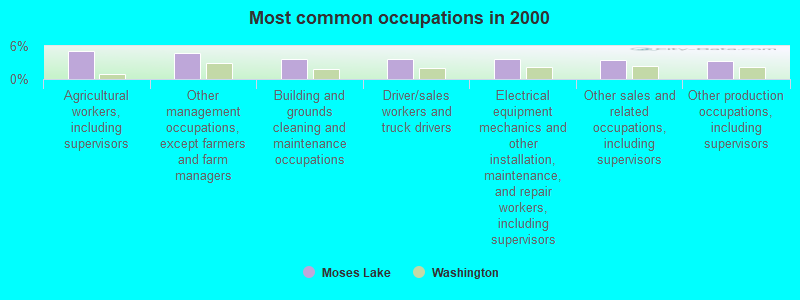
- Agricultural workers, including supervisors (5.1%)
- Other management occupations, except farmers and farm managers (4.8%)
- Building and grounds cleaning and maintenance occupations (3.7%)
- Driver/sales workers and truck drivers (3.6%)
- Electrical equipment mechanics and other installation, maintenance, and repair workers, including supervisors (3.6%)
- Other sales and related occupations, including supervisors (3.5%)
- Other production occupations, including supervisors (3.3%)
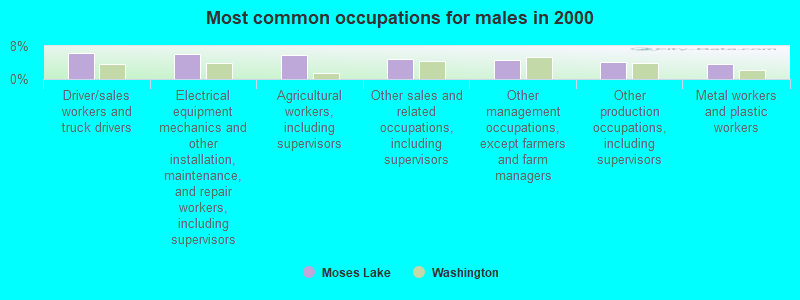
- Driver/sales workers and truck drivers (6.2%)
- Electrical equipment mechanics and other installation, maintenance, and repair workers, including supervisors (6.2%)
- Agricultural workers, including supervisors (5.8%)
- Other sales and related occupations, including supervisors (4.8%)
- Other management occupations, except farmers and farm managers (4.6%)
- Other production occupations, including supervisors (4.1%)
- Metal workers and plastic workers (3.6%)
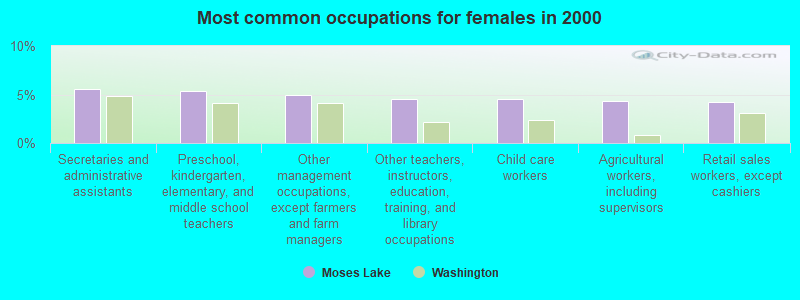
- Secretaries and administrative assistants (5.5%)
- Preschool, kindergarten, elementary, and middle school teachers (5.3%)
- Other management occupations, except farmers and farm managers (5.0%)
- Other teachers, instructors, education, training, and library occupations (4.5%)
- Child care workers (4.5%)
- Agricultural workers, including supervisors (4.3%)
- Retail sales workers, except cashiers (4.2%)
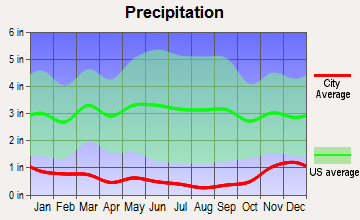
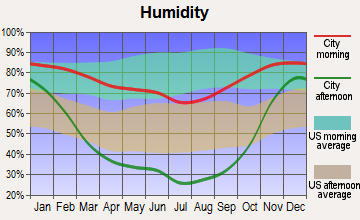
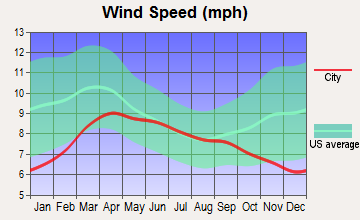
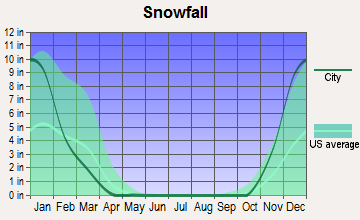
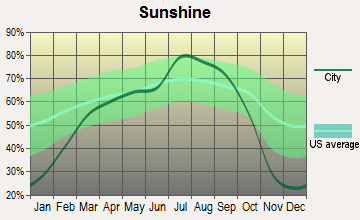
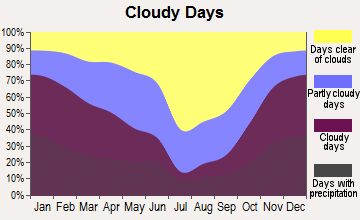
Average climate in Moses Lake, Washington
Based on data reported by over 4,000 weather stations

|
|


(lower is better)
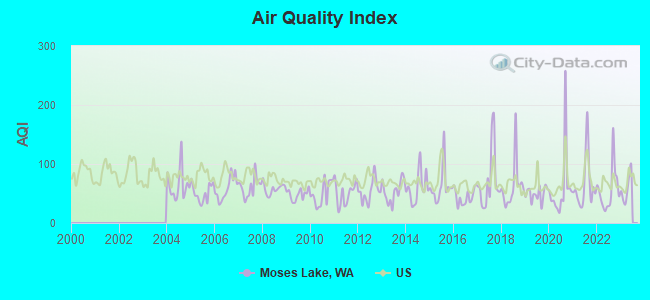
Air Quality Index (AQI) level in 2022 was 56.2. This is better than average.
| City: | 56.2 |
| U.S.: | 72.6 |
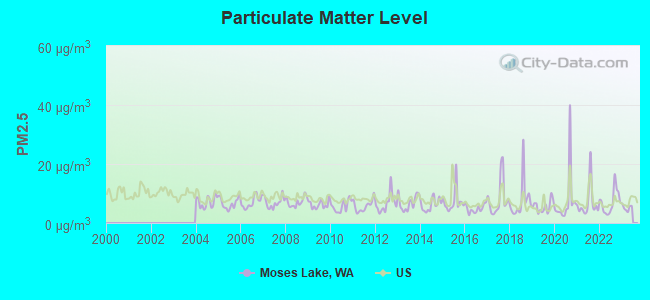
Particulate Matter (PM2.5) [µg/m3] level in 2022 was 7.11. This is about average. Closest monitor was 0.9 miles away from the city center.
| City: | 7.11 |
| U.S.: | 8.11 |
Earthquake activity:
Moses Lake-area historical earthquake activity is significantly above Washington state average. It is 1220% greater than the overall U.S. average.On 4/13/1949 at 19:55:42, a magnitude 7.0 (7.0 UK, Class: Major, Intensity: VIII - XII) earthquake occurred 151.2 miles away from the city center, causing $80,000,000 total damage
On 2/28/2001 at 18:54:32, a magnitude 6.8 (6.5 MB, 6.6 MS, 6.8 MW, Class: Strong, Intensity: VII - IX) earthquake occurred 155.0 miles away from the city center, causing $2,000,000,000 total damage and $305,000,000 insured losses
On 2/28/2001 at 18:54:32, a magnitude 6.8 (6.8 MD, Depth: 32.2 mi) earthquake occurred 161.8 miles away from Moses Lake center
On 4/29/1965 at 15:28:43, a magnitude 6.6 (6.6 UK) earthquake occurred 143.7 miles away from the city center, causing $28,000,000 total damage
On 10/28/1983 at 14:06:06, a magnitude 7.3 (6.2 MB, 7.3 MS, 7.0 MW) earthquake occurred 338.7 miles away from the city center, causing 2 deaths (2 shaking deaths) and 3 injuries, causing $15,000,000 total damage
On 8/18/1959 at 06:37:13, a magnitude 7.7 (7.7 UK) earthquake occurred 451.7 miles away from Moses Lake center, causing $26,000,000 total damage
Magnitude types: body-wave magnitude (MB), duration magnitude (MD), surface-wave magnitude (MS), moment magnitude (MW)
Natural disasters:
The number of natural disasters in Grant County (7) is smaller than the US average (15).Major Disasters (Presidential) Declared: 4
Emergencies Declared: 2
Causes of natural disasters: Winter Storms: 3, Floods: 2, Landslides: 2, Mudslides: 2, Drought: 1, Hurricane: 1, Volcanic Eruption: 1, Other: 1 (Note: some incidents may be assigned to more than one category).
Hospitals and medical centers in Moses Lake:
- SAMARITAN HOSPITAL (Government - Hospital District or Authority, 801 EAST WHEELER ROAD)
- COLUMBIA CREST CARE AND REHABILITATION CENTER (1100 EAST NELSON ROAD)
- LAKE RIDGE SOLANA ALZHEIMER'S CARE CENTER (817 EAST PLUM STREET)
- FMC MOSES LAKE DIALYSIS UNIT (1545 S PILGRIM ST)
- CENTRAL BASIN HOME HEALTH AND HOSPICE (311 W THIRD AVENUE)
Airports and heliports located in Moses Lake:
- Grant Co International Airport (MWH) (Runways: 5, Air Taxi Ops: 2,403, Itinerant Ops: 6,240, Local Ops: 20,113, Military Ops: 30,643)
- Moses Lake Municipal Airport (W20) (Runways: 1, Itinerant Ops: 16,500, Local Ops: 5,000)
- Samaritan Hospital Rms Heliport (WA51)
College/University in Moses Lake:
Colleges/universities with over 2000 students nearest to Moses Lake:
- Wenatchee Valley College (about 54 miles; Wenatchee, WA; Full-time enrollment: 2,951)
- Central Washington University (about 60 miles; Ellensburg, WA; FT enrollment: 10,960)
- Columbia Basin College (about 61 miles; Pasco, WA; FT enrollment: 5,111)
- Yakima Valley Community College (about 70 miles; Yakima, WA; FT enrollment: 3,632)
- Eastern Washington University (about 84 miles; Cheney, WA; FT enrollment: 11,643)
- Walla Walla Community College (about 87 miles; Walla Walla, WA; FT enrollment: 4,263)
- Spokane Falls Community College (about 94 miles; Spokane, WA; FT enrollment: 6,052)
Public high schools in Moses Lake:
- MOSES LAKE HIGH SCHOOL (Location: 803 E. SHARON AVE., Grades: 9-12)
- COLUMBIA BASIN TECHNICAL SKILLS CENTER (Location: 900 E YONEZAWA BLVD, Grades: 10-12)
- SKILL SOURCE LEARNING CENTER (Location: 309 E. 5TH AVE., Grades: 9-12)
- WSD COLUMBIA BASIN J.C. (Location: 6739 24TH AVENUE NORTH EAST, Grades: 11-12)
Private high schools in Moses Lake:
Biggest public elementary/middle schools in Moses Lake:
- CHIEF MOSES MIDDLE SCHOOL (Location: 1111 E NELSON ROAD, Grades: 6-8)
- GARDEN HEIGHTS ELEMENTARY (Location: 707 E NELSON ROAD, Grades: KG-5)
- KNOLLS VISTA ELEMENTARY (Location: 454 W RIDGE ROAD, Grades: KG-5)
- LAKEVIEW TERRACE ELEMENTARY (Location: 780 S. CLOVER DRIVE, Grades: KG-5)
- LARSON HEIGHTS ELEMENTARY (Location: 700 LINDBERG LANE, Grades: KG-5)
- LONGVIEW ELEMENTARY (Location: 9783 APPLE ROAD NE, Grades: KG-5)
- NORTH ELEMENTARY (Location: 1200 WEST CRAIG STREET, Grades: KG-5)
- PENINSULA ELEMENTARY (Location: 2406 W. TEXAS STREET, Grades: KG-5)
- MIDWAY ELEMENTARY (Location: 502 SOUTH C ST, Grades: PK-6)
- FRONTIER MIDDLE SCHOOL (Location: 517 WEST THIRD AVENUE, Grades: 6-8)
Points of interest:
Notable locations in Moses Lake: Vista Village (A), The Big Bend Center (B), Moses Lake Fire Department Station 2 (C), Moses Lake Fire Department Station 1 Headquarters (D). Display/hide their locations on the map
Shopping Center: Grant County Mall (1). Display/hide its location on the map
Park in Moses Lake: Moses Lake State Park (1). Display/hide its location on the map
Tourist attractions: Art Galleries (Museums; 226 West 3rd Avenue) (1), Skyline Miniature Golf (Amusement & Theme Parks; 4337 Airway Drive Northeast) (2). Display/hide their approximate locations on the map
Hotels: Interstate Inn (2801 West Broadway Avenue) (1), Lakeside Motel (802 West Broadway Avenue) (2), Moses Lake Super 8 Motel (449 Melva Ln) (3), Inn at Moses Lake (1745 Kittleson Road) (4), Motel 6 (2822 West Driggs Drive) (5), Oasis Inn (466 Melva Lane) (6), Best Value El Rancho Motel (Bv) (1214 S Pioneer Way) (7), Moses Lake Travelodge (316 South Pioneer Way) (8), Imperial Inn (905 West Broadway Avenue) (9). Display/hide their approximate locations on the map
Courts: Moses Lake City - City Manager- Administration Executive Dept- Municipal C (321 South Balsam Street) (1), Grant County - District Court (1525 East Wheeler Road) (2). Display/hide their approximate locations on the map
Birthplace of: Clarence Gilyard - Actor, Joseph J. Tyson - Catholic bishop, Ryan Doumit - 2005 Major League Baseball player (Pittsburgh Pirates, born: Apr 3, 1981), Star Parker - Journalist, Kirk Triplett - PGA Tour Golf player (born: 3/29/62), B. J. Garbe - Baseball player, Bill Porter (golfer) - Professional golfer, Jason Buck - College football player, Kolby Secrist - College basketball player (Southern Utah Thunderbirds), Matt Cedeño - Actor.
Drinking water stations with addresses in Moses Lake and their reported violations in the past:
CASCADE VALLEY WATER DISTRICT (Population served: 330, Groundwater):Past health violations:COUNTRY CLUB ESTATES WATER SYSTEM (Address: 6260 Mae Valley Road , Population served: 186, Groundwater):Past monitoring violations:
- MCL, Monthly (TCR) - In JUN-2005, Contaminant: Coliform
- 7 routine major monitoring violations
- 288 regular monitoring violations
Past monitoring violations:BEVERLY WATER DISTRICT (Population served: 120, Groundwater):
- 42 regular monitoring violations
Past health violations:MOSES LAKE IRRIG & REHAB DISTRICT (Population served: 113, Groundwater):Past monitoring violations:
- MCL, Single Sample - Between APR-2007 and JUN-2007, Contaminant: Nitrate. Follow-up actions: St BCA signed (MAR-08-2004), St Compliance achieved (9 times from JUL-01-2007 to SEP-18-2007)
- MCL, Single Sample - Between JUL-2006 and SEP-2006, Contaminant: Nitrate. Follow-up actions: St BCA signed (MAR-08-2004), St Compliance achieved (2 times from OCT-01-2006 to DEC-04-2006)
- MCL, Single Sample - Between APR-2006 and JUN-2006, Contaminant: Nitrate. Follow-up actions: St BCA signed (MAR-08-2004), St Compliance achieved (2 times from OCT-01-2006 to DEC-04-2006)
- MCL, Single Sample - Between JAN-2006 and MAR-2006, Contaminant: Nitrate. Follow-up actions: St BCA signed (MAR-08-2004), St Compliance achieved (2 times from MAY-08-2006 to OCT-01-2006)
- MCL, Single Sample - Between JUL-2005 and SEP-2005, Contaminant: Nitrate. Follow-up actions: St BCA signed (MAR-08-2004), St Compliance achieved (2 times from OCT-01-2005 to DEC-01-2005)
- MCL, Single Sample - Between APR-2005 and JUN-2005, Contaminant: Nitrate. Follow-up actions: St BCA signed (MAR-08-2004), St Compliance achieved (2 times from OCT-01-2005 to DEC-01-2005)
- 72 regular monitoring violations
Past monitoring violations:ADMIRAL WATER USERS ASSN (Population served: 74, Groundwater):
- 5 routine major monitoring violations
- 2 regular monitoring violations
Past health violations:
- MCL, Acute (TCR) - In JUL-2006, Contaminant: Coliform
| This city: | 2.7 people |
| Washington: | 2.5 people |
| This city: | 65.7% |
| Whole state: | 64.4% |
| This city: | 9.0% |
| Whole state: | 7.7% |
Likely homosexual households (counted as self-reported same-sex unmarried-partner households)
- Lesbian couples: 0.3% of all households
- Gay men: 0.2% of all households
People in group quarters in Moses Lake in 2010:
- 147 people in nursing facilities/skilled-nursing facilities
- 27 people in group homes intended for adults
- 7 people in other noninstitutional facilities
People in group quarters in Moses Lake in 2000:
- 228 people in nursing homes
- 18 people in other group homes
- 17 people in other noninstitutional group quarters
Banks with branches in Moses Lake (2011 data):
- JPMorgan Chase Bank, National Association: Moses Lake at 323 S Division, branch established on 1921/01/01. Info updated 2011/11/10: Bank assets: $1,811,678.0 mil, Deposits: $1,190,738.0 mil, headquarters in Columbus, OH, positive income, International Specialization, 5577 total offices, Holding Company: Jpmorgan Chase & Co.
- Washington Trust Bank: Moses Lake Branch at 402 S Ash Street, branch established on 1971/07/06. Info updated 2009/02/17: Bank assets: $4,172.4 mil, Deposits: $3,522.4 mil, headquarters in Spokane, WA, positive income, Commercial Lending Specialization, 41 total offices, Holding Company: W.T.b. Financial Corporation
- AmericanWest Bank: Moses Lake Financial Center at 322 S. Division Street, branch established on 1996/03/04. Info updated 2011/12/12: Bank assets: $2,274.6 mil, Deposits: $1,889.1 mil, headquarters in Spokane, WA, positive income, Commercial Lending Specialization, 76 total offices, Holding Company: Skbhc Holdings Llc
- KeyBank National Association: Moses Lake Branch at 314 East Third Avenue, branch established on 1957/05/27. Info updated 2008/03/03: Bank assets: $86,198.8 mil, Deposits: $64,214.8 mil, headquarters in Cleveland, OH, positive income, Commercial Lending Specialization, 1067 total offices, Holding Company: Keycorp
- Bank of America, National Association: Moses Lake Branch at 103 E. Third Avenue, branch established on 1946/03/30. Info updated 2009/11/18: Bank assets: $1,451,969.3 mil, Deposits: $1,077,176.8 mil, headquarters in Charlotte, NC, positive income, 5782 total offices, Holding Company: Bank Of America Corporation
- Wheatland Bank: Moses Lake Branch at 1442 S. Pioneer Road, branch established on 2000/03/15. Info updated 2011/05/09: Bank assets: $274.8 mil, Deposits: $238.6 mil, headquarters in Spokane, WA, positive income, Agricultural Specialization, 13 total offices, Holding Company: Community Financial Group, Inc.
- U.S. Bank National Association: Moses Lake Branch at 203 East Third Avenue, branch established on 1957/03/25. Info updated 2012/01/30: Bank assets: $330,470.8 mil, Deposits: $236,091.5 mil, headquarters in Cincinnati, OH, positive income, 3121 total offices, Holding Company: U.S. Bancorp
- Sterling Savings Bank: Moses Lake Branch at 101 E 4th, branch established on 1988/06/30. Info updated 2012/03/21: Bank assets: $9,207.8 mil, Deposits: $6,454.1 mil, headquarters in Spokane, WA, positive income, Commercial Lending Specialization, 192 total offices, Holding Company: Sterling Financial Corporation
For population 15 years and over in Moses Lake:
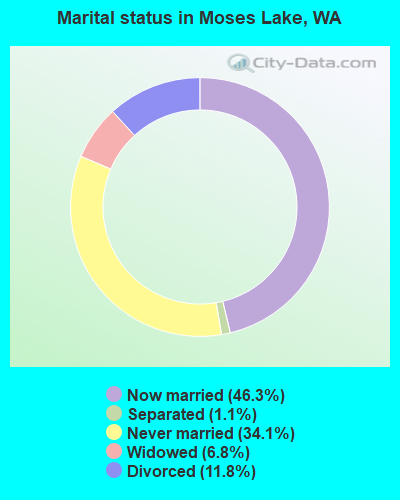
- Never married: 34.1%
- Now married: 46.3%
- Separated: 1.1%
- Widowed: 6.8%
- Divorced: 11.8%
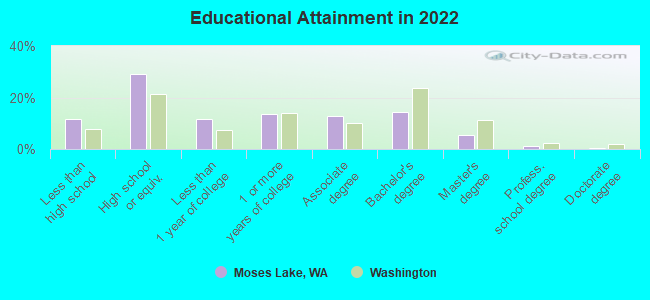
For population 25 years and over in Moses Lake:
- High school or higher: 87.2%
- Bachelor's degree or higher: 21.6%
- Graduate or professional degree: 6.2%
- Unemployed: 9.9%
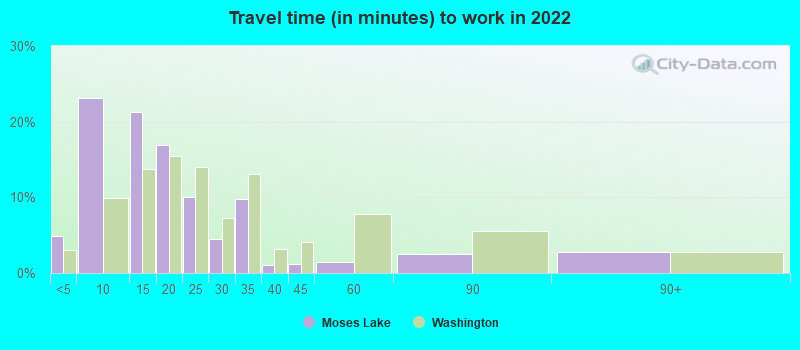
- Mean travel time to work (commute): 18.7 minutes
| Here: | 11.9 |
| Washington average: | 11.6 |
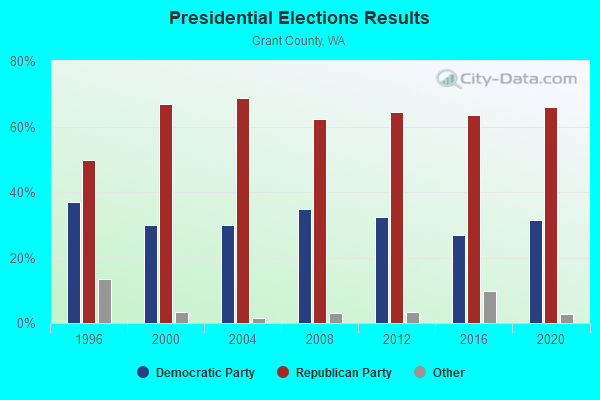

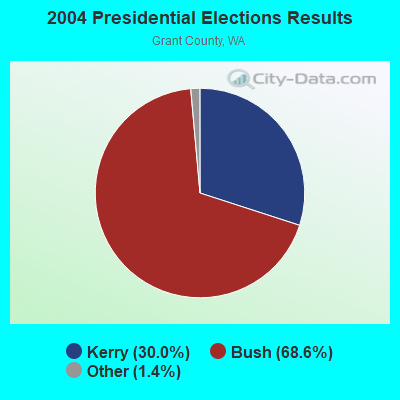

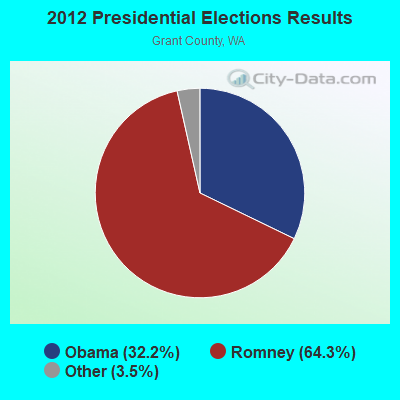
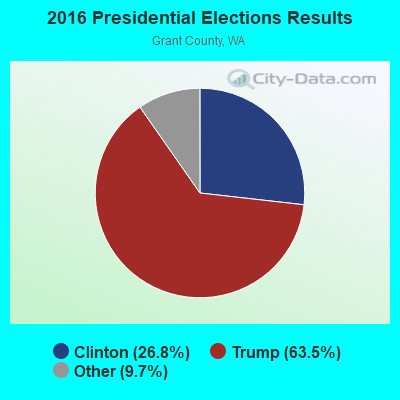

Graphs represent county-level data. Detailed 2008 Election Results
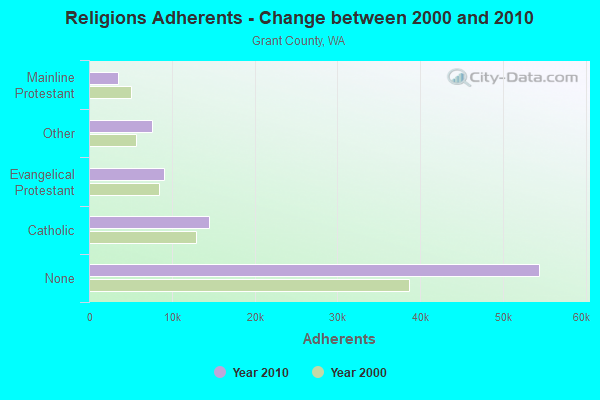
Religion statistics for Moses Lake, WA (based on Grant County data)
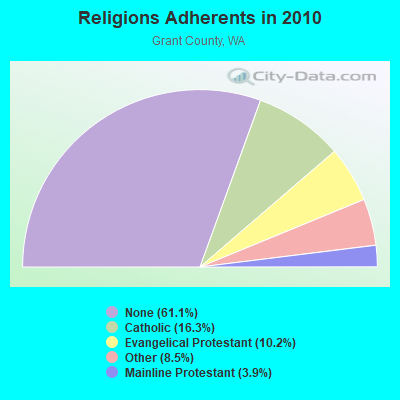
| Religion | Adherents | Congregations |
|---|---|---|
| Catholic | 14,500 | 9 |
| Evangelical Protestant | 9,113 | 76 |
| Other | 7,584 | 23 |
| Mainline Protestant | 3,458 | 22 |
| Black Protestant | 53 | 1 |
| None | 54,412 | - |
Food Environment Statistics:
| Grant County: | 2.19 / 10,000 pop. |
| Washington: | 2.06 / 10,000 pop. |
| Grant County: | 0.24 / 10,000 pop. |
| Washington: | 0.19 / 10,000 pop. |
| This county: | 1.58 / 10,000 pop. |
| State: | 1.18 / 10,000 pop. |
| This county: | 5.22 / 10,000 pop. |
| Washington: | 2.67 / 10,000 pop. |
| This county: | 6.07 / 10,000 pop. |
| State: | 8.26 / 10,000 pop. |
| Grant County: | 9.0% |
| Washington: | 7.7% |
| Grant County: | 30.6% |
| Washington: | 25.7% |
| Grant County: | 15.6% |
| State: | 13.9% |
Health and Nutrition:
| Moses Lake: | 48.9% |
| State: | 49.9% |
| Moses Lake: | 46.8% |
| Washington: | 47.2% |
| Moses Lake: | 28.4 |
| Washington: | 28.4 |
| Moses Lake: | 21.0% |
| State: | 20.9% |
| Moses Lake: | 10.5% |
| Washington: | 10.5% |
| Moses Lake: | 6.8 |
| State: | 6.8 |
| This city: | 32.2% |
| Washington: | 32.8% |
| This city: | 55.9% |
| State: | 56.8% |
| This city: | 79.2% |
| State: | 79.4% |
More about Health and Nutrition of Moses Lake, WA Residents
| Local government employment and payroll (March 2022) | |||||
| Function | Full-time employees | Monthly full-time payroll | Average yearly full-time wage | Part-time employees | Monthly part-time payroll |
|---|---|---|---|---|---|
| Police Protection - Officers | 42 | $369,376 | $105,536 | 0 | $0 |
| Parks and Recreation | 26 | $126,648 | $58,453 | 7 | $2,434 |
| Fire - Other | 25 | $215,003 | $103,201 | 0 | $0 |
| Other and Unallocable | 24 | $119,033 | $59,517 | 0 | $0 |
| Health | 15 | $124,445 | $99,556 | 0 | $0 |
| Sewerage | 14 | $82,495 | $70,710 | 0 | $0 |
| Water Supply | 14 | $85,352 | $73,159 | 0 | $0 |
| Firefighters | 14 | $118,431 | $101,512 | 0 | $0 |
| Other Government Administration | 13 | $55,488 | $51,220 | 0 | $0 |
| Housing and Community Development (Local) | 10 | $59,631 | $71,557 | 0 | $0 |
| Financial Administration | 9 | $58,834 | $78,445 | 0 | $0 |
| Streets and Highways | 8 | $38,371 | $57,557 | 0 | $0 |
| Police - Other | 8 | $40,612 | $60,918 | 0 | $0 |
| Totals for Government | 222 | $1,493,720 | $80,742 | 7 | $2,434 |
Moses Lake government finances - Expenditure in 2021 (per resident):
- Construction - Regular Highways: $207,000 ($8.00)
- Current Operations - Police Protection: $7,598,000 ($293.50)
Parks and Recreation: $5,656,000 ($218.48)
Regular Highways: $4,991,000 ($192.79)
Local Fire Protection: $4,893,000 ($189.01)
Solid Waste Management: $4,568,000 ($176.45)
Water Utilities: $3,614,000 ($139.60)
Sewerage: $2,916,000 ($112.64)
General - Other: $2,398,000 ($92.63)
Central Staff Services: $2,275,000 ($87.88)
Health - Other: $2,230,000 ($86.14)
Financial Administration: $1,313,000 ($50.72)
Natural Resources - Other: $1,034,000 ($39.94)
Housing and Community Development: $392,000 ($15.14)
Protective Inspection and Regulation - Other: $362,000 ($13.98)
Judicial and Legal Services: $192,000 ($7.42)
Libraries: $152,000 ($5.87)
Air Transportation: $32,000 ($1.24)
- General - Interest on Debt: $612,000 ($23.64)
- Intergovernmental to Local - Other - Solid Waste Management: $275,000 ($10.62)
Other - Sewerage: $82,000 ($3.17)
Other - Health - Other: $27,000 ($1.04)
Other - General - Other: $13,000 ($0.50)
Other - Water Utilities: $13,000 ($0.50)
Other - Regular Highways: $9,000 ($0.35)
- Other Capital Outlay - Sewerage: $2,842,000 ($109.78)
Water Utilities: $503,000 ($19.43)
Parks and Recreation: $240,000 ($9.27)
Natural Resources - Other: $164,000 ($6.33)
Local Fire Protection: $159,000 ($6.14)
Police Protection: $31,000 ($1.20)
- Total Salaries and Wages: $15,377,000 ($593.98)
- Water Utilities - Interest on Debt: $397,000 ($15.34)
Moses Lake government finances - Revenue in 2021 (per resident):
- Charges - Sewerage: $5,944,000 ($229.60)
Other: $4,996,000 ($192.99)
Solid Waste Management: $4,554,000 ($175.91)
Parks and Recreation: $1,116,000 ($43.11)
Regular Highways: $44,000 ($1.70)
- Federal Intergovernmental - Other: $18,000 ($0.70)
- Miscellaneous - Rents: $1,038,000 ($40.10)
Special Assessments: $912,000 ($35.23)
Fines and Forfeits: $489,000 ($18.89)
General Revenue - Other: $179,000 ($6.91)
Donations From Private Sources: $115,000 ($4.44)
Sale of Property: $27,000 ($1.04)
- Revenue - Water Utilities: $6,340,000 ($244.90)
- State Intergovernmental - Highways: $1,967,000 ($75.98)
General Local Government Support: $642,000 ($24.80)
Other: $554,000 ($21.40)
Health and Hospitals: $19,000 ($0.73)
- Tax - Property: $8,057,000 ($311.23)
General Sales and Gross Receipts: $8,041,000 ($310.61)
Public Utilities Sales: $4,524,000 ($174.75)
Documentary and Stock Transfer: $868,000 ($33.53)
Other Selective Sales: $832,000 ($32.14)
Other License: $660,000 ($25.49)
Amusements Sales: $434,000 ($16.76)
Occupation and Business License - Other: $179,000 ($6.91)
Motor Vehicle License: $60,000 ($2.32)
Moses Lake government finances - Debt in 2021 (per resident):
- Long Term Debt - Beginning Outstanding - Unspecified Public Purpose: $15,743,000 ($608.12)
Outstanding Unspecified Public Purpose: $10,745,000 ($415.06)
Retired Unspecified Public Purpose: $4,998,000 ($193.06)
| Businesses in Moses Lake, WA | ||||
| Name | Count | Name | Count | |
|---|---|---|---|---|
| AT&T | 1 | Lowe's | 1 | |
| Ace Hardware | 1 | MasterBrand Cabinets | 13 | |
| Arby's | 2 | Maurices | 1 | |
| AutoZone | 1 | McDonald's | 2 | |
| Baskin-Robbins | 1 | Nike | 2 | |
| Best Western | 1 | Papa John's Pizza | 1 | |
| Burger King | 2 | Payless | 1 | |
| Chevrolet | 1 | Quiznos | 1 | |
| Circle K | 1 | RadioShack | 1 | |
| Comfort Suites | 1 | Ramada | 1 | |
| Curves | 1 | Rite Aid | 1 | |
| Dairy Queen | 1 | Safeway | 1 | |
| Dennys | 1 | Sears | 1 | |
| Domino's Pizza | 1 | Staples | 1 | |
| Fashion Bug | 1 | Starbucks | 3 | |
| FedEx | 5 | Subway | 5 | |
| Ford | 1 | Super 8 | 1 | |
| GNC | 1 | T-Mobile | 2 | |
| GameStop | 1 | Taco Bell | 2 | |
| Goodwill | 2 | Toyota | 1 | |
| H&R Block | 2 | True Value | 1 | |
| Holiday Inn | 1 | U-Haul | 2 | |
| Home Depot | 1 | UPS | 7 | |
| Honda | 1 | Vans | 1 | |
| KFC | 1 | Vons | 1 | |
| La-Z-Boy | 1 | Walgreens | 1 | |
| Lane Furniture | 1 | Walmart | 1 | |
Strongest AM radio stations in Moses Lake:
- KBSN (1470 AM; 5 kW; MOSES LAKE, WA; Owner: KSEM, INC.)
- KTBI (810 AM; daytime; 50 kW; EPHRATA, WA; Owner: TACOMA BROADCASTERS, INCORPORATED)
- KWIQ (1020 AM; 2 kW; MOSES LAKE NORTH, WA; Owner: MCC RADIO, LLC)
- KGA (1510 AM; 50 kW; SPOKANE, WA; Owner: CITADEL BROADCASTING COMPANY)
- KULE (730 AM; 1 kW; EPHRATA, WA; Owner: BUTTERFIELD BROADCASTING CORPORATION)
- KIRO (710 AM; 50 kW; SEATTLE, WA; Owner: ENTERCOM SEATTLE LICENSE, LLC)
- KFLD (870 AM; 10 kW; PASCO, WA; Owner: CAPSTAR TX LIMITED PARTNERSHIP)
- KIXI (880 AM; 50 kW; MERCER ISLAND/SEATTL, WA; Owner: BELLEVUE RADIO, INC.)
- KTTH (770 AM; 50 kW; SEATTLE, WA; Owner: ENTERCOM SEATTLE LICENSE, LLC)
- KPQ (560 AM; 5 kW; WENATCHEE, WA; Owner: WESTCOAST BROADCASTING CO.)
- KGNW (820 AM; 50 kW; BURIEN-SEATTLE, WA; Owner: INSPIRATION MEDIA, INC.)
- KJR (950 AM; 50 kW; SEATTLE, WA)
- KYAK (930 AM; 10 kW; YAKIMA, WA)
Strongest FM radio stations in Moses Lake:
- KDRM (99.3 FM; MOSES LAKE, WA; Owner: KSEM, INC.)
- KWIQ-FM (100.3 FM; MOSES LAKE, WA; Owner: MCC RADIO, LLC)
- K212DB (90.3 FM; MOSES LAKE, WA; Owner: CALVARY CHAPEL OF TWIN FALLS, INC.)
- KRCW (96.3 FM; ROYAL CITY, WA; Owner: FARMWORKER EDUCATIONAL RADIO NETWORK, INC.)
- KMLW (88.3 FM; MOSES LAKE, WA; Owner: THE MOODY BIBLE INSTITUTE OF CHICAGO)
- KLWS (91.5 FM; MOSES LAKE, WA; Owner: WASHINGTON STATE UNIVERSITY)
- KULE-FM (92.3 FM; EPHRATA, WA; Owner: BUTTERFIELD BROADCASTING CORPORATION)
- KWWW-FM (96.7 FM; QUINCY, WA; Owner: FISHER RADIO REGIONAL GROUP, INC..)
- KNWR (90.7 FM; ELLENSBURG, WA; Owner: WASHINGTON STATE UNIVERSITY)
- KPQ-FM (102.1 FM; WENATCHEE, WA; Owner: WESCOAST BROADCASTING COMPANY)
- KZML (95.9 FM; QUINCY, WA; Owner: BUTTERFIELD BROADCASTING CORPORATION)
- KWLN (103.3 FM; WILSON CREEK, WA; Owner: MCC RADIO, LLC)
- KZLN-FM (97.5 FM; OTHELLO, WA; Owner: WHEELER BROADCASTING, INC)
- K204DH (88.7 FM; HANFORD, WA; Owner: CALVARY CHAPEL OF TWIN FALLS, INC.)
- K257DN (99.3 FM; BREWSTER, WA; Owner: BREWSTER GRANGE #1018)
- K208BY (89.5 FM; MOSES LAKE, WA; Owner: MOSES LAKE TRANSLATOR ASSOC.)
- KTAC (93.9 FM; EPHRATA, WA; Owner: TACOMA BROADCASTERS, INCORPORATED)
- KEYG-FM (98.5 FM; GRAND COULEE, WA; Owner: WHEELER BROADCASTING, INC.)
- KPLW (89.9 FM; WENATCHEE, WA; Owner: GROWING CHRISTIAN FOUNDATION)
- KKRV (104.7 FM; WENATCHEE, WA; Owner: MCC RADIO, LLC)
- National Bridge Inventory (NBI) Statistics
- 55Number of bridges
- 499ft / 152mTotal length
- $107,297,000Total costs
- 329,464Total average daily traffic
- 53,851Total average daily truck traffic

- New bridges - historical statistics
- 11900-1909
- 31940-1949
- 171950-1959
- 71960-1969
- 11970-1979
- 91980-1989
- 71990-1999
- 82000-2009
- 22010-2019
FCC Registered Antenna Towers: 201 (See the full list of FCC Registered Antenna Towers)
FCC Registered Commercial Land Mobile Towers: 3 (See the full list of FCC Registered Commercial Land Mobile Towers in Moses Lake, WA)
FCC Registered Private Land Mobile Towers: 1 (See the full list of FCC Registered Private Land Mobile Towers)
FCC Registered Broadcast Land Mobile Towers: 81 (See the full list of FCC Registered Broadcast Land Mobile Towers)
FCC Registered Microwave Towers: 64 (See the full list of FCC Registered Microwave Towers in this town)
FCC Registered Paging Towers: 2 (See the full list of FCC Registered Paging Towers)
FCC Registered Maritime Coast & Aviation Ground Towers: 30 (See the full list of FCC Registered Maritime Coast & Aviation Ground Towers)
FCC Registered Amateur Radio Licenses: 179 (See the full list of FCC Registered Amateur Radio Licenses in Moses Lake)
FAA Registered Aircraft: 181 (See the full list of FAA Registered Aircraft in Moses Lake)
2002 - 2018 National Fire Incident Reporting System (NFIRS) incidents
- Fire incident types reported to NFIRS in Moses Lake, WA
- 1,80055.7%Outside Fires
- 73922.9%Structure Fires
- 47714.7%Mobile Property/Vehicle Fires
- 2186.7%Other
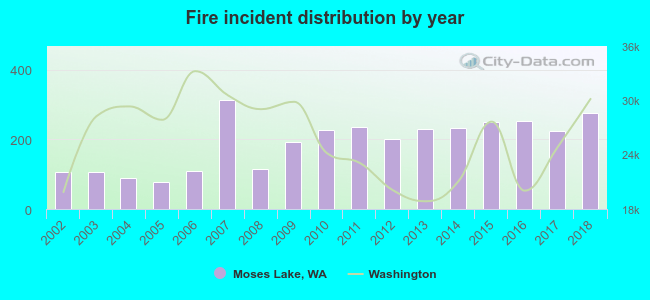 According to the data from the years 2002 - 2018 the average number of fires per year is 190. The highest number of fire incidents - 312 took place in 2007, and the least - 77 in 2005. The data has a growing trend.
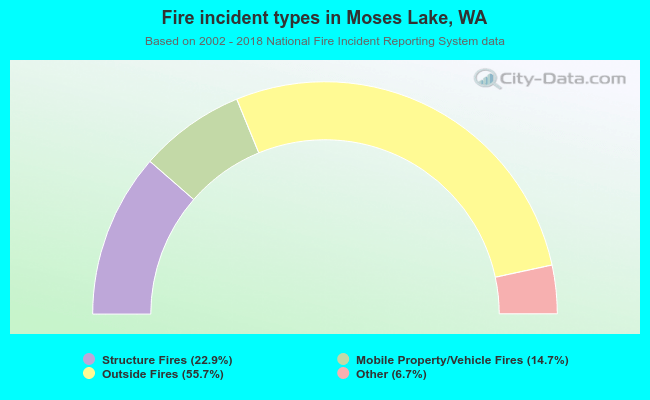 When looking into fire subcategories, the most incidents belonged to: Outside Fires (55.7%), and Structure Fires (22.9%).
Fire-safe hotels and motels in Moses Lake, Washington:
- Oasis Motel, 466 Melva Ln, Moses Lake, Washington 98837 , Phone: (509) 765-8636, Fax: (509) 765-4966
- Motel 6 #288, 2822 Wapato Dr, Moses Lake, Washington 98837 , Phone: (509) 766-0250, Fax: (509) 766-7762
- The Inn At Moses Lake, 1745 E Kittleson, Moses Lake, Washington 98837 , Phone: (509) 766-2000, Fax: (509) 764-0996
- Travelodge-moses Lake, 316 S Pioneer Way, Moses Lake, Washington 98837 , Phone: (509) 765-8631
- Quality Inn, 449 Melva Ln, Moses Lake, Washington 98837 , Phone: (509) 765-8886, Fax: (509) 766-0779
- Moses Lake Holiday Inn Express, 1735 Kittleson Rd, Moses Lake, Washington 98837 , Phone: (509) 766-2000
- Comfort Suites Moses Lake, 1700 E Kittleson Rd, Moses Lake, Washington 98837 , Phone: (509) 765-3731
- Best Westeren Lake Front Hotel, 3000 W Marina Dr, Moses Lake, Washington 98837 , Phone: (509) 765-9211, Fax: (509) 766-0493
- 3 other hotels and motels
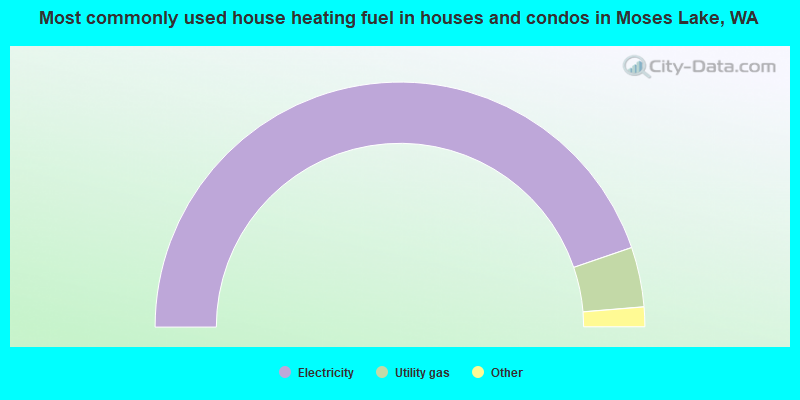
- 89.5%Electricity
- 7.9%Utility gas
- 1.4%Wood
- 0.8%No fuel used
- 0.5%Bottled, tank, or LP gas
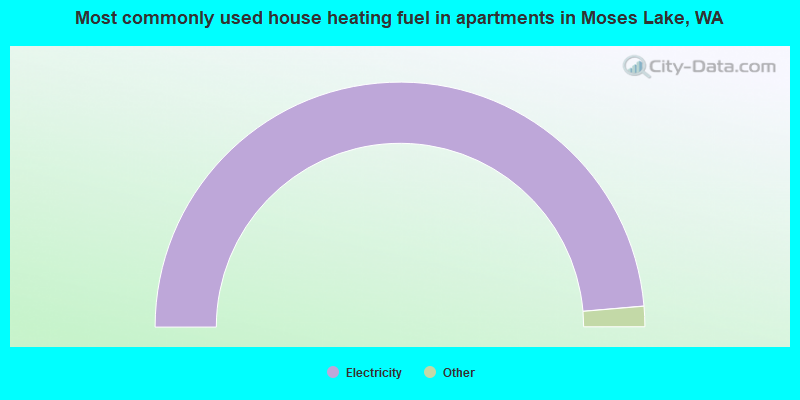
- 97.3%Electricity
- 1.3%Utility gas
- 1.2%Bottled, tank, or LP gas
- 0.2%No fuel used
Moses Lake compared to Washington state average:
- Median house value below state average.
- Hispanic race population percentage significantly above state average.
- Length of stay since moving in significantly below state average.
- House age below state average.
- Number of college students above state average.
Moses Lake on our top lists:
- #76 on the list of "Top 101 cities with the most residents born in Ukraine (population 500+)"
- #62 (98837) on the list of "Top 101 zip codes with the largest percentage of Ukrainian first ancestries (pop 5,000+)"
- #45 on the list of "Top 101 counties with the lowest surface withdrawal of fresh water for public supply (pop. 50,000+)"
- #65 on the list of "Top 101 counties with highest percentage of residents voting for 3rd party candidates in the 2012 Presidential Election (pop. 50,000+)"

|
|
Total of 61 patent applications in 2008-2024.