North Little Rock, Arkansas
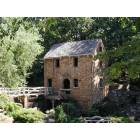
North Little Rock: The Old Mill
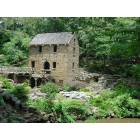
North Little Rock: Old Mill at North Little Rock, AR

North Little Rock: Dickey-Stephens Park, Travelers vs. Rough Riders
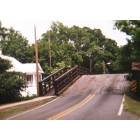
North Little Rock: Old Wooden Viaduct - Fourteenth Street
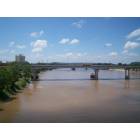
North Little Rock: Bridge over ARKANSAS RIVER
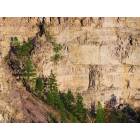
North Little Rock: Trees in cliff at Emerald Park, NLR
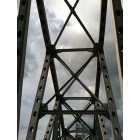
North Little Rock: Into North Little Rock from the bridge
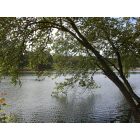
North Little Rock: Lakewood Lake #3
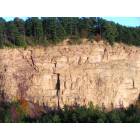
North Little Rock: Trees on cliff at Emerald Park.
North Little Rock: Dickey-Stephens Park, Home of the ArkansasTravelers
- add
your
Submit your own pictures of this city and show them to the world
- OSM Map
- General Map
- Google Map
- MSN Map
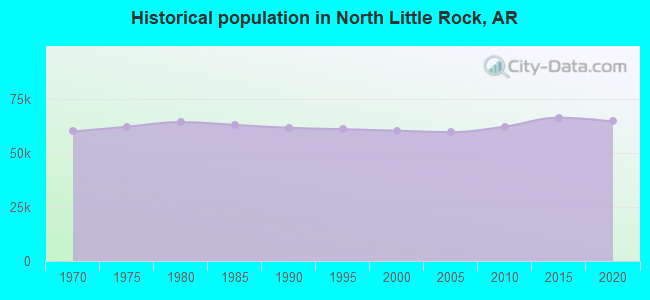
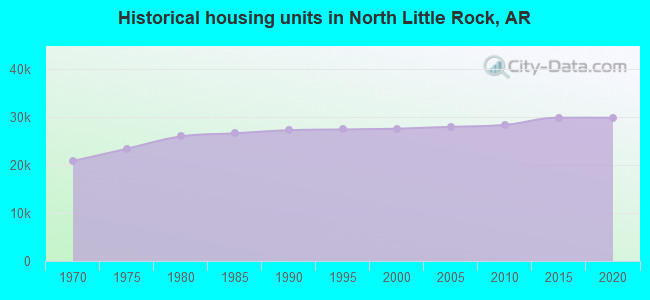
Population change since 2000: +6.9%
 |
| Males: 30,636 | |
| Females: 33,991 |
| Median resident age: | 36.9 years |
| Arkansas median age: | 38.9 years |
Zip codes: 72114, 72116, 72118, 72142.
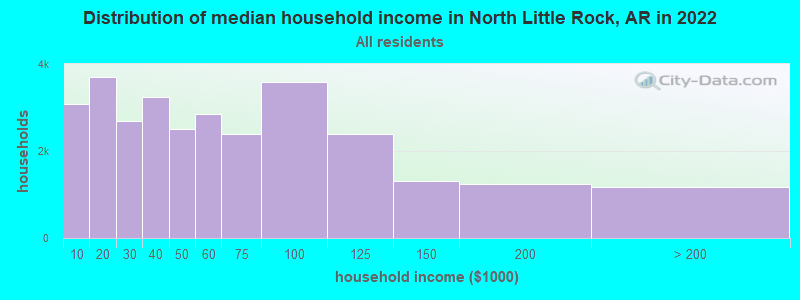
North Little Rock Zip Code Map| North Little Rock: | $47,465 |
| AR: | $55,432 |
Estimated per capita income in 2022: $31,344 (it was $19,662 in 2000)
North Little Rock city income, earnings, and wages data
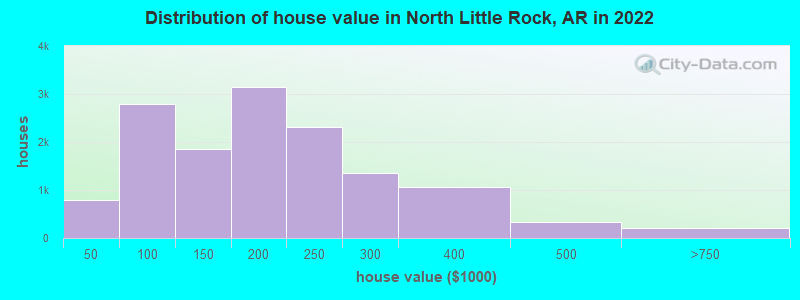
Estimated median house or condo value in 2022: $179,988 (it was $75,100 in 2000)
| North Little Rock: | $179,988 |
| AR: | $179,800 |
Mean prices in 2022: all housing units: $218,480; detached houses: $215,386; townhouses or other attached units: $338,700; in 2-unit structures: $451,520; in 3-to-4-unit structures: over $1,000,000; in 5-or-more-unit structures: $140,592; mobile homes: $46,434
Median gross rent in 2022: $944.
North Little Rock, AR residents, houses, and apartments details
(10.2% for White Non-Hispanic residents, 35.0% for Black residents, 16.7% for Hispanic or Latino residents, 37.9% for American Indian residents, 15.4% for other race residents, 12.6% for two or more races residents)
Detailed information about poverty and poor residents in North Little Rock, AR


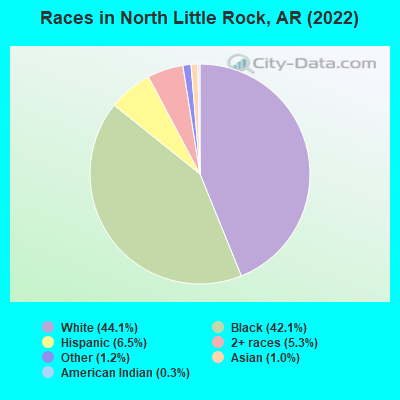
- 28,49744.1%White alone
- 27,19342.1%Black alone
- 4,1936.5%Hispanic
- 3,4055.3%Two or more races
- 7921.2%Other race alone
- 6431.0%Asian alone
- 1930.3%American Indian alone
- 70.01%Native Hawaiian and Other
Pacific Islander alone
According to our research of Arkansas and other state lists, there were 190 registered sex offenders living in North Little Rock, Arkansas as of April 27, 2024.
The ratio of all residents to sex offenders in North Little Rock is 349 to 1.
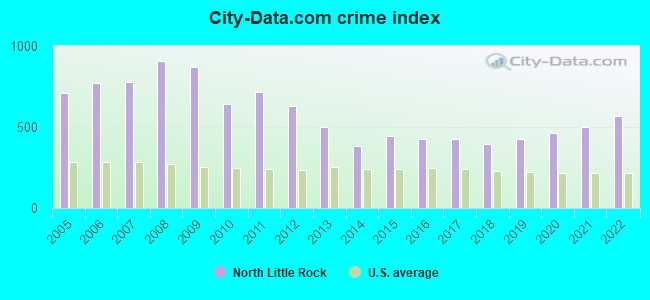
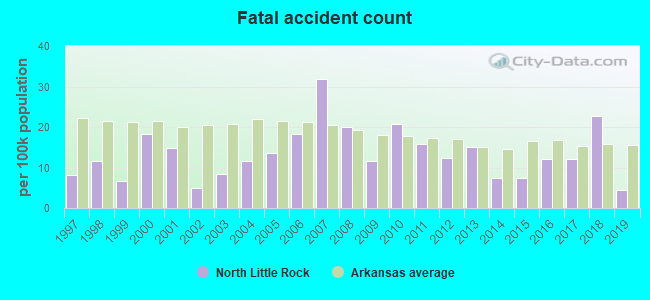
The City-Data.com crime index weighs serious crimes and violent crimes more heavily. Higher means more crime, U.S. average is 246.1. It adjusts for the number of visitors and daily workers commuting into cities.
- means the value is bigger than the state average.- means the value is much bigger than the state average.
Crime rate in North Little Rock detailed stats: murders, rapes, robberies, assaults, burglaries, thefts, arson
Full-time law enforcement employees in 2021, including police officers: 200 (170 officers - 152 male; 18 female).
| Officers per 1,000 residents here: | 2.55 |
| Arkansas average: | 2.25 |
 Recent articles from our blog. Our writers, many of them Ph.D. graduates or candidates, create easy-to-read articles on a wide variety of topics.

 | Little Rock and North Little Rock (2 replies) |
| Downtown Little Rock (24 replies) |
| Private School near North Little Rock (5 replies) |
| Yay or nay (move to little rock??) (56 replies) |
| Metroplan Population Estimates for 2020 (LR-NLR-Conway MSA) (0 replies) |
| Safe Living in Little Rock ! Help PLZ! (8 replies) |
Latest news from North Little Rock, AR collected exclusively by city-data.com from local newspapers, TV, and radio stations
Ancestries: African (7.6%), English (6.8%), American (6.6%), German (4.7%), Irish (3.8%), European (2.0%).
Current Local Time: CST time zone
Incorporated on 06/17/1901
Elevation: 267 feet
Land area: 44.8 square miles.
Population density: 1,442 people per square mile (low).
2,615 residents are foreign born (2.5% Latin America, 0.7% Asia).
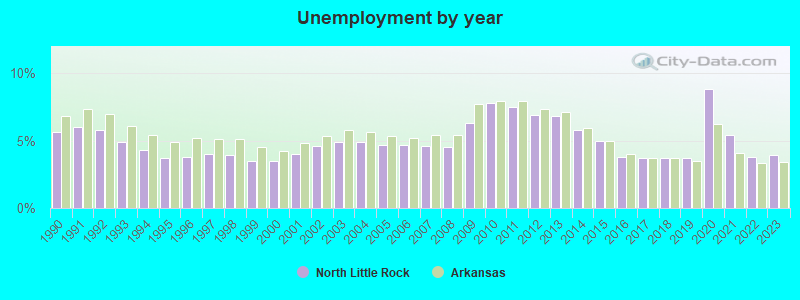
| This city: | 4.0% |
| Arkansas: | 5.0% |
Median real estate property taxes paid for housing units with mortgages in 2022: $1,220 (0.7%)
Median real estate property taxes paid for housing units with no mortgage in 2022: $1,425 (0.8%)
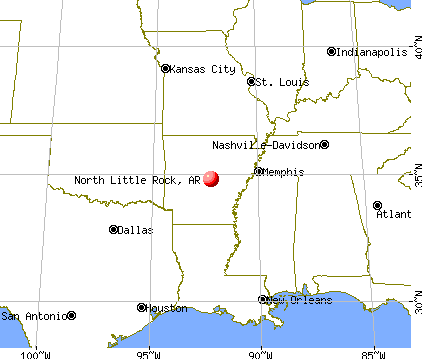
Nearest city with pop. 200,000+: Memphis, TN  (131.7 miles , pop. 650,100).
Nearest city with pop. 1,000,000+: Dallas, TX (294.2 miles , pop. 1,188,580).
Nearest cities:
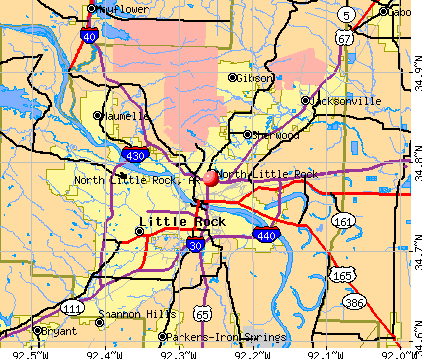
), ), ), ), )Latitude: 34.78 N, Longitude: 92.26 W
Daytime population change due to commuting: +12,628 (+19.6%)
Workers who live and work in this city: 11,327 (37.7%)
Area code commonly used in this area: 501
North Little Rock tourist attractions:
- Burns Park - North Little Rock, Arkansas - Recreation Park and Camping
- Funland Amusement Park - North Little Rock, Arkansas - small family amusement park with 12 rides
- North Shore River Walk - North Little Rock, AR - part of the Arkansas River Trail that provides a clean and scenic path through Little Rock, Arkansas
- Twin City Antique Mall - North Little Rock, AR - authentic antiques and collectibles
- Arkansas Inland Maritime Museum - North Little Rock, Arkansas Commemorating the vessels of World War II
- Wild River Country - North Little Rock, Arkansas - family water park
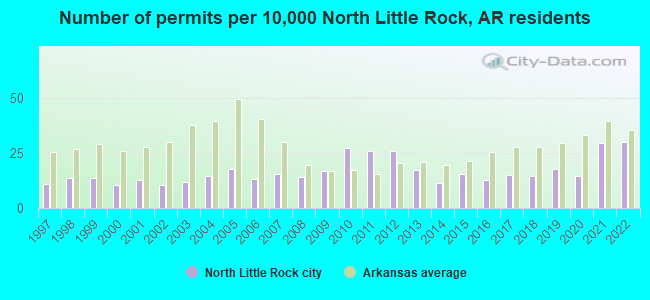
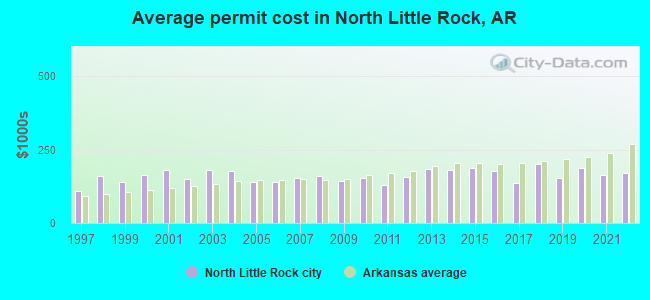
Single-family new house construction building permits:
- 2022: 181 buildings, average cost: $172,000
- 2021: 178 buildings, average cost: $163,000
- 2020: 87 buildings, average cost: $187,500
- 2019: 106 buildings, average cost: $152,700
- 2018: 87 buildings, average cost: $200,100
- 2017: 90 buildings, average cost: $135,600
- 2016: 78 buildings, average cost: $177,000
- 2015: 92 buildings, average cost: $187,700
- 2014: 69 buildings, average cost: $179,900
- 2013: 103 buildings, average cost: $183,400
- 2012: 156 buildings, average cost: $158,200
- 2011: 156 buildings, average cost: $129,300
- 2010: 164 buildings, average cost: $151,700
- 2009: 102 buildings, average cost: $142,100
- 2008: 84 buildings, average cost: $159,900
- 2007: 94 buildings, average cost: $154,200
- 2006: 80 buildings, average cost: $137,600
- 2005: 108 buildings, average cost: $140,500
- 2004: 88 buildings, average cost: $178,400
- 2003: 72 buildings, average cost: $179,700
- 2002: 62 buildings, average cost: $151,100
- 2001: 77 buildings, average cost: $182,200
- 2000: 63 buildings, average cost: $165,300
- 1999: 82 buildings, average cost: $138,400
- 1998: 82 buildings, average cost: $160,400
- 1997: 65 buildings, average cost: $108,000
| Here: | 3.9% |
| Arkansas: | 3.4% |
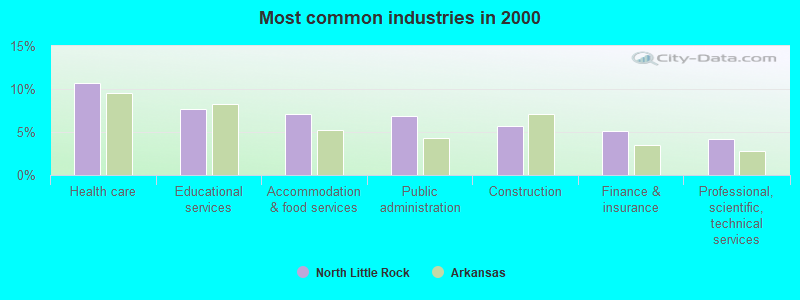
- Health care (10.7%)
- Educational services (7.7%)
- Accommodation & food services (7.1%)
- Public administration (6.8%)
- Construction (5.7%)
- Finance & insurance (5.1%)
- Professional, scientific, technical services (4.2%)
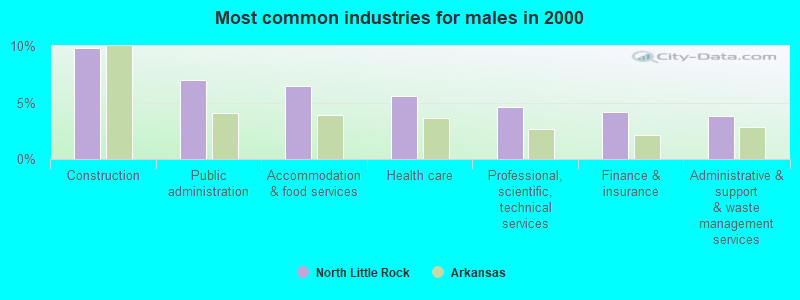
- Construction (9.8%)
- Public administration (7.0%)
- Accommodation & food services (6.5%)
- Health care (5.6%)
- Professional, scientific, technical services (4.6%)
- Finance & insurance (4.1%)
- Administrative & support & waste management services (3.8%)
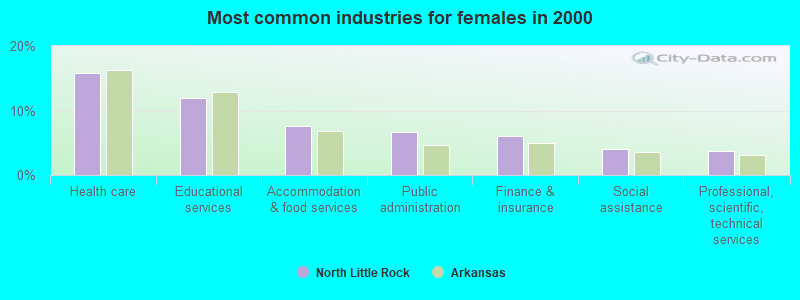
- Health care (15.8%)
- Educational services (12.0%)
- Accommodation & food services (7.6%)
- Public administration (6.7%)
- Finance & insurance (6.1%)
- Social assistance (4.1%)
- Professional, scientific, technical services (3.7%)
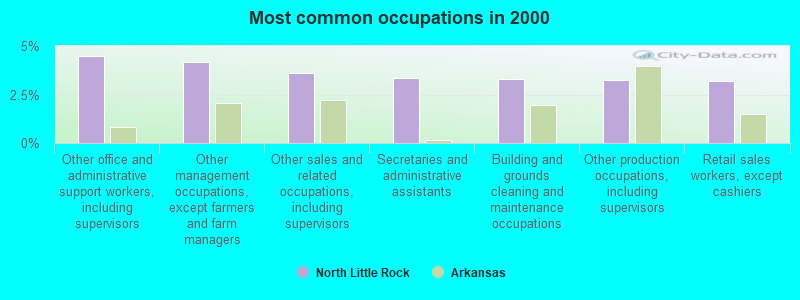
- Other office and administrative support workers, including supervisors (4.5%)
- Other management occupations, except farmers and farm managers (4.2%)
- Other sales and related occupations, including supervisors (3.6%)
- Secretaries and administrative assistants (3.4%)
- Building and grounds cleaning and maintenance occupations (3.3%)
- Other production occupations, including supervisors (3.3%)
- Retail sales workers, except cashiers (3.2%)
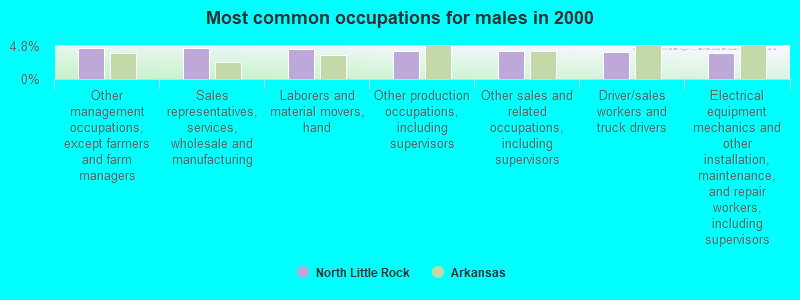
- Other management occupations, except farmers and farm managers (4.5%)
- Sales representatives, services, wholesale and manufacturing (4.5%)
- Laborers and material movers, hand (4.4%)
- Other production occupations, including supervisors (4.0%)
- Other sales and related occupations, including supervisors (4.0%)
- Driver/sales workers and truck drivers (3.9%)
- Electrical equipment mechanics and other installation, maintenance, and repair workers, including supervisors (3.8%)
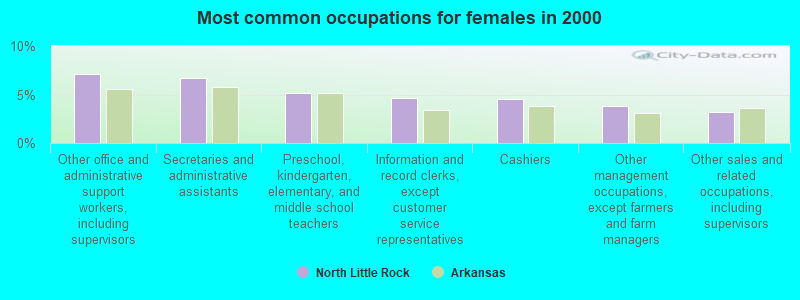
- Other office and administrative support workers, including supervisors (7.1%)
- Secretaries and administrative assistants (6.6%)
- Preschool, kindergarten, elementary, and middle school teachers (5.2%)
- Information and record clerks, except customer service representatives (4.6%)
- Cashiers (4.6%)
- Other management occupations, except farmers and farm managers (3.8%)
- Other sales and related occupations, including supervisors (3.2%)
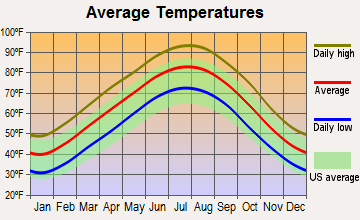
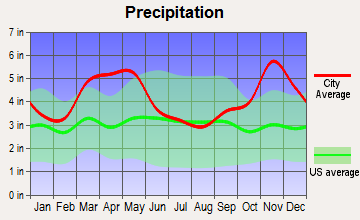
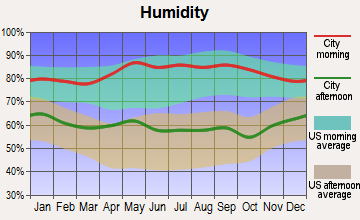
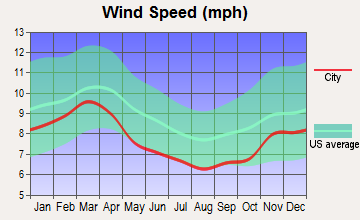
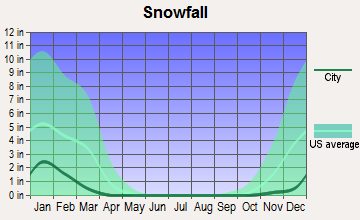
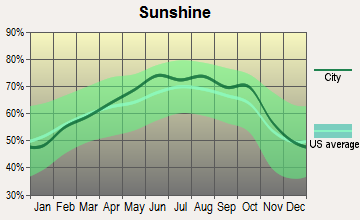
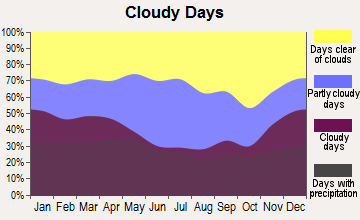
Average climate in North Little Rock, Arkansas
Based on data reported by over 4,000 weather stations
|
|

(lower is better)
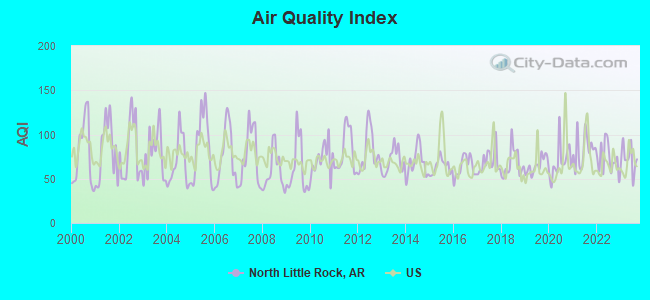
Air Quality Index (AQI) level in 2023 was 72.9. This is about average.
| City: | 72.9 |
| U.S.: | 72.6 |
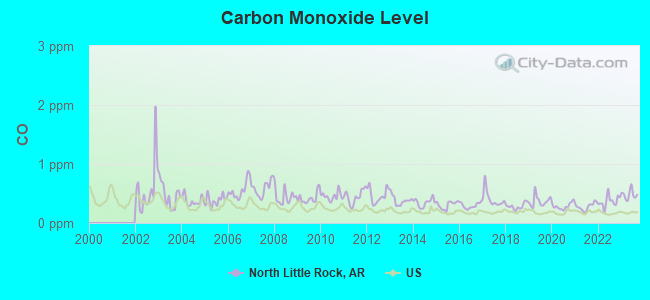
Carbon Monoxide (CO) [ppm] level in 2023 was 0.481. This is significantly worse than average. Closest monitor was 2.0 miles away from the city center.
| City: | 0.481 |
| U.S.: | 0.251 |
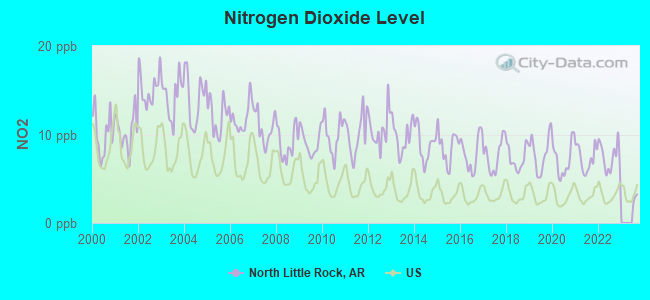
Nitrogen Dioxide (NO2) [ppb] level in 2022 was 7.45. This is significantly worse than average. Closest monitor was 2.0 miles away from the city center.
| City: | 7.45 |
| U.S.: | 5.11 |
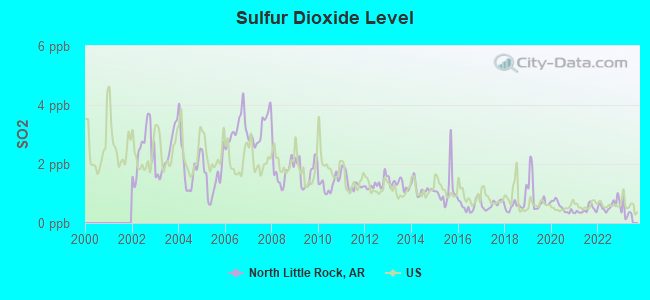
Sulfur Dioxide (SO2) [ppb] level in 2022 was 0.603. This is significantly better than average. Closest monitor was 2.2 miles away from the city center.
| City: | 0.603 |
| U.S.: | 1.515 |
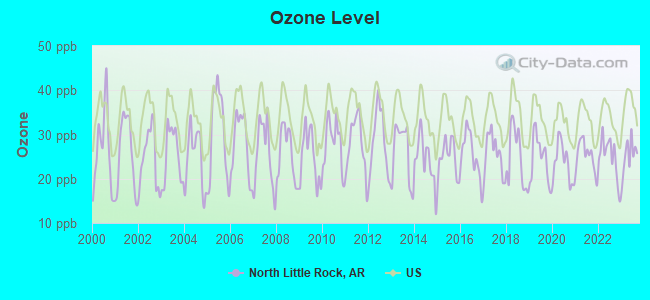
Ozone [ppb] level in 2023 was 25.2. This is better than average. Closest monitor was 2.0 miles away from the city center.
| City: | 25.2 |
| U.S.: | 33.3 |
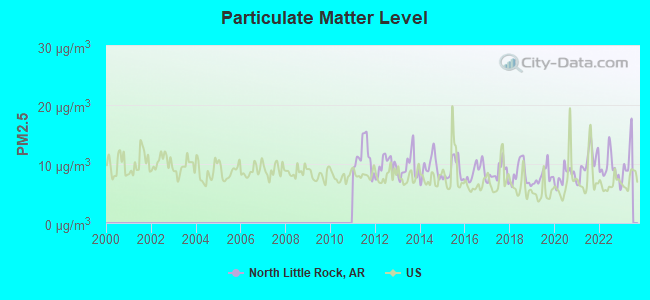
Particulate Matter (PM2.5) [µg/m3] level in 2022 was 9.21. This is about average. Closest monitor was 2.2 miles away from the city center.
| City: | 9.21 |
| U.S.: | 8.11 |
Tornado activity:
North Little Rock-area historical tornado activity is slightly above Arkansas state average. It is 158% greater than the overall U.S. average.
On 3/1/1997, a category F4 (max. wind speeds 207-260 mph) tornado 3.9 miles away from the North Little Rock city center killed 5 people and injured 180 people.
On 3/1/1997, a category F4 tornado 10.5 miles away from the city center killed 10 people and injured 40 people.
Earthquake activity:
North Little Rock-area historical earthquake activity is significantly above Arkansas state average. It is 479% greater than the overall U.S. average.On 1/21/1982 at 00:33:54, a magnitude 4.7 (4.5 MB, 4.7 LG, 4.5 LG, Class: Light, Intensity: IV - V) earthquake occurred 27.1 miles away from North Little Rock center
On 5/4/2001 at 06:42:12, a magnitude 4.7 (4.2 MB, 4.7 LG, 4.5 LG) earthquake occurred 29.6 miles away from the city center
On 2/28/2011 at 05:00:50, a magnitude 4.7 (4.7 MW, Depth: 2.0 mi) earthquake occurred 34.2 miles away from the city center
On 11/6/2011 at 03:53:10, a magnitude 5.7 (5.7 MW, Depth: 3.2 mi, Class: Moderate, Intensity: VI - VII) earthquake occurred 260.1 miles away from the city center
On 3/25/1976 at 00:41:20, a magnitude 5.0 (4.9 MB, 5.0 LG) earthquake occurred 124.1 miles away from the city center
On 9/3/2016 at 12:02:44, a magnitude 5.8 (5.8 MW, Depth: 3.5 mi) earthquake occurred 286.3 miles away from the city center
Magnitude types: regional Lg-wave magnitude (LG), body-wave magnitude (MB), moment magnitude (MW)
Natural disasters:
The number of natural disasters in Pulaski County (26) is a lot greater than the US average (15).Major Disasters (Presidential) Declared: 20
Emergencies Declared: 3
Causes of natural disasters: Storms: 19, Floods: 16, Tornadoes: 13, Winter Storms: 4, Winds: 2, Hurricane: 1, Other: 1 (Note: some incidents may be assigned to more than one category).
Hospitals and medical centers in North Little Rock:
- BAPTIST HEALTH MEDICAL CENTER NORTH LITTLE ROCK (Voluntary non-profit - Other, provides emergency services, 3333 SPRINGHILL DRIVE)
- HOSPICE OF CENTRAL ARKANSAS (706 WEST FOURTH STREET)
- ARKANSAS SKILLED CARE FOR CHILDREN (4100 HERITAGE DRIVE)
- LAKEWOOD NURSING AND REHABILITATION CENTER (2323 MCCAIN BOULEVARD)
- MERCY NURSING HOME (6401 E 47TH ST)
- NORTHRIDGE HEALTHCARE AND REHABILITATION (2501 JOHN ASHLEY DRIVE)
- PREMIER HEALTH AND REHABILITATION, LLC (3600 RICHARDS ROAD)
- ROBINSON NURSING AND REHABILITATION CENTER LLC (519 DONOVAN BRILEY BLVD.)
- DAVITA - NORTH LITTLE ROCK DIALYSIS CTR (4505 E MCCAIN BLVD)
- DAVITA - SPRINGHILL DIALYSIS (SPRINGHILL MEDICAL PLAZA)
Airports located in North Little Rock:
- North Little Rock Municipal Airport (ORK) (Runways: 2, Air Taxi Ops: 1,000, Itinerant Ops: 6,000, Local Ops: 25,000, Military Ops: 200)
- R V Stewart Field Airport (AR55) (Runways: 1)
Colleges/Universities in North Little Rock:
- Pulaski Technical College (Full-time enrollment: 8,396; Location: 3000 W Scenic Dr; Public; Website: www.pulaskitech.edu)
- Imagine-Paul Mitchell Partner School (Full-time enrollment: 514; Location: 4201 E McCain Blvd; Private, for-profit; Website: www.pmlittlerock.com)
- Arkansas College of Barbering and Hair Design (Full-time enrollment: 156; Location: 200 E Washington Ave; Private, for-profit; Website: www.arkansascollegeofbarbering.com)
- The Salon Professional Academy-North Little Rock (Full-time enrollment: 106; Location: 4619 John F Kennedy Boulevard; Private, for-profit; Website: littlerockbeautyschool.com/)
- New Tyler Barber College Inc (Full-time enrollment: 72; Location: 1221 E 7th St; Private, for-profit; Website: newtylerbarbercollege.com)
Other colleges/universities with over 2000 students near North Little Rock:
- University of Arkansas at Little Rock (about 7 miles; Little Rock, AR; Full-time enrollment: 9,227)
- University of Central Arkansas (about 24 miles; Conway, AR; FT enrollment: 9,972)
- Arkansas State University-Beebe (about 29 miles; Beebe, AR; FT enrollment: 3,387)
- University of Arkansas at Pine Bluff (about 40 miles; Pine Bluff, AR; FT enrollment: 2,558)
- Harding University (about 45 miles; Searcy, AR; FT enrollment: 5,360)
- National Park Community College (about 53 miles; Hot Springs, AR; FT enrollment: 2,237)
- Arkansas Tech University (about 62 miles; Russellville, AR; FT enrollment: 9,038)
Public high schools in North Little Rock:
Private high schools in North Little Rock:
- CENTRAL ARKANSAS CHRISTIAN HIGH SCHOOL (Students: 470, Location: 1 WINDSONG DR, Grades: 7-12)
- CALVARY ACADEMY (Students: 269, Location: 1401 CALVARY RD, Grades: PK-12)
- CEDAR HEIGHTS CHRISTIAN ACADEMY (Students: 43, Location: 14502 CEDAR HEIGHTS RD, Grades: KG-12)
Biggest public elementary/middle schools in North Little Rock:
- RIDGEROAD MIDDLE SCHOOL (Location: 4601 RIDGE RD, Grades: 6-8)
- AMBOY ELEMENTARY SCHOOL (Location: 2400 W 58TH ST, Grades: PK-5)
- BOONE PARK ELEMENTARY SCHOOL (Location: 1400 CRUTCHER ST, Grades: PK-5)
- CRESTWOOD ELEMENTARY SCHOOL (Location: 1901 CRESTWOOD DR, Grades: KG-5)
- GLENVIEW ELEMENTARY SCHOOL (Location: 1901 EDMOND ST, Grades: PK-5)
- INDIAN HILLS ELEMENTARY SCHOOL (Location: 6800 INDIAN HILLS DR, Grades: KG-5)
- LAKEWOOD ELEMENTARY SCHOOL (Location: 1800 FAIRWAY AVE, Grades: KG-5)
- LAKEWOOD MIDDLE SCHOOL (Location: 2300 LAKEVIEW RD, Grades: 6-8)
- MEADOW PARK ELEMENTARY SCHOOL (Location: 400 EUREKA GARDENS RD, Grades: PK-5)
- NO. HEIGHTS ELEMENTARY SCHOOL (Location: 4901 N ALLEN ST, Grades: PK-5)
Private elementary/middle schools in North Little Rock:
- IMMACULATE CONCEPTION SCHOOL (Students: 367, Location: 7000 JOHN F KENNEDY BLVD, Grades: PK-8)
- NORTH LITTLE ROCK CATHOLIC ACADEMY (Students: 211, Location: 1518 PARKER ST, Grades: PK-8)
- NORTH LITTLE ROCK MONTESSORI SCHOOL (Students: 89, Location: 900 MISSION RD, Grades: UG-8)
User-submitted facts and corrections:
- You need to add private schools. Immaculate Conception, St. Mary's St. Patricks to name a few.
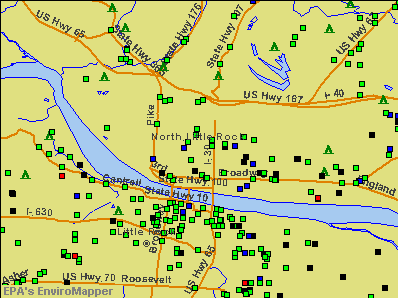
Points of interest:
Notable locations in North Little Rock: Greater Little Rock Stockyards (A), William F Laman Public Library (B), Glenview Recreation Center (C), North Little Rock Police Department Hemlock Courts Office (D), Union Pacific Railroad Police (E), North Little Rock Police Department South Substation (F), North Little Rock Police Department Eastgate Office (G), North Little Rock Police Department (H), Pulaski County Sheriff Department Northside Booking (I), Pulaski Technical College (Campus Police) (J), North Little Rock Police Department Parkhill Office (K), North Little Rock Police Department West Substation (L), A W Young Library (M), North Little Rock City Hall (N), North Little Rock Fire Department Station 4 (O), Saint Josephs Orphanage (P), North Heights Recreation Center (Q), North Little Rock Fire Department Station 10 (R), North Little Rock Fire Department Station 2 (S), North Little Rock Fire Department Station 5 (T). Display/hide their locations on the map
Shopping Centers: North Park Mall Shopping Center (1), Hunt Valley Center Shopping Center (2), Lakehill Shopping Center (3), Lakewood Village Shopping Center (4), Pike Plaza Shopping Center (5), Indian Hills Shopping Center (6), Idlewild Shopping Center (7), Rose City Shopping Center (8), Sycamore Plaza Shopping Center (9). Display/hide their locations on the map
Churches in North Little Rock include: Park Hill Baptist Church (A), Lynch Drive Assembly of God Church (B), Lynch View Missionary Baptist Church (C), Original Church of God (D), McCabe United Methodist Church (E), Metropolitan Community Church of the Rock (F), North Little Rock Church of Christ (G), Pentecostal Church of God of Rose City (H), Mount Olive Baptist Church (I). Display/hide their locations on the map
Cemeteries: Aaron Cemetery (1), Baucum Cemetery (2), Heilman Cemetery (3), Swinton Cemetery (4), Edgewood Cemetery (5), Cornerstone Cemetery (6). Display/hide their locations on the map
Reservoirs and swamps: Lake Number Two (A), Lake Number One (B), Lake Number Three (C), Little Indian Lake Number One (D), Little Indian Lake Number Two (E), Lake Number Six (F), Lakewood Lake Number One (G), Lakewood Lake Number Two (H). Display/hide their locations on the map
Streams, rivers, and creeks: White Oak Bayou (A), Spring Creek (B), Shilcotts Bayou (C). Display/hide their locations on the map
Parks in North Little Rock include: Camp Robinson Park (1), Optimist Park (2), Pugh Park (3), Riverfront Park (4), Riverview Park (5), Rose City Park (6), Vestal Park (7), Cooks Landing Park (8), Burns Park (9). Display/hide their locations on the map
Tourist attractions: Studio 5000 (Museums; 5000 John F Kennedy Boulevard) (1), Lynch Waterproofing (Water Parks & Slides; 5217 Young Road) (2), Aladdin's Castle (Amusement & Theme Parks; McCain Mall) (3), A1 Amusement Co LLC (Amusement & Theme Parks; 2024 West 38th Street) (4), Thomas Amusement CO (Amusement & Theme Parks; 16000 Faulkner Lake Road) (5), Time Zone (Amusement & Theme Parks; 3929 McCain Boulevard) (6), Wild River Country (Arcades & Amusements; 6820 Crystal Hill Road) (7), Sue Smith Vacations (Tours & Charters; 3806 John F Kennedy Boulevard) (8), Al's Cycle Center (Tours & Charters; 4801 Mac Arthur Drive) (9). Display/hide their approximate locations on the map
Hotels: Fairfield Inn (4120 Health Care Drive) (1), Howard Johnson Hotel (111 West Pershing Boulevard) (2), Residence Inn (4110 Health Care Drive) (3), Hampton Inn No Little Rock McCain Mall (4801 West Commercial Drive) (4), Comfort Inn I-40 East (5710 Pritchard Drive) (5), Super 8 Motel North (I-40 & Protho JCT) (6), Country Inn-Stes N Little Rock (110 East Pershing Boulevard) (7), Days Inn (7200 Bicentennial Road) (8), Rest Inn (5801 Pritchard Drive) (9). Display/hide their approximate locations on the map
Courts: Sherwood City - Municipal Court- Court Clerk- Facsimile (2201 East Kiehl) (1), Sherwood City - Municipal Court- Court Clerk- If Busy Dial (2201 East Kiehl) (2), Sherwood City - Municipal Court- Hot Check Division- Facsimile (2202 East Kiehl) (3), Sherwood-City - Municipal Court- Criminal & Traffic (2201 East Kiehl Avenue) (4), Silver City Court Our Club (701 West 18th Street) (5), Sherwood-City - Municipal Court- Hot Check Division (2201 East Kiehl Avenue) (6). Display/hide their approximate locations on the map
Birthplace of: Darren McFadden - College football player, Bill Halter - Rhodes scholar, A.J. Burnett - 2005 Major League Baseball player (Florida Marlins, born: Jan 3, 1977), Jason White (musician) - Guitarist, Joey Lauren Adams - Film actress/director, Terry Tiffee - 2005 Major League Baseball player (Minnesota Twins, born: Apr 21, 1979), Wayne Yates - Basketball player and coach, Jeremy Davis - Bassist of the alternative Rock band 'Paramore', Aubrey Gatewood - Baseball player, Bill Young (American football) - Footballer.
Drinking water stations with addresses in North Little Rock and their reported violations in the past:
CAMP ROBINSON (Population served: 999, Purch surface water):Past health violations:
- MCL, Monthly (TCR) - In JUN-2013, Contaminant: Coliform. Follow-up actions: St Public Notif requested (AUG-13-2013), St Public Notif received (SEP-12-2013), St Compliance achieved (DEC-03-2013)
- MCL, Monthly (TCR) - In JUL-2009, Contaminant: Coliform. Follow-up actions: St Compliance achieved (APR-13-2010)
| This city: | 2.3 people |
| Arkansas: | 2.5 people |
| This city: | 59.2% |
| Whole state: | 67.6% |
| This city: | 6.7% |
| Whole state: | 5.7% |
Likely homosexual households (counted as self-reported same-sex unmarried-partner households)
- Lesbian couples: 0.4% of all households
- Gay men: 0.4% of all households
People in group quarters in North Little Rock in 2010:
- 583 people in nursing facilities/skilled-nursing facilities
- 142 people in other noninstitutional facilities
- 73 people in emergency and transitional shelters (with sleeping facilities) for people experiencing homelessness
- 55 people in mental (psychiatric) hospitals and psychiatric units in other hospitals
- 11 people in residential treatment centers for adults
- 6 people in workers' group living quarters and job corps centers
People in group quarters in North Little Rock in 2000:
- 403 people in nursing homes
- 54 people in other noninstitutional group quarters
- 29 people in homes or halfway houses for drug/alcohol abuse
- 19 people in homes for the mentally ill
- 15 people in other group homes
Banks with most branches in North Little Rock (2011 data):
- U.S. Bank National Association: 7 branches. Info updated 2012/01/30: Bank assets: $330,470.8 mil, Deposits: $236,091.5 mil, headquarters in Cincinnati, OH, positive income, 3121 total offices, Holding Company: U.S. Bancorp
- Centennial Bank: Rose City Branch, Camp Robinson Road Branch, Levy Branch, Twin City Bank Argenta Branch, Twin City Bank Branch. Info updated 2012/02/29: Bank assets: $3,588.2 mil, Deposits: $2,891.9 mil, headquarters in Conway, AR, positive income, Commercial Lending Specialization, 109 total offices, Holding Company: Home Bancshares, Inc.
- Bank of America, National Association: Rose City Branch, Downtown North Little Rock Branch, Indian Hills Branch, Mccain Branch. Info updated 2009/11/18: Bank assets: $1,451,969.3 mil, Deposits: $1,077,176.8 mil, headquarters in Charlotte, NC, positive income, 5782 total offices, Holding Company: Bank Of America Corporation
- Bank of the Ozarks: North Hills Branch, Levy Branch, East Mccain Branch. Info updated 2011/05/03: Bank assets: $3,828.0 mil, Deposits: $2,955.2 mil, headquarters in Little Rock, AR, positive income, Commercial Lending Specialization, 115 total offices, Holding Company: Bank Of The Ozarks Inc
- National Bank of Arkansas in North Little Rock: Maryland Branch, Pershing Branch, National Bank Of Arkansas In North L. Info updated 2006/11/03: Bank assets: $187.1 mil, Deposits: $153.0 mil, local headquarters, negative income in the last year, Commercial Lending Specialization, 7 total offices, Holding Company: National Banking Corp.
- Metropolitan National Bank: Levy Branch, Park Hill Branch, The Mccain Branch. Info updated 2006/11/03: Bank assets: $1,048.4 mil, Deposits: $915.0 mil, headquarters in Little Rock, AR, negative income in the last year, Commercial Lending Specialization, 46 total offices, Holding Company: Rogers Bancshares, Inc.
- Simmons First National Bank: Indian Hills Branch at 6907 John F Kennedy Boulevard, branch established on 2007/08/13; Lakewood Branch at 2401 Crestwood Road, branch established on 2007/08/13. Info updated 2010/10/19: Bank assets: $1,849.8 mil, Deposits: $1,513.0 mil, headquarters in Pine Bluff, AR, positive income, 45 total offices, Holding Company: Simmons First National Corporation
- Regions Bank: Jfk & Mccain Branch at 4900 John F. Kennedy Boulevard, branch established on 1933/01/01; Lakewood Branch at 4545 Fairway, branch established on 1988/09/21. Info updated 2011/02/24: Bank assets: $123,368.2 mil, Deposits: $98,301.3 mil, headquarters in Birmingham, AL, positive income, Commercial Lending Specialization, 1778 total offices, Holding Company: Regions Financial Corporation
- Iberiabank: East Mccain Branch at 4415 East Mccain, branch established on 2004/01/05; North Little Rock Branch at 4600 Jfk Boulevard, branch established on 1996/01/22. Info updated 2011/06/08: Bank assets: $11,676.7 mil, Deposits: $9,387.9 mil, headquarters in Lafayette, LA, positive income, Commercial Lending Specialization, 187 total offices, Holding Company: Iberiabank Corporation
- 6 other banks with 8 local branches
For population 15 years and over in North Little Rock:
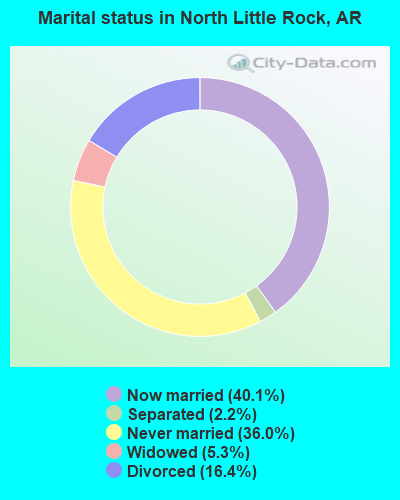
- Never married: 36.0%
- Now married: 40.1%
- Separated: 2.2%
- Widowed: 5.3%
- Divorced: 16.4%
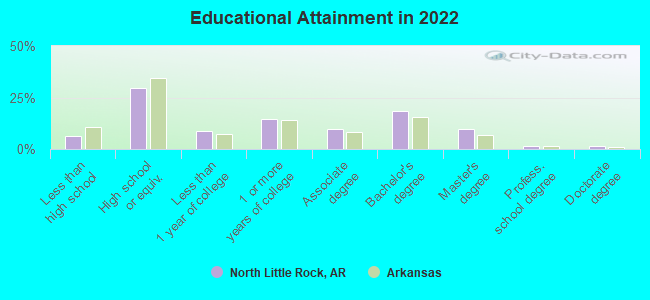
For population 25 years and over in North Little Rock:
- High school or higher: 91.5%
- Bachelor's degree or higher: 30.6%
- Graduate or professional degree: 12.2%
- Unemployed: 5.4%
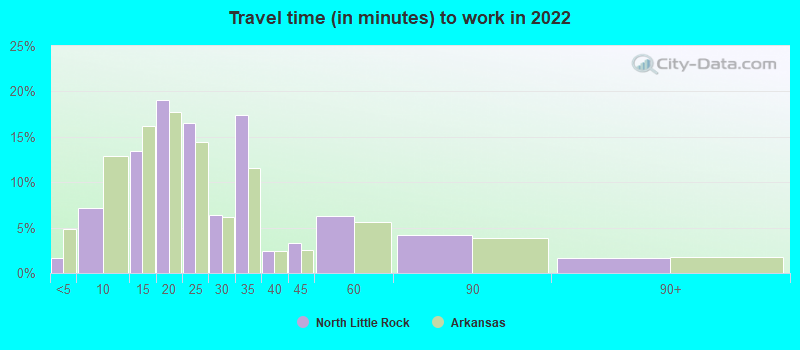
- Mean travel time to work (commute): 18.9 minutes
| Here: | 10.5 |
| Arkansas average: | 11.4 |
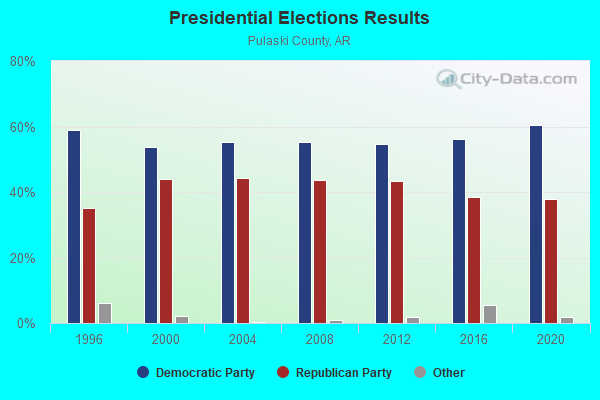
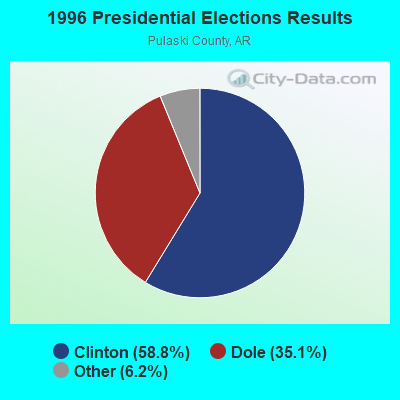
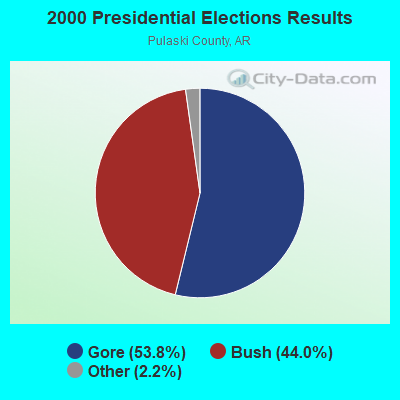
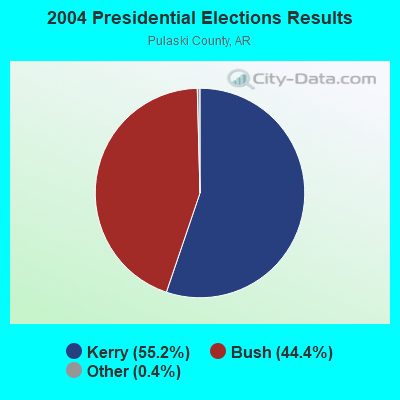
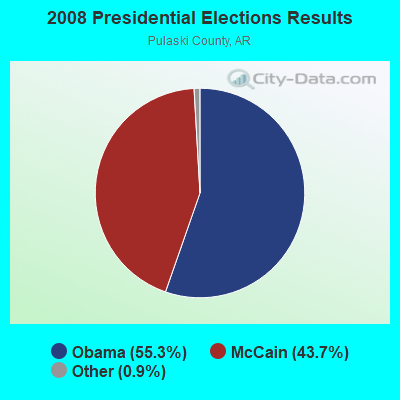

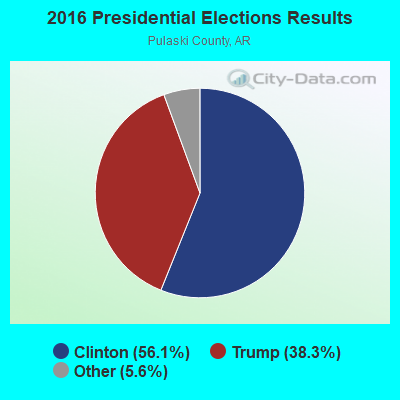
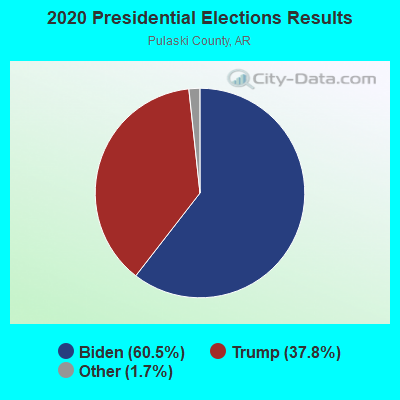
Graphs represent county-level data. Detailed 2008 Election Results
Political contributions by individuals in North Little Rock, AR
Religion statistics for North Little Rock, AR (based on Pulaski County data)
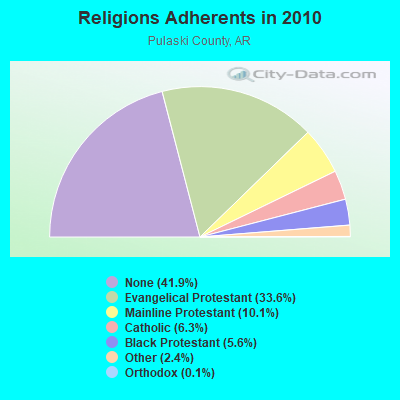
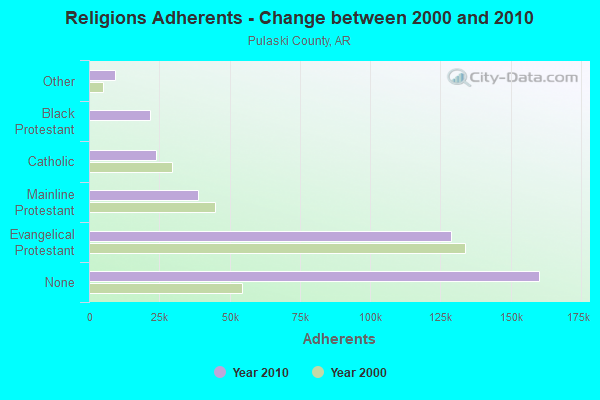
| Religion | Adherents | Congregations |
|---|---|---|
| Evangelical Protestant | 128,692 | 351 |
| Mainline Protestant | 38,729 | 82 |
| Catholic | 23,960 | 15 |
| Black Protestant | 21,575 | 75 |
| Other | 9,112 | 31 |
| Orthodox | 398 | 3 |
| None | 160,282 | - |
Food Environment Statistics:
| Pulaski County: | 1.95 / 10,000 pop. |
| Arkansas: | 2.02 / 10,000 pop. |
| This county: | 0.11 / 10,000 pop. |
| Arkansas: | 0.25 / 10,000 pop. |
| Pulaski County: | 0.67 / 10,000 pop. |
| Arkansas: | 0.59 / 10,000 pop. |
| This county: | 4.57 / 10,000 pop. |
| State: | 4.94 / 10,000 pop. |
| This county: | 8.18 / 10,000 pop. |
| Arkansas: | 6.66 / 10,000 pop. |
| This county: | 9.1% |
| State: | 9.8% |
| Pulaski County: | 27.0% |
| Arkansas: | 29.1% |
| This county: | 11.5% |
| Arkansas: | 13.6% |
Health and Nutrition:
| North Little Rock: | 49.3% |
| State: | 48.2% |
| This city: | 46.0% |
| Arkansas: | 44.2% |
| This city: | 29.1 |
| Arkansas: | 28.9 |
| North Little Rock: | 20.3% |
| Arkansas: | 21.6% |
| This city: | 11.9% |
| Arkansas: | 11.3% |
| North Little Rock: | 6.8 |
| Arkansas: | 6.8 |
| North Little Rock: | 34.6% |
| Arkansas: | 34.0% |
| North Little Rock: | 55.1% |
| State: | 54.4% |
| North Little Rock: | 79.1% |
| Arkansas: | 78.0% |
More about Health and Nutrition of North Little Rock, AR Residents
| Local government employment and payroll (March 2022) | |||||
| Function | Full-time employees | Monthly full-time payroll | Average yearly full-time wage | Part-time employees | Monthly part-time payroll |
|---|---|---|---|---|---|
| Firefighters | 177 | $932,839 | $63,243 | 2 | $564 |
| Police Protection - Officers | 175 | $1,011,958 | $69,391 | 0 | $0 |
| Electric Power | 112 | $683,227 | $73,203 | 2 | $3,802 |
| Sewerage | 87 | $400,387 | $55,226 | 0 | $0 |
| Parks and Recreation | 83 | $320,383 | $46,320 | 55 | $63,284 |
| Streets and Highways | 62 | $269,853 | $52,230 | 2 | $7,772 |
| Financial Administration | 45 | $257,767 | $68,738 | 3 | $4,745 |
| Other Government Administration | 41 | $186,643 | $54,627 | 1 | $1,288 |
| Other and Unallocable | 35 | $157,294 | $53,929 | 4 | $3,780 |
| Solid Waste Management | 34 | $132,678 | $46,828 | 0 | $0 |
| Local Libraries | 32 | $136,940 | $51,353 | 8 | $9,464 |
| Police - Other | 28 | $111,981 | $47,992 | 6 | $11,585 |
| Judicial and Legal | 20 | $101,622 | $60,973 | 3 | $2,788 |
| Health | 8 | $30,741 | $46,112 | 1 | $567 |
| Fire - Other | 4 | $16,470 | $49,410 | 0 | $0 |
| Welfare | 3 | $13,401 | $53,604 | 0 | $0 |
| Airports | 2 | $9,420 | $56,520 | 1 | $1,669 |
| Housing and Community Development (Local) | 1 | $6,103 | $73,236 | 1 | $1,215 |
| Totals for Government | 949 | $4,779,705 | $60,439 | 89 | $112,523 |
North Little Rock government finances - Expenditure in 2021 (per resident):
- Construction - Regular Highways: $12,473,000 ($193.00)
Electric Utilities: $7,962,000 ($123.20)
General - Other: $5,595,000 ($86.57)
Parks and Recreation: $293,000 ($4.53)
Air Transportation: $238,000 ($3.68)
- Current Operations - Electric Utilities: $57,149,000 ($884.29)
Police Protection: $24,570,000 ($380.18)
Local Fire Protection: $18,686,000 ($289.14)
General - Other: $18,078,000 ($279.73)
Sewerage: $14,172,000 ($219.29)
Parks and Recreation: $7,672,000 ($118.71)
Regular Highways: $6,220,000 ($96.24)
Solid Waste Management: $4,988,000 ($77.18)
Central Staff Services: $4,234,000 ($65.51)
Libraries: $3,185,000 ($49.28)
Judicial and Legal Services: $1,726,000 ($26.71)
Financial Administration: $1,270,000 ($19.65)
Housing and Community Development: $1,234,000 ($19.09)
Protective Inspection and Regulation - Other: $1,101,000 ($17.04)
Health - Other: $1,073,000 ($16.60)
General Public Buildings: $1,054,000 ($16.31)
Air Transportation: $283,000 ($4.38)
Miscellaneous Commercial Activities - Other: $85,000 ($1.32)
- Electric Utilities - Interest on Debt: $839,000 ($12.98)
- General - Interest on Debt: $2,665,000 ($41.24)
- Intergovernmental to Local - Other - Transit Utilities: $2,711,000 ($41.95)
Other - Correctional Institutions: $1,123,000 ($17.38)
Other - Judicial and Legal Services: $315,000 ($4.87)
Other - Public Welfare - Other: $153,000 ($2.37)
Other - Regular Highways: $35,000 ($0.54)
- Intergovernmental to State - Judicial and Legal Services: $800,000 ($12.38)
- Other Capital Outlay - General - Other: $5,096,000 ($78.85)
Parks and Recreation: $259,000 ($4.01)
Police Protection: $18,000 ($0.28)
North Little Rock government finances - Revenue in 2021 (per resident):
- Charges - Sewerage: $23,087,000 ($357.23)
Other: $1,239,000 ($19.17)
Parks and Recreation: $1,235,000 ($19.11)
Solid Waste Management: $1,100,000 ($17.02)
Air Transportation: $362,000 ($5.60)
Miscellaneous Commercial Activities: $133,000 ($2.06)
- Federal Intergovernmental - Housing and Community Development: $1,055,000 ($16.32)
Air Transportation: $238,000 ($3.68)
Health and Hospitals: $40,000 ($0.62)
- Local Intergovernmental - General Local Government Support: $14,766,000 ($228.48)
- Miscellaneous - Interest Earnings: $3,250,000 ($50.29)
Fines and Forfeits: $1,843,000 ($28.52)
General Revenue - Other: $1,774,000 ($27.45)
- Revenue - Electric Utilities: $87,824,000 ($1358.94)
- State Intergovernmental - Other: $3,516,000 ($54.40)
Health and Hospitals: $2,571,000 ($39.78)
Highways: $1,008,000 ($15.60)
General Local Government Support: $791,000 ($12.24)
Electric Utilities: $62,000 ($0.96)
- Tax - General Sales and Gross Receipts: $47,131,000 ($729.28)
Property: $19,264,000 ($298.08)
Other Selective Sales: $6,797,000 ($105.17)
Public Utilities Sales: $3,737,000 ($57.82)
Occupation and Business License - Other: $2,362,000 ($36.55)
Other License: $810,000 ($12.53)
Alcoholic Beverage Sales: $680,000 ($10.52)
Alcoholic Beverage License: $160,000 ($2.48)
Motor Fuels Sales: $6,000 ($0.09)
North Little Rock government finances - Debt in 2021 (per resident):
- Long Term Debt - Beginning Outstanding - Unspecified Public Purpose: $88,485,000 ($1369.16)
Outstanding Unspecified Public Purpose: $83,334,000 ($1289.46)
Beginning Outstanding - Public Debt for Private Purpose: $41,240,000 ($638.12)
Outstanding Nonguaranteed - Industrial Revenue: $31,425,000 ($486.25)
Retired Unspecified Public Purpose: $24,311,000 ($376.17)
Issue, Unspecified Public Purpose: $19,160,000 ($296.47)
Retired Nonguaranteed - Public Debt for Private Purpose: $9,815,000 ($151.87)
North Little Rock government finances - Cash and Securities in 2021 (per resident):
- Bond Funds - Cash and Securities: $6,105,000 ($94.47)
- Other Funds - Cash and Securities: $125,401,000 ($1940.38)
- Sinking Funds - Cash and Securities: $36,051,000 ($557.83)
6.88% of this county's 2021 resident taxpayers lived in other counties in 2020 ($53,988 average adjusted gross income)
| Here: | 6.88% |
| Arkansas average: | 7.82% |
0.05% of residents moved from foreign countries ($374 average AGI)
Pulaski County: 0.05% Arkansas average: 0.01%
Top counties from which taxpayers relocated into this county between 2020 and 2021:
| from Saline County, AR | |
| from Faulkner County, AR | |
| from Lonoke County, AR |
7.11% of this county's 2020 resident taxpayers moved to other counties in 2021 ($57,239 average adjusted gross income)
| Here: | 7.11% |
| Arkansas average: | 7.23% |
0.06% of residents moved to foreign countries ($424 average AGI)
Pulaski County: 0.06% Arkansas average: 0.01%
Top counties to which taxpayers relocated from this county between 2020 and 2021:
| to Saline County, AR | |
| to Lonoke County, AR | |
| to Faulkner County, AR |
| Businesses in North Little Rock, AR | ||||
| Name | Count | Name | Count | |
|---|---|---|---|---|
| AT&T | 4 | Lowe's | 1 | |
| Aeropostale | 1 | Marriott | 2 | |
| American Eagle Outfitters | 1 | MasterBrand Cabinets | 1 | |
| Applebee's | 1 | Maurices | 1 | |
| Arby's | 2 | McDonald's | 8 | |
| AutoZone | 1 | Men's Wearhouse | 1 | |
| Baskin-Robbins | 1 | Motel 6 | 1 | |
| Bed Bath & Beyond | 1 | Nike | 4 | |
| Best Western | 2 | Office Depot | 1 | |
| Blockbuster | 1 | Old Navy | 1 | |
| Burger King | 4 | Olive Garden | 1 | |
| Burlington Coat Factory | 1 | Outback | 1 | |
| Chevrolet | 1 | Outback Steakhouse | 1 | |
| Chick-Fil-A | 2 | Papa John's Pizza | 1 | |
| Chuck E. Cheese's | 1 | Payless | 2 | |
| Circle K | 1 | Penske | 2 | |
| Comfort Inn | 2 | PetSmart | 1 | |
| Cricket Wireless | 6 | Pier 1 Imports | 1 | |
| Days Inn | 2 | Pizza Hut | 2 | |
| Econo Lodge | 1 | Plato's Closet | 1 | |
| FedEx | 17 | Quality | 1 | |
| Ford | 1 | Quiznos | 1 | |
| GNC | 1 | Red Lobster | 1 | |
| GameStop | 3 | Red Roof Inn | 1 | |
| Goodwill | 1 | Rue21 | 1 | |
| H&R Block | 6 | SAS Shoes | 1 | |
| Hardee's | 1 | SONIC Drive-In | 2 | |
| Haworth | 1 | Shoe Carnival | 1 | |
| Hilton | 1 | Spencer Gifts | 1 | |
| Hobby Lobby | 1 | Sprint Nextel | 1 | |
| Holiday Inn | 2 | Starbucks | 1 | |
| Home Depot | 1 | Subway | 10 | |
| Honda | 1 | Super 8 | 2 | |
| Hot Topic | 1 | T-Mobile | 2 | |
| Hyundai | 1 | Taco Bell | 4 | |
| IHOP | 2 | Target | 1 | |
| JCPenney | 1 | Toyota | 1 | |
| Jimmy John's | 1 | Toys"R"Us | 1 | |
| Jones New York | 1 | U-Haul | 5 | |
| Journeys | 1 | UPS | 14 | |
| KFC | 3 | Vans | 2 | |
| Kincaid | 1 | Verizon Wireless | 2 | |
| Kroger | 4 | Waffle House | 4 | |
| Lane Furniture | 2 | Walgreens | 2 | |
| LensCrafters | 1 | Walmart | 2 | |
| Little Caesars Pizza | 3 | YMCA | 2 | |
| Long John Silver's | 1 | |||
Strongest AM radio stations in North Little Rock:
- KARN (920 AM; 5 kW; LITTLE ROCK, AR; Owner: CITADEL BROADCASTING COMPANY)
- KGHT (880 AM; 50 kW; SHERIDAN, AR; Owner: METROPOLITAN RADIO GROUP, INC.)
- KMTL (760 AM; daytime; 10 kW; SHERWOOD, AR; Owner: GEORGE V. DOMERESE)
- KLRG (1150 AM; 5 kW; NORTH LITTLE ROCK, AR; Owner: ARKANSAS RADIO CORPORATION)
- KAAY (1090 AM; 50 kW; LITTLE ROCK, AR; Owner: CITADEL BROADCASTING COMPANY)
- KJBN (1050 AM; 1 kW; LITTLE ROCK, AR; Owner: JOSHUA MINISTRIES & COMM.DEVELOP COR)
- KITA (1440 AM; 5 kW; LITTLE ROCK, AR; Owner: KITA, INCORPORATED)
- KDXE (1380 AM; 5 kW; NORTH LITTLE ROCK, AR; Owner: RADIO DISNEY AM 1380, LLC)
- KLIH (1250 AM; 2 kW; LITTLE ROCK, AR; Owner: CITADEL BROADCASTING COMPANY)
- KBBL (1350 AM; 2 kW; CABOT, AR; Owner: CABOT RADIO, INC.)
- WCRV (640 AM; 50 kW; COLLIERVILLE, TN; Owner: BOTT BROADCASTING COMPANY/TENNESSEE)
- KBHS (590 AM; 5 kW; HOT SPRINGS, AR; Owner: J & A, INC.)
- WDIA (1070 AM; 50 kW; MEMPHIS, TN; Owner: CLEAR CHANNEL BROADCASTING LICENSES, INC.)
Strongest FM radio stations in North Little Rock:
- KLAL (107.7 FM; WRIGHTSVILLE, AR; Owner: CITADEL BROADCASTING COMPANY)
- KSSN (95.7 FM; LITTLE ROCK, AR; Owner: CLEAR CHANNEL BROADCASTING LICENSES, INC.)
- KKPT (94.1 FM; LITTLE ROCK, AR; Owner: SIGNAL MEDIA OF ARKANSAS, INC.)
- KOKY (102.1 FM; SHERWOOD, AR; Owner: CITADEL BROADCASTING COMPANY)
- KABZ (103.7 FM; LITTLE ROCK, AR; Owner: SIGNAL MEDIA OF ARKANSAS, INC)
- KURB (98.5 FM; LITTLE ROCK, AR; Owner: CITADEL BROADCASTING COMPANY)
- KDRE (101.1 FM; NORTH LITTLE ROCK, AR; Owner: FLINN BROADCASTING CORPORATION)
- KDJE (100.3 FM; JACKSONVILLE, AR; Owner: CLEAR CHANNEL BROADCASTING LICENSES, INC.)
- KMJX (105.1 FM; CONWAY, AR; Owner: CLEAR CHANNEL BROADCASTING LICENSES, INC.)
- KHKN (106.7 FM; BENTON, AR; Owner: CLEAR CHANNEL BROADCASTING LICENSES, INC.)
- KUAR (89.1 FM; LITTLE ROCK, AR; Owner: BD. OF TRUSTEES OF UNIV. OF ARKANSAS)
- KMSX (94.9 FM; MAUMELLE, AR; Owner: CLEAR CHANNEL BROADCASTING LICENSES, INC.)
- KABF (88.3 FM; LITTLE ROCK, AR; Owner: ARKANSAS BROADCASTING FOUNDATION INC)
- KWLR (96.9 FM; MAUMELLE, AR; Owner: FLINN BROADCASTING CORPORATION)
- KLRE-FM (90.5 FM; LITTLE ROCK, AR; Owner: LITTLE ROCK SCHOOL DISTRICT)
- KIPR (92.3 FM; PINE BLUFF, AR; Owner: CITADEL BROADCASTING COMPANY)
- KKZR (93.3 FM; BRYANT, AR; Owner: ABG ARKANSAS, LLC)
- KLEC-FM (106.3 FM; LONOKE, AR; Owner: ABG ARKANSAS, LLC)
- KHTE-FM (96.5 FM; ENGLAND, AR; Owner: ABG ARKANSAS, LLC)
- KARN-FM (102.5 FM; CABOT, AR; Owner: CITADEL BROADCASTING COMPANY)
TV broadcast stations around North Little Rock:
- KJLR-LP (Channel 28; LITTLE ROCK, ETC., AR; Owner: COWSERT FAMILY, L.L.C.)
- K55GE (Channel 55; LITTLE ROCK, AR; Owner: THREE ANGELS BROADCASTING NETWORK INC.)
- KLRA-LP (Channel 58; LITTLE ROCK, AR; Owner: ARKANSAS MEDIA, L.L.C.)
- KHUG-LP (Channel 14; LITTLE ROCK, AR; Owner: LITTLE ROCK TV-14, L.L.C.)
- KTHV (Channel 11; LITTLE ROCK, AR; Owner: ARKANSAS TELEVISION COMPANY)
- KATV (Channel 7; LITTLE ROCK, AR; Owner: KATV, LLC)
- KETS (Channel 2; LITTLE ROCK, AR; Owner: ARKANSAS EDUCATIONAL TELEVISION COMMISSION)
- KLRT-TV (Channel 16; LITTLE ROCK, AR; Owner: CLEAR CHANNEL BROADCASTING LICENSES, INC.)
- KARK-TV (Channel 4; LITTLE ROCK, AR; Owner: KARK-TV, INC.)
- KWBF (Channel 42; LITTLE ROCK, AR; Owner: RIVER CITY BROADCASTING, INC.)
- KKYK-LP (Channel 22; LITTLE ROCK, AR; Owner: ARKANSAS 49, INC.)
- KASN (Channel 38; PINE BLUFF, AR; Owner: CLEAR CHANNEL BROADCASTING LICENSES, INC.)
- KHTE-LP (Channel 44; LITTLE ROCK, AR; Owner: EQUITY BROADCASTING CORPORATION)
- KVTN (Channel 25; PINE BLUFF, AR; Owner: AGAPE CHURCH, INC.)
- K27FF (Channel 27; EL DORADO, AR; Owner: MS COMMUNICATIONS, LLC)
- KZJG-LP (Channel 13; LITTLE ROCK, ETC., AR; Owner: COWSERT FAMILY, L.L.C.)
- K34FH (Channel 34; LITTLE ROCK, AR; Owner: NATIONAL MINORITY T.V., INC.)
- National Bridge Inventory (NBI) Statistics
- 252Number of bridges
- 3,658ft / 1,115mTotal length
- $39,971,000Total costs
- 5,794,084Total average daily traffic
- 230,641Total average daily truck traffic
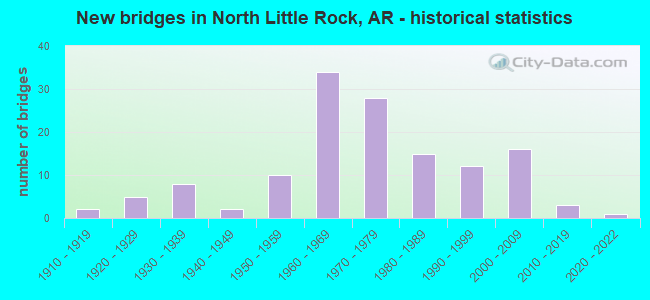
- New bridges - historical statistics
- 21910-1919
- 51920-1929
- 81930-1939
- 21940-1949
- 101950-1959
- 341960-1969
- 281970-1979
- 151980-1989
- 121990-1999
- 162000-2009
- 32010-2019
- 12020-2022
FCC Registered Private Land Mobile Towers: 4 (See the full list of FCC Registered Private Land Mobile Towers in North Little Rock, AR)
FCC Registered Broadcast Land Mobile Towers: 45 (See the full list of FCC Registered Broadcast Land Mobile Towers)
FCC Registered Microwave Towers: 45 (See the full list of FCC Registered Microwave Towers in this town)
FCC Registered Paging Towers: 4 (See the full list of FCC Registered Paging Towers)
FCC Registered Maritime Coast & Aviation Ground Towers: 4 (See the full list of FCC Registered Maritime Coast & Aviation Ground Towers)
FCC Registered Amateur Radio Licenses: 342 (See the full list of FCC Registered Amateur Radio Licenses in North Little Rock)
FAA Registered Aircraft Manufacturers and Dealers: 11 (See the full list of FAA Registered Manufacturers and Dealers in North Little Rock)
FAA Registered Aircraft: 70 (See the full list of FAA Registered Aircraft)
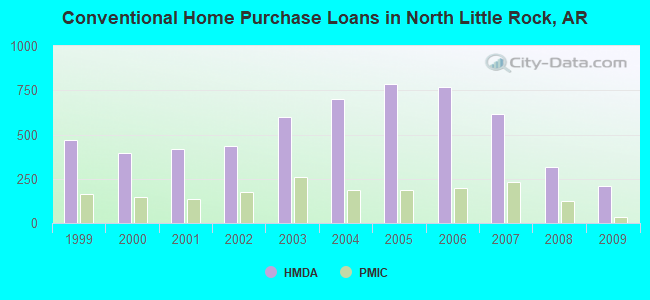
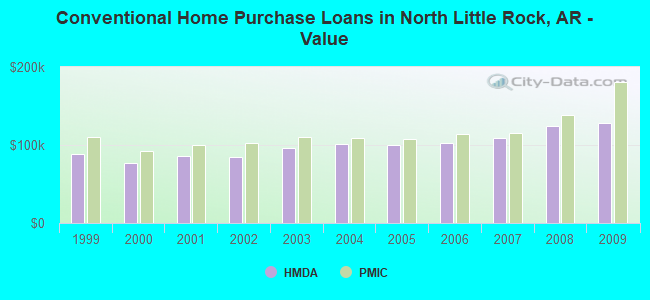
| Home Mortgage Disclosure Act Aggregated Statistics For Year 2009 (Based on 6 full and 9 partial tracts) | ||||||||||||||
| A) FHA, FSA/RHS & VA Home Purchase Loans | B) Conventional Home Purchase Loans | C) Refinancings | D) Home Improvement Loans | E) Loans on Dwellings For 5+ Families | F) Non-occupant Loans on < 5 Family Dwellings (A B C & D) | G) Loans On Manufactured Home Dwelling (A B C & D) | ||||||||
|---|---|---|---|---|---|---|---|---|---|---|---|---|---|---|
| Number | Average Value | Number | Average Value | Number | Average Value | Number | Average Value | Number | Average Value | Number | Average Value | Number | Average Value | |
| LOANS ORIGINATED | 352 | $126,663 | 208 | $127,905 | 721 | $124,988 | 109 | $27,480 | 4 | $182,565 | 132 | $66,481 | 3 | $25,740 |
| APPLICATIONS APPROVED, NOT ACCEPTED | 10 | $130,599 | 5 | $96,320 | 42 | $155,687 | 14 | $18,352 | 0 | $0 | 3 | $62,767 | 3 | $63,083 |
| APPLICATIONS DENIED | 55 | $109,674 | 36 | $107,262 | 250 | $135,065 | 83 | $31,519 | 1 | $4,000,000 | 38 | $62,343 | 5 | $69,776 |
| APPLICATIONS WITHDRAWN | 45 | $129,073 | 29 | $129,418 | 173 | $135,917 | 7 | $68,941 | 2 | $8,626,500 | 24 | $76,840 | 0 | $0 |
| FILES CLOSED FOR INCOMPLETENESS | 18 | $126,521 | 5 | $200,740 | 39 | $112,278 | 4 | $37,982 | 0 | $0 | 3 | $50,333 | 0 | $0 |
Detailed mortgage data for all 15 tracts in North Little Rock, AR
| Private Mortgage Insurance Companies Aggregated Statistics For Year 2009 (Based on 5 full and 7 partial tracts) | ||||||
| A) Conventional Home Purchase Loans | B) Refinancings | C) Non-occupant Loans on < 5 Family Dwellings (A & B) | ||||
|---|---|---|---|---|---|---|
| Number | Average Value | Number | Average Value | Number | Average Value | |
| LOANS ORIGINATED | 32 | $180,528 | 27 | $166,967 | 0 | $0 |
| APPLICATIONS APPROVED, NOT ACCEPTED | 7 | $123,703 | 9 | $205,784 | 3 | $75,333 |
| APPLICATIONS DENIED | 4 | $277,865 | 7 | $149,436 | 0 | $0 |
| APPLICATIONS WITHDRAWN | 2 | $185,645 | 5 | $88,332 | 1 | $93,000 |
| FILES CLOSED FOR INCOMPLETENESS | 1 | $79,280 | 1 | $197,000 | 1 | $79,280 |
2002 - 2018 National Fire Incident Reporting System (NFIRS) incidents
- Fire incident types reported to NFIRS in North Little Rock, AR
- 2,15640.6%Outside Fires
- 2,04438.5%Structure Fires
- 94817.9%Mobile Property/Vehicle Fires
- 1562.9%Other
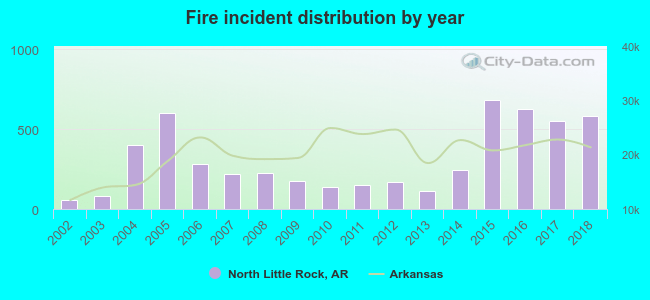 Based on the data from the years 2002 - 2018 the average number of fires per year is 312. The highest number of reported fires - 680 took place in 2015, and the least - 58 in 2002. The data has an increasing trend.
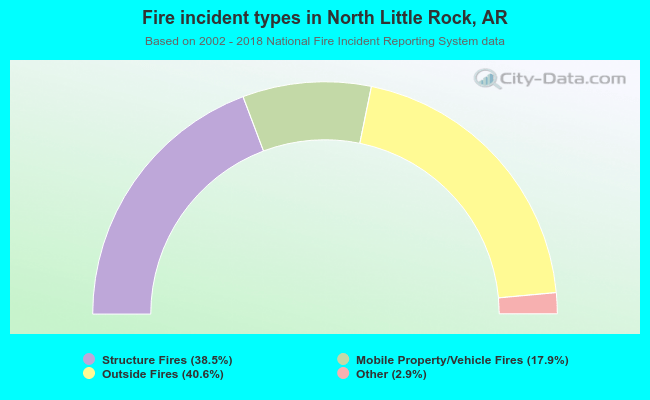 When looking into fire subcategories, the most incidents belonged to: Outside Fires (40.6%), and Structure Fires (38.5%).
Fire-safe hotels and motels in North Little Rock, Arkansas:
- Wyndham Riverfront, 2 Riverfront Pl, North Little Rock, Arkansas 72114 , Phone: (501) 371-9000, Fax: (501) 907-4897
- Quality Inn, 500 W 29th St, North Little Rock, Arkansas 72114 , Phone: (501) 771-2090, Fax: (501) 771-0410
- Budgetel Inn & Suites, 111 W Pershing Blvd, North Little Rock, Arkansas 72114 , Phone: (501) 758-1440, Fax: (501) 758-2094
- Rose Motel, 4813 E Broadway St, North Little Rock, Arkansas 72117 , Phone: (501) 945-0676, Fax: (501) 845-7224
- Baymont by Wyndham North Little Rock, 110 E Pershing Blvd, North Little Rock, Arkansas 72114 , Phone: (501) 758-2002, Fax: (501) 758-6755
- Super 8 Mccain, 3925 Mccain Park Dr, North Little Rock, Arkansas 72116 , Phone: (501) 791-3200, Fax: (501) 791-3200
- Wingate by Wyndham North Little Rock, 4801 W Commercial Dr, North Little Rock, Arkansas 72116 , Phone: (501) 753-8660, Fax: (501) 753-3433
- Super 8 Motel, One Gray Rd, North Little Rock, Arkansas 72117 , Phone: (501) 945-0141, Fax: (501) 945-7224
- 13 other hotels and motels
| Most common first names in North Little Rock, AR among deceased individuals | ||
| Name | Count | Lived (average) |
|---|---|---|
| James | 630 | 69.7 years |
| William | 613 | 72.3 years |
| Mary | 593 | 78.3 years |
| John | 586 | 72.9 years |
| Robert | 384 | 69.9 years |
| Charles | 307 | 69.0 years |
| George | 259 | 73.8 years |
| Willie | 246 | 74.1 years |
| Thomas | 188 | 71.5 years |
| Ruth | 165 | 77.9 years |
| Most common last names in North Little Rock, AR among deceased individuals | ||
| Last name | Count | Lived (average) |
|---|---|---|
| Smith | 407 | 72.3 years |
| Williams | 295 | 72.7 years |
| Johnson | 256 | 71.0 years |
| Jones | 230 | 70.6 years |
| Brown | 214 | 72.8 years |
| Davis | 199 | 72.4 years |
| Jackson | 145 | 72.5 years |
| Wilson | 139 | 76.6 years |
| Moore | 137 | 73.8 years |
| Martin | 125 | 72.5 years |
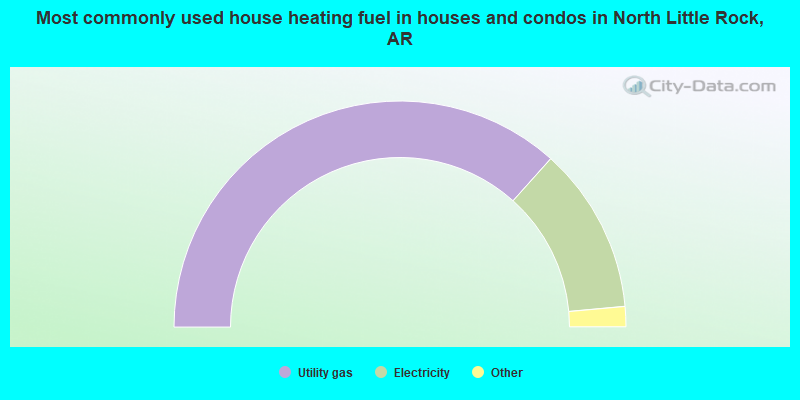
- 73.2%Utility gas
- 23.8%Electricity
- 2.3%Bottled, tank, or LP gas
- 0.3%Solar energy
- 0.2%Wood
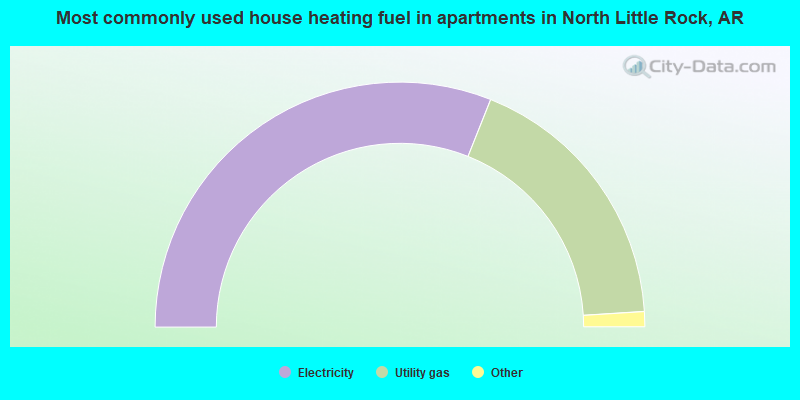
- 62.1%Electricity
- 35.9%Utility gas
- 1.5%Bottled, tank, or LP gas
- 0.4%No fuel used
North Little Rock compared to Arkansas state average:
- Unemployed percentage below state average.
- Black race population percentage significantly above state average.
- Length of stay since moving in significantly above state average.
- Percentage of population with a bachelor's degree or higher above state average.
North Little Rock on our top lists:
- #1 on the list of "Top 101 cities with largest percentage of males in occupations: community and social service occupations (population 50,000+)"
- #2 on the list of "Top 101 cities with largest percentage of males in industries: other services, except public administration (population 50,000+)"
- #4 on the list of "Top 101 cities with the highest number of thefts per 100,000 residents, excludes tourist destinations and others with a lot of outsiders visiting based on city industries data (population 50,000+)"
- #14 on the list of "Top 101 cities with largest percentage of females in industries: utilities (population 50,000+)"
- #16 on the list of "Top 101 cities with largest percentage of females in occupations: installation, maintenance, and repair occupations (population 50,000+)"
- #25 on the list of "Top 101 cities with largest percentage of males in industries: information (population 50,000+)"
- #28 on the list of "Top 101 cities with the highest number of burglaries per 100,000 residents, excludes tourist destinations and others with a lot of outsiders visiting based on city industries data (population 50,000+)"
- #31 on the list of "Top 101 cities with largest percentage of males in occupations: installation, maintenance, and repair occupations (population 50,000+)"
- #32 on the list of "Top 101 cities with the highest city-data.com crime index, excludes tourist destinations and others with a lot of outsiders visiting based on city industries data (population 50,000+)"
- #41 on the list of "Top 101 cities with the highest number of police officers per 1000 residents (population 50,000+)"
- #48 on the list of "Top 101 cities with largest percentage of females in occupations: personal care and service occupations (population 50,000+)"
- #57 on the list of "Top 101 cities with the highest percentage of English-only speaking households, population 50,000+"
- #60 on the list of "Top 101 cities with largest percentage of females in occupations: production occupations (population 50,000+)"
- #60 on the list of "Top 101 cities with largest percentage of males in industries: administrative and support and waste management services (population 50,000+)"
- #68 on the list of "Top 101 cities with the highest number of murders per 100,000 residents, excludes tourist destinations and others with a lot of outsiders visiting based on city industries data (population 50,000+)"
- #75 on the list of "Top 101 cities with largest percentage population decreases in the 1990s) (population 50,000+)"
- #79 on the list of "Top 101 cities with largest percentage of females in industries: other services, except public administration (population 50,000+)"
- #80 on the list of "Top 101 cities with the most people born in the same U.S. state as the city (population 50,000+)"
- #82 on the list of "Top 101 cities with the largest city-data.com crime index decrease from 2011 to 2012 (population 50,000+)"
- #86 on the list of "Top 100 cities with the largest percentage of females (pop. 50,000+)"
- #77 (72114) on the list of "Top 101 zip codes with the lowest 2012 average net capital gain/loss (pop 5,000+)"
- #26 on the list of "Top 101 counties with the highest percentage of residents that keep firearms around their homes"
- #30 on the list of "Top 101 counties with the most Black Protestant congregations"
- #35 on the list of "Top 101 counties with the highest number of infant deaths per 1000 residents 2007-2013 (pop. 50,000+)"
- #45 on the list of "Top 101 counties with the most Black Protestant adherents"
- #52 on the list of "Top 101 counties with the lowest percentage of residents that drank alcohol in the past 30 days"

|
|
Total of 63 patent applications in 2008-2024.