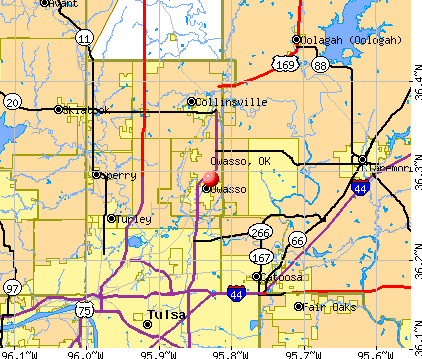
Owasso, Oklahoma
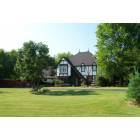
Owasso: Eastwood Lake Estates

Owasso: Ducks on the pond at Elm Creek Park
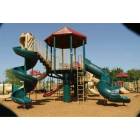
Owasso: Funtastic Island Community Built Park
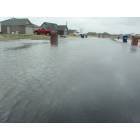
Owasso: our neighborhood Tuesday afternoon after all the rain we got
- add
your
Submit your own pictures of this city and show them to the world
- OSM Map
- General Map
- Google Map
- MSN Map
Population change since 2000: +112.6%
| Males: 19,809 | |
| Females: 19,519 |
| Median resident age: | 33.8 years |
| Oklahoma median age: | 37.1 years |
Zip codes: 74117.
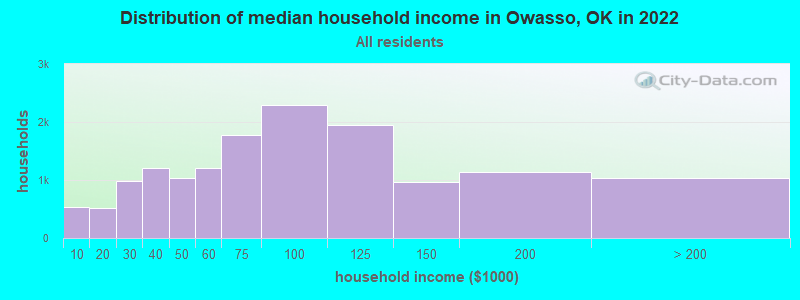
| Owasso: | $76,880 |
| OK: | $59,673 |
Estimated per capita income in 2022: $33,520 (it was $19,417 in 2000)
Owasso city income, earnings, and wages data
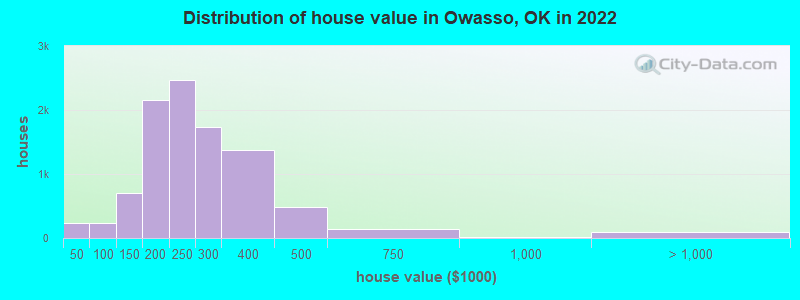
Estimated median house or condo value in 2022: $245,992 (it was $96,400 in 2000)
| Owasso: | $245,992 |
| OK: | $191,700 |
Mean prices in 2022: all housing units: $264,706; detached houses: $268,640; townhouses or other attached units: $183,151; mobile homes: $36,360
Median gross rent in 2022: $1,183.
(6.5% for White Non-Hispanic residents, 4.6% for Black residents, 10.7% for Hispanic or Latino residents, 9.9% for American Indian residents, 14.9% for Native Hawaiian and other Pacific Islander residents, 17.5% for other race residents, 5.0% for two or more races residents)
Detailed information about poverty and poor residents in Owasso, OK


Compare current foreclosures in Owasso, OK:
| Photo | Address | Area | Beds / Baths | Price | Details |
|---|---|---|---|---|---|

|
#1
E 78th St N
Owasso, OK 74055
|
1,284 sq. feet
|
2 baths 3 beds |
show details | |

|
#2
E 95th St N
Owasso, OK 74055
|
3,815 sq. feet
|
3 baths 4 beds |
show details | |

|
#3
N 167th East Ave
Owasso, OK 74055
|
1,878 sq. feet
|
2 baths 3 beds |
show details | |

|
#4
E 112th St N
Owasso, OK 74055
|
1,559 sq. feet
|
2 baths - beds |
show details | |

|
#5
E 90th St N
Owasso, OK 74055
|
2,306 sq. feet
|
2 baths - beds |
show details | |

|
#6
E 113th St N
Owasso, OK 74055
|
1,430 sq. feet
|
2 baths - beds |
show details | |

|
#7
N 96th East Ave
Owasso, OK 74055
|
2,884 sq. feet
|
3 baths - beds |
show details | |

|
#8
N 131st East Ave
Owasso, OK 74055
|
2,374 sq. feet
|
2 baths - beds |
show details | |

|
#9
W 10th St
Owasso, OK 74055
|
1,378 sq. feet
|
2 baths - beds |
show details | |

|
#10
N 132nd East Ave
Owasso, OK 74055
|
1,549 sq. feet
|
2 baths - beds |
show details |
| Photo | Address | Area | Beds / Baths | Price | Details |
|---|---|---|---|---|---|

|
#11
E 101st St N
Owasso, OK 74055
|
1,479 sq. feet
|
2 baths - beds |
show details | |

|
#12
E 111th St N
Owasso, OK 74055
|
1,424 sq. feet
|
2 baths - beds |
show details | |

|
#13
N 114th East Ct
Owasso, OK 74055
|
2,484 sq. feet
|
2 baths - beds |
show details | |

|
#14
N Elm Pl
Owasso, OK 74055
|
1,310 sq. feet
|
1 baths - beds |
show details | |

|
#15
N Carlsbad St
Owasso, OK 74055
|
1,384 sq. feet
|
1 baths - beds |
show details | |

|
#16
N 96th East Ave
Owasso, OK 74055
|
2,674 sq. feet
|
2 baths - beds |
show details | |

|
#17
E 112th Pl N
Owasso, OK 74055
|
1,312 sq. feet
|
1 baths - beds |
show details | |

|
#18
N 144th East Ave
Owasso, OK 74055
|
1,358 sq. feet
|
2 baths - beds |
show details | |

|
#19
N 70th East Ave
Owasso, OK 74055
|
- sq. feet
|
- baths - beds |
show details | |

|
#20
N 153rd East Ave
Owasso, OK 74055
|
- sq. feet
|
- baths - beds |
show details |
| Photo | Address | Area | Beds / Baths | Price | Details |
|---|---|---|---|---|---|

|
#21
E 112th St N
Owasso, OK 74055
|
- sq. feet
|
- baths - beds |
show details | |

|
#22
N 124th East Ave Apt 4
Owasso, OK 74055
|
- sq. feet
|
- baths - beds |
show details | |

|
#23
E 88th Pl N Apt 1221
Owasso, OK 74055
|
- sq. feet
|
- baths - beds |
show details | |

|
#24
N 117th East Ave
Owasso, OK 74055
|
- sq. feet
|
- baths - beds |
show details | |

|
#25
N 140th East Pl
Owasso, OK 74055
|
- sq. feet
|
- baths - beds |
show details | |

|
#26
N 178th East Ave
Owasso, OK 74055
|
- sq. feet
|
- baths - beds |
show details | |

|
#27
E 90th St N
Owasso, OK 74055
|
- sq. feet
|
- baths - beds |
show details | |

|
#28
N 112nd Ave N
Owasso, OK 74055
|
- sq. feet
|
- baths - beds |
show details | |

|
#29
E 83rd St N Apt 102
Owasso, OK 74055
|
- sq. feet
|
- baths - beds |
show details | |

|
#30
E 76th St N
Owasso, OK 74055
|
- sq. feet
|
- baths - beds |
show details |
| Photo | Address | Area | Beds / Baths | Price | Details |
|---|---|---|---|---|---|

|
#31
N 97th East Ave Apt 1807
Owasso, OK 74055
|
- sq. feet
|
- baths - beds |
show details | |

|
Check over 1 million property listings on Foreclosure.com!
|
browse all offers | |||


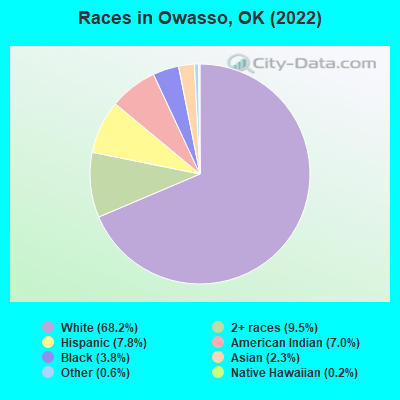
- 26,33668.2%White alone
- 3,6729.5%Two or more races
- 3,0097.8%Hispanic
- 2,6877.0%American Indian alone
- 1,4623.8%Black alone
- 8742.3%Asian alone
- 2300.6%Other race alone
- 650.2%Native Hawaiian and Other
Pacific Islander alone
Races in Owasso detailed stats: ancestries, foreign born residents, place of birth
According to our research of Oklahoma and other state lists, there were 17 registered sex offenders living in Owasso, Oklahoma as of April 27, 2024.
The ratio of all residents to sex offenders in Owasso is 2,017 to 1.
The ratio of registered sex offenders to all residents in this city is much lower than the state average.
Type |
2009 |
2010 |
2011 |
2012 |
2013 |
2014 |
2015 |
2016 |
2017 |
2018 |
2019 |
2020 |
2021 |
2022 |
|---|---|---|---|---|---|---|---|---|---|---|---|---|---|---|
| Murders (per 100,000) | 0 (0.0) | 0 (0.0) | 0 (0.0) | 0 (0.0) | 0 (0.0) | 0 (0.0) | 2 (5.7) | 2 (5.6) | 0 (0.0) | 1 (2.7) | 2 (5.3) | 2 (5.3) | 0 (0.0) | 0 (0.0) |
| Rapes (per 100,000) | 4 (14.0) | 2 (6.9) | 7 (24.0) | 9 (30.0) | 5 (15.6) | 9 (27.2) | 6 (17.2) | 19 (53.4) | 20 (54.2) | 20 (53.7) | 13 (34.5) | 18 (47.6) | 21 (55.2) | 14 (35.9) |
| Robberies (per 100,000) | 5 (17.5) | 11 (38.0) | 7 (24.0) | 5 (16.6) | 4 (12.5) | 5 (15.1) | 3 (8.6) | 9 (25.3) | 9 (24.4) | 12 (32.2) | 10 (26.6) | 13 (34.4) | 2 (5.3) | 3 (7.7) |
| Assaults (per 100,000) | 68 (237.5) | 29 (100.3) | 70 (239.5) | 42 (139.8) | 51 (159.5) | 38 (114.6) | 40 (114.9) | 47 (132.2) | 43 (116.6) | 43 (115.5) | 55 (146.1) | 52 (137.5) | 37 (97.2) | 40 (102.6) |
| Burglaries (per 100,000) | 131 (457.5) | 108 (373.5) | 119 (407.2) | 166 (552.6) | 107 (334.7) | 69 (208.2) | 64 (183.8) | 79 (222.2) | 105 (284.8) | 81 (217.6) | 78 (207.1) | 77 (203.6) | 47 (123.5) | 66 (169.2) |
| Thefts (per 100,000) | 485 (1,694) | 680 (2,352) | 559 (1,913) | 577 (1,921) | 578 (1,808) | 388 (1,171) | 311 (893.3) | 655 (1,842) | 551 (1,494) | 727 (1,953) | 653 (1,734) | 585 (1,547) | 453 (1,190) | 481 (1,233) |
| Auto thefts (per 100,000) | 46 (160.7) | 38 (131.4) | 41 (140.3) | 27 (89.9) | 52 (162.6) | 29 (87.5) | 46 (132.1) | 57 (160.3) | 78 (211.6) | 70 (188.1) | 58 (154.0) | 60 (158.7) | 87 (228.6) | 68 (174.4) |
| Arson (per 100,000) | 2 (7.0) | 5 (17.3) | 3 (10.3) | 1 (3.3) | 2 (6.3) | 2 (6.0) | 1 (2.9) | 1 (2.8) | 1 (2.7) | 2 (5.4) | 2 (5.3) | 1 (2.6) | 0 (0.0) | 0 (0.0) |
| City-Data.com crime index | 176.6 | 167.7 | 190.5 | 179.6 | 156.9 | 117.6 | 110.0 | 190.1 | 170.7 | 189.5 | 171.6 | 175.3 | 139.7 | 126.7 |
The City-Data.com crime index weighs serious crimes and violent crimes more heavily. Higher means more crime, U.S. average is 246.1. It adjusts for the number of visitors and daily workers commuting into cities.
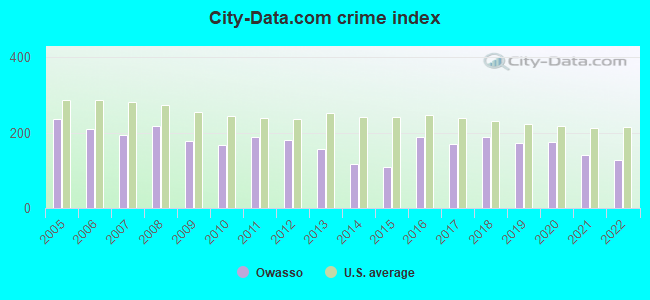
Crime rate in Owasso detailed stats: murders, rapes, robberies, assaults, burglaries, thefts, arson
Full-time law enforcement employees in 2021, including police officers: 82 (63 officers - 55 male; 8 female).
| Officers per 1,000 residents here: | 1.66 |
| Oklahoma average: | 2.27 |
 Recent articles from our blog. Our writers, many of them Ph.D. graduates or candidates, create easy-to-read articles on a wide variety of topics.

 | Tulsa Int'l Airport (TUL) - flight paths over Owasso (4 replies) |
| Jenks or Owasso? (3 replies) |
| Looking to move to Bartlesville-Tulsa (34 replies) |
| Relocsting for work--what is racial climate of Bartlesville/Owasso/Collinsville areas? (16 replies) |
| Owasso to Bartlesville? (18 replies) |
| Possible move from Ca to Jenks Oklahoma... (15 replies) |
Latest news from Owasso, OK collected exclusively by city-data.com from local newspapers, TV, and radio stations
Owasso, OK City Guides:
Ancestries: English (14.2%), American (11.6%), German (7.1%), Irish (5.7%), European (2.4%), Italian (1.9%).
Current Local Time: CST time zone
Incorporated in 1904
Elevation: 610 feet
Land area: 10.0 square miles.
Population density: 3,920 people per square mile (average).
1,522 residents are foreign born (2.0% Latin America, 1.2% Asia, 0.4% Europe).
| This city: | 3.9% |
| Oklahoma: | 6.1% |
Median real estate property taxes paid for housing units with mortgages in 2022: $1,992 (0.8%)
Median real estate property taxes paid for housing units with no mortgage in 2022: $1,994 (0.8%)
Nearest city with pop. 50,000+: Tulsa, OK  (12.6 miles , pop. 393,049).
Nearest city with pop. 1,000,000+: Dallas, TX (247.5 miles , pop. 1,188,580).
Nearest cities:
), ), ), )Latitude: 36.29 N, Longitude: 95.83 W
Daytime population change due to commuting: -3,609 (-9.3%)
Workers who live and work in this city: 5,923 (30.4%)
Area code: 918
Property values in Owasso, OK
Owasso, Oklahoma accommodation & food services, waste management - Economy and Business Data
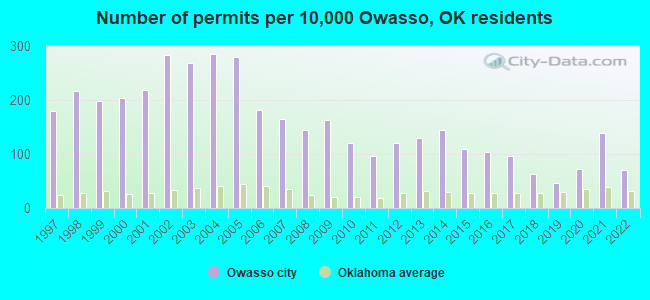
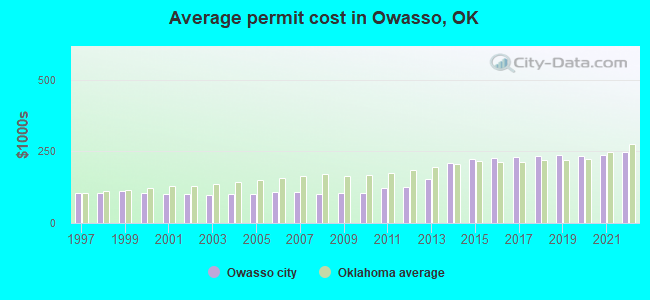
Single-family new house construction building permits:
- 2022: 131 buildings, average cost: $249,200
- 2021: 258 buildings, average cost: $238,700
- 2020: 134 buildings, average cost: $233,900
- 2019: 86 buildings, average cost: $237,100
- 2018: 117 buildings, average cost: $234,900
- 2017: 177 buildings, average cost: $229,700
- 2016: 190 buildings, average cost: $227,200
- 2015: 204 buildings, average cost: $223,000
- 2014: 266 buildings, average cost: $211,300
- 2013: 238 buildings, average cost: $154,700
- 2012: 224 buildings, average cost: $126,400
- 2011: 179 buildings, average cost: $123,700
- 2010: 224 buildings, average cost: $106,200
- 2009: 302 buildings, average cost: $104,600
- 2008: 267 buildings, average cost: $102,600
- 2007: 305 buildings, average cost: $107,900
- 2006: 336 buildings, average cost: $107,500
- 2005: 518 buildings, average cost: $102,100
- 2004: 528 buildings, average cost: $100,400
- 2003: 495 buildings, average cost: $96,800
- 2002: 526 buildings, average cost: $99,800
- 2001: 406 buildings, average cost: $101,800
- 2000: 377 buildings, average cost: $103,800
- 1999: 369 buildings, average cost: $112,500
- 1998: 401 buildings, average cost: $106,100
- 1997: 333 buildings, average cost: $105,700
| Here: | 3.1% |
| Oklahoma: | 3.2% |
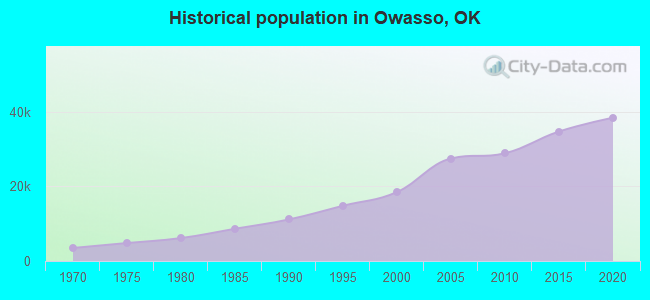
Population change in the 1990s: +6,854 (+58.8%).
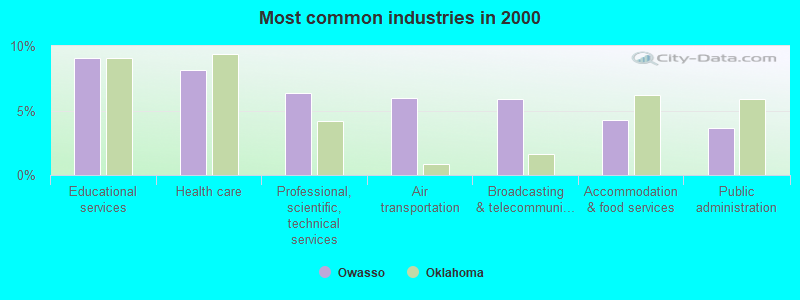
- Educational services (9.1%)
- Health care (8.1%)
- Professional, scientific, technical services (6.4%)
- Air transportation (6.0%)
- Broadcasting & telecommunications (5.9%)
- Accommodation & food services (4.3%)
- Public administration (3.6%)
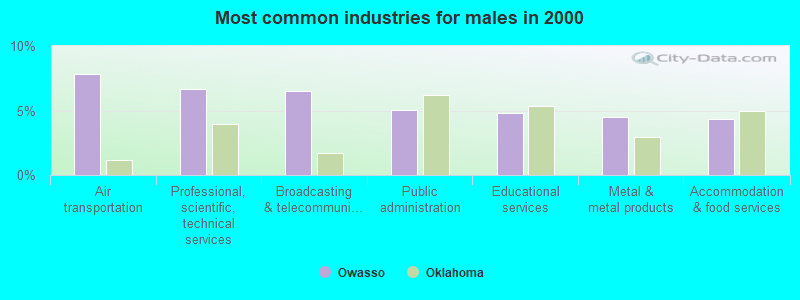
- Air transportation (7.8%)
- Professional, scientific, technical services (6.7%)
- Broadcasting & telecommunications (6.5%)
- Public administration (5.1%)
- Educational services (4.8%)
- Metal & metal products (4.5%)
- Accommodation & food services (4.3%)
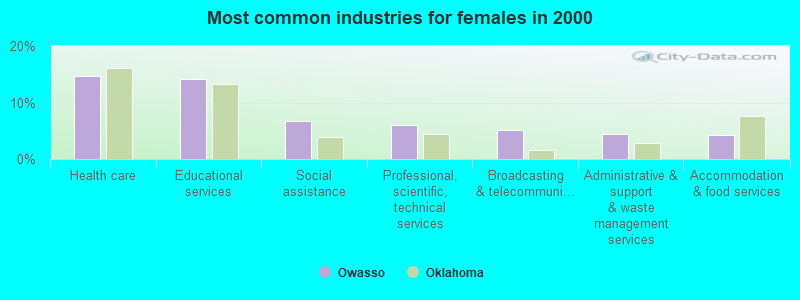
- Health care (14.6%)
- Educational services (14.2%)
- Social assistance (6.8%)
- Professional, scientific, technical services (6.0%)
- Broadcasting & telecommunications (5.2%)
- Administrative & support & waste management services (4.4%)
- Accommodation & food services (4.2%)
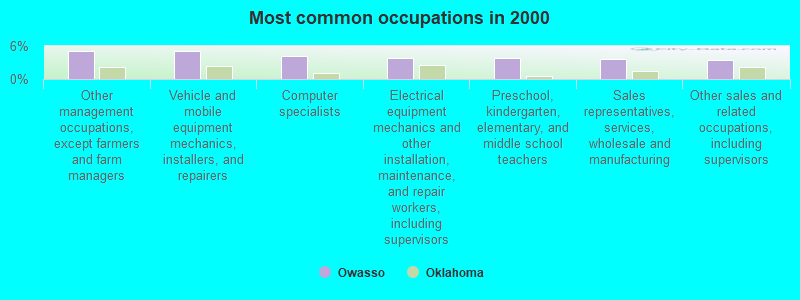
- Other management occupations, except farmers and farm managers (5.1%)
- Vehicle and mobile equipment mechanics, installers, and repairers (5.0%)
- Computer specialists (4.1%)
- Electrical equipment mechanics and other installation, maintenance, and repair workers, including supervisors (3.9%)
- Preschool, kindergarten, elementary, and middle school teachers (3.9%)
- Sales representatives, services, wholesale and manufacturing (3.7%)
- Other sales and related occupations, including supervisors (3.5%)
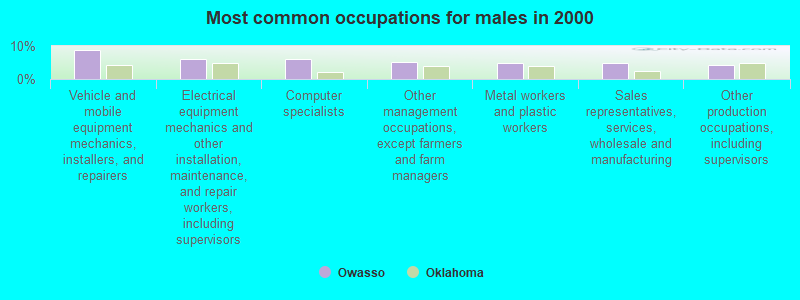
- Vehicle and mobile equipment mechanics, installers, and repairers (8.9%)
- Electrical equipment mechanics and other installation, maintenance, and repair workers, including supervisors (6.1%)
- Computer specialists (5.9%)
- Other management occupations, except farmers and farm managers (5.1%)
- Metal workers and plastic workers (4.9%)
- Sales representatives, services, wholesale and manufacturing (4.7%)
- Other production occupations, including supervisors (4.2%)
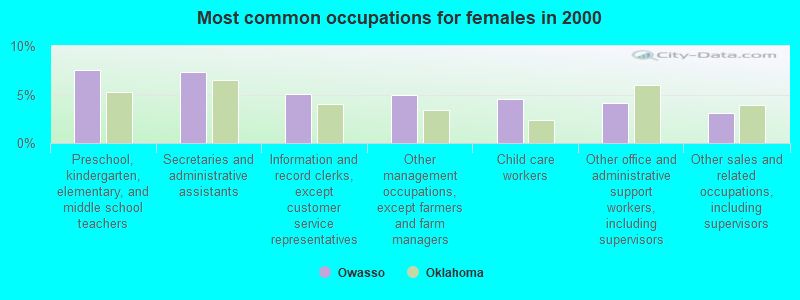
- Preschool, kindergarten, elementary, and middle school teachers (7.5%)
- Secretaries and administrative assistants (7.4%)
- Information and record clerks, except customer service representatives (5.1%)
- Other management occupations, except farmers and farm managers (5.0%)
- Child care workers (4.5%)
- Other office and administrative support workers, including supervisors (4.1%)
- Other sales and related occupations, including supervisors (3.1%)
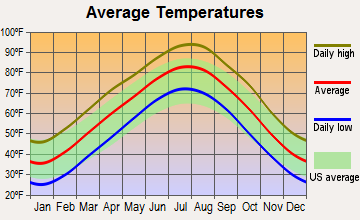
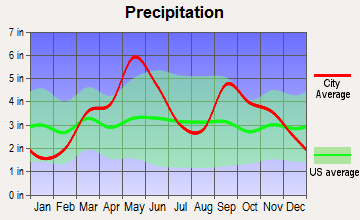
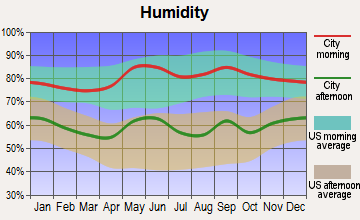
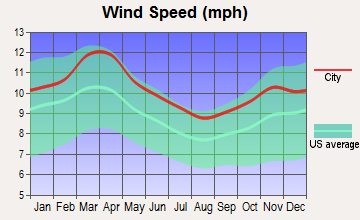
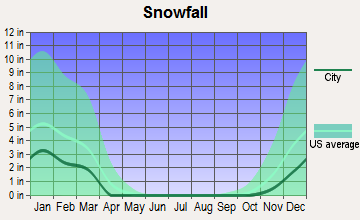
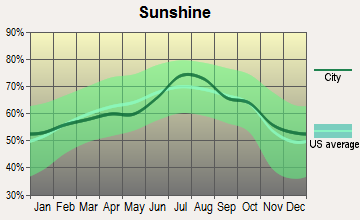
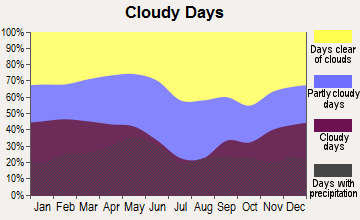
Average climate in Owasso, Oklahoma
Based on data reported by over 4,000 weather stations
|
|


(lower is better)
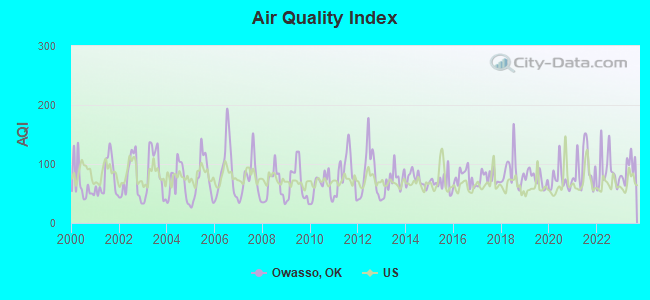
Air Quality Index (AQI) level in 2023 was 93.5. This is worse than average.
| City: | 93.5 |
| U.S.: | 72.6 |
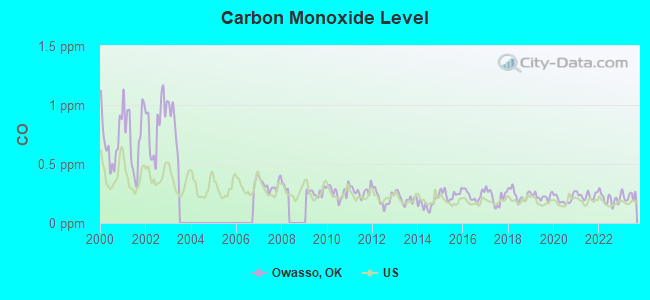
Carbon Monoxide (CO) [ppm] level in 2023 was 0.231. This is about average. Closest monitor was 10.1 miles away from the city center.
| City: | 0.231 |
| U.S.: | 0.251 |
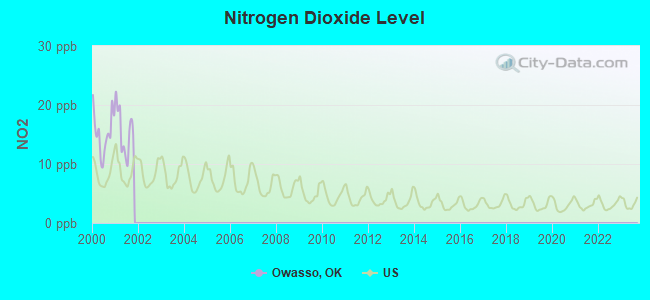
Nitrogen Dioxide (NO2) [ppb] level in 2001 was 15.5. This is significantly worse than average. Closest monitor was 9.0 miles away from the city center.
| City: | 15.5 |
| U.S.: | 5.1 |
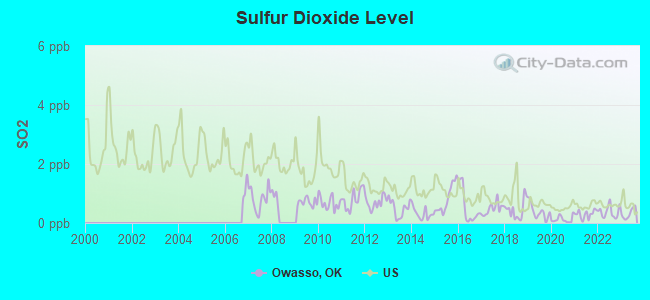
Sulfur Dioxide (SO2) [ppb] level in 2023 was 0.320. This is significantly better than average. Closest monitor was 10.1 miles away from the city center.
| City: | 0.320 |
| U.S.: | 1.515 |
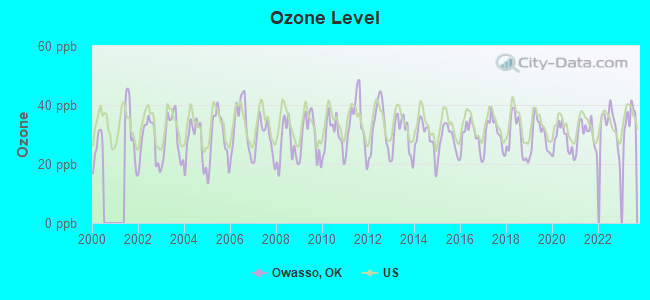
Ozone [ppb] level in 2023 was 35.5. This is about average. Closest monitor was 7.9 miles away from the city center.
| City: | 35.5 |
| U.S.: | 33.3 |
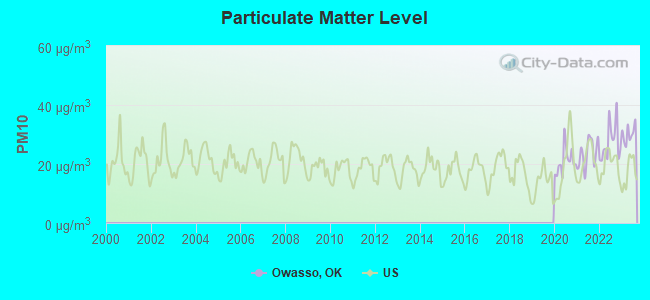
Particulate Matter (PM10) [µg/m3] level in 2023 was 30.2. This is significantly worse than average. Closest monitor was 10.1 miles away from the city center.
| City: | 30.2 |
| U.S.: | 19.2 |
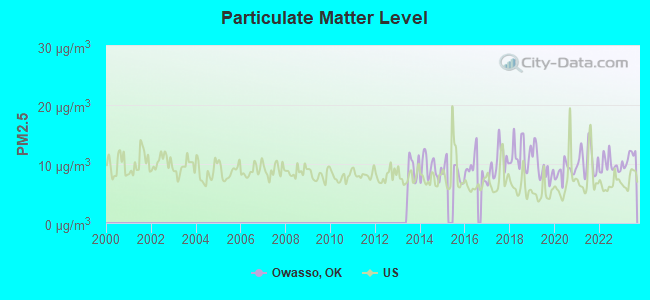
Particulate Matter (PM2.5) [µg/m3] level in 2023 was 11.0. This is worse than average. Closest monitor was 10.1 miles away from the city center.
| City: | 11.0 |
| U.S.: | 8.1 |
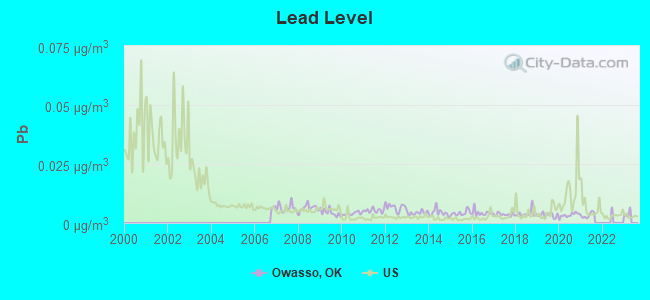
Lead (Pb) [µg/m3] level in 2021 was 0.00329. This is significantly better than average. Closest monitor was 10.1 miles away from the city center.
| City: | 0.00329 |
| U.S.: | 0.00931 |
Tornado activity:
Owasso-area historical tornado activity is near Oklahoma state average. It is 168% greater than the overall U.S. average.
On 5/5/1960, a category F5 (max. wind speeds 261-318 mph) tornado 21.4 miles away from the Owasso city center killed 5 people and injured 81 people and caused between $500,000 and $5,000,000 in damages.
On 4/24/1993, a category F4 (max. wind speeds 207-260 mph) tornado 7.6 miles away from the city center killed 7 people and injured 100 people and caused between $5,000,000 and $50,000,000 in damages.
Earthquake activity:
Owasso-area historical earthquake activity is significantly above Oklahoma state average. It is 793% greater than the overall U.S. average.On 9/3/2016 at 12:02:44, a magnitude 5.8 (5.8 MW, Depth: 3.5 mi, Class: Moderate, Intensity: VI - VII) earthquake occurred 62.0 miles away from the city center
On 11/6/2011 at 03:53:10, a magnitude 5.7 (5.7 MW, Depth: 3.2 mi) earthquake occurred 74.2 miles away from Owasso center
On 11/7/2016 at 01:44:24, a magnitude 5.0 (5.0 MW, Depth: 2.8 mi) earthquake occurred 58.2 miles away from the city center
On 11/5/2011 at 07:12:45, a magnitude 4.8 (4.8 MW, Depth: 1.9 mi, Class: Light, Intensity: IV - V) earthquake occurred 73.3 miles away from Owasso center
On 11/8/2011 at 02:46:57, a magnitude 4.8 (4.8 MW, Depth: 3.1 mi) earthquake occurred 75.1 miles away from the city center
On 2/13/2016 at 17:07:06, a magnitude 5.1 (5.1 MW, Depth: 5.2 mi) earthquake occurred 161.0 miles away from the city center
Magnitude types: moment magnitude (MW)
Natural disasters:
The number of natural disasters in Tulsa County (34) is a lot greater than the US average (15).Major Disasters (Presidential) Declared: 22
Emergencies Declared: 7
Causes of natural disasters: Storms: 15, Floods: 14, Winter Storms: 9, Tornadoes: 8, Fires: 5, Heavy Rains: 2, Winds: 2, Hurricane: 1, Ice Storm: 1, Snow: 1, Snowstorm: 1, Other: 1 (Note: some incidents may be assigned to more than one category).
Hospitals and medical centers in Owasso:
- BAILEY MEDICAL CENTER, L L C (Proprietary, provides emergency services, 10502 NORTH 110TH EAST AVENUE)
- HOSPICE OF OWASSO, INC. (202 SOUTH CEDAR, SUITE A)
- LOCAL HOSPICE, INC (11616 EAST 86TH STREET NORTH)
- ST JOHN OWASSO (Voluntary non-profit - Church, 12451 EAST 100TH STREET NORTH)
- ENTRUSTED HEARTS (7410 N 127TH E AVE)
- BAPTIST VILLAGE OF OWASSO (12600 EAST 73RD STREET NORTH)
- SEQUOYAH POINTE LIVING CENTER (8515 NORTH 123RD EAST AVENUE)
Airports located in Owasso:
- Gundys Airport (O38) (Runways: 2, Itinerant Ops: 5,000, Local Ops: 7,000)
College/University in Owasso:
Colleges/universities with over 2000 students nearest to Owasso:
- Rogers State University (about 11 miles; Claremore, OK; Full-time enrollment: 3,482)
- University of Tulsa (about 12 miles; Tulsa, OK; FT enrollment: 3,702)
- Tulsa Community College (about 14 miles; Tulsa, OK; FT enrollment: 12,480)
- Oral Roberts University (about 18 miles; Tulsa, OK; FT enrollment: 3,216)
- Oklahoma State University Institute of Technology (about 47 miles; Okmulgee, OK; FT enrollment: 3,243)
- Northeastern State University (about 55 miles; Tahlequah, OK; FT enrollment: 6,895)
- Northeastern Oklahoma A&M College (about 68 miles; Miami, OK; FT enrollment: 2,075)
Public high school in Owasso:
- OWASSO HS (Students: 1,373, Location: 12901 E 86TH ST N, Grades: 9-12)
Private high school in Owasso:
Biggest public elementary/middle schools in Owasso:
- OWASSO 6TH GRADE CTR (Students: 669, Location: 8101 N 129TH E AVE, Grades: 6)
- OWASSO 7TH GRADE CTR (Students: 650, Location: 1400 N MAIN, Grades: 7)
- OWASSO 8TH GRADE CTR (Students: 634, Location: 13901 E 86TH ST N, Grades: 8)
- PAMELA HODSON ES (Students: 605, Location: 14500 E 86TH ST N, Grades: PK-5)
- LARKIN BAILEY ES (Students: 600, Location: 10221 E 96TH ST N, Grades: PK-5)
- HAYWARD SMITH ES (Students: 551, Location: 12223 E 91ST ST N, Grades: PK-5)
- MILLS ES (Students: 537, Location: 8200 N 124TH E AVE, Grades: PK-5)
- BARNES ES (Students: 514, Location: 7809 E 76TH ST N, Grades: PK-5)
- NORTHEAST ES (Students: 449, Location: 13650 E 103RD ST N, Grades: PK-5)
- STONE CANYON ES (Location: 7305 N 177TH E AVE, Grades: PK-5)
Points of interest:
Notable locations in Owasso: Owasso Fire Department Station 3 (A), Limestone Fire Protection District Station 3 (B), Limestone Fire Protection District Station 2 (C), Owasso Fire Department Station 2 (D), Mercy Regional of Oklahoma (E), Owasso Fire Department Station 1 (F), Mary Glass Performing Arts Center (G), Limestone Fire Protection District Station 1 (H). Display/hide their locations on the map
Shopping Centers: Three Lakes Shopping Center (1), Echelon Shopping Center (2). Display/hide their locations on the map
Church in Owasso: Brethren Church (A). Display/hide its location on the map
Cemeteries: Fairview Cemetery (1), Blakemore Cemetery (2), Sand Ridge Cemetery (3). Display/hide their locations on the map
Reservoirs: Oknoname 131002 Reservoir (A), Oknoname 131001 Reservoir (B), Oknoname 143019 Reservoir (C), Oknoname 131009 Reservoir (D), Owasso Lake (E). Display/hide their locations on the map
Creeks: Honey Creek (A), Boggy Creek (B), Ranch Creek (C). Display/hide their locations on the map
Hotels: Best Western Owasso Inn (7653 North Owasso Expressway) (1), Best Western (7653 North Owasso Expressway) (2). Display/hide their approximate locations on the map
Court: Owasso-City - Court Clerk Municipal (111 North Main Street) (1). Display/hide its approximate location on the map
Birthplace of: Dylan Bundy - Baseball player, Vic Koenning - Football player and coach, Richard Hardman - College basketball player (Arkansas LR Trojans), Tommy Allsup - Rockabilly guitarist.
| This city: | 2.7 people |
| Oklahoma: | 2.5 people |
| This city: | 73.0% |
| Whole state: | 66.8% |
| This city: | 4.9% |
| Whole state: | 5.9% |
Likely homosexual households (counted as self-reported same-sex unmarried-partner households)
- Lesbian couples: 0.4% of all households
- Gay men: 0.2% of all households
People in group quarters in Owasso in 2010:
- 173 people in nursing facilities/skilled-nursing facilities
- 41 people in group homes for juveniles (non-correctional)
- 28 people in workers' group living quarters and job corps centers
76 people in other noninstitutional group quarters in 2000
Banks with most branches in Owasso (2011 data):
- BOKF, National Association: South Owasso Reasor's Branch, North Owasso Reasor's Branch, 96th & Garnett Owasso Branch. Info updated 2012/02/28: Bank assets: $25,360.0 mil, Deposits: $19,171.3 mil, headquarters in Tulsa, OK, positive income, Commercial Lending Specialization, 189 total offices, Holding Company: Bok Financial Corporation
- First Bank of Owasso: First Bank Of Owasso, Garnett Road Branch, East Side Branch. Info updated 2009/11/23: Bank assets: $204.4 mil, Deposits: $180.5 mil, local headquarters, positive income, Commercial Lending Specialization, 3 total offices
- RCB Bank: 96th Street Branch at 12200 E. 96th Street, branch established on 2001/05/10; Owasso Branch at 11633 East 86th Street, North, branch established on 1980/06/30. Info updated 2011/06/21: Bank assets: $1,997.6 mil, Deposits: $1,697.9 mil, headquarters in Claremore, OK, positive income, Commercial Lending Specialization, 30 total offices, Holding Company: Rcb Holding Company, Inc.
- Arvest Bank: 76th Street North Branch at 11501 East 76th Street North, branch established on 2003/09/15; Owasso Supercenter Branch at 12101 E 96th N, branch established on 1998/08/31. Info updated 2010/11/29: Bank assets: $12,520.8 mil, Deposits: $10,446.2 mil, headquarters in Fayetteville, AR, positive income, Commercial Lending Specialization, 241 total offices, Holding Company: Arvest Bank Group, Inc.
- The F&M Bank & Trust Company: Owasso Branch at 12400 E. 96th Street, branch established on 2003/04/28. Info updated 2006/11/03: Bank assets: $2,013.0 mil, Deposits: $1,805.5 mil, headquarters in Tulsa, OK, negative income in the last year, Commercial Lending Specialization, 11 total offices, Holding Company: One Rich Hill Land Ltd. Partnership
- The Exchange Bank: , Owasso at 9701 East 86th St., N., branch established on 2002/08/05. Info updated 2006/11/03: Bank assets: $91.7 mil, Deposits: $81.4 mil, headquarters in Skiatook, OK, positive income, 3 total offices, Holding Company: Skiatook Bancshares, Inc.
- ONB Bank and Trust Company: Owasso Branch at 12502 East 96th Street North, branch established on 2003/09/29. Info updated 2008/12/22: Bank assets: $607.6 mil, Deposits: $482.0 mil, headquarters in Tulsa, OK, positive income, Commercial Lending Specialization, 11 total offices, Holding Company: Central Bancompany
- International Bank of Commerce: Bailey Ranch Branch at 9350 North Garnett Rd., branch established on 2007/04/16. Info updated 2007/03/28: Bank assets: $9,621.9 mil, Deposits: $6,548.8 mil, headquarters in Laredo, TX, positive income, Commercial Lending Specialization, 197 total offices, Holding Company: International Bancshares Corporation
- Bank of the Lakes, National Association: Bank Of The Lakes, National Association at 12401 East 86th Street North, branch established on 1976/11/01. Info updated 2006/11/03: Bank assets: $195.6 mil, Deposits: $175.5 mil, local headquarters, positive income, Commercial Lending Specialization, 7 total offices, Holding Company: Lake Bancshares Corporation
For population 15 years and over in Owasso:
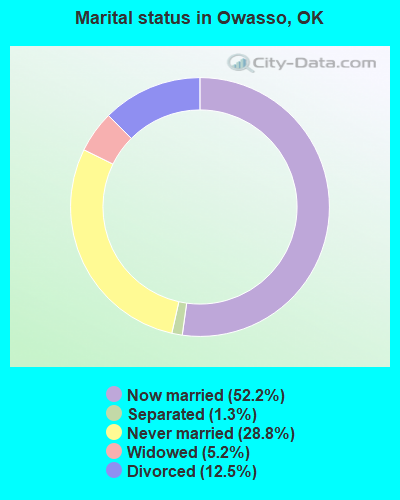
- Never married: 28.8%
- Now married: 52.2%
- Separated: 1.3%
- Widowed: 5.2%
- Divorced: 12.5%
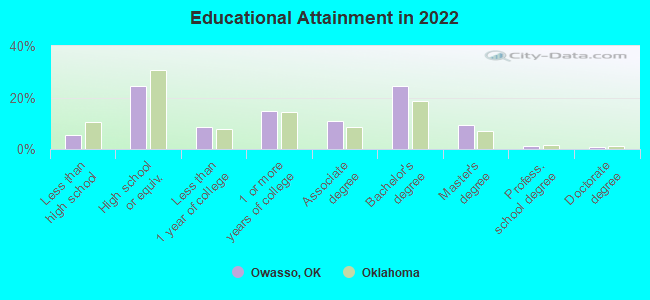
For population 25 years and over in Owasso:
- High school or higher: 94.5%
- Bachelor's degree or higher: 34.7%
- Graduate or professional degree: 10.8%
- Unemployed: 2.2%
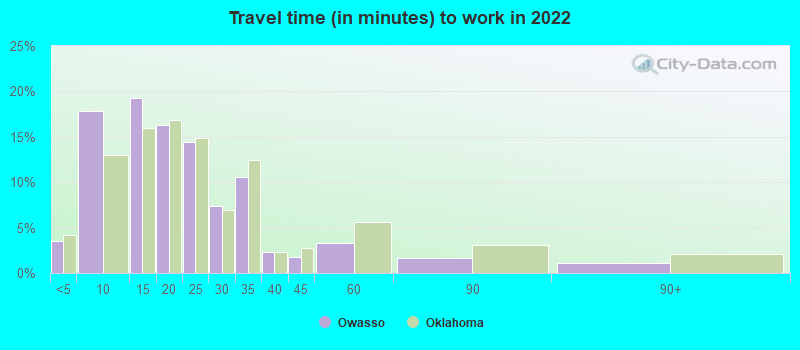
- Mean travel time to work (commute): 18.4 minutes
| Here: | 9.5 |
| Oklahoma average: | 11.3 |
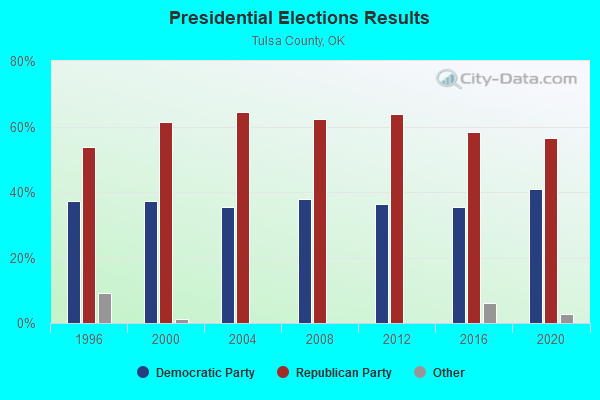
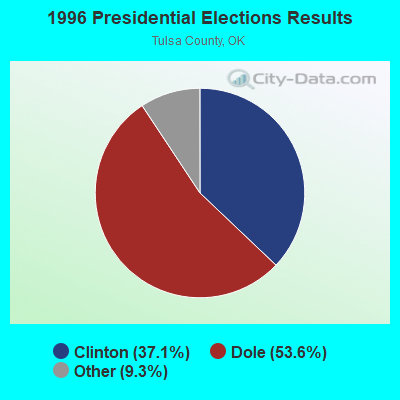
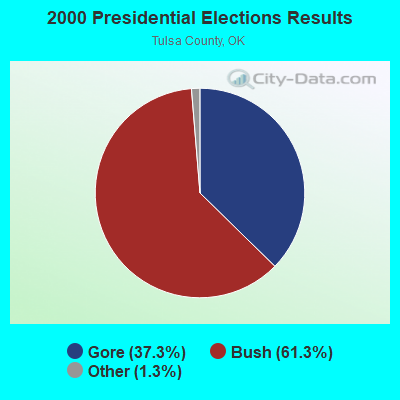

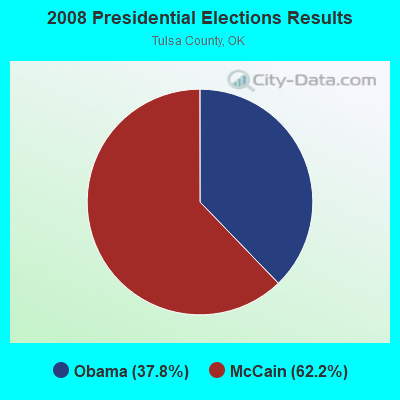
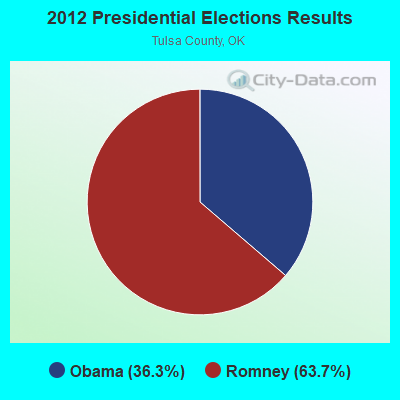
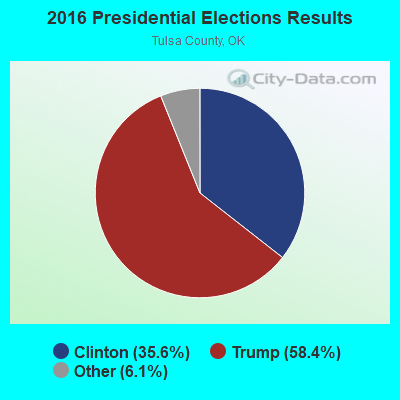
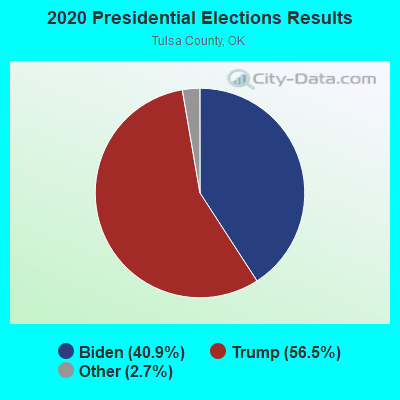
Graphs represent county-level data. Detailed 2008 Election Results
Religion statistics for Owasso, OK (based on Tulsa County data)
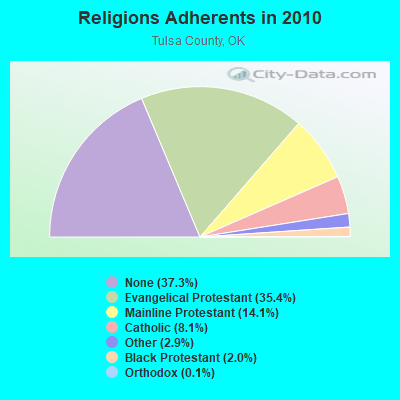
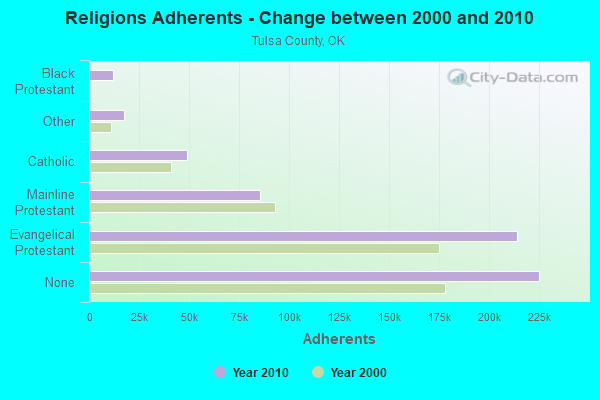
| Religion | Adherents | Congregations |
|---|---|---|
| Evangelical Protestant | 213,615 | 545 |
| Mainline Protestant | 85,250 | 103 |
| Catholic | 49,144 | 23 |
| Other | 17,310 | 49 |
| Black Protestant | 12,226 | 29 |
| Orthodox | 778 | 5 |
| None | 225,080 | - |
Food Environment Statistics:
| Tulsa County: | 1.51 / 10,000 pop. |
| State: | 1.97 / 10,000 pop. |
| Tulsa County: | 0.15 / 10,000 pop. |
| Oklahoma: | 0.20 / 10,000 pop. |
| Here: | 0.51 / 10,000 pop. |
| State: | 0.76 / 10,000 pop. |
| Tulsa County: | 2.84 / 10,000 pop. |
| Oklahoma: | 4.35 / 10,000 pop. |
| Tulsa County: | 8.37 / 10,000 pop. |
| State: | 6.89 / 10,000 pop. |
| Tulsa County: | 9.4% |
| Oklahoma: | 10.3% |
| This county: | 27.3% |
| State: | 29.2% |
Health and Nutrition:
| Owasso: | 48.8% |
| Oklahoma: | 48.6% |
| Owasso: | 46.0% |
| Oklahoma: | 45.2% |
| Here: | 28.7 |
| State: | 28.7 |
| Owasso: | 21.2% |
| Oklahoma: | 21.4% |
| Here: | 10.2% |
| Oklahoma: | 10.8% |
| This city: | 6.8 |
| State: | 6.8 |
| This city: | 33.7% |
| State: | 33.9% |
| Here: | 56.7% |
| Oklahoma: | 55.2% |
| Owasso: | 79.9% |
| Oklahoma: | 78.4% |
More about Health and Nutrition of Owasso, OK Residents
| Local government employment and payroll (March 2022) | |||||
| Function | Full-time employees | Monthly full-time payroll | Average yearly full-time wage | Part-time employees | Monthly part-time payroll |
|---|---|---|---|---|---|
| Firefighters | 64 | $442,262 | $82,924 | 0 | $0 |
| Police Protection - Officers | 63 | $402,703 | $76,705 | 0 | $0 |
| Other Government Administration | 22 | $140,446 | $76,607 | 1 | $350 |
| Sewerage | 22 | $83,213 | $45,389 | 0 | $0 |
| Streets and Highways | 21 | $102,865 | $58,780 | 0 | $0 |
| Police - Other | 20 | $90,000 | $54,000 | 3 | $3,658 |
| Parks and Recreation | 19 | $76,014 | $48,009 | 16 | $14,539 |
| Financial Administration | 17 | $94,515 | $66,716 | 0 | $0 |
| Other and Unallocable | 14 | $75,142 | $64,407 | 2 | $3,266 |
| Solid Waste Management | 10 | $39,153 | $46,984 | 0 | $0 |
| Water Supply | 9 | $40,404 | $53,872 | 0 | $0 |
| Judicial and Legal | 2 | $7,801 | $46,806 | 2 | $4,736 |
| Fire - Other | 1 | $4,256 | $51,072 | 2 | $2,214 |
| Welfare | 1 | $4,823 | $57,876 | 9 | $19,503 |
| Totals for Government | 285 | $1,603,595 | $67,520 | 35 | $48,267 |
Owasso government finances - Expenditure in 2021 (per resident):
- Construction - Regular Highways: $8,656,000 ($220.10)
Sewerage: $1,873,000 ($47.63)
Parks and Recreation: $384,000 ($9.76)
- Current Operations - Police Protection: $10,054,000 ($255.64)
Local Fire Protection: $7,226,000 ($183.74)
Water Utilities: $4,750,000 ($120.78)
Sewerage: $3,043,000 ($77.37)
Central Staff Services: $2,925,000 ($74.37)
Parks and Recreation: $2,723,000 ($69.24)
General - Other: $2,053,000 ($52.20)
Health - Other: $1,990,000 ($50.60)
Regular Highways: $1,707,000 ($43.40)
Solid Waste Management: $1,482,000 ($37.68)
Housing and Community Development: $1,386,000 ($35.24)
Financial Administration: $891,000 ($22.66)
Judicial and Legal Services: $308,000 ($7.83)
Miscellaneous Commercial Activities - Other: $262,000 ($6.66)
- General - Interest on Debt: $2,173,000 ($55.25)
- Other Capital Outlay - Sewerage: $2,463,000 ($62.63)
Local Fire Protection: $716,000 ($18.21)
Police Protection: $610,000 ($15.51)
Health - Other: $277,000 ($7.04)
Regular Highways: $272,000 ($6.92)
Central Staff Services: $155,000 ($3.94)
Parks and Recreation: $140,000 ($3.56)
General - Other: $140,000 ($3.56)
Housing and Community Development: $90,000 ($2.29)
Water Utilities: $41,000 ($1.04)
- Total Salaries and Wages: $29,232,000 ($743.29)
Owasso government finances - Revenue in 2021 (per resident):
- Charges - Sewerage: $7,441,000 ($189.20)
Other: $3,093,000 ($78.65)
Solid Waste Management: $2,609,000 ($66.34)
Parks and Recreation: $828,000 ($21.05)
Miscellaneous Commercial Activities: $18,000 ($0.46)
- Federal Intergovernmental - Other: $816,000 ($20.75)
Highways: $75,000 ($1.91)
- Local Intergovernmental - Other: $289,000 ($7.35)
- Miscellaneous - Fines and Forfeits: $450,000 ($11.44)
Donations From Private Sources: $431,000 ($10.96)
Interest Earnings: $208,000 ($5.29)
General Revenue - Other: $161,000 ($4.09)
Sale of Property: $113,000 ($2.87)
Rents: $33,000 ($0.84)
- Revenue - Water Utilities: $7,633,000 ($194.09)
- State Intergovernmental - Other: $2,836,000 ($72.11)
General Local Government Support: $459,000 ($11.67)
Highways: $334,000 ($8.49)
Housing and Community Development: $276,000 ($7.02)
- Tax - General Sales and Gross Receipts: $43,825,000 ($1114.35)
Public Utilities Sales: $1,110,000 ($28.22)
Other Selective Sales: $467,000 ($11.87)
Other License: $440,000 ($11.19)
Property: $283,000 ($7.20)
Other: $112,000 ($2.85)
Owasso government finances - Debt in 2021 (per resident):
- Long Term Debt - Beginning Outstanding - Unspecified Public Purpose: $74,240,000 ($1887.71)
Outstanding Unspecified Public Purpose: $68,779,000 ($1748.86)
Retired Unspecified Public Purpose: $5,461,000 ($138.86)
Owasso government finances - Cash and Securities in 2021 (per resident):
- Bond Funds - Cash and Securities: $6,674,000 ($169.70)
- Other Funds - Cash and Securities: $53,405,000 ($1357.94)
- Sinking Funds - Cash and Securities: $25,008,000 ($635.88)
6.72% of this county's 2021 resident taxpayers lived in other counties in 2020 ($57,121 average adjusted gross income)
| Here: | 6.72% |
| Oklahoma average: | 8.28% |
0.01% of residents moved from foreign countries ($143 average AGI)
Tulsa County: 0.01% Oklahoma average: 0.04%
Top counties from which taxpayers relocated into this county between 2020 and 2021:
| from Wagoner County, OK | |
| from Rogers County, OK | |
| from Creek County, OK |
6.70% of this county's 2020 resident taxpayers moved to other counties in 2021 ($60,995 average adjusted gross income)
| Here: | 6.70% |
| Oklahoma average: | 7.66% |
0.01% of residents moved to foreign countries ($93 average AGI)
Tulsa County: 0.01% Oklahoma average: 0.03%
Top counties to which taxpayers relocated from this county between 2020 and 2021:
| to Wagoner County, OK | |
| to Rogers County, OK | |
| to Creek County, OK |
| Businesses in Owasso, OK | ||||
| Name | Count | Name | Count | |
|---|---|---|---|---|
| AT&T | 1 | Marriott | 1 | |
| Advance Auto Parts | 1 | Maurices | 1 | |
| Applebee's | 1 | McDonald's | 2 | |
| Arby's | 1 | Men's Wearhouse | 1 | |
| AutoZone | 1 | Nike | 4 | |
| Bath & Body Works | 1 | Office Depot | 1 | |
| Best Western | 1 | Old Navy | 1 | |
| Blockbuster | 1 | Olive Garden | 1 | |
| CVS | 1 | Panera Bread | 1 | |
| Carl\s Jr. | 1 | Papa John's Pizza | 1 | |
| Chevrolet | 1 | Payless | 1 | |
| Chick-Fil-A | 1 | PetSmart | 1 | |
| Church's Chicken | 1 | Pier 1 Imports | 1 | |
| Cracker Barrel | 1 | Pizza Hut | 1 | |
| Cricket Wireless | 1 | Quiznos | 1 | |
| Curves | 1 | RadioShack | 1 | |
| Domino's Pizza | 1 | Red Robin | 1 | |
| DressBarn | 1 | Ruby Tuesday | 1 | |
| Famous Footwear | 1 | Rue21 | 1 | |
| Fashion Bug | 1 | SONIC Drive-In | 2 | |
| FedEx | 6 | Sephora | 1 | |
| GNC | 1 | Shoe Carnival | 1 | |
| GameStop | 1 | Sprint Nextel | 1 | |
| Goodwill | 1 | Starbucks | 2 | |
| H&R Block | 2 | Subway | 4 | |
| Hilton | 1 | T-Mobile | 3 | |
| Hobby Lobby | 1 | T.J.Maxx | 1 | |
| Holiday Inn | 2 | Taco Bell | 1 | |
| Home Depot | 1 | Target | 1 | |
| IHOP | 1 | U-Haul | 6 | |
| JCPenney | 1 | UPS | 6 | |
| Jamba Juice | 1 | Vans | 1 | |
| Jones New York | 1 | Verizon Wireless | 2 | |
| Justice | 1 | Waffle House | 1 | |
| KFC | 1 | Walgreens | 1 | |
| Kohl's | 1 | Walmart | 2 | |
| Lane Bryant | 1 | Wendy's | 1 | |
| Lowe's | 1 | YMCA | 1 | |
Strongest AM radio stations in Owasso:
- KFAQ (1170 AM; 50 kW; TULSA, OK; Owner: JOURNAL BROADCAST CORPORATION)
- KTBZ (1430 AM; 25 kW; TULSA, OK; Owner: CLEAR CHANNEL BROADCASTING LICENSES, INC.)
- KMUS (1380 AM; 20 kW; MUSKOGEE, OK; Owner: ABC, INC.)
- KRMG (740 AM; 50 kW; TULSA, OK; Owner: CXR HOLDINGS, INC.)
- KCFO (970 AM; 2 kW; TULSA, OK; Owner: FRIENDSHIP BROADCASTING, L. P.)
- KAKC (1300 AM; 5 kW; TULSA, OK; Owner: CLEAR CHANNEL BROADCASTING LICENSES, INC.)
- KRVT (1270 AM; 1 kW; CLAREMORE, OK; Owner: REUNION BROADCASTING, L.L.C.)
- KXTD (1530 AM; daytime; 5 kW; WAGONER, OK; Owner: GAYTAN-GALVAN LIMITED LIABILITY COMP)
- KGTO (1050 AM; 1 kW; TULSA, OK; Owner: KJMM, INC.)
- KGGF (690 AM; 10 kW; COFFEYVILLE, KS; Owner: KGGF-KUSN, INC.)
- KYAL (1550 AM; 2 kW; SAPULPA, OK; Owner: KXOJ, INC.)
- KOMA (1520 AM; 50 kW; OKLAHOMA CITY, OK; Owner: RENDA BROADCASTING CORP. OF NEVADA)
- KTFX (1340 AM; 1 kW; SAND SPRINGS, OK; Owner: K95.5, INC.)
Strongest FM radio stations in Owasso:
- KTBT (101.5 FM; COLLINSVILLE, OK; Owner: CLEAR CHANNEL BROADCASTING LICENSES, INC.)
- KMOD-FM (97.5 FM; TULSA, OK; Owner: CLEAR CHANNEL BROADCASTING LICENSES, INC.)
- KRAV-FM (96.5 FM; TULSA, OK; Owner: CXR HOLDINGS, INC.)
- KWEN (95.5 FM; TULSA, OK; Owner: CXR HOLDINGS, INC.)
- KBEZ (92.9 FM; TULSA, OK; Owner: RENDA BROADCASTING CORP. OF NEVADA)
- KVOO-FM (98.5 FM; TULSA, OK; Owner: JOURNAL BROADCAST CORPORATION)
- KNYD (90.5 FM; BROKEN ARROW, OK; Owner: CREATIVE EDUCATIONAL MEDIA CORP. INC)
- KQLL-FM (106.1 FM; OWASSO, OK; Owner: CLEAR CHANNEL BROADCASTING LICENSES, INC.)
- KJSR (103.3 FM; TULSA, OK; Owner: CXR HOLDINGS, INC.)
- KMYZ-FM (104.5 FM; PRYOR, OK; Owner: SHAMROCK COMMUNICATIONS, INC.)
- KWGS (89.5 FM; TULSA, OK; Owner: THE UNIVERSITY OF TULSA)
- KJMM (105.3 FM; BIXBY, OK; Owner: KJMM, INC.)
- KRSC-FM (91.3 FM; CLAREMORE, OK; Owner: BOARD OF REGENTS OF OKLAHOMA COLLEGES)
- KIZS (92.1 FM; BROKEN ARROW, OK; Owner: CLEAR CHANNEL BROADCASTING LICENSES, INC.)
- KRTQ (102.3 FM; SAND SPRINGS, OK; Owner: CXR HOLDINGS, INC.)
- KHTT (106.9 FM; MUSKOGEE, OK; Owner: RENDA BROADCASTING CORP. OF NEVADA)
- KXBL (99.5 FM; HENRYETTA, OK; Owner: JOURNAL BROADCAST CORPORATION)
- KTSO (94.1 FM; OKMULGEE, OK; Owner: SHAMROCK COMMUNICATIONS, INC)
- KTFR (100.7 FM; CHELSEA, OK; Owner: MICHAEL P. STEPHENS)
- KXOJ-FM (100.9 FM; SAPULPA, OK; Owner: KXOJ, INC.)
TV broadcast stations around Owasso:
- KJRH (Channel 2; TULSA, OK; Owner: SCRIPPS HOWARD BROADCASTING COMPANY)
- KOED-TV (Channel 11; TULSA, OK; Owner: OKLAHOMA EDUCATIONAL TELEVISION AUTHORITY)
- KOTV (Channel 6; TULSA, OK; Owner: GRIFFIN LICENSING, L.L.C.)
- KDOR (Channel 17; BARTLESVILLE, OK; Owner: TRINITY BROADCASTING NETWORK)
- KTUL (Channel 8; TULSA, OK; Owner: KTUL, LLC)
- KWHB (Channel 47; TULSA, OK; Owner: LESEA BROADCASTING CORPORATION)
- KRSC-TV (Channel 35; CLAREMORE, OK; Owner: BOARD OF REGENTS OF OKLAHOMA COLLEGES)
- KTFO (Channel 41; TULSA, OK; Owner: CLEAR CHANNEL BROADCASTING LICENSES, INC.)
- KOKI-TV (Channel 23; TULSA, OK; Owner: CLEAR CHANNEL BROADCASTING LICENSES, INC.)
- K39CW (Channel 39; TULSA, OK; Owner: VENTANA TELEVISION, INC.)
- KTZT-LP (Channel 29; TULSA, OK; Owner: ARACELIS ORTIZ, EXECUTRIX OF THE ESTATE OF CARLOS ORTIZ)
- KOPE-LP (Channel 51; TULSA, OK; Owner: COPELAND BROADCASTING CORPORATION)
- KLOT-LP (Channel 25; TULSA, OK; Owner: EQUITY BROADCASTING CORPORATION)
- KGEB (Channel 53; TULSA, OK; Owner: UNIVERSITY BROADCASTING, INC.)
- KTPX (Channel 44; OKMULGEE, OK; Owner: PAXSON TULSA LICENSE, INC.)
- K69GO (Channel 69; TULSA, OK; Owner: THREE ANGELS BROADCASTING NETWORK)
- K04NZ (Channel 4; TULSA, OK; Owner: GERALD BROTHERS)
- KWBT (Channel 19; MUSKOGEE, OK; Owner: TULSA COMMUNICATIONS, L.L.C.)
- K33EK (Channel 33; TULSA, OK; Owner: LOCKE SUPPLY CO.)
- National Bridge Inventory (NBI) Statistics
- 65Number of bridges
- 495ft / 151mTotal length
- $62,865,000Total costs
- 477,177Total average daily traffic
- 37,571Total average daily truck traffic
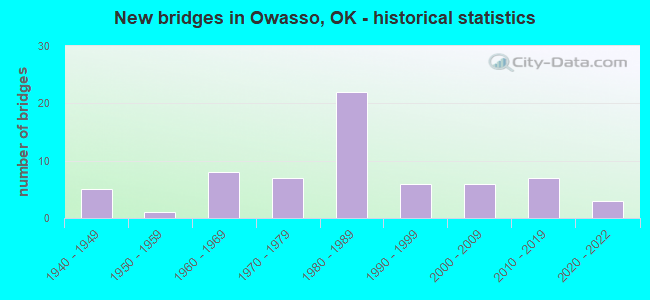
- New bridges - historical statistics
- 51940-1949
- 11950-1959
- 81960-1969
- 71970-1979
- 221980-1989
- 61990-1999
- 62000-2009
- 72010-2019
- 32020-2022
FCC Registered Antenna Towers: 115 (See the full list of FCC Registered Antenna Towers)
FCC Registered Private Land Mobile Towers: 1 (See the full list of FCC Registered Private Land Mobile Towers in Owasso, OK)
FCC Registered Broadcast Land Mobile Towers: 25 (See the full list of FCC Registered Broadcast Land Mobile Towers)
FCC Registered Microwave Towers: 17 (See the full list of FCC Registered Microwave Towers in this town)
FCC Registered Amateur Radio Licenses: 304 (See the full list of FCC Registered Amateur Radio Licenses in Owasso)
FAA Registered Aircraft Manufacturers and Dealers: 2 (See the full list of FAA Registered Manufacturers and Dealers in Owasso)
FAA Registered Aircraft: 180 (See the full list of FAA Registered Aircraft)
| Home Mortgage Disclosure Act Aggregated Statistics For Year 2009 (Based on 1 full and 4 partial tracts) | ||||||||||||||
| A) FHA, FSA/RHS & VA Home Purchase Loans | B) Conventional Home Purchase Loans | C) Refinancings | D) Home Improvement Loans | E) Loans on Dwellings For 5+ Families | F) Non-occupant Loans on < 5 Family Dwellings (A B C & D) | G) Loans On Manufactured Home Dwelling (A B C & D) | ||||||||
|---|---|---|---|---|---|---|---|---|---|---|---|---|---|---|
| Number | Average Value | Number | Average Value | Number | Average Value | Number | Average Value | Number | Average Value | Number | Average Value | Number | Average Value | |
| LOANS ORIGINATED | 280 | $145,513 | 120 | $137,584 | 442 | $138,510 | 53 | $49,982 | 2 | $5,970,765 | 39 | $88,968 | 8 | $14,985 |
| APPLICATIONS APPROVED, NOT ACCEPTED | 13 | $134,788 | 12 | $141,811 | 41 | $136,902 | 3 | $108,353 | 0 | $0 | 5 | $87,664 | 2 | $32,830 |
| APPLICATIONS DENIED | 30 | $141,323 | 14 | $111,771 | 146 | $133,538 | 22 | $39,303 | 0 | $0 | 13 | $79,506 | 4 | $83,162 |
| APPLICATIONS WITHDRAWN | 20 | $133,666 | 16 | $160,137 | 127 | $146,028 | 4 | $52,845 | 0 | $0 | 2 | $117,000 | 1 | $66,910 |
| FILES CLOSED FOR INCOMPLETENESS | 4 | $138,345 | 3 | $251,077 | 32 | $155,340 | 1 | $276,680 | 0 | $0 | 0 | $0 | 0 | $0 |
Detailed HMDA statistics for the following Tracts: 0058.01 , 0058.04, 0058.05, 0058.06, 0504.04
| Private Mortgage Insurance Companies Aggregated Statistics For Year 2009 (Based on 1 full and 4 partial tracts) | ||||
| A) Conventional Home Purchase Loans | B) Refinancings | |||
|---|---|---|---|---|
| Number | Average Value | Number | Average Value | |
| LOANS ORIGINATED | 18 | $192,683 | 27 | $169,483 |
| APPLICATIONS APPROVED, NOT ACCEPTED | 5 | $276,308 | 6 | $175,652 |
| APPLICATIONS DENIED | 1 | $202,290 | 4 | $263,258 |
| APPLICATIONS WITHDRAWN | 3 | $134,410 | 2 | $194,735 |
| FILES CLOSED FOR INCOMPLETENESS | 0 | $0 | 0 | $0 |
Detailed PMIC statistics for the following Tracts: 0058.01 , 0058.04, 0058.05, 0058.06, 0504.04
2002 - 2018 National Fire Incident Reporting System (NFIRS) incidents
- Fire incident types reported to NFIRS in Owasso, OK
- 93749.8%Outside Fires
- 52928.1%Structure Fires
- 32217.1%Mobile Property/Vehicle Fires
- 924.9%Other
 Based on the data from the years 2002 - 2018 the average number of fires per year is 111. The highest number of reported fires - 191 took place in 2006, and the least - 9 in 2010. The data has a rising trend.
 When looking into fire subcategories, the most incidents belonged to: Outside Fires (49.8%), and Structure Fires (28.1%).
Fire-safe hotels and motels in Owasso, Oklahoma:
- Quality Inn and Suites Owasso, 7653 N Owasso Expy, Owasso, Oklahoma 74055 , Phone: (918) 272-2000, Fax: (918) 272-6664
- Candlewood Suites, Owasso, Oklahoma, 11699 E 96th Street N, Owasso, Oklahoma 74055 , Phone: (918) 272-4334, Fax: (918) 272-4339
- Hampton Inn & Suites, 9009 N 121st E Ave, Owasso, Oklahoma 74055 , Phone: (918) 609-6700, Fax: (918) 609-6707
- Holiday Inn Express, 7551 N Owasso Expy, Owasso, Oklahoma 74055 , Phone: (918) 274-4100, Fax: (918) 274-9799
- Super8 Owasso, 11604 E 76st N, Owasso, Oklahoma 74055 , Phone: (918) 609-6828, Fax: (918) 609-6862
- La Quinta Inn & Suites, 8949 N Garnett, Owasso, Oklahoma 74055 , Phone: (918) 376-4447
- Home 2 Suite by Hilton - Owasso, 8882 N Garnett Rd, Owasso, Oklahoma 74055 , Phone: (800) 774-1500, Fax: (918) 609-6801
- Holiday Inn Express Tulsa Northeast/Owasso, 9321 N Owasso Expy, Owasso, Oklahoma 74055 , Phone: (918) 376-4415
| Most common first names in Owasso, OK among deceased individuals | ||
| Name | Count | Lived (average) |
|---|---|---|
| Mary | 76 | 78.2 years |
| James | 75 | 71.4 years |
| William | 54 | 77.3 years |
| John | 53 | 76.5 years |
| Robert | 47 | 73.1 years |
| Helen | 37 | 82.7 years |
| Dorothy | 37 | 79.7 years |
| Charles | 36 | 70.7 years |
| Betty | 36 | 74.5 years |
| George | 30 | 72.3 years |
| Most common last names in Owasso, OK among deceased individuals | ||
| Last name | Count | Lived (average) |
|---|---|---|
| Smith | 40 | 76.2 years |
| Brown | 31 | 79.5 years |
| Johnson | 30 | 74.5 years |
| Wilson | 28 | 77.6 years |
| Williams | 26 | 79.0 years |
| Jones | 25 | 72.0 years |
| Richardson | 17 | 80.6 years |
| Roberts | 16 | 81.0 years |
| Baker | 15 | 77.1 years |
| Hall | 14 | 74.3 years |
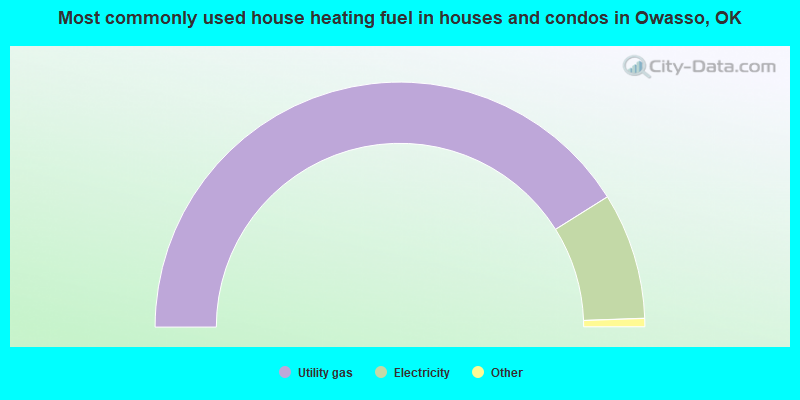
- 82.1%Utility gas
- 16.7%Electricity
- 0.8%Bottled, tank, or LP gas
- 0.1%Fuel oil, kerosene, etc.
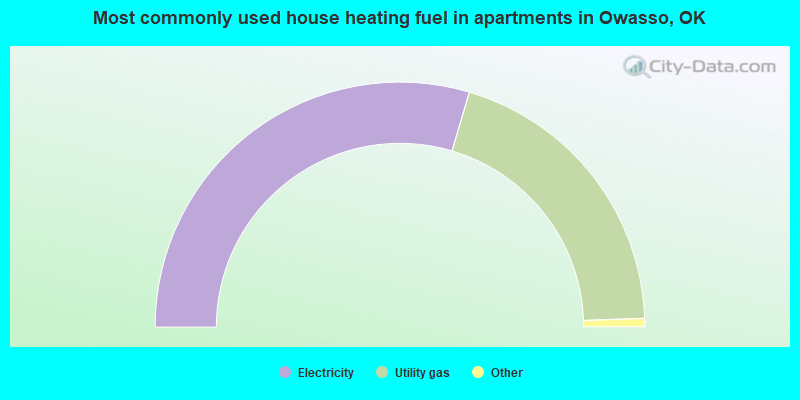
- 59.1%Electricity
- 39.7%Utility gas
- 0.9%Bottled, tank, or LP gas
- 0.2%Wood
Owasso compared to Oklahoma state average:
- Unemployed percentage significantly below state average.
- Median age below state average.
- Length of stay since moving in above state average.
- House age significantly below state average.
- Number of college students above state average.
- Percentage of population with a bachelor's degree or higher above state average.
Owasso on our top lists:
- #40 on the list of "Top 101 cities with largest percentage of females in industries: management of companies and enterprises (population 5,000+)"
- #74 on the list of "Top 101 cities with largest percentage of females in industries: information (population 5,000+)"
- #81 on the list of "Top 101 cities with largest percentage of females in occupations: installation, maintenance, and repair occupations (population 5,000+)"
- #99 (74117) on the list of "Top 101 zip codes with the largest percentage of United States first ancestries"
- #6 on the list of "Top 101 counties with the highest lead air pollution readings in 2012 (µg/m3)"
- #13 on the list of "Top 101 counties with the lowest percentage of residents relocating from foreign countries between 2010 and 2011 (pop. 50,000+)"
- #20 on the list of "Top 101 counties with the most Evangelical Protestant adherents"
- #22 on the list of "Top 101 counties with the most Evangelical Protestant congregations"
- #24 on the list of "Top 101 counties with the lowest lead air pollution readings in 2012 (µg/m3)"

|
|
Total of 335 patent applications in 2008-2024.